The Frankfurt-Freiburg Contrast and Acuity Test - ResearchGate
The Frankfurt-Freiburg Contrast and Acuity Test - ResearchGate
The Frankfurt-Freiburg Contrast and Acuity Test - ResearchGate

Create successful ePaper yourself
Turn your PDF publications into a flip-book with our unique Google optimized e-Paper software.
1040-5488/06/8305-0290/0 VOL. 83, NO. 5, PP. 290–298<br />
OPTOMETRY AND VISION SCIENCE<br />
Copyright © 2006 American Academy of Optometry<br />
ORIGINAL ARTICLE<br />
Measuring <strong>Contrast</strong> Sensitivity Under Different<br />
Lighting Conditions: Comparison of Three <strong>Test</strong>s<br />
JENS BÜHREN, MD, EVDOXIA TERZI, MD, MICHAEL BACH, PhD,<br />
WOLFGANG WESEMANN, PhD, <strong>and</strong> THOMAS KOHNEN, MD<br />
Department of Ophthalmology, Johann Wolfgang Goethe-University, <strong>Frankfurt</strong> am Main, Germany (JB, ET, TK), Department of<br />
Ophthalmology, University of Rochester Medical Center, Rochester, New York (JB), Department of Ophthalmology, Laboratory for<br />
Electrophysiology, University of <strong>Freiburg</strong>, <strong>Freiburg</strong> im Breisgau, Germany (MB), <strong>and</strong> College of Optometry (HFAK), Cologne,<br />
Germany (WW)<br />
ABSTRACT<br />
Purpose. <strong>The</strong> purpose of this study was to evaluate three psychophysical tests for the measurement of contrast sensitivity<br />
(CS) <strong>and</strong> disability glare (DG) at different luminance levels.<br />
Methods. In 60 eyes of 60 individuals (group 1: 20 healthy eyes of young individuals; group 2: 20 healthy eyes of elderly<br />
subjects; group 3: 20 eyes with nuclear cataract), CS with best correction was measured twice with the <strong>Frankfurt</strong>-<strong>Freiburg</strong><br />
<strong>Contrast</strong> <strong>and</strong> <strong>Acuity</strong> <strong>Test</strong> System (FF-CATS) <strong>and</strong> the Functional <strong>Acuity</strong> <strong>Contrast</strong> <strong>Test</strong> (FACT, 1.5 cycles per degree [cpd])<br />
at 167 cd/m 2 <strong>and</strong> 0.167 cd/m 2 , <strong>and</strong> with the Pelli-Robson Chart (PRC) at 100 cd/m 2 with <strong>and</strong> without glare. Repeatability<br />
of test <strong>and</strong> retest, <strong>and</strong> discriminative ability between the different subgroups, were assessed for CS values.<br />
Results. Maximum CS values varied across tests. In all groups, highest CS values were obtained with the photopic<br />
FF-CATS. For FACT scores at 1.5 cpd, there was a ceiling effect for young subjects. CS scores obtained with the PRC were<br />
the lowest. <strong>The</strong> PRC had the best test–retest repeatability of all tests. Under mesopic conditions with glare, reliability was<br />
generally lower; the FF-CATS had the highest repeatability of the mesopic tests. <strong>The</strong> FF-CATS discriminated best between<br />
the different groups for all conditions.<br />
Conclusions. <strong>The</strong>re are large discrepancies in the test results between CS testing methods, especially under different<br />
lighting conditions. Results from different CS tests are not interchangeable.<br />
(Optom Vis Sci 2006;83:290–298)<br />
Key Words: contrast sensitivity; disability glare; psychophysical test; optical quality; mesopic vision<br />
Cataract <strong>and</strong> refractive surgery have rapidly developed in the<br />
last decades. Clinical experience <strong>and</strong> experimental work has<br />
led to the insight that Snellen acuity is inadequate as a sole<br />
parameter for describing the quality of vision outcome of refractive<br />
surgical procedures. 1–7 <strong>Contrast</strong> sensitivity (CS) or low-contrast visual<br />
acuity (VA) testing will also play a role in determining the quality of<br />
vision. 8–13 A comprehensive evaluation of quality of vision requires<br />
testing under a range of lighting conditions; mesopic conditions may<br />
be more sensitive to optical changes than photopic conditions. 7,12<br />
Patients frequently report symptoms only for mesopic or scotopic<br />
conditions, whereas quality of vision under photopic conditions may<br />
be unaffected. 5,11 Many tests for CS <strong>and</strong> disability glare (DG) lack<br />
uniformity in test principles or st<strong>and</strong>ardization of lighting conditions.<br />
5,14–18 Most tests have problems that limit their use in clinical<br />
studies such as low reliability <strong>and</strong> a high probability of correct guess-<br />
Optometry <strong>and</strong> Vision Science, Vol. 83, No. 5, May 2006<br />
ing. 15,18 <strong>The</strong> variety of testing methods used in CS studies, in addition<br />
to the even greater variety of ambient <strong>and</strong> glare luminance conditions,<br />
makes it difficult to compare results between studies.<br />
For future clinical studies on quality of vision, a single test for<br />
measuring CS <strong>and</strong> DG, with st<strong>and</strong>ardized ambient <strong>and</strong> glare luminance<br />
levels that are closer to real-world conditions, is needed.<br />
<strong>Test</strong>ing should be performed under a range of lighting conditions<br />
to assess the influence of ambient luminance on quality of vision.<br />
<strong>The</strong> lack of a reliable, commercially available test that allows determination<br />
of contrast <strong>and</strong> VA thresholds under different lighting<br />
<strong>and</strong> glare conditions prompted us to construct a new test system.<br />
We chose the <strong>Freiburg</strong> <strong>Acuity</strong> <strong>and</strong> <strong>Contrast</strong> <strong>Test</strong> (FrACT) to display<br />
the stimuli. 19 It allows VA testing at defined contrast levels<br />
<strong>and</strong> CS testing at defined optotype sizes automatically <strong>and</strong> independent<br />
of the observer. Although this program has been in use
since 1993 19–22 <strong>and</strong> one recently published study reported CS <strong>and</strong><br />
glare data, 23 no critical evaluation has been performed. We constructed<br />
a laboratory setup, the <strong>Frankfurt</strong>-<strong>Freiburg</strong> <strong>Contrast</strong> <strong>and</strong><br />
<strong>Acuity</strong> <strong>Test</strong> System (FF-CATS), that provides different <strong>and</strong> st<strong>and</strong>ardized<br />
lighting <strong>and</strong> glare conditions. In a preliminary study, we<br />
showed that CS values obtained by the FF-CATS discriminate<br />
better between younger <strong>and</strong> older normal subjects than high-contrast<br />
VA values or maximum CS values obtained with the Functional<br />
<strong>Acuity</strong> <strong>Contrast</strong> <strong>Test</strong> (FACT). Moreover, there was a higher<br />
correlation between FF-CATS values <strong>and</strong> the ocular higher-order<br />
wavefront error than FACT values. 24<br />
<strong>The</strong> aim of the present study was to evaluate the FF-CATS in<br />
terms of reliability <strong>and</strong> discrimination ability. To do so, the FF-<br />
CATS was compared with two well-established clinical CS tests.<br />
Normal subjects <strong>and</strong> patients with cataract were tested with the<br />
FF-CATS with a view-in tester (CST-1800) using the FACT<br />
chart 16 for a range of lighting <strong>and</strong> glare conditions. <strong>The</strong>y were also<br />
tested with the Pelli-Robson Chart (PRC) 14 under photopic conditions<br />
with <strong>and</strong> without glare.<br />
SUBJECTS AND METHODS<br />
Subjects<br />
Sixty eyes of 60 volunteers were included in this prospective<br />
study <strong>and</strong> were divided into three groups (Table 1). In group 1<br />
(“young normals”), 20 healthy eyes of 20 volunteers with clear<br />
ocular media aged 21 to 47 years (median age, 29 years) were<br />
included. Group 2 (“elderly normals”) consisted of 20 subjects<br />
aged over 50 years (median age, 58 years; range, 50–69 years).<br />
Group 3 (“patients with cataract”) included 20 eyes of 20 patients<br />
with a senile corticonuclear cataract (median age, 68.5<br />
years; range, 50–83 years). <strong>The</strong> inclusion criteria for groups 1<br />
<strong>and</strong> 2 were best spectacle-corrected visual acuity (BSCVA) better<br />
than 20/25 visual acuity <strong>and</strong> clear ocular media. <strong>The</strong> exclusion<br />
criteria were any disease or medication that may affect<br />
visual function, as well as the mental inability to underst<strong>and</strong><br />
<strong>and</strong> perform the tests. <strong>The</strong> inclusion criteria for group 3 were<br />
BSCVA better than 20/40 <strong>and</strong> a senile, nuclear cataract (Lens<br />
Opacification Classification System [LOCS] III NO3 <strong>and</strong><br />
higher). <strong>The</strong> exclusion criteria were same as for groups 1 <strong>and</strong> 2<br />
<strong>and</strong> also the presence of any posterior subcapsular lens opacity.<br />
Manifest subjective spherocylindrical refraction was assessed<br />
using an AO type phoropter (Rodenstock; Munich, Germany)<br />
by the crosscylinder method. <strong>The</strong> end point of the manifest<br />
subjective refraction was determined with a red/green balance<br />
TABLE 1.<br />
Demographic data<br />
<strong>Contrast</strong> Sensitivity at Different Luminance Levels—Bühren et al. 291<br />
test. A r<strong>and</strong>omization scheme (BiAS statistical software package<br />
V7.06; Epsilon Verlag; Hofheim, Germany) guaranteed equal<br />
numbers for right <strong>and</strong> left eyes of each group or subgroup<br />
(Table 1). In all experiments, informed consent was obtained<br />
after the purpose <strong>and</strong> characteristics of the study were explained<br />
using an illustrated information sheet. For all study procedures,<br />
the tenets of the declaration of Helsinki were followed.<br />
<strong>Test</strong>ing Environment <strong>and</strong> <strong>Test</strong>ing Conditions<br />
All psychophysical tests of this study were performed in the same<br />
testing laboratory where st<strong>and</strong>ardized lighting conditions were ensured<br />
by blocking daylight. Fluorescent lamps (Lumilux<br />
white,[835] Osram; Munich, Germany) were used to achieve diffuse,<br />
glare-free illumination. For all mesopic testing, the lamps<br />
were turned off. Luminance <strong>and</strong> illuminance were measured with<br />
a luminance meter (LS-100; Minolta; Tokyo, Japan) <strong>and</strong> illuminance<br />
meter (Illuminance Meter; Minolta), respectively.<br />
All tests were performed monocularly with an undilated pupil<br />
<strong>and</strong> best spectacle correction using carefully cleansed trial glasses<br />
(Oculus; Wetzlar, Germany). All CS tests were done twice with an<br />
interval of at least 1 hour between the two sessions. <strong>The</strong> tests took<br />
place in two blocks: first at photopic <strong>and</strong> then, after 2 minutes of<br />
dark adaptation, at mesopic luminance conditions (Table 2). To<br />
prevent fatigue effects, the sequence of the tests in each block was<br />
determined by a r<strong>and</strong>omization scheme (BiAS V7.06). <strong>The</strong> photopic<br />
test sequence included CS measurements with the FF-CATS,<br />
the FACT <strong>and</strong> the PRC, each with <strong>and</strong> without glare. At mesopic<br />
conditions, FF-CATS <strong>and</strong> FACT testing was performed, also with<br />
<strong>and</strong> without glare.<br />
<strong>The</strong> <strong>Frankfurt</strong>-<strong>Freiburg</strong> <strong>Contrast</strong> <strong>and</strong> <strong>Acuity</strong> <strong>Test</strong><br />
System<br />
<strong>The</strong> <strong>Freiburg</strong> Visual <strong>Acuity</strong> <strong>and</strong> <strong>Contrast</strong> <strong>Test</strong> Program. <strong>The</strong><br />
FF-CATS is a psychophysical test based on the FrACT. 19 <strong>The</strong><br />
FrACT is a program that enables automatic <strong>and</strong> observer-independent<br />
determination of VA at a defined optotype contrast or<br />
CS at a specific optotype size. <strong>The</strong> FrACT uses an eight-alternative<br />
forced choice (8-AFC) <strong>and</strong> the best parameter estimation<br />
by sequential testing (PEST) algorithm for threshold determination.<br />
25 This algorithm displays a sequence of stimuli calculating<br />
the actual threshold value <strong>and</strong> each next stimulus from<br />
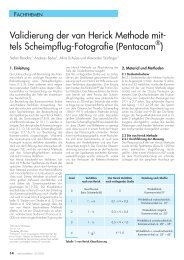
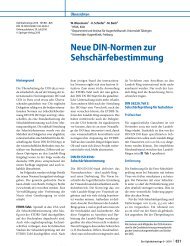
the responses given (Fig. 1).<br />
Group 1 Group 2 Group 3<br />
Age [years] 29 58 68.5<br />
median range (21–47) (50–69) (50–83)<br />
Gender 12 F, 8 M 14 F, 6 M 10 F, 10 M<br />
Eyes 10 R, 10 L 10 R, 10 L 10 R, 10 L<br />
BSCVA [logMAR] 0.25 0.1 0.16<br />
median range (0.41–0.01) (0.28–0.06) (-0.2–0.29)<br />
aGroup 1, young normal subjects; Group 2, elderly normal subjects; Group 3, patients with cataracts.<br />
BSCVA, Best spectacle corrected visual acuity.<br />
Optometry <strong>and</strong> Vision Science, Vol. 83, No. 5, May 2006
292 <strong>Contrast</strong> Sensitivity at Different Luminance Levels—Bühren et al.<br />
TABLE 2.<br />
<strong>Contrast</strong> sensitivity tests <strong>and</strong> test parameters used in the study<br />
Illuminance<br />
(lx)<br />
Luminance<br />
(cd/m2 )<br />
Maximal Possible Stimulus<br />
Range (logCS) Glare Photopic Mesopic Photopic Mesopic<br />
Display Type<br />
Glare Source<br />
<strong>Test</strong> Optotype <strong>Test</strong> Strategy<br />
8-AFC best High-resolution b/w CRT monitor 0.21–2.50 — 167 0.167 50 0.01<br />
PEST<br />
circle of eight white LEDs in 3.2° to the center 167 0.167 50 0.32<br />
26-AFC Directly illuminated wall chart 0–2.25 100 ND 50 ND<br />
FF-ACTS L<strong>and</strong>olt C 1.3 logMAR<br />
(1.5 cpd)<br />
Pelli-Robson Sloan letters 1.3 logMAR<br />
(1.5 cpd)<br />
h<strong>and</strong>held BAT wide-angle glare 11.3° 100 320<br />
3-AFC Indirectly illuminated chart in a view-in test box 1.5 cpd: 0.85–2.00 167 0.167 74 0.20<br />
3 cpd: 1.00–2.20<br />
6 cpd: 1.08–2.26<br />
12 cpd: 0.90–2.08<br />
18 cpd: 0.60–1.81<br />
inc<strong>and</strong>escent lamp 29.6°–48.5° from temporal 167 0.167 74 0.32<br />
Sine wave gratings at five<br />
spatial frequencies<br />
FACT<br />
(CST 1800)<br />
8-AFC, eight-alternative forced choice; best PEST, best parameter estimation by sequential testing; b/w CRT, black <strong>and</strong> white cathode ray tube; LED, light-emitting diode; BAT,<br />
Brightness <strong>Acuity</strong> <strong>Test</strong>er; ND, not done; cpd, cycles per degree.<br />
<strong>The</strong> <strong>Frankfurt</strong>-<strong>Freiburg</strong> <strong>Contrast</strong> <strong>and</strong> <strong>Acuity</strong> <strong>Test</strong> System.<br />
For this study, version 5.6 of the program was run on an Apple<br />
computer (iMac, OS V9.1). L<strong>and</strong>olt rings of 100 in diameter<br />
(logarithm of the minimum angle of resolution [LogMAR] equivalent<br />
1.3; dominant spatial frequency 1.5 cycles per degree [cpd])<br />
were displayed on a high-resolution 19-inch black <strong>and</strong> white cathode<br />
ray tube monitor (Richardson/Philips GD402-WBE; Amsterdam,<br />
<strong>The</strong> Netherl<strong>and</strong>s). To prevent the subject from recognizing<br />
the gap of the L<strong>and</strong>olt ring by edge detection, the ring was blurred<br />
by a small edge of 50% of the optotype contrast. <strong>The</strong> background<br />
luminance was 167 cd/m 2 <strong>and</strong> the resolution was set to 1600 <br />
1280 pixels at a repetition frequency of 72 Hz. <strong>The</strong> monitor luminance<br />
was linearized <strong>and</strong> the display format was adjusted using the<br />
calibration tools provided by the FrACT program. For investigative<br />
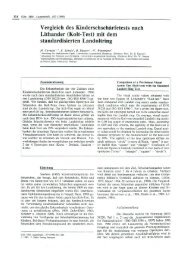
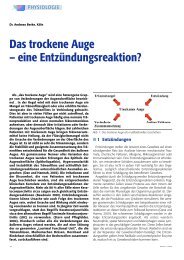
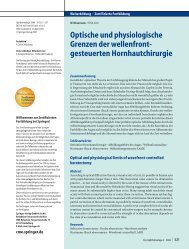
purposes, the monitor was placed in a metal box (60 60 <br />
60 cm) with a circular aperture of 20 cm in the anterior side (Fig.<br />
2). For mesopic testing (0.167 cd/m 2 ), a neutral density filter with<br />
10 3 (NG9; Schott; Mainz, Germany) was placed inside the<br />
box behind the aperture. A circle of eight white light-emitting<br />
diodes (LED, 6400 mcd, 20° full width half maximum [FWHM]<br />
angle) served as the glare source. <strong>The</strong> LEDs were displaced at a<br />
visual angle of 3.2° from the center of the L<strong>and</strong>olt ring at steps of<br />
45° providing an equal distance between each LED in respect to<br />
the eight potential positions of the L<strong>and</strong>olt gap. <strong>The</strong> illuminance<br />
of the glare source at the eye of the subject was regulated to 0.32 lx,<br />
a common value used in night vision test devices that allows maintenance<br />
of the dark-adapted state of the eye <strong>and</strong> prevents pupil<br />
constriction. 26,27 To prevent the subjects from accidentally looking<br />
into the glare source, the LEDs were flashed briefly at a reduced<br />
illuminance of 0.05 lx before the glare was switched on. <strong>The</strong> testing<br />
distance was 4 m. <strong>The</strong> subject indicated the positions of the perceived<br />
gap of the L<strong>and</strong>olt C on the computer key pad <strong>and</strong> was not<br />
given feedback on the correctness of each response. After a learning<br />
sequence to familiarize subjects with the task, the results of each<br />
sequence, including CS <strong>and</strong> actual contrast of each trial <strong>and</strong> the<br />
correctness of the responses, were saved <strong>and</strong> analyzed using custom-programmed<br />
MS Excel spreadsheets.<br />
<strong>The</strong> Pelli-Robson Chart<br />
Optometry <strong>and</strong> Vision Science, Vol. 83, No. 5, May 2006<br />
<strong>The</strong> PRC (Clement Clarke International Ltd.; Harlow, U.K.) is<br />
a wall chart displaying Sloan letters of constant size. 14 Three letters<br />
form a triplet of equal contrast <strong>and</strong> contrast decreases from row to<br />
row by a factor of 2 (i.e., 0.15 logCS units per triplet). <strong>The</strong> test<br />
chart was illuminated by room light providing a background luminance<br />
of 100 cd/m 2 (minimum, 91 cd/m 2 ; maximum, 102<br />
cd/m 2 ). <strong>Test</strong>ing was carried out at 1 m (LogMAR equivalent 1.3)<br />
using a forced-choice strategy: 0.05 logCS were credited per letter<br />
correctly recognized as suggested earlier. 28 <strong>The</strong> Brightness <strong>Acuity</strong><br />
<strong>Test</strong>er (BAT; Mentor ONO, Norwell, MA) was used as a glare<br />
source. 29 <strong>The</strong> BAT is a h<strong>and</strong>held device in the form of a white<br />
hemisphere (diameter 60 mm) with a central aperture of 12 mm.<br />
<strong>The</strong> subjects held the BAT close to their eye <strong>and</strong> looked through<br />
the aperture at the wall chart. <strong>The</strong> hemisphere was illuminated<br />
indirectly by an inc<strong>and</strong>escent lamp (setting “high” [320 lx], according<br />
to a previous CS test comparison study 15 ) providing wideangle<br />
glare at least 11.3° from the center of the aperture.
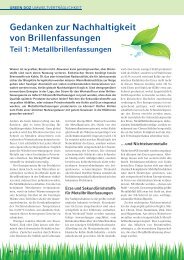
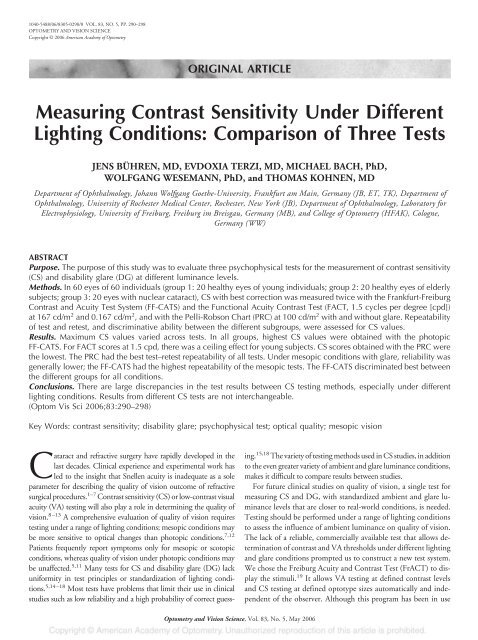
FIGURE 1.<br />
Protocol of one single test sequence illustrating the determination of the<br />
contrast threshold (dotted line) by the best parameter estimation by sequential<br />
testing algorithm.<br />
<strong>The</strong> Functional <strong>Acuity</strong> <strong>and</strong> <strong>Contrast</strong> <strong>Test</strong><br />
<strong>The</strong> FACT is a chart displaying sinusoidal gratings of five different<br />
spatial frequencies with nine contrast levels for each spatial<br />
frequency (Table 2). 16 Gratings are displayed as circular patches<br />
with blurred edges either orientated vertically or tilted 15° to the<br />
left or right. <strong>The</strong> decrements of the grating contrast are 0.15 logCS<br />
units for each spatial frequency, resulting in a range of 1.2 logCS<br />
units (Table 2). In this study, the version integrated in the <strong>Contrast</strong><br />
Sensitivity <strong>Test</strong>er 1800 (CST 1800; Vision Science Research<br />
Corp.; San Ramon, CA) was used. A miniature version of the chart<br />
was mounted in a view-in test box <strong>and</strong> displayed at optical infinity.<br />
<strong>The</strong> luminance was set at 167 cd/m 2 for photopic <strong>and</strong> 0.167 cd/m 2<br />
for mesopic testing to ensure comparable test conditions with the<br />
FF-CATS. An inc<strong>and</strong>escent bulb providing temporal glare is integrated<br />
into the device; it was regulated to an illuminance of 0.32 lx<br />
(Table 2). Glare angles ranged from 29.6° when viewing the most<br />
temporally located column to 48.5° when viewing the most nasally<br />
located column of the FACT chart. This resulted in a smaller glare<br />
angle for right eyes viewing gratings with higher spatial frequencies<br />
<strong>and</strong> left eyes viewing gratings with lower spatial frequencies <strong>and</strong><br />
vice versa. Chart illumination <strong>and</strong> glare were self-controlled in a<br />
closed-loop fashion with an integrated illuminance meter. Trial<br />
lenses for distance correction were placed in front of the viewing<br />
FIGURE 2.<br />
Detail view of the monitor box with the light-emitting diode glare sources.<br />
<strong>Contrast</strong> Sensitivity at Different Luminance Levels—Bühren et al. 293<br />
aperture. <strong>The</strong> subject had to decide if the grating was directed<br />
vertically or tilted to the right or left (3-AFC). <strong>The</strong> CS at a certain<br />
spatial frequency was the last correct response before two successive<br />
wrong responses. If a subject did not recognize the lowest CS value,<br />
CS was recorded as zero for that spatial frequency. To reduce the<br />
amount of data <strong>and</strong> enable comparison with the other tests, we<br />
analyzed CS values acquired at a spatial frequency of 1.5 cpd, <strong>and</strong><br />
we calculated the area under the approximated contrast sensitivity<br />
function (CSF), referred to as A FACT that was obtained by linearly<br />
connecting the five CS readings of each FACT trial (spatial<br />
frequencies on a linear scale). 30,31<br />
Statistical Analysis<br />
Optometry <strong>and</strong> Vision Science, Vol. 83, No. 5, May 2006<br />
<strong>The</strong> main outcome variable of all the tests was the logarithmic<br />
value of contrast sensitivity (logCS). All statistical analyses were<br />
carried out using the BiAS 7.06 software package.<br />
Mean Values. Mean CS values for each test <strong>and</strong> condition<br />
were calculated from averaged test <strong>and</strong> retest values. Statistical<br />
significance of CS intergroup differences was assessed with the<br />
Kruskal-Wallis test <strong>and</strong> the effect of a glare source was evaluated<br />
with the paired Wilcoxon test. A p value 0.05 was considered<br />
statistically significant. An overall level of 0.05 for multiple tests<br />
was maintained using a Bonferroni correction.<br />
Reliability. <strong>Test</strong>–retest repeatability was assessed separately<br />
for groups 1, 2, <strong>and</strong> 3 using the method described by Bl<strong>and</strong> <strong>and</strong><br />
Altman. 32 <strong>The</strong> coefficient of repeatability (COR), defined as the<br />
1.96-fold value of the st<strong>and</strong>ard deviation of the differences between<br />
test <strong>and</strong> retest, was used as a measure of reliability. 32 We also<br />
calculated the ratio between the COR <strong>and</strong> the mean value of test<br />
<strong>and</strong> retest. This was of interest when comparing test repeatability<br />
independently of the absolute value (e.g., photopic <strong>and</strong> mesopic<br />
CS, A FACT).<br />
Discrimination Ability. Receiver operating characteristic<br />
(ROC) curves that plot “sensitivity” against “1-specificity” were<br />
computed to analyze the ability of the tests to discriminate between<br />
groups of subjects with different ocular conditions (Table 1). 33<br />
<strong>The</strong> area under the ROC curve (Az ROC) served as a measurement<br />
of the discriminative power of a test; an ideal test with 100%<br />
sensitivity <strong>and</strong> specificity would reach the maximal Az ROC value<br />
of 1. ROC curves were computed from the averaged test <strong>and</strong> retest<br />
measures of CS.<br />
RESULTS<br />
Demographic Data <strong>and</strong> Mean Values<br />
Statistically significant differences (p 0.05) were found for age<br />
<strong>and</strong> BCVA between all groups. For all tests, CS was higher for<br />
normal young than for normal elderly subjects, whereas the patients<br />
with cataracts had the lowest CS values. However, median<br />
CS values varied among the contrast tests used (Tables 3 <strong>and</strong> 4;<br />
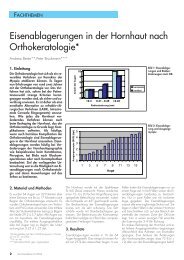
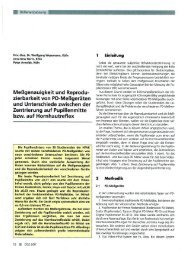
Figs. 3A, B <strong>and</strong> 4). FF-CATS scores were the highest values,<br />
whereas CS values obtained with the PRC were the lowest<br />
throughout all groups. <strong>The</strong>re were large differences between FF-<br />
CATS <strong>and</strong> FACT values at 1.5 cpd under mesopic conditions (Fig.<br />
3A, B). For young subjects (group 1), there was a ceiling effect of<br />
FACT values at 1.5 cpd shown by the asymmetric distribution in<br />
the box plot diagrams (Fig. 3A, B). In contrast, many older subjects
294 <strong>Contrast</strong> Sensitivity at Different Luminance Levels—Bühren et al.<br />
TABLE 3.<br />
<strong>Contrast</strong> sensitivity (logCS) under photopic conditions: median <strong>and</strong> range (in parentheses) a<br />
<strong>Test</strong> Glare Group 1 Group 2 Group 3<br />
FF-ACTS — 2.23 (1.98–2.42) 1.82 (1.58–2.29) 1.60 (1.28–2.04)<br />
2.19 (1.73–2.42) 1.92 (1.48–2.29) 1.59 (1.30–2.16)<br />
Pelli-Robson — 1.85 (1.65–1.95) 1.65 (1.45–1.88) 1.51 (1.20–1.65)<br />
1.73 (1.40–1.90) b 1.59 (1.33–1.73) d 1.43 (0.70–1.65) c<br />
FACT at 1.5 cpd — 2.00 (1.63–2.00) 1.82 (1.63–2.00) 1.63 (1.40–2.00)<br />
2.00 (1.70–2.00) 1.85 (1.56–2.00) 1.70 (1.48–2.00)<br />
A FACT — 33.35 (32.25–34.53) 28.84 (13.36–33.20) 20.14 (11.12–31.13)<br />
33.68 (30.03–34.53) 27.72 (14.32–33.14) 21.42 (10.12–29.43)<br />
a Group 1, young normal subjects; Group 2, elderly normal subjects; Group 3, patients with cataract.<br />
logCS difference with glare: b p 0.05; c p 0.01; d p0.001 (paired Wilcoxon test with Bonferroni correction).<br />
in groups 2 <strong>and</strong> 3 failed to recognize the lowest CS value of the<br />
mesopic FACT (data not shown).<br />
Under photopic conditions, statistically significant CS loss resulting<br />
from glare (DG) could only be observed with the PRC <strong>and</strong><br />
with the BAT (Table 3), whereas under mesopic conditions, a<br />
significant decrease in CS was only found for the FF-CATS (Table<br />
4). Although patients with cataract had the lowest CS values<br />
among all tests <strong>and</strong> had a tendency for higher DG, there were no<br />
significant differences in DG values between the groups. As shown<br />
above, in the CST 1800, the position of the glare source relative to<br />
the sine wave gratings of the FACT was not constant. For the<br />
near-threshold gratings, the glare angle was smaller for right than<br />
for left eyes. However, no statistically significant difference in DG<br />
between right <strong>and</strong> left eyes was found in any group (data not<br />
shown).<br />
<strong>Test</strong>–Retest Repeatability<br />
<strong>The</strong> PRC had the best repeatability (COR 0.22 <strong>and</strong> 0.13<br />
logCS, see Table 5) among photopic CS tests for normal subjects<br />
(groups 1 <strong>and</strong> 2). <strong>The</strong> FACT at 1.5 cpd <strong>and</strong> the FF-CATS<br />
had higher COR values for normal subjects, ranging from 0.33<br />
logCS (FACT, group 1) to 0.39 logCS (FACT, group 2). In<br />
most cases, the introduction of a glare source led to a decrease in<br />
repeatability (Table 5). For patients with cataract, tests using<br />
letter optotypes (FF-CATS, PRC) had a higher repeatability.<br />
Also A FACT values were much less repeatable for group 3.<br />
Under mesopic conditions table, COR values for groups 1 <strong>and</strong><br />
2 were 0.32 logCS (FF-CATS with glare in group 2) for all<br />
tests. In group 3, results were similar: repeatability was best for<br />
the FF-CATS (0.29 logCS without <strong>and</strong> 0.15 log CS with glare),<br />
whereas FACT testing, especially for the A FACT, which included<br />
higher spatial frequencies, had larger differences between<br />
test <strong>and</strong> retest.<br />
Discriminative Ability<br />
<strong>The</strong> discriminative ability of CS was analyzed for three conditions:<br />
young vs. elderly normal subjects (group 1 vs. 2), young vs.<br />
cataract subjects (group 1 vs. 3), <strong>and</strong> elderly normal vs. cataract<br />
subjects (group 2 vs. 3). Results are shown in Table 7. In general,<br />
CS tests showed best discrimination between groups 1 <strong>and</strong> 3 <strong>and</strong> a<br />
better discrimination between groups 1 <strong>and</strong> 2 than between groups<br />
2 <strong>and</strong> 3. Under photopic conditions, the FF-CATS, PRC, <strong>and</strong> A<br />
FACT showed a similar ability to distinguish between the three<br />
groups. FACT CS values obtained at 1.5 cpd had a markedly lower<br />
discrimination ability. Except for the FACT value at 1.5 cpd, testing<br />
with glare did not improve discrimination between the groups<br />
throughout the tests. Under mesopic conditions, all tests discerned<br />
best between young <strong>and</strong> cataract subjects. Only the FF-CATS was<br />
able to sufficiently distinguish between older healthy <strong>and</strong> cataract<br />
subjects (group 2 vs. 3).<br />
DISCUSSION<br />
Comparison of Mean <strong>Contrast</strong> Sensitivity <strong>and</strong><br />
Disability Glare Values<br />
Subjects obtained the highest photopic CS scores with the<br />
FF-CATS. For the FACT at 1.5 cpd, the highest possible score<br />
was 2.0 logCS. Most of the young subjects (group 1, Fig. 3A)<br />
TABLE 4.<br />
<strong>Contrast</strong> sensitivity (logCS) under mesopic conditions: median <strong>and</strong> range (in parentheses) a<br />
<strong>Test</strong> Glare Group 1 Group 2 Group 3<br />
FF-ACTS — 1.23 (0.85–1.58) 1.00 (0.65–1.26) 0.78 (0.34–1.17)<br />
0.90 (0.68–1.18) b 0.55 (0.21–0.88) b 0.21 (0.21–0.58) b<br />
FACT at 1.5 cpd — 1.78 (1.48–2.00) 1.60 (1.26–2.00) 1.40 (0.98–2.00)<br />
1.78 (1.56–2.00) 1.63 (1.26–2.00) 1.42 (0.95–2.00)<br />
A FACT — 21.45 (14.93–30.11) 11.85 (2.07–23.62) 8.33 (0.74–21.15)<br />
21.03 (14.95–26.43) 11.34 (3.20–23.85) 7.43 (0.71–24.50)<br />
a Group 1, young normal subjects; Group 2, elderly normal subjects; Group 3, patients with cataract.<br />
logCS difference with glare: b p 0.001 (paired Wilcoxon test with Bonferroni correction).<br />
Optometry <strong>and</strong> Vision Science, Vol. 83, No. 5, May 2006
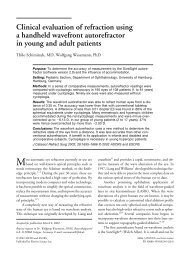
FIGURE 3.<br />
Box plot diagrams showing median contrast sensitivity values without<br />
glare. (A) <strong>Frankfurt</strong>-<strong>Freiburg</strong> <strong>Contrast</strong> <strong>and</strong> <strong>Acuity</strong> <strong>Test</strong> System (FF-CATS),<br />
Pelli-Robson chart, <strong>and</strong> Functional <strong>Acuity</strong> <strong>Contrast</strong> <strong>Test</strong> (FACT) at 1.5 cpd<br />
(photopic conditions). (B) FF-CATS <strong>and</strong> FACT at 1.5 cpd (mesopic conditions).<br />
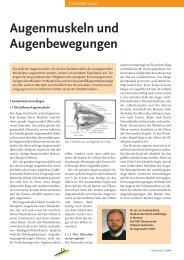
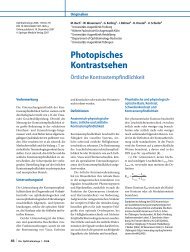
FIGURE 4.<br />
Box plot diagrams showing median contrast sensitivity values for the area<br />
under the contrast sensitivity function obtained with the Functional <strong>Acuity</strong><br />
<strong>Contrast</strong> <strong>Test</strong> (A FACT) without glare.<br />
reached the 2.0 log CS score, which was reflected by the asymmetric<br />
distribution in the box plot diagrams (Fig. 3A, B). Most<br />
likely, their real CS is higher than the highest possible FACT<br />
score (ceiling effect). This effect has been described in detail in<br />
a previous study <strong>and</strong> is attributed to the limited range of 1.2<br />
logCS of the FACT chart. 18 In contrast to the FF-CATS, the<br />
reduction of luminance by a factor of 1000 only marginally<br />
affected FACT scores (Fig. 3A, B). Several factors may be re-<br />
<strong>Contrast</strong> Sensitivity at Different Luminance Levels—Bühren et al. 295<br />
sponsible for the discrepancy in mesopic CS scores obtained<br />
with FACT <strong>and</strong> FF-CATS. First, although luminance levels<br />
were identical for both tests (0.167 cd/m 2 ), the effective illuminance<br />
was higher (0.2 lx) for the FACT because the area of the<br />
illuminated background chart was much larger. Second, the fact<br />
that grating CS has been reported to be higher than letter CS<br />
might be another reason for the discrepancy. 34 Finally, it is<br />
possible that a drop in the contrast threshold from values above<br />
the highest score into the range of the FACT when luminance<br />
was reduced could not be recognized as a result of the ceiling<br />
effect. <strong>The</strong> PRC did not show a definite ceiling effect, although<br />
values were distributed much narrower around the medians.<br />
<strong>The</strong> discrimination task was more complex for the PRC because<br />
the letters had to be recognized completely compared with simple<br />
gap recognition for the FF-CATS. Besides this fact, a lower<br />
probability of correct guessing (26- vs. 8-AFC) <strong>and</strong> the lower<br />
chart luminance (100 cd/m 2 ) could be responsible for lower CS<br />
values measured with the PRC throughout all groups.<br />
<strong>The</strong> glare sources influenced CS scores differently in each<br />
test. <strong>The</strong> additional low-illuminance glare sources designed to<br />
simulate night glare that were used for FACT <strong>and</strong> FF-CATS did<br />
not affect photopic DG significantly (Tables 3 <strong>and</strong> 4) because<br />
photopic CS scores were already affected by wide-angle scatter<br />
from the background of the charts <strong>and</strong> surroundings. 15,35 Only<br />
the wide-angle glare provided by the BAT, which was 1000-fold<br />
higher (320 lx) than the glare of FACT <strong>and</strong> FF-CATS, was able<br />
to reduce CS significantly. However, because of its high illuminance,<br />
the BAT is inappropriate for mesopic testing because it is<br />
likely to change the adaptation state of the eye <strong>and</strong> provoke<br />
pupil constriction. This is especially relevant in refractive surgery<br />
trials in which pupil constriction would mask possible<br />
effects of induced aberrations on visual performance. 36,37 Although<br />
glare illuminance was the same for FACT <strong>and</strong> FF-<br />
CATS, their glare angle (3.2° for FF-CATS, 29.6°–48.5° for<br />
FACT) <strong>and</strong> their configuration (single inc<strong>and</strong>escent lamp vs.<br />
circle of white LEDs) were different, which could explain the<br />
marginal effect of FACT glare. 38 <strong>The</strong>refore, it would be reasonable<br />
to test only under mesopic conditions with glare or to adapt<br />
the configuration <strong>and</strong> illuminance of the glare source to the<br />
specific situation to be simulated by the test.<br />
TABLE 5.<br />
Reliability of photopic contrast sensitivity (logCS) measurements: coefficient of repeatability (COR) in logCS <strong>and</strong> ratio<br />
between COR <strong>and</strong> mean between test <strong>and</strong> retest (COR ratio) a<br />
COR (log CS) COR Ratio<br />
<strong>Test</strong> Glare Group 1 Group 2 Group 3 Group 1 Group 2 Group 3<br />
FF-ACTS — 0.38 0.35 0.22 0.18 0.20 0.13<br />
0.34 0.35 0.22 0.16 0.18 0.14<br />
Pelli-Robson — 0.22 0.13 0.15 0.12 0.08 0.11<br />
0.46 0.17 0.16 0.26 0.11 0.11<br />
FACT at 1.5 cpd — 0.33 0.39 0.30 0.17 0.21 0.18<br />
0.24 0.33 0.37 0.12 0.18 0.22<br />
A FACT — 3.10 4.98 7.54 0.09 0.19 0.37<br />
2.41 8.09 4.42 0.07 0.31 0.22<br />
a Group 1, young normal subjects; Group 2, elderly normal subjects; Group 3, patients with cataract.<br />
Optometry <strong>and</strong> Vision Science, Vol. 83, No. 5, May 2006
296 <strong>Contrast</strong> Sensitivity at Different Luminance Levels—Bühren et al.<br />
TABLE 6.<br />
Reliability of mesopic contrast sensitivity (logCS) measurements: coefficient of repeatability (COR) in logCS <strong>and</strong> ratio<br />
between COR <strong>and</strong> mean between test <strong>and</strong> retest (COR ratio) a<br />
<strong>Test</strong>–Retest Repeatability<br />
Repeatability results for the PRC <strong>and</strong> for the FACT are consistent<br />
with earlier studies. 15,18,28 For subjects in group 1, the<br />
reliability of FACT scores was significantly lower under mesopic<br />
conditions because the ceiling effect led to the apparently<br />
higher repeatability of photopic CS scores. <strong>The</strong> effect of r<strong>and</strong>omly<br />
occurring variance of CS at different spatial frequencies<br />
could be mitigated by calculating the area under the CSF (A<br />
FACT). For healthy subjects (group 1 <strong>and</strong> 2), A FACT scores<br />
showed good reliability that decreased with introduction of a<br />
glare source. Repeatability was also lower in patients with cataracts,<br />
which could be explained by a poor repeatability at<br />
higher spatial frequencies (data not shown). COR values for the<br />
FF-CATS were higher as expected for a PEST-based forcedchoice<br />
test with 24 trials. One possible reason is that the smaller<br />
step size compared with the PRC uncovers a r<strong>and</strong>om variance of<br />
CS values. Moreover, training effects could also play a role<br />
because there was a tendency toward higher values for the repeat<br />
trial (data not shown). It remains to be determined whether the<br />
best PEST algorithm has to be modified for CS measurements.<br />
Incorrect responses, e.g., as a result of fatigue during the initial<br />
phase of the trial sequence (trials 4–8), might lead to underestimation<br />
of CS because the step size remains small later<br />
throughout the sequence.<br />
COR (log CS) COR Ratio<br />
<strong>Test</strong> Glare Group 1 Group 2 Group 3 Group 1 Group 2 Group 3<br />
FF-ACTS — 0.46 0.55 0.29 0.37 0.55 0.39<br />
0.36 0.32 0.15 0.40 0.55 0.51<br />
FACT at 1.5 cpd — 0.55 0.35 0.37 0.30 0.21 0.25<br />
0.57 0.36 0.31 0.32 0.22 0.22<br />
A FACT — 10.64 8.43 11.10 0.50 0.67 1.27<br />
10.16 4.58 12.47 0.47 0.37 1.60<br />
a Group 1, young normal subjects; Group 2, elderly normal subjects; Group 3, patients with cataract.<br />
Discrimination Ability<br />
One basic property of psychophysical tests is the ability to distinguish<br />
between different conditions. It is known that retinal image<br />
quality decreases with age as a result of increasing light scatter <strong>and</strong><br />
optical aberrations. 39 Correspondingly, CS decreases as a function of<br />
age. 40,41 To evaluate discrimination ability of the three tests used in<br />
this study, we used a setup of three groups of 20 eyes in each group.<br />
Older cataract subjects (group 3) served as positive controls, whereas<br />
the other two groups (groups 1 <strong>and</strong> 2) consisted of healthy eyes. All<br />
tests performed satisfactory when separating young normal subjects<br />
from patients with cataracts (1 vs. 3). Interestingly, addition of a glare<br />
source did not improve selectivity in general because wide-angle scatter<br />
from the chart background might already have decreased CS in<br />
patients with cataracts. <strong>The</strong> FACT scores (1.5 cpd <strong>and</strong> A FACT) failed<br />
to discriminate between groups 2 <strong>and</strong> 3 in most cases. This was because<br />
of the limited range of the FACT chart contrast thresholds,<br />
because most older normal subjects <strong>and</strong> patients with cataracts were<br />
below the lowest CS step (floor effect, data not shown). Consequently,<br />
use of a glare source did not improve discriminative ability.<br />
Overall Rating of the <strong>Test</strong>s<br />
<strong>The</strong> <strong>Frankfurt</strong>-<strong>Freiburg</strong> <strong>Contrast</strong> <strong>and</strong> <strong>Acuity</strong> <strong>Test</strong> System. <strong>The</strong><br />
present study has shown that the FrACT with its extension, the<br />
TABLE 7.<br />
Discriminative ability: area under the receiver operating curve (A zROC) for contrast sensitivity (CS) measurements a<br />
<strong>Test</strong> A z ROC Photopic A z ROC Mesopic<br />
Glare 1 vs. 2 1 vs. 3 2 vs. 3 1 vs. 2 1 vs. 3 2 vs. 3<br />
FF-ACTS — 0.90 d 0.99 d 0.80 0.82 0.97 d 0.83<br />
0.80 0.97 b 0.84 c 0.90 b 1.00 d 0.87 b<br />
Pelli-Robson — 0.89 b 1.00 d 0.83 ND<br />
0.89 b 0.96 d 0.80 ND<br />
FACT at 1.5 cpd — 0.74 0.85 d 0.75 0.72 0.90 d 0.80<br />
0.74 0.91 d 0.75 0.76 0.88 d 0.74<br />
A FACT — 0.95 d 1.00 0.77 d 0.91 d 0.97 d 0.71<br />
0.96 d 1.00 0.77 d 0.91 d 0.96 d 0.74<br />
a For each CS test, p values of intergroup comparison of CS values as obtained by the Kruskal-Wallis test are shown. Group 1, young<br />
normal subjects; Group 2, elderly normal subjects; Group 3, patients with cataract.<br />
Kruskal-Wallis test (intergroup comparison of CS values): b p 0.05; c p 0.01; d p 0.001 (with Bonferroni correction).<br />
ND, not done.<br />
Optometry <strong>and</strong> Vision Science, Vol. 83, No. 5, May 2006
FF-CATS, is a valuable psychophysical test for determining CS at<br />
different luminance levels with <strong>and</strong> without glare. Because for all luminance<br />
<strong>and</strong> glare conditions the same test procedure is used, the<br />
influence of luminance <strong>and</strong> glare on CS could be studied. Its test<br />
strategy follows the criteria that have been deemed necessary for psychophysical<br />
tests 15,18 : a wide range of stimuli, forced-choice testing, a<br />
low probability of guessing, <strong>and</strong> prevention of learning effects by r<strong>and</strong>omized<br />
computer presentation. <strong>The</strong> latter is an important requirement<br />
for repeated testing under different luminance <strong>and</strong> glare conditions.<br />
Recognizing the gap of a L<strong>and</strong>olt C is a simple task that most<br />
patients are familiar with. However, because the PEST algorithm presents<br />
most of the stimuli around the assumed threshold 19,25 (Fig. 1),<br />
testing may be exhausting. <strong>The</strong> typing task requires some dexterity,<br />
especially in elderly patients. To avoid change in accommodative state,<br />
patients should be advised not to look at the keypad but to localize the<br />
correct key digitally. <strong>The</strong>refore, Wesemann recommended the subject<br />
give the answer verbally with the examiner typing it into the computer.<br />
21 Typing errors in the initial phase of the sequence may be one<br />
cause of the somewhat lower reliability of the FF-CATS compared<br />
with the PRC. Larger CS steps, as presented by PRC <strong>and</strong> FACT,<br />
helped to smooth out this noise but also contained a risk of lower<br />
sensitivity. In fact, the FF-CATS showed the highest ability of all the<br />
tests to discriminate between the groups for all combinations <strong>and</strong> all<br />
conditions of luminance <strong>and</strong> glare.<br />
<strong>The</strong> L<strong>and</strong>olt ring used has a dominant spatial frequency of<br />
1.5 cpd. For a comprehensive determination of functional parameters<br />
of quality of vision, a test at a higher spatial frequency<br />
would also be required. By additional testing of high-contrast<br />
VA with the FF-CATS, the two most relevant points of the CSF<br />
could be measured. 18,24,28 In its present form, the FF-CATS is<br />
a test designed for clinical studies in a laboratory environment.<br />
Changes of setup or testing modes (size of the L<strong>and</strong>olt ring, VA<br />
testing at defined contrast levels, modifications of background<br />
luminance by neutral filters, changes of glare illuminance, recording<br />
answering time) could easily be performed if required<br />
for special investigations.<br />
<strong>The</strong> Pelli-Robson Chart. Although for the PRC, luminance<br />
<strong>and</strong> glare conditions were significantly different from the<br />
two other tests, we used it as a reference method because it had<br />
been proven to be a test with good reliability. 15,28,42 It is an<br />
optotype-based test; the letter “C” of the PRC equals the<br />
L<strong>and</strong>olt ring. It is easy to administer because patients are familiar<br />
to Sloan letter optotypes. With a 26-AFC, guessing probability<br />
is low <strong>and</strong> smaller steps than 0.15 logCS could be simulated<br />
using a by-letter scoring system. 28 A drawback that<br />
motivated us to build a modification of the FrACT for CS<br />
testing was the lack of a glare source that provided equal conditions<br />
for all letter triplets. <strong>The</strong> BAT is not useful for mesopic<br />
glare testing because it both induces pupil constriction <strong>and</strong><br />
changes the adaptive state of the eye. Moreover, for repetitive<br />
trials at different luminance levels, more than two charts are<br />
required to prevent learning effects.<br />
<strong>The</strong> Functional <strong>Acuity</strong> <strong>Contrast</strong> <strong>Test</strong>. <strong>The</strong> FACT chart<br />
has become a popular CS test with widespread use because of its<br />
simple <strong>and</strong> clear testing procedure. Yet several studies, including<br />
this study, show that the FACT <strong>and</strong> its predecessor, the Vistech<br />
Chart, have problems such as low repeatability, high probability of<br />
correct guessing, <strong>and</strong> limited range of presented contrasts all limit<br />
<strong>Contrast</strong> Sensitivity at Different Luminance Levels—Bühren et al. 297<br />
their usefulness. 15,18,43 <strong>The</strong> ceiling effect in young healthy subjects<br />
(group 1) makes the FACT unsuitable for use in refractive surgery<br />
outcomes research, whereas the floor effect in older subjects<br />
(groups 2 <strong>and</strong> 3, data not shown) makes the test unsuitable for use<br />
in studies of cataract surgery. <strong>The</strong> data from five spatial frequencies<br />
could be easier to interpret <strong>and</strong> more reliable if, for example, the<br />
area under the CSF (A FACT) was specified; that has the potential<br />
advantage of containing information from all spatial frequencies.<br />
30,31 However, the poor reliability of the mesopic FACT at<br />
higher spatial frequencies (data not shown) may affect repeatability<br />
of a FACT scored. As mentioned previously <strong>and</strong> demonstrated by<br />
factor analysis in a recent study, the Vistech <strong>and</strong> FACT charts need<br />
only two components, one representing low <strong>and</strong> the other representing<br />
high spatial frequencies to determine quality of vision comprehensively.<br />
18 It should be mentioned that the luminance conditions<br />
in the present study were different from those recommended<br />
by the manufacturer; they were lower in our study. <strong>The</strong> 3 cd/m 2 ,<br />
recommended by the manufacturer as “scotopic” lighting conditions,<br />
is not actually scotopic. Under higher luminance levels for<br />
mesopic testing (3 or 6 cd/m 2 ), a more pronounced ceiling effect is<br />
likely to occur as well. It remains to be determined if a higher glare<br />
illuminance would have been more useful for discrimination between<br />
normal <strong>and</strong> cataract subjects. However, the variability of the<br />
glare angle (29.6°–48.5°) in the CST 1800 <strong>and</strong> the asymmetry<br />
between right <strong>and</strong> left eyes are more likely to have an effect if the<br />
glare source induced significant DG. Although the CST 1800 with<br />
the FACT allows approximation of the CSF under variable <strong>and</strong><br />
controlled lighting <strong>and</strong> glare conditions without a complex laboratory<br />
setup, it contains certain flaws that make it of questionable<br />
use for clinical studies.<br />
In summary, the perfect contrast test has not been found yet.<br />
<strong>The</strong> present study showed that different tests show different<br />
characteristics <strong>and</strong> results may not be interchangeable. For testing<br />
at different luminance levels, the FF-CATS, a laboratory<br />
application of the FrACT, fulfilled the requirements to comprehensively<br />
assess quality of vision. Further studies will be<br />
needed to show its usefulness for clinical trials in the field of<br />
cataract <strong>and</strong> refractive surgery.<br />
ACKNOWLEDGMENTS<br />
This study was supported by a grant from the German Ophthalmological<br />
Society (Forschungsförderungspreis der DOG 2001 [JB]).<br />
Presented in part at the 2003 annual meeting of the Association for<br />
Research in vision <strong>and</strong> Ophthalmology (ARVO), Fort Lauderdale, Florida;<br />
at the 2003 annual meeting of the German Society for Intraocular<br />
Lens Implantation <strong>and</strong> Refractive Surgery (DGII), Ludwigshafen, Germany;<br />
at the 2003 annual meeting of the German Ophthalmological<br />
Society (DOG) Berlin, Germany; at the 2004 Refractive Surgery Winter<br />
Meeting of the European Society of Cataract <strong>and</strong> Refractive Surgeons<br />
(ESCRS), Barcelona, Spain.<br />
<strong>The</strong> authors have no proprietary interest in any programs or of the devices<br />
used in this study.<br />
Received June 14, 2005; accepted February 14, 2006.<br />
REFERENCES<br />
Optometry <strong>and</strong> Vision Science, Vol. 83, No. 5, May 2006<br />
1. Brown B, Lovie-Kitchin JE. High <strong>and</strong> low contrast acuity <strong>and</strong> clinical<br />
contrast sensitivity tested in a normal population. Optom Vis Sci<br />
1989;66:467–73.
298 <strong>Contrast</strong> Sensitivity at Different Luminance Levels—Bühren et al.<br />
2. Haegerstrom-Portnoy G, Schneck ME, Lott LA, Brabyn JA. <strong>The</strong><br />
relation between visual acuity <strong>and</strong> other spatial vision measures. Optom<br />
Vis Sci 2000;77:653–62.<br />
3. Kohnen T. Measuring vision in refractive surgery. J Cataract Refract<br />
Surg 2001;27:1897–8.<br />
4. McLeod SD. Beyond Snellen acuity: the assessment of visual function<br />
after refractive surgery. Arch Ophthalmol 2001;119:1371–3.<br />
5. Fan-Paul NI, Li J, Miller JS, Florakis GJ. Night vision disturbances<br />
after corneal refractive surgery. Surv Ophthalmol 2002;47:533–46.<br />
6. Wilson SE. Wave-front analysis: are we missing something? Am J<br />
Ophthalmol 2003;136:340–2.<br />
7. Pesudovs K, Marsack JD, Donnelly WJ, Thibos LN, Applegate RA.<br />
Measuring visual acuity—mesopic or photopic conditions, <strong>and</strong> high<br />
or low contrast letters? J Refract Surg 2004;20:S508–14.<br />
8. Schallhorn SC, Blanton CL, Kaupp SE, Sutphin J, Gordon M, Goforth<br />
H Jr, Butler FK Jr. Preliminary results of photorefractive keratectomy<br />
in active-duty United States Navy personnel. Ophthalmology<br />
1996;103:5–22.<br />
9. Lee YC, Hu FR, Wang IJ. Quality of vision after laser in situ<br />
keratomileusis: influence of dioptric correction <strong>and</strong> pupil size on<br />
visual function. J Cataract Refract Surg 2003;29:769–77.<br />
10. Yamane N, Miyata K, Samejima T, Hiraoka T, Kiuchi T, Okamoto<br />
F, Hirohara Y, Mihashi T, Oshika T. Ocular higher-order aberrations<br />
<strong>and</strong> contrast sensitivity after conventional laser in situ keratomileusis.<br />
Invest Ophthalmol Vis Sci 2004;45:3986–90.<br />
11. Kohnen T, Bühren J, Kasper T, Terzi E. Quality of vision after<br />
refractive surgery. In: Kohnen T, Koch DD, eds. Cataract <strong>and</strong> Refractive<br />
Surgery. Berlin: Springer;2005:303–22.<br />
12. Rabin J. Luminance effects on visual acuity <strong>and</strong> small letter contrast<br />
sensitivity. Optom Vis Sci 1994;71:685–8.<br />
13. Pesudovs K, Schoneveld P, Seto RJ, Coster DJ. <strong>Contrast</strong> <strong>and</strong> glare<br />
testing in keratoconus <strong>and</strong> after penetrating keratoplasty. Br J Ophthalmol<br />
2004;88:653–7.<br />
14. Pelli DG, Robson JG, Wilkins AJ. Designing a new letter chart for<br />
measuring contrast sensitivity. Clin Vision Sci 1988;2:187–99.<br />
15. Elliott DB, Bullimore MA. Assessing the reliability, discriminative<br />
ability, <strong>and</strong> validity of disability glare tests. Invest Ophthalmol Vis Sci<br />
1993;34:108–19.<br />
16. Ginsburg AP. Next generation contrast sensitivity testing. In:<br />
Rosenthal BP, Cole RG, eds. Functional assessment of Low Vision. St<br />
Louis: Mosby-Year Book Inc;1996:77–88.<br />
17. Rabin J, Wicks J. Measuring resolution in the contrast domain: the<br />
small letter contrast test. Optom Vis Sci 1996;73:398–403.<br />
18. Pesudovs K, Hazel CA, Doran RM, Elliott DB. <strong>The</strong> usefulness of<br />
Vistech <strong>and</strong> FACT contrast sensitivity charts for cataract <strong>and</strong> refractive<br />
surgery outcomes research. Br J Ophthalmol 2004;88:11–6.<br />
19. Bach M. <strong>The</strong> <strong>Freiburg</strong> Visual <strong>Acuity</strong> test—automatic measurement<br />
of visual acuity. Optom Vis Sci 1996;73:49–53.<br />
20. Bach M, Kommerell G. [Determining visual acuity using European<br />
normal values: scientific principles <strong>and</strong> possibilities for automatic<br />
measurement.] Klin Monatsbl Augenheilkd 1998;212:190–5.<br />
21. Wesemann W. [Visual acuity measured via the <strong>Freiburg</strong> visual acuity<br />
test (FVT), Bailey Lovie chart <strong>and</strong> L<strong>and</strong>olt Ring chart.] Klin<br />
Monatsbl Augenheilkd 2002;219:660–7.<br />
22. Loumann Knudsen L. Visual acuity testing in diabetic subjects: the<br />
decimal progression chart versus the <strong>Freiburg</strong> visual acuity test.<br />
Graefes Arch Clin Exp Ophthalmol 2003;241:615–8.<br />
23. Dennis RJ, Beer JM, Baldwin JB, Ivan DJ, Lorusso FJ, Thompson<br />
WT. Using the <strong>Freiburg</strong> <strong>Acuity</strong> <strong>and</strong> <strong>Contrast</strong> <strong>Test</strong> to measure visual<br />
performance in USAF personnel after PRK. Optom Vis Sci 2004;81:<br />
516–24.<br />
Optometry <strong>and</strong> Vision Science, Vol. 83, No. 5, May 2006<br />
24. Terzi E, Bühren J, Wesemann W, Kohnen T. [<strong>Frankfurt</strong>-<strong>Freiburg</strong><br />
<strong>Contrast</strong> <strong>and</strong> <strong>Acuity</strong> <strong>Test</strong> System (FF-CATS). A new test to determine<br />
contrast sensitivity under variable ambient <strong>and</strong> glare luminance<br />
levels.] Ophthalmologe 2005;102:507–13.<br />
25. Lieberman HR, Pentl<strong>and</strong> A. Microcomputer-based estimation of<br />
psychophysical thresholds: the best PEST. Behav Res Methods Instrum<br />
Comput 1982;14:21–5.<br />
26. Rassow B. [Effect of luminance on contrast sensitivity <strong>and</strong> glare in the<br />
mesopic range.] Klin Monatsbl Augenheilkd 1999;214:401–6.<br />
27. Kohnen T, Terzi E, Bühren J, Kohnen EM. Comparison of a digital<br />
<strong>and</strong> a h<strong>and</strong>held infrared pupillometer for determining scotopic pupil<br />
diameter. J Cataract Refract Surg 2003;29:112–7.<br />
28. Elliott DB, Bullimore MA, Bailey IL. Improving the reliability of the<br />
Pelli-Robson contrast sensitivity test. Clin Vis Sci1991;6: 471–5.<br />
29. Smith PW, Pratzer KA, Webster N, Fenton J, Bonham RD. A clinical<br />
comparison of two methods of glare testing. Ophthalmic Surg 1987;<br />
18:680–2.<br />
30. Marcos S. Aberrations <strong>and</strong> visual performance following st<strong>and</strong>ard<br />
laser vision correction. J Refract Surg 2001;17:S596–601.<br />
31. Applegate RA, Hilmantel G, Howl<strong>and</strong> HC, Tu EY, Starck T, Zayac<br />
EJ. Corneal first surface optical aberrations <strong>and</strong> visual performance. J<br />
Refract Surg 2000;16:507–14.<br />
32. Bl<strong>and</strong> JM, Altman DG. Statistical methods for assessing agreement between<br />
two methods of clinical measurement. Lancet 1986;1:307–10.<br />
33. Swets JA. Sensitivities <strong>and</strong> specificities of diagnostic tests. JAMA<br />
1982;248:548–50.<br />
34. Ginsburg AP. Visual information processing based on spatial filters<br />
constrained by biological data. PhD dissertation; Cambridge<br />
University; 1978.<br />
35. van den Berg TJ. On the relation between glare <strong>and</strong> straylight. Doc<br />
Ophthalmol 1991;78:177–81.<br />
36. Martinez CE, Applegate RA, Klyce SD, McDonald MB, Medina JP,<br />
Howl<strong>and</strong> HC. Effect of pupillary dilation on corneal optical aberrations<br />
after photorefractive keratectomy. Arch Ophthalmol 1998;<br />
116:1053–62.<br />
37. Bühren J, Kühne C, Kohnen T. Influence of pupil <strong>and</strong> optical zone<br />
diameter on higher-order aberrations after wavefront-guided myopic<br />
LASIK. J Cataract Refract Surg 2005;31:2272–80.<br />
38. Paulsson LE, Sjostr<strong>and</strong> J. <strong>Contrast</strong> sensitivity in the presence of a<br />
glare light. <strong>The</strong>oretical concepts <strong>and</strong> preliminary clinical studies. Invest<br />
Ophthalmol Vis Sci 1980;19:401–6.<br />
39. Artal P, Ferro M, Mir<strong>and</strong>a I, Navarro R. Effects of aging in retinal image<br />
quality. J Opt Soc Am A Opt Image Sci Vis 1993;10:1656–62.<br />
40. Mantyjarvi M, Laitinen T. Normal values for the Pelli-Robson<br />
contrast sensitivity test. J Cataract Refract Surg 2001;27:261–6.<br />
41. Puell MC, Palomo C, Sanchez-Ramos C, Villena C. Normal values<br />
for photopic <strong>and</strong> mesopic letter contrast sensitivity. J Refract Surg<br />
2004;20:484–8.<br />
42. Reeves BC, Wood JM, Hill AR. Reliability of high- <strong>and</strong> low-contrast<br />
letter charts. Ophthal Physiol Opt 1993;13:17–26.<br />
43. Reeves BC, Wood JM, Hill AR. Vistech VCTS 6500 charts—within<strong>and</strong><br />
between-session reliability. Optom Vis Sci 1991;68:728–37.<br />
Thomas Kohnen<br />
Johann Wolfgang Goethe-University<br />
Department of Ophthalmology<br />
<strong>The</strong>odor-Stern-Kai 7 60590<br />
<strong>Frankfurt</strong> am Main, Germany<br />
e-mail: kohnen@em.uni-frankfurt.de