Stuart L. Gillan, Jay C. Hartzell, Andrew Koch, and ... - Pitt Business
Stuart L. Gillan, Jay C. Hartzell, Andrew Koch, and ... - Pitt Business
Stuart L. Gillan, Jay C. Hartzell, Andrew Koch, and ... - Pitt Business

Create successful ePaper yourself
Turn your PDF publications into a flip-book with our unique Google optimized e-Paper software.
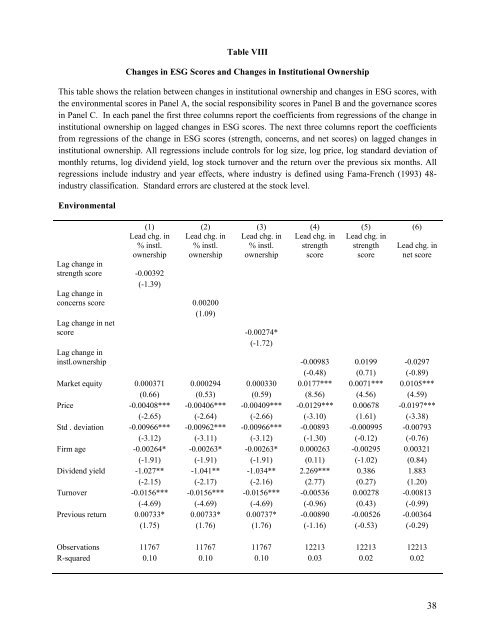
Table VIII<br />
Changes in ESG Scores <strong>and</strong> Changes in Institutional Ownership<br />
This table shows the relation between changes in institutional ownership <strong>and</strong> changes in ESG scores, with<br />
the environmental scores in Panel A, the social responsibility scores in Panel B <strong>and</strong> the governance scores<br />
in Panel C. In each panel the first three columns report the coefficients from regressions of the change in<br />
institutional ownership on lagged changes in ESG scores. The next three columns report the coefficients<br />
from regressions of the change in ESG scores (strength, concerns, <strong>and</strong> net scores) on lagged changes in<br />
institutional ownership. All regressions include controls for log size, log price, log st<strong>and</strong>ard deviation of<br />
monthly returns, log dividend yield, log stock turnover <strong>and</strong> the return over the previous six months. All<br />
regressions include industry <strong>and</strong> year effects, where industry is defined using Fama-French (1993) 48industry<br />
classification. St<strong>and</strong>ard errors are clustered at the stock level.<br />
Environmental<br />
(1) (2) (3) (4) (5) (6)<br />
Lead chg. in<br />
% instl.<br />
ownership<br />
Lead chg. in<br />
% instl.<br />
ownership<br />
Lead chg. in<br />
% instl.<br />
ownership<br />
Lead chg. in<br />
strength<br />
score<br />
Lead chg. in<br />
strength<br />
score<br />
Lead chg. in<br />
net score<br />
Lag change in<br />
strength score -0.00392<br />
(-1.39)<br />
Lag change in<br />
concerns score 0.00200<br />
(1.09)<br />
Lag change in net<br />
score -0.00274*<br />
(-1.72)<br />
Lag change in<br />
instl.ownership -0.00983 0.0199 -0.0297<br />
(-0.48) (0.71) (-0.89)<br />
Market equity 0.000371 0.000294 0.000330 0.0177*** 0.0071*** 0.0105***<br />
(0.66) (0.53) (0.59) (8.56) (4.56) (4.59)<br />
Price -0.00408*** -0.00406*** -0.00409*** -0.0129*** 0.00678 -0.0197***<br />
(-2.65) (-2.64) (-2.66) (-3.10) (1.61) (-3.38)<br />
Std . deviation -0.00966*** -0.00962*** -0.00966*** -0.00893 -0.000995 -0.00793<br />
(-3.12) (-3.11) (-3.12) (-1.30) (-0.12) (-0.76)<br />
Firm age -0.00264* -0.00263* -0.00263* 0.000263 -0.00295 0.00321<br />
(-1.91) (-1.91) (-1.91) (0.11) (-1.02) (0.84)<br />
Dividend yield -1.027** -1.041** -1.034** 2.269*** 0.386 1.883<br />
(-2.15) (-2.17) (-2.16) (2.77) (0.27) (1.20)<br />
Turnover -0.0156*** -0.0156*** -0.0156*** -0.00536 0.00278 -0.00813<br />
(-4.69) (-4.69) (-4.69) (-0.96) (0.43) (-0.99)<br />
Previous return 0.00733* 0.00733* 0.00737* -0.00890 -0.00526 -0.00364<br />
(1.75) (1.76) (1.76) (-1.16) (-0.53) (-0.29)<br />
Observations 11767 11767 11767 12213 12213 12213<br />
R-squared 0.10 0.10 0.10 0.03 0.02 0.02<br />
38