Stuart L. Gillan, Jay C. Hartzell, Andrew Koch, and ... - Pitt Business
Stuart L. Gillan, Jay C. Hartzell, Andrew Koch, and ... - Pitt Business
Stuart L. Gillan, Jay C. Hartzell, Andrew Koch, and ... - Pitt Business

Create successful ePaper yourself
Turn your PDF publications into a flip-book with our unique Google optimized e-Paper software.
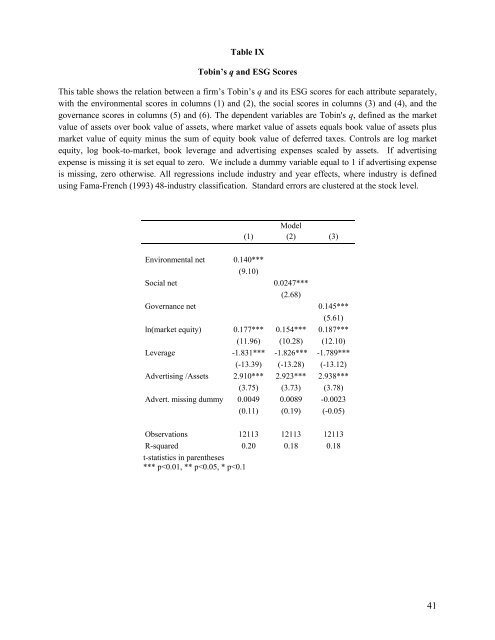
Table IX<br />
Tobin’s q <strong>and</strong> ESG Scores<br />
This table shows the relation between a firm’s Tobin’s q <strong>and</strong> its ESG scores for each attribute separately,<br />
with the environmental scores in columns (1) <strong>and</strong> (2), the social scores in columns (3) <strong>and</strong> (4), <strong>and</strong> the<br />
governance scores in columns (5) <strong>and</strong> (6). The dependent variables are Tobin's q, defined as the market<br />
value of assets over book value of assets, where market value of assets equals book value of assets plus<br />
market value of equity minus the sum of equity book value of deferred taxes. Controls are log market<br />
equity, log book-to-market, book leverage <strong>and</strong> advertising expenses scaled by assets. If advertising<br />
expense is missing it is set equal to zero. We include a dummy variable equal to 1 if advertising expense<br />
is missing, zero otherwise. All regressions include industry <strong>and</strong> year effects, where industry is defined<br />
using Fama-French (1993) 48-industry classification. St<strong>and</strong>ard errors are clustered at the stock level.<br />
Model<br />
(1) (2) (3)<br />
Environmental net 0.140***<br />
(9.10)<br />
Social net 0.0247***<br />
(2.68)<br />
Governance net 0.145***<br />
(5.61)<br />
ln(market equity) 0.177*** 0.154*** 0.187***<br />
(11.96) (10.28) (12.10)<br />
Leverage -1.831*** -1.826*** -1.789***<br />
(-13.39) (-13.28) (-13.12)<br />
Advertising /Assets 2.910*** 2.923*** 2.938***<br />
(3.75) (3.73) (3.78)<br />
Advert. missing dummy 0.0049 0.0089 -0.0023<br />
(0.11) (0.19) (-0.05)<br />
Observations 12113 12113 12113<br />
R-squared 0.20 0.18 0.18<br />
t-statistics in parentheses<br />
*** p