

Download this report as a 94-page PDF - USGS
Download this report as a 94-page PDF - USGS
Download this report as a 94-page PDF - USGS

Create successful ePaper yourself
Turn your PDF publications into a flip-book with our unique Google optimized e-Paper software.
Analyses<br />
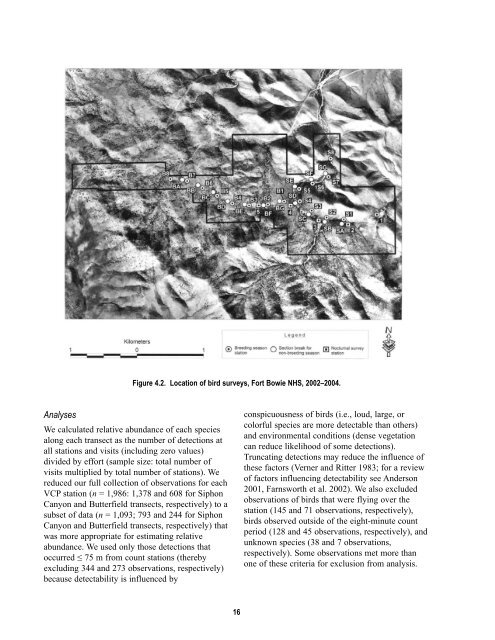
Figure 4.2. Location of bird surveys, Fort Bowie NHS, 2002–2004.<br />
We calculated relative abundance of each species<br />
along each transect <strong>as</strong> the number of detections at<br />
all stations and visits (including zero values)<br />
divided by effort (sample size: total number of<br />
visits multiplied by total number of stations). We<br />
reduced our full collection of observations for each<br />
VCP station (n = 1,986: 1,378 and 608 for Siphon<br />
Canyon and Butterfield transects, respectively) to a<br />
subset of data (n = 1,093; 793 and 244 for Siphon<br />
Canyon and Butterfield transects, respectively) that<br />
w<strong>as</strong> more appropriate for estimating relative<br />
abundance. We used only those detections that<br />
occurred ≤ 75 m from count stations (thereby<br />
excluding 344 and 273 observations, respectively)<br />
because detectability is influenced by<br />
16<br />
conspicuousness of birds (i.e., loud, large, or<br />
colorful species are more detectable than others)<br />
and environmental conditions (dense vegetation<br />
can reduce likelihood of some detections).<br />
Truncating detections may reduce the influence of<br />
these factors (Verner and Ritter 1983; for a review<br />
of factors influencing detectability see Anderson<br />
2001, Farnsworth et al. 2002). We also excluded<br />
observations of birds that were flying over the<br />
station (145 and 71 observations, respectively),<br />
birds observed outside of the eight-minute count<br />
period (128 and 45 observations, respectively), and<br />
unknown species (38 and 7 observations,<br />
respectively). Some observations met more than<br />
one of these criteria for exclusion from analysis.


