- Page 1 and 2: Agriculture at a Crossroads Crossro
- Page 4 and 5: IAASTD International Assessment of
- Page 6: Contents vii viii ix 1 57 145 255 3
- Page 9 and 10: Foreword The objective of the Inter
- Page 11 and 12: x | Preface end users) and that it
- Page 14 and 15: 1 Context, Conceptual Framework and
- Page 16 and 17: diseases associated with metabolic
- Page 18 and 19: Table 1-1. Differences between a re
- Page 20 and 21: Figure 1-2. Global trends in cereal
- Page 22 and 23: Figure 1-4. Small-scale farmer hete
- Page 24 and 25: tion. The basic unit for food secur
- Page 26 and 27: Figure 1-7. Conceptual framework of
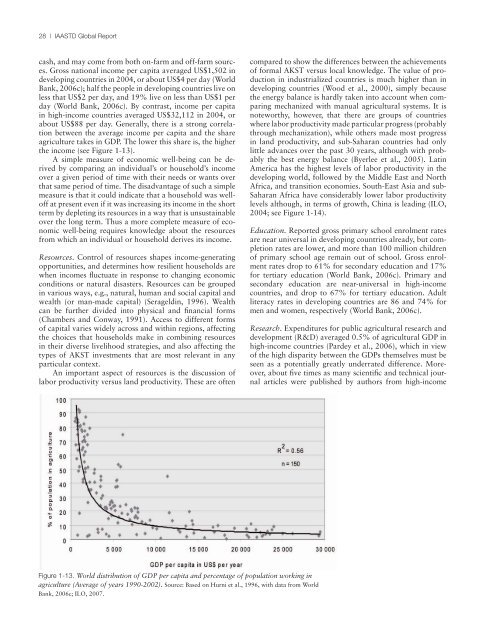
- Page 28 and 29: Figure 1-8. Poverty by region, 1990
- Page 30 and 31: to the poorest. In particular much
- Page 32 and 33: was industrialized and has been use
- Page 34 and 35: Table 1-3. Positive functions of ag
- Page 36 and 37: for animal protein in diets, exacer
- Page 38 and 39: Figure 1-11. Scenarios of land requ
- Page 42 and 43: Figure 1-14. Labor productivity in
- Page 44 and 45: evidenced in a society’s treatmen
- Page 46 and 47: Figure 1-16. Relationship between p
- Page 48 and 49: tions determines a distinctive morb
- Page 50 and 51: where reefs had been degraded exemp
- Page 52 and 53: also be found in predatory species
- Page 54 and 55: systems, crop diversity is still be
- Page 56 and 57: functional nature of agriculture ma
- Page 58 and 59: and contribute to growth through br
- Page 60 and 61: Figure 1-20. Percentage of women in
- Page 62 and 63: 1.4.3 Indicators in the IAASTD The
- Page 64 and 65: though they themselves have complet
- Page 66 and 67: FAO. 2006a. The state of food and a
- Page 68 and 69: an estimate of the environmental bu
- Page 70 and 71: 2 Historical Analysis of the Effect
- Page 72 and 73: 8. Public policy, regulatory framew
- Page 74 and 75: A disadvantaged activity. Agricultu
- Page 76 and 77: knowledge (Beal et al., 1986). The
- Page 78 and 79: e taken into account in targeting t
- Page 80 and 81: orchards (Bhutan, Vietnam and more
- Page 82 and 83: positive knock-on effects for the p
- Page 84 and 85: Development agency and the FAO’s
- Page 86 and 87: driven mainly by for-profit drivers
- Page 88 and 89: gained in working with civil societ
- Page 90 and 91:
Table 2-3 continued Label Features
- Page 92 and 93:
Africa’s “rainbow revolution”
- Page 94 and 95:
Table 2-4. Constraints of universit
- Page 96 and 97:
The tropical AKST institutions esta
- Page 98 and 99:
in agricultural extension and advis
- Page 100 and 101:
interacts with both the state (publ
- Page 102 and 103:
Box 2-1. Timeline of genetic resour
- Page 104 and 105:
countries, especially developing na
- Page 106 and 107:
esources remains a major goal. Defi
- Page 108 and 109:
Box 2-6. Emergence of genetic engin
- Page 110 and 111:
Table 2-5. Public-private partnersh
- Page 112 and 113:
ment extension personnel served als
- Page 114 and 115:
Box 2-7. Integrated Pest Management
- Page 116 and 117:
Box 2-8. continued Opportunities an
- Page 118 and 119:
Bank, 1998a). Subsequent external a
- Page 120 and 121:
(UNCED, 1993), and the UN IFCS (Box
- Page 122 and 123:
Figure 2-6. Potentially problematic
- Page 124 and 125:
Box 2-10. Evolution of the term foo
- Page 126 and 127:
Box 2-12. Common microbiological co
- Page 128 and 129:
Box 2-14. Via Campesina’s food so
- Page 130 and 131:
Table 2-6. Health implications of a
- Page 132 and 133:
duces the options available for res
- Page 134 and 135:
Committee on Science and Technology
- Page 136 and 137:
Buck, L.E., J.P. Lassoie, E.C.M. Fe
- Page 138 and 139:
Crozier, M., and E. Friedberg. 1980
- Page 140 and 141:
FAO. 1995a. Prevention and disposal
- Page 142 and 143:
para la evaluación científica. Po
- Page 144 and 145:
Huus-Bruun, T. 1992. Field vegetabl
- Page 146 and 147:
Lessons from Africa. Johns Hopkins
- Page 148 and 149:
Murphy, B.C., J.A. Rosenheim, J. Gr
- Page 150 and 151:
Pontius, J., R. Dilts, and A. Bartl
- Page 152 and 153:
Schultz, T.W. 1964. Transforming tr
- Page 154 and 155:
UNCED. 1993. Rio Declaration on Env
- Page 156:
Wolfenbarger, L., and P. Phifer. 20
- Page 159 and 160:
146 | IAASTD Global Report Key Mess
- Page 161 and 162:
148 | IAASTD Global Report The main
- Page 163 and 164:
150 | IAASTD Global Report A C B D
- Page 165 and 166:
152 | IAASTD Global Report varietie
- Page 167 and 168:
154 | IAASTD Global Report habitats
- Page 169 and 170:
156 | IAASTD Global Report Overall,
- Page 171 and 172:
158 | IAASTD Global Report Cassman
- Page 173 and 174:
160 | IAASTD Global Report potentia
- Page 175 and 176:
162 | IAASTD Global Report Biologic
- Page 177 and 178:
164 | IAASTD Global Report impacts
- Page 179 and 180:
166 | IAASTD Global Report gene (Ma
- Page 181 and 182:
168 | IAASTD Global Report transpor
- Page 183 and 184:
170 | IAASTD Global Report applicat
- Page 185 and 186:
172 | IAASTD Global Report Site-spe
- Page 187 and 188:
174 | IAASTD Global Report 1991). I
- Page 189 and 190:
176 | IAASTD Global Report Deeply-r
- Page 191 and 192:
178 | IAASTD Global Report Small-sc
- Page 193 and 194:
180 | IAASTD Global Report market p
- Page 195 and 196:
182 | IAASTD Global Report involvin
- Page 197 and 198:
184 | IAASTD Global Report tropical
- Page 199 and 200:
186 | IAASTD Global Report hence th
- Page 201 and 202:
188 | IAASTD Global Report distingu
- Page 203 and 204:
190 | IAASTD Global Report Soil-bas
- Page 205 and 206:
192 | IAASTD Global Report Traditio
- Page 207 and 208:
194 | IAASTD Global Report success,
- Page 209 and 210:
196 | IAASTD Global Report rest is
- Page 211 and 212:
198 | IAASTD Global Report AKST has
- Page 213 and 214:
200 | IAASTD Global Report Food saf
- Page 215 and 216:
202 | IAASTD Global Report negative
- Page 217 and 218:
204 | IAASTD Global Report conventi
- Page 219 and 220:
206 | IAASTD Global Report Local kn
- Page 221 and 222:
208 | IAASTD Global Report There ha
- Page 223 and 224:
210 | IAASTD Global Report Due to a
- Page 225 and 226:
212 | IAASTD Global Report Major so
- Page 227 and 228:
214 | IAASTD Global Report • The
- Page 229 and 230:
216 | IAASTD Global Report Deforest
- Page 231 and 232:
218 | IAASTD Global Report Typicall
- Page 233 and 234:
220 | IAASTD Global Report above an
- Page 235 and 236:
222 | IAASTD Global Report Research
- Page 237 and 238:
224 | IAASTD Global Report “disco
- Page 239 and 240:
226 | IAASTD Global Report Ali, M.,
- Page 241 and 242:
228 | IAASTD Global Report 2004a. R
- Page 243 and 244:
230 | IAASTD Global Report Cernea,
- Page 245 and 246:
232 | IAASTD Global Report Conf. Av
- Page 247 and 248:
234 | IAASTD Global Report producti
- Page 249 and 250:
236 | IAASTD Global Report Hamilton
- Page 251 and 252:
238 | IAASTD Global Report Jamieson
- Page 253 and 254:
240 | IAASTD Global Report Leakey,
- Page 255 and 256:
242 | IAASTD Global Report McCauley
- Page 257 and 258:
244 | IAASTD Global Report Oba, G.,
- Page 259 and 260:
246 | IAASTD Global Report Quizon,
- Page 261 and 262:
248 | IAASTD Global Report Schroth,
- Page 263 and 264:
250 | IAASTD Global Report Taneja,
- Page 265 and 266:
252 | IAASTD Global Report Wall, G.
- Page 268 and 269:
4 Outlook on Agricultural Change an
- Page 270 and 271:
first generation biofuels. Most ass
- Page 272 and 273:
Figure 4-2. Complexity and uncertai
- Page 274 and 275:
Table 4-1. Overview of relevant glo
- Page 276 and 277:
Table 4-4. Population projections i
- Page 278 and 279:
four SRES scenarios, the four Mille
- Page 280 and 281:
Figure 4-7. Income terms of trade f
- Page 282 and 283:
food systems and AKST. Hence, it wi
- Page 284 and 285:
Figure 4-10. Global trends of techn
- Page 286 and 287:
need to include management of compl
- Page 288 and 289:
(3) shifts in demographic patterns,
- Page 290 and 291:
Table 4-10. Per capita food consump
- Page 292 and 293:
Figure 4-17. Average global food av
- Page 294 and 295:
(average) fertilizer use, many fiel
- Page 296 and 297:
Outlook on Agricultural Changes and
- Page 298 and 299:
Emissions (GtC) Figure 4-21. Compar
- Page 300 and 301:
slight warming (Figure 4-25) becaus
- Page 302 and 303:
Outlook on Agricultural Changes and
- Page 304 and 305:
Box 4-4. Controversies on bioenergy
- Page 306 and 307:
that over the long-term, the growth
- Page 308 and 309:
elevant also from an ecological per
- Page 310 and 311:
Figure 4-31. Harvested area for cer
- Page 312 and 313:
trends towards the intensified syst
- Page 314 and 315:
ers of the agricultural system and
- Page 316 and 317:
and land cover in the German highla
- Page 318:
Environ. Inform. Coalition, Nat. Co
- Page 321 and 322:
308 | IAASTD Global Report Key Mess
- Page 323 and 324:
310 | IAASTD Global Report made vis
- Page 325 and 326:
312 | IAASTD Global Report were dev
- Page 327 and 328:
314 | IAASTD Global Report catch da
- Page 329 and 330:
316 | IAASTD Global Report are also
- Page 331 and 332:
318 | IAASTD Global Report Table 5-
- Page 333 and 334:
320 | IAASTD Global Report cerning
- Page 335 and 336:
322 | IAASTD Global Report Box 5-1.
- Page 337 and 338:
324 | IAASTD Global Report Table 5-
- Page 339 and 340:
326 | IAASTD Global Report quality
- Page 341 and 342:
328 | IAASTD Global Report Figure 5
- Page 343 and 344:
330 | IAASTD Global Report Figure 5
- Page 345 and 346:
332 | IAASTD Global Report The key
- Page 347 and 348:
334 | IAASTD Global Report Box 5-2.
- Page 349 and 350:
336 | IAASTD Global Report Box 5-2.
- Page 351 and 352:
338 | IAASTD Global Report Table 5-
- Page 353 and 354:
340 | IAASTD Global Report Figure 5
- Page 355 and 356:
342 | IAASTD Global Report Fortunat
- Page 357 and 358:
344 | IAASTD Global Report Table 5-
- Page 359 and 360:
346 | IAASTD Global Report Table 5-
- Page 361 and 362:
348 | IAASTD Global Report Figure 5
- Page 363 and 364:
350 | IAASTD Global Report 5.5.2.2
- Page 365 and 366:
352 | IAASTD Global Report Reidhead
- Page 367 and 368:
354 | IAASTD Global Report able res
- Page 369 and 370:
356 | IAASTD Global Report Food pri
- Page 371 and 372:
358 | IAASTD Global Report Table A.
- Page 373 and 374:
360 | IAASTD Global Report Table A.
- Page 375 and 376:
362 | IAASTD Global Report Table A.
- Page 377 and 378:
364 | IAASTD Global Report comprehe
- Page 379 and 380:
366 | IAASTD Global Report assumes
- Page 381 and 382:
368 | IAASTD Global Report Table A.
- Page 383 and 384:
370 | IAASTD Global Report Table A.
- Page 385 and 386:
372 | IAASTD Global Report Bakkenes
- Page 387 and 388:
374 | IAASTD Global Report Kurien,
- Page 389 and 390:
376 | IAASTD Global Report Rep. UNE
- Page 391 and 392:
378 | IAASTD Global Report Key Mess
- Page 393 and 394:
380 | IAASTD Global Report Table 6-
- Page 395 and 396:
382 | IAASTD Global Report Table 6-
- Page 397 and 398:
384 | IAASTD Global Report Table 6-
- Page 399 and 400:
386 | IAASTD Global Report Methods
- Page 401 and 402:
388 | IAASTD Global Report function
- Page 403 and 404:
390 | IAASTD Global Report linked t
- Page 405 and 406:
392 | IAASTD Global Report 6.3.1.1
- Page 407 and 408:
394 | IAASTD Global Report populati
- Page 409 and 410:
396 | IAASTD Global Report 6.4 Impr
- Page 411 and 412:
398 | IAASTD Global Report particip
- Page 413 and 414:
400 | IAASTD Global Report with lar
- Page 415 and 416:
402 | IAASTD Global Report et al.,
- Page 417 and 418:
404 | IAASTD Global Report Table 6-
- Page 419 and 420:
406 | IAASTD Global Report elements
- Page 421 and 422:
408 | IAASTD Global Report utilized
- Page 423 and 424:
410 | IAASTD Global Report versifyi
- Page 425 and 426:
412 | IAASTD Global Report bility a
- Page 427 and 428:
414 | IAASTD Global Report Table 6-
- Page 429 and 430:
416 | IAASTD Global Report ferent t
- Page 431 and 432:
418 | IAASTD Global Report derstand
- Page 433 and 434:
420 | IAASTD Global Report conditio
- Page 435 and 436:
422 | IAASTD Global Report The scop
- Page 437 and 438:
424 | IAASTD Global Report of trans
- Page 439 and 440:
426 | IAASTD Global Report Referenc
- Page 441 and 442:
428 | IAASTD Global Report of Agric
- Page 443 and 444:
430 | IAASTD Global Report harming
- Page 445 and 446:
432 | IAASTD Global Report E. Weber
- Page 447 and 448:
434 | IAASTD Global Report in subtr
- Page 449 and 450:
436 | IAASTD Global Report developm
- Page 451 and 452:
438 | IAASTD Global Report producti
- Page 453 and 454:
440 | IAASTD Global Report Welches,
- Page 455 and 456:
442 | IAASTD Global Report Key Mess
- Page 457 and 458:
444 | IAASTD Global Report for food
- Page 459 and 460:
446 | IAASTD Global Report Under th
- Page 461 and 462:
448 | IAASTD Global Report of PGRFA
- Page 463 and 464:
450 | IAASTD Global Report creation
- Page 465 and 466:
452 | IAASTD Global Report 7.2 Trad
- Page 467 and 468:
454 | IAASTD Global Report scale pr
- Page 469 and 470:
456 | IAASTD Global Report Figure 7
- Page 471 and 472:
458 | IAASTD Global Report Figure 7
- Page 473 and 474:
460 | IAASTD Global Report is under
- Page 475 and 476:
462 | IAASTD Global Report those pr
- Page 477 and 478:
464 | IAASTD Global Report the coun
- Page 479 and 480:
466 | IAASTD Global Report lar comm
- Page 481 and 482:
468 | IAASTD Global Report and regi
- Page 483 and 484:
470 | IAASTD Global Report Figure 7
- Page 485 and 486:
472 | IAASTD Global Report fully fr
- Page 487 and 488:
474 | IAASTD Global Report tries of
- Page 489 and 490:
476 | IAASTD Global Report requirem
- Page 491 and 492:
478 | IAASTD Global Report ditions
- Page 493 and 494:
480 | IAASTD Global Report This iss
- Page 495 and 496:
482 | IAASTD Global Report Saharan
- Page 497 and 498:
484 | IAASTD Global Report It can b
- Page 499 and 500:
486 | IAASTD Global Report institut
- Page 501 and 502:
488 | IAASTD Global Report agents a
- Page 503 and 504:
490 | IAASTD Global Report Lavigne
- Page 505 and 506:
492 | IAASTD Global Report Shand, H
- Page 508 and 509:
8 Agricultural Knowledge, Science a
- Page 510 and 511:
will be needed to carefully monitor
- Page 512 and 513:
ate in total spending in China and
- Page 514 and 515:
Box 8-1. Plant breeding and biotech
- Page 516 and 517:
Table 8-4 Total S&T spending by reg
- Page 518 and 519:
number of centers increased to twel
- Page 520 and 521:
programs to teams of Filipino scien
- Page 522 and 523:
Figure 8-6. Country-level sources o
- Page 524 and 525:
and there are alternative plausible
- Page 526 and 527:
Table 8-9. Summary of Internal Rate
- Page 528 and 529:
Table 8-11. Rates of return by comm
- Page 530 and 531:
values. Furthermore, the aggregated
- Page 532 and 533:
Agricultural Knowledge, Science and
- Page 534 and 535:
Table 8-15. Positive contributions
- Page 536 and 537:
A study covering twelve different c
- Page 538 and 539:
concepts, absolute and relative pov
- Page 540 and 541:
growth rates of agricultural output
- Page 542 and 543:
Governance can also be viewed at mu
- Page 544 and 545:
8.3.3.2 International donors Broadl
- Page 546 and 547:
negative perceptions of public and
- Page 548 and 549:
1999), care is needed to ensure tha
- Page 550 and 551:
sources, their culture, their insti
- Page 552 and 553:
Agricultural Knowledge, Science and
- Page 554 and 555:
adoption of pro-poor technologies f
- Page 556 and 557:
velopment of policies such as payme
- Page 558 and 559:
systems. Dep. Agric. Econ. Staff Pa
- Page 560 and 561:
Lucca, P., R. Hurrell, and I. Potry
- Page 562 and 563:
Shavall, S., and T. Ypserle. 2001.
- Page 564 and 565:
Annex A Authors and Review Editors
- Page 566 and 567:
Mark van Oorschot • Netherlands E
- Page 568 and 569:
Annex B Peer Reviewers Argentina St
- Page 570 and 571:
Netherlands Huub Loffler • Wageni
- Page 572 and 573:
Craig Osteen • U.S. Department of
- Page 574 and 575:
Average Rate of Return Average rate
- Page 576 and 577:
ut also society at large. Governmen
- Page 578 and 579:
Knowledge Society A society in whic
- Page 580 and 581:
Subsidy Transfer of resources to an
- Page 582 and 583:
EVM Ethnoveterinary medicine FACE F
- Page 584 and 585:
UNCED UN Conference on Environment
- Page 586 and 587:
Judi Wakhungu, Executive Director,
- Page 588 and 589:
Annex F Secretariat and Cosponsor F
- Page 590 and 591:
Index Note: Any italicized page num
- Page 592 and 593:
Biosafety: Cartagena Protocol on Bi
- Page 594 and 595:
community members and, 58; options,
- Page 596 and 597:
Hazard Analysis and Critical Contro
- Page 598 and 599:
modeling projections, 316-317, 317,
- Page 600 and 601:
mitigation, 330-331, 331; increased
- Page 602 and 603:
442; India and, 335, 337; negative
- Page 606:
SCIENCE | AGRICULTURE | CURRENT AFF