SOFTWARE FOR ON-FARM IRRIGATION SCHEDULING ... - citaREA
SOFTWARE FOR ON-FARM IRRIGATION SCHEDULING ... - citaREA
SOFTWARE FOR ON-FARM IRRIGATION SCHEDULING ... - citaREA

You also want an ePaper? Increase the reach of your titles
YUMPU automatically turns print PDFs into web optimized ePapers that Google loves.
1<br />
2<br />
3<br />
4<br />
5<br />
6<br />
7<br />
8<br />
9<br />
10<br />
11<br />
12<br />
13<br />
14<br />
15<br />
16<br />
17<br />
18<br />
19<br />
Abstract<br />
<strong>SOFTWARE</strong> <strong>FOR</strong> <strong>ON</strong>-<strong>FARM</strong> IRRIGATI<strong>ON</strong> <strong>SCHEDULING</strong> OF<br />
ST<strong>ON</strong>E FRUIT ORCHARDS UNDER WATER LIMITATI<strong>ON</strong>S<br />
by<br />
Zapata, N. 1 *, Chalgaf, I. 2 , Nerilli, E. 3 , Latorre, B. 1 ,<br />
López, C. 1 , Martínez-Cob, A. 1 , Girona, J. 4 and Playán, E. 1<br />
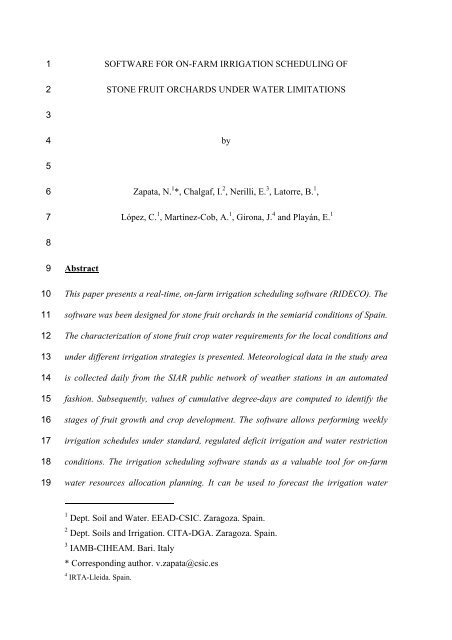
This paper presents a real-time, on-farm irrigation scheduling software (RIDECO). The<br />
software was been designed for stone fruit orchards in the semiarid conditions of Spain.<br />
The characterization of stone fruit crop water requirements for the local conditions and<br />
under different irrigation strategies is presented. Meteorological data in the study area<br />
is collected daily from the SIAR public network of weather stations in an automated<br />
fashion. Subsequently, values of cumulative degree-days are computed to identify the<br />
stages of fruit growth and crop development. The software allows performing weekly<br />
irrigation schedules under standard, regulated deficit irrigation and water restriction<br />
conditions. The irrigation scheduling software stands as a valuable tool for on-farm<br />
water resources allocation planning. It can be used to forecast the irrigation water<br />
1<br />
Dept. Soil and Water. EEAD-CSIC. Zaragoza. Spain.<br />
2<br />
Dept. Soils and Irrigation. CITA-DGA. Zaragoza. Spain.<br />
3<br />
IAMB-CIHEAM. Bari. Italy<br />
* Corresponding author. v.zapata@csic.es<br />
4<br />
IRTA-Lleida. Spain.
20<br />
21<br />
22<br />
23<br />
24<br />
25<br />
26<br />
27<br />
28<br />
required to meet seasonal meteorological, agronomical and managerial scenarios in<br />
stone fruit orchards. RIDECO can also be used to plan deficit irrigation strategies in<br />
cases of severe water restrictions. The software can be parameterized to adjust to<br />
specific varieties and local farming conditions. A variety of graphs assist irrigation<br />
managers in their decisions.<br />
Keywords<br />
Irrigation scheduling software, Regulated Deficit Irrigation, Fruit Trees, Growing<br />
Degree-Days, Crop Stages, Fruit Growth, Crop Coefficients.
29<br />
30<br />
31<br />
32<br />
33<br />
34<br />
35<br />
36<br />
37<br />
38<br />
39<br />
40<br />
41<br />
42<br />
43<br />
44<br />
45<br />
46<br />
47<br />
48<br />
49<br />
50<br />
51<br />
52<br />
1. Introduction<br />
In semi-arid areas, as in most of Spain, the productivity of stone fruit orchards heavily<br />
depends on irrigation. The area devoted to stone fruits in Spain is 215,500 ha (MARM,<br />
2010). 86% of this area is irrigated, with a total production of 2.9 million tons.<br />
Advanced irrigation techniques (such as Regulated Deficit Irrigation, RDI) offer to this<br />
productive sector the opportunity to conserve irrigation water, improve fruit quality and<br />
reduce the cost of pruning (Fereres and Soriano, 2007).<br />
The application of advanced irrigation techniques requires previous knowledge of<br />
standard irrigation techniques, which are based on crop water requirements.<br />
Recommendations on crop coefficients (Kc) are often site and year specific, and have<br />
been reported to depend on local reference evapotranspiration (ETo), rainfall, and crop<br />
management practices (Allen et al., 1998). Several authors have compared the results<br />
obtained using the standard FAO 56 approach (Allen et al., 1998) with measured<br />
evapotranspiration using various approaches (Casa et al., 2000; Allen, 2000; Lascano,<br />
2000; Dragoni et al., 2004). These comparisons have often shown a significant<br />
overestimation of basal crop coefficients when the FAO 56 method was used, as compared<br />
to evapotranspiration measurements (Paco et al., 2006). Therefore, local adaptation of the<br />
standard approach seems to be required before advanced irrigation management can be<br />
implemented in fruit orchards.<br />
Regulated deficit irrigation (RDI) has been documented in the literature as a successful<br />
strategy for water conservation in fruit orchards. RDI has enjoyed more success in tree<br />
crops and vines than in field crops (Fereres and Soriano, 2007). This technique is based<br />
on: 1) plant sensitivity to water stress varies among phenological stages; and 2) water<br />
stress at specific phenological periods can help control growth and vegetative-fruit
53<br />
54<br />
55<br />
56<br />
57<br />
58<br />
59<br />
60<br />
61<br />
62<br />
63<br />
64<br />
65<br />
66<br />
67<br />
68<br />
69<br />
70<br />
71<br />
72<br />
73<br />
74<br />
75<br />
76<br />
77<br />
competition (Chalmers et al., 1981; Mitchell and Chalmers, 1982; Cameron et al.,<br />
2006).<br />
Relevant scientific efforts have been devoted in the last decades to the classification of<br />
phenological stages as sensitive or non sensitive to water stress. These efforts have<br />
targeted different fruit species and even varieties (Torrecillas et al., 2000; Ebel et al.,<br />
2001; Goldhamer et al., 2002; Gelly et al., 2004; Intrigliolo and Castel, 2005; and Lopez<br />
et al., 2008). Other authors have analyzed the effect of different levels of irrigation<br />
deficit at the non sensitive stages (Girona et al., 2005; Antunez-Barria 2006; Marsal et<br />
al., 2009; Ballester et al., 2011). Results suggest that crop coefficients and RDI<br />
parameters depend on a number of variables (meteorology, irrigation system, variety,<br />
rootstock, planting density, training system, crop level and crop load), which show large<br />
variations among orchards.<br />
Growing degree-days (GDD) have long been used to model the effect of temperature on<br />
biological processes. This technique was applied in the 1960s to model the phenology<br />
of orchards (Rom and Arringto, 1966). The duration of the phenological stages and the<br />
resulting irrigation schedule adapt to the meteorological characteristics of a given year<br />
when using thermal time (Vaughn, 2005). Each species is adapted to grow over a certain<br />
minimum (base) temperature, and decline in growth at a maximum temperature.<br />
Thermal models have been applied to fruit tree orchards to determine the chilling units<br />
needed to break dormancy, and the cumulative heat requirements to bloom for different<br />
species and varieties (Anderson et al., 1986; Topp et al., 1989; Boonprakob et al., 1992;<br />
Muñoz et al., 1986; Valentini et al., 2004). These data provide information about the<br />
adaptive success of species and cultivars to different meteorological conditions.<br />
Thermal models have also been applied to forecast harvest time in orchards (Pailly et<br />
al., 1999). Normand and Léchaudel (2006) reported that the predictive capacity of those
78<br />
79<br />
80<br />
81<br />
82<br />
83<br />
84<br />
85<br />
86<br />
87<br />
88<br />
89<br />
90<br />
91<br />
92<br />
93<br />
94<br />
95<br />
96<br />
97<br />
98<br />
99<br />
100<br />
101<br />
102<br />
models heavily depends on the value of the temperature threshold, and highlighted that<br />
the base temperature for a given species can vary depending on altitude and fruit load.<br />
On the other hand, Bonhomme (2000), working with corn, indicated that the<br />
temperature threshold only has a slight influence on phenological estimates if average<br />
temperatures are well above threshold level. For peach trees, Marra et al. (2002)<br />
reported a base temperature of 7 ºC and a critical temperature of 35 ºC, while Rageau et<br />
al. (1998) and Mounzer et al. (2008) used base temperatures of 4.5 ºC and 4.0 ºC,<br />
respectively, and a critical temperature of 36 ºC. The date used to start accumulating<br />
degree-days, known as the biofix date, varies with the species and is usually based on<br />
specific biological events. Growing degree-hours (GDH) provide a more reliable way to<br />
assess the effect of air temperature on the plant development stages than GDD (Mimoun<br />
and DeJong, 1999). These authors documented that GDH for 30 days after bloom are<br />
highly correlated with yearly differences in harvest date for peach, plum and nectarine<br />
cultivars.<br />
The application of irrigation scheduling techniques to a commercial orchard requires<br />
consideration of a number of additional factors. Zapata et al. (201Xa, 201Xb) reported<br />
on the effect of the variability orchard environmental factors (soils, meteorology,<br />
species and cultivars), crop water status, and the limitations imposed by the irrigation<br />
system on orchard water requirements and irrigation performance. These authors<br />
concluded that individual irrigation schedules need to be produced for each irrigation<br />
subunit (the area irrigated by a valve). Undesirable reactive irrigation management will<br />
be required to continuously correct for water excesses and shortages if all these<br />
variables are not taken into consideration.<br />
One of the first software applications exploiting data from on-line open<br />
agrometeorological servers to produce irrigation scheduling was the WISE system
103<br />
104<br />
105<br />
106<br />
107<br />
108<br />
109<br />
110<br />
111<br />
112<br />
113<br />
114<br />
115<br />
116<br />
117<br />
118<br />
119<br />
120<br />
121<br />
122<br />
123<br />
124<br />
125<br />
(Washington Irrigation Scheduling Expert), reported by Leib et al. (2001) and Leib et al.<br />
(2002). The software was designed to perform standard irrigation scheduling for a large<br />
variety of crops and irrigation systems. One of the principles of WISE was to create a<br />
tool that producers could use without the aid of professional consultants (Leib et al.,<br />
2001). Leib et al. (2002) reported that producers of high-value crops, such as deciduous<br />
orchards, are more willing to rely on irrigation scheduling software than producers of<br />
field crops.<br />
In this research, we report on a specific software application for irrigation scheduling of<br />
stone fruit orchards under different irrigation strategies (standard and regulated deficit<br />
irrigation) and under water restrictions. This software summarizes current knowledge on<br />
advanced irrigation techniques for stone fruit orchards. The design goal was to develop<br />
a practical tool for farmers and technicians in the semi-arid stone fruit production areas<br />
of Spain. As a consequence, secondary objectives were:<br />
1. To take advantage of current developments in on-line agrometeorological servers;<br />
2. To allow average users to quickly develop irrigation schedules adapted to local<br />
conditions in an intuitive, practical fashion;<br />
3. To permit advanced users full software parameterization;<br />
4. To disseminate RDI and to adapt to dynamic water restrictions.<br />
2. Methodology<br />
2.1. Target geographical areas<br />
The real-time, on-farm irrigation scheduling software for stone fruit orchards<br />
(RIDECO) targets the major stone fruit production areas of Spain. RIDECO stands for
126<br />
127<br />
128<br />
129<br />
130<br />
131<br />
132<br />
133<br />
134<br />
135<br />
136<br />
137<br />
138<br />
139<br />
140<br />
141<br />
142<br />
143<br />
144<br />
145<br />
146<br />
147<br />
148<br />
149<br />
150<br />
“RIego DEficitario COntrolado”, RDI in Spanish. Three criteria were used to select the<br />
target geographical areas: 1) stone fruit production above 30,000 tons (MARM, 2010);<br />
2) stone fruit irrigated area above 500 ha (MARM, 2010); and 3) coverage by an on-<br />
line, open access meteorological network. The SIAR network of agricultural weather<br />
stations (http://www.magrama.gob.es/siar/), created in 1998 by the Spanish Ministry of<br />
Agriculture (MARM) in cooperation with regional governments, was selected to satisfy<br />
the third criterion above. The goals of that network include dissemination of irrigation<br />
requirements and promotion of irrigation scheduling. The SIAR network covers most<br />
irrigated areas in Spain, adapting the density of observations to the local intensity of<br />
irrigation developments. Each agricultural weather station (AWS) in the network<br />
records half-hour averages of air temperature and relative humidity, wind speed and<br />
direction, incoming solar radiation and cumulative precipitation. A web page publishes<br />
daily-updated agrometeorological information for each AWS of the SIAR network.<br />
Published information includes standardized reference evapotranspiration values<br />
estimated by the FAO Penman-Monteith method (Allen et al., 1998). Fig. 1 presents the<br />
ten provinces, located in the south and north-east of Spain, finally selected for the<br />
software, as well as the location of each AWS of the SIAR network. A total of 153<br />
weather stations were considered in the RIDECO software. The average length of the<br />
meteorological data series in 2011 was 8 years, with a minimum of 6 years. Fig. 2<br />
presents shaded contour maps of average annual precipitation (Fig. 2a) and reference<br />
evapotranspiration (ETo) (Fig. 2b) in the target area. All complete data years were used<br />
to determine these average values. About 89 % of the average precipitation values fell<br />
in the range of 300 to 600 mm year -1 . The areas with lowest annual precipitation<br />
corresponded to the central Ebro Valley (Zaragoza, Huesca and Teruel), Murcia and<br />
Badajoz. About 57 % of the long-term average ETo values fell in the range of 1,000 -
151<br />
152<br />
153<br />
154<br />
155<br />
156<br />
157<br />
158<br />
159<br />
160<br />
161<br />
162<br />
163<br />
164<br />
165<br />
166<br />
167<br />
168<br />
169<br />
170<br />
171<br />
172<br />
173<br />
174<br />
1,300 mm year -1 . The areas with highest ETo roughly corresponded to the areas with<br />
lowest precipitation. As a consequence, these areas resulted in maximum crop water<br />
requirements.<br />
2.2. Definition of the farm and the irrigation subunit<br />
The software addresses the needs of an irrigation professional, managing a number of<br />
farms in different locations. Farms are declared in the software and associated to a<br />
certain AWS. Farms are divided in subunits, each irrigated from a control valve. Each<br />
of these valves is the subject of irrigation scheduling. As a consequence, information is<br />
required on the natural environment, the agronomic traits and the irrigation system in<br />
the subunit. The subunit area characteristics, the crop species and variety are recorded in<br />
the database. The RIDECO software includes complete information for three crops:<br />
cherry, apricot and four cycles of peach (extra-early, early, medium and late maturing).<br />
Soil depth and fruit load are qualitatively assessed. The tree spacing, the number of<br />
emitters per tree, the emitter discharge and the irrigation efficiency are required to<br />
convert irrigation schedules from irrigation depth to irrigation time.<br />
2.3. Crop phenology<br />
García-Vera and Martínez-Cob (2004) proposed the following crop stages for stone fruits,<br />
adapted from the four crop stages defined in the FAO 56 manual (Allen et al., 1998): 1)<br />
initial stage, from bud swelling to start of flowering; 2) development stage, from flowering<br />
to pit hardening; 3) mid-season stage, from pit hardening to ten days after harvest; and 4)<br />
late-season stage, from ten days after harvest to leaf fall.<br />
In addition to the crop stages above, fruit growth stages are commonly used to select the<br />
timing appropriate for RDI practices (Goodwin and Boland, 2000). The fruit growth<br />
stage delimitation used in this work was proposed by Naor (2006): 1) stage FI, from
175<br />
176<br />
177<br />
178<br />
179<br />
180<br />
181<br />
182<br />
183<br />
184<br />
185<br />
186<br />
187<br />
188<br />
189<br />
190<br />
191<br />
192<br />
193<br />
194<br />
195<br />
196<br />
197<br />
198<br />
bloom to beginning of pit hardening; 2) stage FII, from beginning to end of pit<br />
hardening; 3) stage FIII, from pit hardening to fruit ripening (harvest); and 4) stage FIV,<br />
from harvest to leaf fall (postharvest). FIV was further divided into early and late<br />
postharvest phases (before and after September 1). A seasonal RDI schedule results<br />
from the overlapping of crop and fruit growth stages, and from the use of crop and<br />
deficit irrigation coefficients.<br />
Fig. 3 presents the relationships between FAO stages and fruit growth stages. These<br />
stages are used in the RIDECO software to establish standard crop water requirements<br />
and the timing of RDI. The initial FAO stage starts with bud swelling, while the initial<br />
fruit growth stage starts with blooming. The dates for bud swelling and blooming are<br />
manually set for each subunit; default values are provided for each crop and crop cycle.<br />
2.4. Crop and deficit irrigation coefficients<br />
Complete Kc data sets are not available for all the target geographical areas, with the<br />
exception of the recommendations reported by García-Vera and Martínez-Cob (2004) for<br />
the Ebro Valley (NE Spain, provinces of Huesca, Zaragoza and part of Teruel). García-<br />
Vera and Martínez-Cob (2004) adapted the FAO 56 crop coefficients (single Kc approach)<br />
to the local conditions for a number of crops, including stone fruits, and were adopted in<br />
the RIDECO software as default values (Table 1). Users can replace these default values<br />
by local, more accurate estimates; new crops and varieties can also be added to the<br />
database. The tree canopy diameter is used in the software to estimate the percent<br />
shaded area and to determine whether evapotranspiration needs to be adjusted<br />
(decreased). The approach by Fereres and Castel (1981) was used for this purpose.<br />
Crop evapotranspiration under RDI was estimated by reducing water requirements at<br />
the fruit development stages least sensible to water stress. This was accomplished by
199<br />
200<br />
201<br />
202<br />
203<br />
204<br />
205<br />
206<br />
207<br />
208<br />
209<br />
210<br />
211<br />
212<br />
213<br />
214<br />
215<br />
216<br />
217<br />
218<br />
219<br />
220<br />
221<br />
multiplying crop evapotranspiration (ETc) by a RDI coefficient (KrRDI) adopting values<br />
[0 - 1]. For cherry, apricot, and extra-early and early maturing peaches, the RDI strategy<br />
only reduced water application at postharvest stage (FIV). For medium and late<br />
maturing peaches, the RDI strategy reduced water application at fruit growth stages FII<br />
and FIV (pit hardening and postharvest, respectively). Values of KrRDI for each species<br />
and cycle were adapted from the literature (Chalmers et al., 1981; Johnson et al., 1992;<br />
Torrecillas et al., 2000; Goldhamer et al., 2002; Gelly et al., 2004; Girona et al., 2005;<br />
Dichio et al., 2007; Marsal et al., 2009). These values can be manually adjusted to local<br />
conditions by the users. Table 2 presents the minimum and maximum KrRDI for cherry,<br />
apricot and the four peach trees cycles used in this work. These coefficients are<br />
presented as a function of qualitative estimations of fruit load and soil depth following<br />
Girona et al. (2003, 2005) for peaches, Marsal et al. (2009) for cherries, and Perez-<br />
Pastor et al. (2009) and Perez-Sarmiento et al. (2010) for apricots. Table 2 has<br />
simplified those research works to obtain practical guidelines for farmers. Differences<br />
on KrRDI for different soil depths were reported by Girona et al. (2005) for peaches.<br />
These authors stated that in shallow soils fruit trees respond faster to water replacement<br />
than in deep soils. This different behavior leads to larger values of KrRDI for shallow<br />
soils than for deep soils. If the RDI strategy is chosen, the average of the maximum and<br />
minimum coefficients is selected.<br />
2.5. Thermal time modeling<br />
The cumulative growing degree-days model (Winkler et al., 1962) was used in the<br />
RIDECO software to model thermal time:<br />
leaf _ fall<br />
GDD Tav Tbase<br />
<br />
(Eq.1)<br />
Biofix _date
222<br />
223<br />
224<br />
225<br />
226<br />
227<br />
228<br />
229<br />
230<br />
231<br />
232<br />
233<br />
234<br />
235<br />
236<br />
237<br />
238<br />
239<br />
240<br />
241<br />
242<br />
243<br />
244<br />
245<br />
GDD thresholds separate the abovementioned phenological stages. Despite the fact that<br />
GDH models have been documented to be more precise than GDD models to assess<br />
crop and fruit development (Mimoun and DeJong, 1999), GDD was used in this<br />
research because it accommodates the information available at the SIAR network. The<br />
biofix date for deciduous fruit trees was defined in this work as the bloom date. The base<br />
temperatures adopted in this research were 4.0 ºC for the four peach cycles (Rageau et al.,<br />
1998; Mounzer et al., 2008) and cherries (Zavalloni et al., 2006), and 4.4 ºC for apricots<br />
(Valentini et al., 2004 and 2006). Critical temperatures of 36 ºC for peach trees (Rageau et<br />
al., 1998; Mounzer et al., 2008), and 25 ºC for cherries (Chung et al., 2009) and apricots<br />
(Guerriero and Monteleone, 2006) were adopted. These temperature parameters can be<br />
modified by the users.<br />
The dates corresponding to crop and fruit growth stages are determined for every AWS<br />
and year by the GDD model, following the thresholds presented in Table 3. Threshold<br />
values were obtained for the extra-early maturing peach from phenological observation<br />
in an orchard at the Murcia region (Mounzer et al., 2008). For the rest of crops and crop<br />
cycles, phenological observations reported in an orchard of the Ebro Valley were used<br />
(Zapata et al., 201Xa and 201Xb). Default parameters governing thermal time can be<br />
specifically edited for each subunit in order to facilitate local adaptation of the irrigation<br />
schedules.<br />
As an alternative to thermal time, the software allows simulation of crop phenology based<br />
on user-entered dates limiting phenological stages.<br />
2.6. Irrigation scheduling strategies<br />
Three irrigation strategies responding to common practical situations can be executed in<br />
the RIDECO software:
246<br />
247<br />
248<br />
249<br />
250<br />
251<br />
252<br />
253<br />
254<br />
255<br />
256<br />
257<br />
258<br />
259<br />
260<br />
261<br />
262<br />
263<br />
264<br />
265<br />
266<br />
267<br />
268<br />
269<br />
1. Standard irrigation. Application of 100% of the estimated crop water<br />
requirements. This strategy corresponds to non water-stressed areas. Even in these<br />
areas, deficit irrigation is becoming a common practice (Salvador et al., 2011)<br />
owing to fruit quality restrictions and to the cost of irrigation water and pruning<br />
operations.<br />
2. RDI strategy. Reduction of irrigation water application during periods not sensitive<br />
to water stress. The scientific community has identified relevant benefits from the<br />
adoption of this strategy. However, its widespread implementation is limited by the<br />
spatial variability of environmental factors and by irrigation performance (Zapata et<br />
al. 201Xa; Zapata et al. 201Xb). The plot-specific irrigation scheduling produced by<br />
our software is expected to contribute to its practical implementation.<br />
3. Water restrictions. The RIDECO software has been programmed to adapt to water<br />
restrictions, proposing the irrigation schedules resulting in minimum yield affection.<br />
If available irrigation water (m 3 ha -1 ) does not suffice to satisfy crop water<br />
requirements, the first step is to adopt the RDI strategy. The second step is to adopt<br />
a minimum RDI strategy, based on using the minimum KrRDI coefficients reported<br />
in the literature and stored in the RIDECO database. If this was not enough, a<br />
homogeneous and global reduction from minimum RDI would be adopted to make<br />
irrigation application match available water, introducing a reduction coefficient. The<br />
homogeneous and global reduction coefficient was computed as the ratio between<br />
the total available water and the crop water requirements for the minimum RDI<br />
strategy. The software can adapt to restrictions rising at the beginning or during the<br />
season or even to different, successive restrictions applied during the season.<br />
2.7. Types of simulation
270<br />
271<br />
272<br />
273<br />
274<br />
275<br />
276<br />
277<br />
278<br />
279<br />
280<br />
281<br />
282<br />
283<br />
284<br />
285<br />
286<br />
287<br />
288<br />
289<br />
290<br />
291<br />
292<br />
293<br />
The next step in the process is to decide among three different types of simulation:<br />
1. Real time simulation. The software produces an irrigation schedule (irrigation<br />
hours) for the following week based on the meteorology of the past week. This type<br />
of simulation is designed to control the irrigation system at real time.<br />
2. Historical simulation. This simulation can be applied using all complete annual<br />
meteorological series or user-selected meteorological subsets. Historical simulation<br />
was designed for seasonal water allocation planning under a variety of hypotheses<br />
on evapotranspiration, precipitation, soil, crop and irrigation factors, and restrictions<br />
in water allocation.<br />
3. Complete the current irrigation season. This simulation is a mix of the two cases<br />
above. Real time scheduling is performed till the present day, and the hypothesis<br />
characterizing historical simulations can be adopted to simulate the remaining<br />
irrigation weeks. Expected contingencies affecting water availability towards the<br />
end of the season can be tackled through the planning of conservative irrigation<br />
schedules.<br />
2.8. Output<br />
The model provides both tabular and graphical output, and a number of export options.<br />
The critical software output is the Weekly Irrigation Time (WIT, hr week -1 ). Additional<br />
information for advanced users includes the time evolution of selected variables under<br />
standard irrigation, RDI conditions, minimum RDI and under water restrictions. The<br />
variables of interest are Kc and the gross and net irrigation requirements (weekly and<br />
cumulative). Gross irrigation requirement is the total amount of water that needs to be<br />
withdrawn from the source to satisfy crop water requirements. Net irrigation<br />
requirement is the difference between crop evapotranspiration and effective
294<br />
295<br />
precipitation (Smith et al. 1991). The percentage of net to gross irrigation requirements<br />
is irrigation efficiency.
296<br />
297<br />
298<br />
299<br />
300<br />
301<br />
302<br />
303<br />
304<br />
305<br />
306<br />
307<br />
308<br />
309<br />
310<br />
311<br />
312<br />
313<br />
314<br />
315<br />
316<br />
317<br />
318<br />
319<br />
3. RIDECO software implementation<br />
3.1. Programming tools<br />
The RIDECO software has been developed in the object-oriented programming<br />
language C# using .Net technology (Visual Studio 2008). This programming language<br />
provides an intuitive and user friendly interface in Windows environment. The Extreme<br />
Programming methodology was used to develop this application. Objects were designed<br />
using the CRC (class, responsibility and collaboration) methodology. Two types of<br />
classes were defined: 1) those bound to the tables of the database; and 2) those that<br />
execute specific operations. Classes are formed by attributes and consult methods<br />
specializing on information management. Specific libraries (DLL ActiveX Open source)<br />
programmed in C# facilitate 2D graphical representation in .Net.<br />
The selected database manager was PostgreSQL, providing the power and flexibility to<br />
manage the software data requirements. The data manager receives the information<br />
provided by the client and stores it in the database. Information can be also recovered<br />
and presented in the correspondent forms. A specific application was developed in the<br />
Phyton programming language to improve efficiency in data flow.<br />
The software interface was developed in Spanish since was designed for technicians of<br />
the Spanish fruit sector. The software is technical by nature but it has been designed to<br />
provide generic answers with minimum input and very site-specific answers with detail<br />
input. The main software form gives the user access to all software functionalities.<br />
Object-oriented programming has led to the development of a general purpose irrigation<br />
scheduling code, specifically adapted to the generation of irrigation schedules in the<br />
area covered by the SIAR network of Spain. The code will find application in the<br />
current efforts to develop automatic ETo-based irrigation controllers (Zapata et al.,
320<br />
321<br />
322<br />
323<br />
324<br />
325<br />
326<br />
327<br />
328<br />
329<br />
330<br />
331<br />
332<br />
333<br />
334<br />
335<br />
336<br />
337<br />
338<br />
339<br />
340<br />
341<br />
342<br />
343<br />
2009). A generalization of the communication module will permit unattended<br />
connection to additional public access agrometeorological networks.<br />
3.2. Software and database interaction<br />
Fig. 4 provides a schematic diagram of the interaction between the RIDECO software,<br />
the SIAR network, the RIDECO database and the users. The RIDECO software<br />
communicates with the SIAR network using a standard HTTP protocol (transfer<br />
protocol of hypertext between a navigator and a Web server). The selection of an AWS<br />
in the software automatically connects with the SIAR server and updates meteorological<br />
data in the RIDECO database from the last download to the current date. Specific<br />
meteorological updating can also be performed for selected time periods. The RIDECO<br />
database has a bidirectional relation with the software: data from the database can be<br />
required by the software, while software-managed data (such as downloaded<br />
meteorological data, parameters or the results) can be stored in the database.<br />
Two types of users have been defined: standard and advanced. The standard user can<br />
interact with the software using the graphic interface. The advanced user can also<br />
manage three specific files (Fig. 4): the configuration file (App.config), the event log<br />
file (App.log) and the backup file (App.backup). The configuration file (XML format)<br />
stores information about the access to the SIAR server, the location of the events log<br />
and backup files and about the properties and attributes of the different classes. The<br />
event log file provides detailed information about the software execution errors. Finally,<br />
the backup file is automatically created to secure all application data when the<br />
application is closed.<br />
The data flow chart of the RIDECO software is presented in Fig. 5. The selection of the<br />
farm location leads to the selection of the AWS best representing the meteorology of the
344<br />
345<br />
346<br />
347<br />
348<br />
349<br />
350<br />
351<br />
352<br />
353<br />
354<br />
355<br />
356<br />
357<br />
358<br />
359<br />
360<br />
361<br />
362<br />
363<br />
364<br />
365<br />
366<br />
367<br />
farm. The software connects to the SIAR server and the selected meteorological data<br />
series is updated into the software database. The description of soil, crop and irrigation<br />
parameters for each irrigated subunit of the farm is input by the user through specific<br />
data forms. The user needs to select the type of simulation to perform (real time,<br />
historical or completing a season), as well as an irrigation strategy (standard, RDI or<br />
water restriction). Default values for the crop and deficit coefficients (Kc, KrRDI and<br />
KrRDImin) for the different species, cycles and irrigation strategies are stored in the<br />
application, and can be modified by the user. The software simulates the crop<br />
development stages and produces a weekly irrigation schedule for each irrigated subunit<br />
of the farm.<br />
The interaction between the main tables of the RIDECO database is presented in Fig. 6.<br />
Tables are presented in four groups according to their contents: meteorological, farm<br />
physical parameters, crop parameter and simulation results. Relations between tables are<br />
coded using standard symbols to specify one or n table elements. For instance, the<br />
relationship between the weather station table and the farm table is of the type “one to<br />
n”, indicating that a farm is represented by only one weather station, while a weather<br />
station can be representative of several farms. Meteorological tables include the regions<br />
of the SIAR territory, the provinces of each region, the AWS available at each province<br />
and the meteorological parameters stored by each AWS. The Farm table relates to the<br />
table containing its Subunits, which in turn relates to the Soil characteristics, the<br />
Irrigation system, the Fruit load and the Crop tables. The Crop table connects to the<br />
Variety, Species and Cycle, Kc, KrRDI and Fruit stage tables. The fourth group of tables<br />
corresponds with the simulation results tables. The Simulation Parameter table relates<br />
with the Subunit table, since the Subunit is the simulation unit. This group stores data
368<br />
369<br />
370<br />
371<br />
related to the simulation types, the irrigation strategies, the simulation dates and the<br />
simulation results.<br />
The RIDECO software is available for free download at the following URL:<br />
http://digital.csic.es/handle/10261/45608. A software manual is included.
372<br />
373<br />
374<br />
375<br />
376<br />
377<br />
378<br />
379<br />
380<br />
381<br />
382<br />
383<br />
384<br />
385<br />
386<br />
387<br />
388<br />
389<br />
390<br />
391<br />
392<br />
393<br />
394<br />
395<br />
4. Software application<br />
4.1. Input and output sample forms<br />
Fig. 7 presents a screen shot of the Parameters software form applied to a real time<br />
simulation. The selected AWS (in this particular case, Caspe) is displayed at the upper<br />
right side of the form, above the logos. The availability of meteorological data in the<br />
selected AWS (in this example, from 2005 to 2010) is displayed at the lower right side<br />
of the screen. The types of simulation and the options for results formatting are listed at<br />
the upper-left side of the screen. A real time simulation was selected in this particular<br />
example, as indicated below the logos. A summary of the farm parameters (name, area<br />
and selected meteorological data series) is displayed at the upper part of this section.<br />
The subunits of the farm and their main characteristics are listed bellow the farm name.<br />
The parameters of the highlighted subunit (in this example, “Sector temprano”) are<br />
listed at the lower half part of the form. The simulation and save buttons are displayed<br />
at the right side of the section.<br />
Fig. 8 presents scheduling results for weekly irrigation time (hours) corresponding to a<br />
historical simulation. The upper part of the screen is similar to the input screen (Fig. 7),<br />
while the central part of the screen is divided in the graphic part on the left and the<br />
results table on the right. Weekly irrigation time for all irrigation strategies (standard,<br />
RDI and RDImin) are presented in both graphical and tabular formats.<br />
4.2. Study cases<br />
Two examples of water restrictions (fixed and variable along the season) are presented<br />
in this section. The simulated farm (a late maturing peach orchard) was located in Caspe<br />
(Zaragoza). Fig. 9 presents the results of the fixed water restriction case, while Fig. 10<br />
presents the variable water restriction case. Figs. 9a and 10a present the evolution of the
396<br />
397<br />
398<br />
399<br />
400<br />
401<br />
402<br />
403<br />
404<br />
405<br />
406<br />
407<br />
408<br />
409<br />
410<br />
411<br />
412<br />
413<br />
414<br />
415<br />
416<br />
417<br />
418<br />
419<br />
crop coefficient along the season for the standard, RDI, and minimum RDI strategies,<br />
and for the analyzed water restriction case. Figs. 9b and 10b present gross irrigation<br />
requirements (GIR) under the same four irrigation strategies, Figs. 9c and 10c present<br />
cumulative gross irrigation requirements (CGIR). Finally, Figs. 9d and 10d present the<br />
weekly irrigation time for each of the studied strategies.<br />
In the case of fixed water restrictions, irrigation scheduling is adjusted to an allocation<br />
of 4,000 m 3 ha -1 . This is a very low allocation, since the gross water requirements would<br />
be 10,161, 8,202 and 7,978 m 3 ha -1 for standard, RDI and minimum RDI conditions,<br />
respectively. In order to adjust to this very low limitation, all crop coefficients were<br />
adjusted to values below the minimum. The solution proposed by the software allocates<br />
the existing water using proportional adequacy criteria, but does not guarantee neither<br />
full yield (yield will be affected for sure) nor the agronomic sustainability of this<br />
operation (trees will be affected by this severe drought and salinity may build up in the<br />
soil).<br />
For the variable water restriction case, the water restriction started with 4,000 m 3 ha -1<br />
and on July 15 th , the restriction was updated to 5,000 m 3 ha -1 . The new scenario still<br />
falls below minimum RDI conditions, but leads to a substantial increase in the<br />
compound crop coefficient, in the gross water requirements and in the number of<br />
irrigation hours.<br />
Zapata et al 201Xa and 201Xb presented a comparison between the irrigation volume<br />
applied in a commercial orchard and the irrigation volume resulting from the application<br />
of an RDI strategy (following the methodology of the RIDECO software). The study<br />
concluded that the orchard’s irrigation practices did not correspond to an RDI strategy:<br />
crop water stress was detected during fruit stages which have been reported to be highly
420<br />
421<br />
sensitive to water stress, while some periods of recommended RDI were not water<br />
stressed
422<br />
423<br />
424<br />
425<br />
426<br />
427<br />
428<br />
429<br />
430<br />
431<br />
432<br />
433<br />
434<br />
435<br />
436<br />
437<br />
5. Conclusions<br />
Most of the fruit producing areas in Spain and all over the word need to improve<br />
irrigation water management to meet the goals of water conservation, standards on fruit<br />
quality, reduction of the production cost (minimizing pruning needs) and maintain<br />
environmental quality. The RIDECO software was designed to perform irrigation<br />
scheduling under standard, regulated deficit and water restriction irrigation strategies,<br />
optimizing the irrigation water management at farm level. The software summarizes<br />
current scientific knowledge on advanced irrigation techniques for stone fruit orchards.<br />
Software design ensures that irrigation managers not specifically acquainted with<br />
current developments in irrigation science can use this tool. The graphic interface<br />
provides an easy and practical way of exploiting the developments of on-line<br />
agrometeorological servers and facilitates the adaptation of irrigation schedules to local<br />
conditions. The irrigation scheduling software stands as a valuable tool for on-farm<br />
water allocation planning, since it permits to forecast the seasonal volumes of water that<br />
will be required under specific scenarios. The RIDECO software also permits to analyse<br />
deficit irrigation strategies required to meet severe water restrictions.
438<br />
439<br />
440<br />
441<br />
6. Acknowledgement<br />
The authors sequence in this paper follows the “first-last-author-emphasis” norm. This<br />
research was funded by the Plan Nacional de I+D+i of the Government of Spain<br />
through grant RIDECO-C<strong>ON</strong>SOLIDER CSD2006-00067.
442<br />
443<br />
444<br />
445<br />
446<br />
447<br />
448<br />
449<br />
450<br />
451<br />
452<br />
453<br />
454<br />
455<br />
456<br />
457<br />
458<br />
459<br />
460<br />
461<br />
462<br />
463<br />
References<br />
Allen, R.G., 2000. Using the FAO-56 dual crop coefficient method over an irrigated<br />
region as part of an evapotranspiration intercomparison study. J. Hydrol. 229, 27–41.<br />
Allen R.G., Pereira L.S., Raes D., Smith M., 1998. Crop evapotranspiration. Guidelines<br />
for computing crop water requirements. FAO Irrigation and Drainage paper No. 56,<br />
Rome, Italy<br />
Anderson, J.L., Richardson, E.A. and Kesner, C.D. 1986. Validation of chill unit and<br />
flower bud phenology models for ‘Montmorency’ sour cherry. Acta Hort. 184:71-75.<br />
Antunez-Barria, A.J., 2006. The impact of deficit irrigation strategies on sweet cherry<br />
(Prunus avium L) physiology and spectral reflectance. PhD Diss., Washington State<br />
Univ. (UMI Microform 3252310).<br />
Ballester, C., Castel, J., Intrigliolo, D. S., Castel, J. R. 2011. Response of Clementina de<br />
Nules citrus trees to summer deficit irrigation. Yield components and fruit<br />
composition. Agric. Water Manag. 98(6): 1027-1032.<br />
Bonhomme, R. 2000. Bases and limits to using ‘degree day’ units. Europ. J. Agronomy<br />
13 (2000) 1–10.<br />
Boonprakob, U., Byrne, D.H. and Rouse, R. E. 1992. Response of fruit development<br />
period to temperature during specific periods after full bloom in peach. Fruit Varieties<br />
Journal 46:137-140.<br />
Cameron, R.W.F., Harrison-Murray, R.S., Atkinson, C.J., Judd, H.L., 2006. Regulated<br />
deficit irrigation - a means to control growth in woody ornamentals. J Hortic. Sci.<br />
Biotech. 81(3): 435-443.
464<br />
465<br />
466<br />
467<br />
468<br />
469<br />
470<br />
471<br />
472<br />
473<br />
474<br />
475<br />
476<br />
477<br />
478<br />
479<br />
480<br />
481<br />
482<br />
483<br />
484<br />
485<br />
486<br />
Chalmers D.J., Mitchell, P.D., van Heek, L., 1981. Control of peach tree growth and<br />
productivity by regulated water supply, tree density and summer pruning. J. Amer.<br />
Soc. Hort. Sci. 106, 307–312<br />
Casa, R., Russell, G., Lo Cascio, B., 2000. Estimation of evapotranspiration from a field<br />
of linseed in central Italy. Agric. For. Meteorol. 104, 289–301.<br />
Chung, U., Jung, J. E., Seo, H. C., Yun, J. I. 2009. Using urban effect corrected<br />
temperature data and a tree phenology model to project geographical shift of cherry<br />
flowering date in South Korea. Climatic Change 93(3-4): 447-463.<br />
Dichio, B., Xiloyannis, C., Sofo, A., Montanaro, G., 2007. Effects of post-harvest<br />
regulated deficit irrigation on carbohydrate and nitrogen partitioning, yield quality and<br />
vegetative growth of peach trees. Plant and Soil 290(1-2): 127-137.<br />
Dragoni, D., Lakso, A.N., Piccioni, R.M., 2004. Transpiration of an apple orchard in a<br />
cool humid climate: measurement and modeling. Acta Hort. 664, 175–180.<br />
Ebel, R. C., Proebsting, E. L., Evans, R. G. 2001. Apple tree and fruit responses to early<br />
termination of irrigation in a semi-arid environment. Hortscience 36(7): 1197-1201.<br />
Fereres, E., Castel, J.R., 1981. Drip Irrigation Management. Division of Agricultural<br />
Sciences. University of California (Publication Leaflet 21259).<br />
Fereres E. and Soriano, M. A. 2007. Deficit irrigation for reducing agricultural water<br />
use. J Exp. Bot. 58(2), 147-159.<br />
García Vera, M. A., Martínez-Cob, A., 2004. Revisión de las necesidades hídricas netas<br />
de los cultivos de la Cuenca del Ebro. Internal Technical Report 2004-PH-12.I.<br />
Confederación Hidrográfica del Ebro, Zaragoza.<br />
http://digital.csic.es/handle/10261/15896
487<br />
488<br />
489<br />
490<br />
491<br />
492<br />
493<br />
494<br />
495<br />
496<br />
497<br />
498<br />
499<br />
500<br />
501<br />
502<br />
503<br />
504<br />
505<br />
506<br />
507<br />
508<br />
509<br />
Gelly, M., Recasens, I., Girona, J., Mata, M., Arbones, A., Rufat, J., Marsal, J., 2004.<br />
Effects of stage II and postharvest deficit irrigation on peach quality during maturation<br />
and after cold storage. J. Sci Food Agr. 84(6): 561-568.<br />
Girona, J., Mata, M., Arbonès, A., Alegre, S., Rufat, J. and Marsal, J. 2003. Peach tree<br />
response to single and combined regulated deficit irrigation regimes under shallow<br />
soils. J. Amer. Soc. Hort. Sci. 128(3):432-440.<br />
Girona, J., Gelly, M., Mata, M., Arbones, A., Rufat, J. and Marsal, J. 2005. Peach tree<br />
response to single and combined deficit irrigation regimes in deep soils. Agric. Water<br />
Manag. 72: 97–108.<br />
Goldhamer, D.A., Salinas, M., Crisosto, C., Day, K.R., Soler, M., Moriana, A., 2002.<br />
Effects of regulated deficit irrigation and partial root zone drying on late harvest peach<br />
tree performance. Proceedings of the 5th International Peach Symposium, Vols 1 and<br />
2: 343-350.<br />
Goodwin, I., Boland AM. 2000. Deficit Irrigation Practices. FAO water reports 22.<br />
Green, S. R., K. G. McNaughton, Clothier, B. E. 1989. Observations of Night-Time<br />
Water-Use in Kiwifruit, Vines and Apple-Trees. Agric. For. Meteorol. 48(3-4): 251-<br />
261.<br />
Guerriero, R. and P. Monteleone 2006. Thermal requirement from blooming to ripening<br />
in some apricot cultivars. Acta Hort. 731: 95-99.<br />
Intrigliolo, D. S. and J. R. Castel 2005. Effects of regulated deficit irrigation on growth<br />
and yield of young Japanese plum trees. J Hortic. Sci. Biotech. 80(2): 177-182.<br />
Johnson R.S., Handley D.F., DeJong T.M., 1992. Long-term response of early maturing<br />
peach trees to postharvest water deficits. J. Amer. Soc. Hort. Sci. 117, 881–886.
510<br />
511<br />
512<br />
513<br />
514<br />
515<br />
516<br />
517<br />
518<br />
519<br />
520<br />
521<br />
522<br />
523<br />
524<br />
525<br />
526<br />
527<br />
528<br />
529<br />
530<br />
531<br />
532<br />
533<br />
Lascano, R.J., 2000. A general system to measure and calculate daily crop water use.<br />
Agron. J. 92, 821–832<br />
Leib, B. G., Elliott, T.V., Matthews, G. 2001.WISE: a web-linked and producer oriented<br />
program for irrigation scheduling. Comput. Electron. Agric. 33(1): 1-6.<br />
Leib, B. G., Hattendorf, M., Elliott, T., Matthews, G. 2002. Adoption and adaptation of<br />
scientific irrigation scheduling: trends from Washington, USA as of 1998. Agric.<br />
Water Manag. 55(2): 105-120.<br />
Lopez, G., Arbones, A., del Campo, J., Mata, M., Vallverdu, X., Girona, J., Marsal, J.<br />
2008. Response of peach trees to regulated deficit irrigation during stage II of fruit<br />
development and summer pruning. Span J. Agric. Res. 6(3): 479-491.<br />
MARM. 2010. Anuario de estadística del ministerio de medio ambiente y medio rural y<br />
marino 2010. Ministerio de medio Ambiente y medio Rural y Marino, Madrid.<br />
Marra, F.P., Inglese, P., DeJong, T.M., Jhonson, R.S., 2002. Thermal time requirement<br />
and harvest time forecast for peach cultivars with different fruit development periods.<br />
Proceedings of the 5th International Peach Symposium, Vols. 1 and 2: 523-529.<br />
Marsal, J., Lopez, G., del Campo, J., Mata, M., Arbones, A., Girona, J., 2009.<br />
Postharvest regulated deficit irrigation in “Summit” sweet cherry: fruit yield and<br />
quality in the following season. Irrig. Sci., 28: 181-189.<br />
Mitchell P.D., Chalmers D.J., 1982. The effects of reduced water supply on peach tree<br />
growth and yields J. Amer. Soc. Hort. Sci. 107, 853-856.<br />
Mimoun, M.B., and DeJong, T.M., 1999. Using the relation between Growing Degree<br />
Hours and harvest time to estimate run-times for PEACH: a tree growth and yield<br />
simulation model. Department of Pomology, University of California, Davis (URL:<br />
http://fruitsandnuts.ucdavis.edu/weather/GDHpaper.pdf).
534<br />
535<br />
536<br />
537<br />
538<br />
539<br />
540<br />
541<br />
542<br />
543<br />
544<br />
545<br />
546<br />
547<br />
548<br />
549<br />
550<br />
551<br />
552<br />
553<br />
554<br />
555<br />
556<br />
Mounzer, O. R., Conejero, W., Nicolas, E., Abrisqueta, I., Garcia-Orellana, Y. V.,<br />
Tapia, L. M., Vera, J., Abrisqueta, J. M. and Ruiz-Sanchez, M., 2008. Growth pattern<br />
and phenological stages of early-maturing peach trees under a Mediterranean climate.<br />
Hortscience 43(6): 1813-1818.<br />
Muñoz, C., Sepulveda, G., Garcia-Huidobro, J. and Sherman, W.B. 1986. Determining<br />
thermal time and base temperature required for fruit development in low chilling<br />
peaches. HortScience 21:520-522.<br />
Naor A, 2006. Irrigation scheduling of peach-Deficit irrigation at different phenological<br />
stages and water stress assessment. Acta Hort. 713, 393-399.<br />
Normand, F. and Léchaudel, M. 2006. Toward a better interpretation and use of thermal<br />
time models. Acta Hort :707:<br />
Pailly, O., Battini, M. and Polidori J.J. 1999. Predicting kiwifruit maturity in orchard by<br />
the use of daily mean air temperature accumulation. Acta Hort. 498: 239-246<br />
Paco T.A., Ferreira, M.I., Conceição, N., 2006. Peach orchard evapotranspiration in a<br />
sandy soil: Comparison between eddy covariance measurements and estimates by the<br />
FAO 56 approach. Agric. Water Manag. 85: 305-313.<br />
Perez-Pastor, A., Domingo, R., Torrecillas, A., Ruiz-Sanchez, M., 2009. Response of<br />
apricot trees to deficit irrigation strategies. Irrig. Sci. 27(3): 231-242.<br />
Perez-Sarmiento, F., Alcobendas, R., Mounzer, O., Alarcon, J., Nicolas, E., 2010.<br />
Effects of regulated deficit irrigation on physiology and fruit quality in apricot trees.<br />
Span J. Agric. Res. 8: S86-S94.<br />
Rageau, R., M. Bonhomme, Richard, J. P., Erez, A. 1998. The climatic determinism of<br />
vegetative bud break on peach trees with no exposure to chilling: Some experimental
557<br />
558<br />
559<br />
560<br />
561<br />
562<br />
563<br />
564<br />
565<br />
566<br />
567<br />
568<br />
569<br />
570<br />
571<br />
572<br />
573<br />
574<br />
575<br />
576<br />
577<br />
578<br />
579<br />
results. Fourth International Peach Symposium, Vols 1-2. Leuven 1, international<br />
society horticultural science: 511-519.<br />
Rom, R.C. and Arringto.E.H. 1966. Effect of varying temperature regimes on degree-<br />
days to bloom in elberta peach. Proceedings of the American Society for Horticultural<br />
Science, 88(JUN): 239.<br />
Salvador, R., Martínez-Cob, A., Cavero, J. and Playán, E. 2011. Seasonal on-farm<br />
irrigation performance in the Ebro basin (Spain): crops and irrigation systems. Agric.<br />
Water Manage. 98(2011):577-587.<br />
Smith M, Allen RG, Monteith JL, Perrier A, Pereira LS, Segeren A (1991) Report on<br />
the expert consultation on revision of FAO methodologies for crop water<br />
requirements. FAO Land and Water Development Division, FAO, Rome.<br />
Topp, B.L. and Sherman, W.B. 1989. The relationship between temperature and<br />
bloom-to ripening period in low-chill peach. Fruit Varieties Journal 43:155-158.<br />
Torrecillas, A., Domingo; R., Galego, R., Ruiz-Sanchez, M.C., 2000. Apricot tree<br />
response to withholding irrigation at different phenological periods. Sci. Hort. 85(3):<br />
201-215.<br />
Valentini, N., Me, G., Spanna, F., Lovisetto, M. 2004. Chilling and heat requirement in<br />
apricot and peach varieties. Acta Hort. 636: 199:203.<br />
Valentini, N., Ruffa, E., Me, G., Spanna, F., Lovisetto, M. 2006. Chilling, thermal time<br />
and metabolic changes in five apricot varieties. Acta Hort. 731:147-150.<br />
Vaughn D. M., 2005. Degree Days. Encyclopedia of Earth Sciences Series.<br />
Encyclopedia of World Climatology. Springer. DOI: 10.1007/1-4020-3266-8_64.<br />
Editor: John E. Oliver.
580<br />
581<br />
582<br />
583<br />
584<br />
585<br />
586<br />
587<br />
588<br />
589<br />
590<br />
591<br />
592<br />
593<br />
Winkler, A., Cook, J.A., Klìewer, W.M. and Lider, L.A. 1962. General Viticulture.<br />
University of California press. p.543.<br />
Zapata, N., Playán, E., Skhiri, A. and Burguete, J. 2009. A collective solid-set sprinkler<br />
irrigation controller for optimum water productivity. J. Irrig. Drain. Eng., ASCE, 135<br />
(1): 13-24.<br />
Zapata, N., Nerilli, E., Martínez-Cob, A., Chalghaf, B., Fliman, D. and Playán, E. 201X.<br />
Limitations to adopting regulated deficit irrigation in stone fruit orchards: I. Sources of<br />
spatial variability. Submitted to Spanish Journal of Agricultural Research.<br />
Zapata, N., Nerilli, E., Martínez-Cob, A., Chalghaf, I., Fliman, D. and Playán, E. 201X.<br />
Limitations to adopting regulated deficit irrigation in stone fruit orchards. Submitted to<br />
Spanish Journal of Agricultural Research.<br />
Zavalloni, C., Andresen, J. A. and Flore, J. A. 2006. Phenological models of flower bud<br />
stages and fruit growth of 'Montmorency' sour cherry based on growing degree-day<br />
accumulation. J. Amer. Soc. Hort. Sci. 131(5): 601-607.
594<br />
595<br />
596<br />
597<br />
598<br />
599<br />
600<br />
601<br />
602<br />
List of Tables<br />
Table 1. Crop Coefficients (Kc) as reported in Garcia-Vera and Martinez-Cob 2004, for<br />
the different species and peach cycles in the FAO phases: initial, medium and final.<br />
Table 2. Maximum and minimum reduction coefficients for the RDI strategy (KrRDI) at<br />
the non sensitive fruit stages for several stones fruits species (cherry, apricot, extra-early<br />
maturing peach, early maturing peach, medium maturing peach and late maturing<br />
peach).<br />
Table 3. Growing degree-days necessary to reach the specific phenological stages<br />
determined with the GDD model, meteorological data and phenological observations.
603<br />
604<br />
605<br />
606<br />
607<br />
608<br />
609<br />
610<br />
611<br />
612<br />
613<br />
614<br />
615<br />
616<br />
617<br />
618<br />
619<br />
620<br />
621<br />
622<br />
623<br />
624<br />
625<br />
List of Figures<br />
Fig. 1. Location of the target geographical areas and the agrometeorological stations of<br />
the SIAR network.<br />
Fig. 2. Top; shaded contour map of long-term average precipitation (mm yr -1 ). Bottom:<br />
reference evapotranspiration (mm yr -1 ) in the target stone fruit production areas.<br />
Fig. 3. Correspondence between the phenological events defining the FAO crop<br />
development stages (as proposed in García-Vera and Martínez-Cob 2004) and the fruit<br />
growth stages..<br />
Fig. 4. Interaction between the RIDECO software, the Internet-based SIAR<br />
agrometeorological data, the RIDECO database and the users.<br />
Fig. 5. Flow chart of the RIDECO software: elaboration of a weekly irrigation schedule.<br />
Fig. 6. RIDECO database design, showing the relations between the main database<br />
tables.<br />
Fig. 7. A typical RIDECO data input form: farm and simulation parameters. The<br />
original version of the software windows is in Spanish.<br />
Fig. 8. A typical RIDECO results form: Weekly Irrigation Time (hours). The original<br />
version of the software windows is in Spanish.<br />
Fig. 9. Graphical results of a simulation for a late maturing peach orchard under all<br />
irrigation strategies (standard, RDI, RDImin and water restriction of 4,000 m 3 ha -1 ): a)<br />
crop coefficients; b) gross irrigation requirements; c) cumulative gross irrigation<br />
requirements; and d) irrigation time (hr week -1 ).<br />
Fig. 10 Graphical results of a simulation for a late maturing peach orchard under all<br />
irrigation strategies (standard, RDI, RDImin and water restriction). Seasonal water
626<br />
627<br />
628<br />
629<br />
630<br />
631<br />
632<br />
633<br />
634<br />
635<br />
636<br />
637<br />
638<br />
639<br />
640<br />
641<br />
642<br />
643<br />
644<br />
645<br />
restriction started at 4,000 m 3 ha -1 , and was updated to 5,000 m 3 ha -1 in July 15. Results<br />
include: a) crop coefficients; b) gross irrigation requirements; c) cumulative gross<br />
irrigation requirements; and d) irrigation time (hr week -1 ).
646<br />
647<br />
648<br />
649<br />
650<br />
651<br />
652<br />
653<br />
654<br />
655<br />
656<br />
657<br />
658<br />
659<br />
660<br />
661<br />
662<br />
Table 1. . Crop Coefficients (Kc) as reported in Garcia-Vera and Martinez-Cob 2004,<br />
for the different species and peach cycles in the FAO phases: initial, medium and final.<br />
Crop coefficient<br />
Kc initial Kc medium Kc final<br />
Cherry 0.36 0.98 0.20<br />
Apricot 0.36 0.98 0.20<br />
Extra-early Mat. Peach 0.44 0.93 0.24<br />
Early Mat. Peach 0.44 0.93 0.24<br />
Medium Mat. Peach 0.38 0.94 0.26<br />
Late Mat. Peach 0.36 0.94 0.31<br />
K c
663<br />
664<br />
665<br />
666<br />
667<br />
668<br />
669<br />
670<br />
671<br />
672<br />
673<br />
674<br />
675<br />
676<br />
677<br />
678<br />
Table 2. Maximum and minimum reduction coefficients for the RDI strategy (KrRDI) at<br />
the non sensitive fruit stages for several stones fruits species (cherry, apricot, extra-early<br />
maturing peach, early maturing peach, medium maturing peach and late maturing<br />
peach).<br />
Soil<br />
Depth<br />
Shallow Deep<br />
Crop<br />
K rRDI<br />
High fruit load<br />
K rRDI<br />
Low fruit load<br />
FII FIVinitial FIVfinal FII FIVinitial FIVfinal Cherry - 0.40-0.60 0.40-0.60 - 0.40-0.60 0.40-0.60<br />
Apricot - 0.30-0.50 0.30-0.50 - 0.30-0.50 0.30-0.50<br />
Extra-early Mat. Peach - 0.30-0.50 0.50-0.70 - 0.30-0.50 0.50-0.70<br />
Early Mat. Peach - 0.30-0.50 0.50-0.70 - 0.30-0.50 0.50-0.70<br />
Medium Mat. Peach 0.00-0.50 0.00-0.30 0.50-0.70 0.00-0.50 0.00-0.30 0.50-0.70<br />
Late Mat. Peach 0.00-0.50 0.00-0.50 0.00-0.50 0.00-0.50 0.00-0.50 0.00-0.50<br />
Cherry - 0.50-0.70 0.70-0.80 - 0.50-0.70 0.70-0.80<br />
Apricot - 0.50-0.70 0.70-0.80 - 0.50-0.70 0.70-0.80<br />
Extra-early Mat. Peach - 0.50-0.70 0.70-0.80 - 0.50-0.70 0.70-0.80<br />
Early Mat. Peach - 0.50-0.70 0.70-0.80 - 0.50-0.70 0.70-0.80<br />
Medium Mat. Peach 0.40-0.70 0.20-0.50 0.70-0.80 0.40-0.50 0.20-0.50 0.70-0.80<br />
Late Mat. Peach 0.40-0.70 0.50-0.70 0.50-0.70 0.40-0.50 0.50-0.70 0.50-0.70
679<br />
680<br />
681<br />
682<br />
683<br />
684<br />
685<br />
686<br />
687<br />
688<br />
689<br />
690<br />
691<br />
692<br />
693<br />
694<br />
Table 3. Growing degree-days necessary to reach the specific phenological stages<br />
determined with the GDD model, meteorological data and phenological observations.<br />
Phenological<br />
stages<br />
Beginning of<br />
pit hardening<br />
Cherry Apricot Extra-early<br />
Mat. Peach<br />
Early Mat.<br />
Peach<br />
Medium Mat.<br />
Peach<br />
Late Mat.<br />
Peach<br />
169 183 370 568 531 515<br />
Finish of pit<br />
hardening<br />
371 466 450 671 1004 1406<br />
Fruit<br />
ripenning<br />
703 1123 920 1262 1979 2956<br />
Leaf fall 3336 3362 3862 3547 3511 3494
695<br />
696<br />
697<br />
698<br />
699<br />
700<br />
701<br />
702<br />
703<br />
704<br />
705<br />
Fig. 1. Location of the target geographical areas and the agrometeorological stations of<br />
the SIAR network.
706<br />
707<br />
708<br />
709<br />
710<br />
Fig. 2. Shaded contour maps of long-term average annual precipitation (mm yr -1 , Fig<br />
2a) and reference evapotranspiration (ETo, mm yr -1 , Fig 2b) in the target stone fruit<br />
production areas.<br />
a)<br />
b)
711<br />
712<br />
713<br />
714<br />
715<br />
716<br />
717<br />
718<br />
719<br />
720<br />
721<br />
722<br />
723<br />
724<br />
725<br />
726<br />
727<br />
Fig. 3. Correspondence between the phenological events defining the FAO crop<br />
development stages (as proposed in García-Vera and Martínez-Cob 2004) and the fruit<br />
growth stages.<br />
Fruit Growth Stages FI FII<br />
FAO Stages Initial<br />
Bud swelling<br />
Bloom<br />
Beginning of<br />
pit hardening<br />
Development<br />
End of pit<br />
hardening<br />
FIII<br />
Mid-season<br />
Fruit ripening<br />
FIV ini<br />
FIV final<br />
Late-season<br />
Leaf fall
728<br />
729<br />
730<br />
731<br />
732<br />
733<br />
734<br />
735<br />
736<br />
737<br />
Fig. 4. Interaction between the RIDECO software, the Internet-based SIAR<br />
agrometeorological data, the RIDECO database and the users.
738<br />
739<br />
740<br />
Fig. 5. Flow chart of the RIDECO software: elaboration of a weekly irrigation schedule.
741<br />
742<br />
743<br />
744<br />
745<br />
746<br />
747<br />
748<br />
749<br />
Fig. 6. RIDECO database design, showing the relations between the main database<br />
tables.
750<br />
751<br />
752<br />
753<br />
754<br />
755<br />
756<br />
757<br />
758<br />
759<br />
760<br />
761<br />
Fig. 7. A typical RIDECO data input form: farm and simulation parameters. The<br />
original version of the software windows is in Spanish.
762<br />
763<br />
764<br />
765<br />
766<br />
767<br />
768<br />
769<br />
770<br />
771<br />
772<br />
773<br />
Fig. 8. A typical RIDECO results form: Weekly Irrigation Time. The original version of<br />
RIDECO windows is in Spanish.
774<br />
775<br />
776<br />
777<br />
778<br />
779<br />
780<br />
781<br />
782<br />
783<br />
784<br />
785<br />
786<br />
Fig. 9. Graphical results of a simulation for a late maturing peach orchard under all<br />
irrigation strategies (standard, RDI, RDImin and water restriction of 4,000 m 3 ha -1 ): a)<br />
crop coefficients; b) gross irrigation requirements; c) cumulative gross irrigation<br />
requirements; and d) irrigation time (hr week -1 ).<br />
Crop coefficient<br />
(m 3 ha -1 )<br />
1<br />
0.9<br />
Kc std<br />
a<br />
0.8<br />
KrRDI<br />
0.7<br />
0.6<br />
0.5<br />
0.4<br />
0.3<br />
0.2<br />
0.1<br />
0<br />
KrRDImin<br />
Kr limit.<br />
Oct-09 Jan-10 May-10 Aug-10 Nov-10 Feb-11<br />
Date (mm:yy)<br />
12000<br />
10000<br />
8000<br />
6000<br />
4000<br />
2000<br />
CGIR std<br />
CGIR RDI<br />
CGIR RDImin<br />
CGIR limit.<br />
0<br />
0 5 10 15 20 25 30 35 40 45 50<br />
Week<br />
(mm)<br />
4<br />
3<br />
2<br />
1<br />
0<br />
70<br />
60<br />
50<br />
40<br />
30<br />
20<br />
10<br />
GIR std<br />
GIR RDI<br />
GIR RDImin<br />
GIR limit.<br />
0<br />
0 5 10 15 20 25 30 35 40 45 50<br />
Week<br />
c<br />
7<br />
6<br />
WIT std<br />
WIT RDI<br />
d<br />
WIT RDImin<br />
5 WIT limit.<br />
(hours week -1 )<br />
6<br />
Week<br />
9<br />
12<br />
15<br />
18<br />
21<br />
24<br />
27<br />
30<br />
33<br />
36<br />
39<br />
42<br />
Fig. 10 Graphical results of a simulation for a late maturing peach orchard under all<br />
irrigation strategies (standard, RDI, RDImin and water restriction). Seasonal water<br />
b
787<br />
788<br />
789<br />
790<br />
791<br />
792<br />
restriction started at 4,000 m 3 ha -1 , and was updated to 5,000 m 3 ha -1 in July 15. Results<br />
include: a) crop coefficients; b) gross irrigation requirements; c) cumulative gross<br />
irrigation requirements; and d) irrigation time (hr week -1 ).<br />
Crop coefficient<br />
(m 3 ha -1 )<br />
1<br />
0.9<br />
0.8<br />
0.7<br />
0.6<br />
0.5<br />
Kc std<br />
KrRDI<br />
KrRDImin<br />
Kr limit.<br />
a<br />
70<br />
60<br />
50<br />
40<br />
GIR std<br />
GIR RDI<br />
GIR RDImin<br />
GIR limit<br />
b<br />
0.4<br />
30<br />
0.3<br />
0.2<br />
0.1<br />
15 July<br />
20<br />
10<br />
15 July<br />
0<br />
0<br />
Dec-09 Feb-10 May-10 Jul-10 Sep-10 Dec-10<br />
0 5 10 15 20 25 30 35 40 45 50<br />
Date (mm:yy)<br />
Week<br />
12000<br />
10000<br />
8000<br />
6000<br />
4000<br />
2000<br />
CGIR std<br />
CGIR RDI<br />
CGIR RDImin<br />
CGIR limit<br />
15 July<br />
0<br />
0 5 10 15 20 25 30 35 40 45 50<br />
Week<br />
(mm)<br />
c<br />
7<br />
6<br />
WIT std<br />
WIT RDI<br />
15 July<br />
d<br />
5<br />
4<br />
WIT RDImin<br />
WIT limit.<br />
(hours week -1 )<br />
3<br />
2<br />
1<br />
0<br />
6<br />
9<br />
Week<br />
12<br />
15<br />
18<br />
21<br />
24<br />
27<br />
30<br />
33<br />
36<br />
39<br />
42