SOFTWARE FOR ON-FARM IRRIGATION SCHEDULING ... - citaREA
SOFTWARE FOR ON-FARM IRRIGATION SCHEDULING ... - citaREA
SOFTWARE FOR ON-FARM IRRIGATION SCHEDULING ... - citaREA
You also want an ePaper? Increase the reach of your titles
YUMPU automatically turns print PDFs into web optimized ePapers that Google loves.
372<br />
373<br />
374<br />
375<br />
376<br />
377<br />
378<br />
379<br />
380<br />
381<br />
382<br />
383<br />
384<br />
385<br />
386<br />
387<br />
388<br />
389<br />
390<br />
391<br />
392<br />
393<br />
394<br />
395<br />
4. Software application<br />
4.1. Input and output sample forms<br />
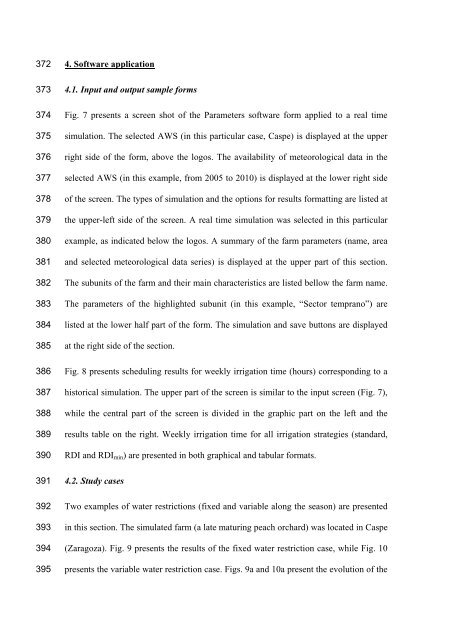
Fig. 7 presents a screen shot of the Parameters software form applied to a real time<br />
simulation. The selected AWS (in this particular case, Caspe) is displayed at the upper<br />
right side of the form, above the logos. The availability of meteorological data in the<br />
selected AWS (in this example, from 2005 to 2010) is displayed at the lower right side<br />
of the screen. The types of simulation and the options for results formatting are listed at<br />
the upper-left side of the screen. A real time simulation was selected in this particular<br />
example, as indicated below the logos. A summary of the farm parameters (name, area<br />
and selected meteorological data series) is displayed at the upper part of this section.<br />
The subunits of the farm and their main characteristics are listed bellow the farm name.<br />
The parameters of the highlighted subunit (in this example, “Sector temprano”) are<br />
listed at the lower half part of the form. The simulation and save buttons are displayed<br />
at the right side of the section.<br />
Fig. 8 presents scheduling results for weekly irrigation time (hours) corresponding to a<br />
historical simulation. The upper part of the screen is similar to the input screen (Fig. 7),<br />
while the central part of the screen is divided in the graphic part on the left and the<br />
results table on the right. Weekly irrigation time for all irrigation strategies (standard,<br />
RDI and RDImin) are presented in both graphical and tabular formats.<br />
4.2. Study cases<br />
Two examples of water restrictions (fixed and variable along the season) are presented<br />
in this section. The simulated farm (a late maturing peach orchard) was located in Caspe<br />
(Zaragoza). Fig. 9 presents the results of the fixed water restriction case, while Fig. 10<br />
presents the variable water restriction case. Figs. 9a and 10a present the evolution of the


