Mpumalanga Biodiversity Conservation Plan Handbook - bgis-sanbi
Mpumalanga Biodiversity Conservation Plan Handbook - bgis-sanbi
Mpumalanga Biodiversity Conservation Plan Handbook - bgis-sanbi

Create successful ePaper yourself
Turn your PDF publications into a flip-book with our unique Google optimized e-Paper software.
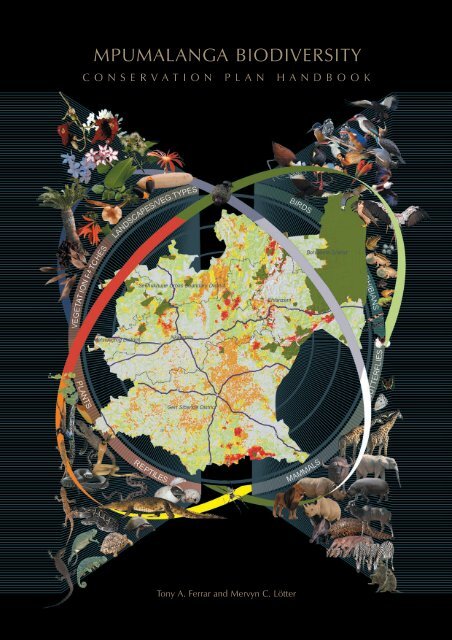
MPUMALANGA BIODIVERSITY<br />
CONSERVATION PLAN HANDBOOK<br />
Tony A. Ferrar and Mervyn C. Lötter
MPUMALANGA BIODIVERSITY<br />
CONSERVATION PLAN HANDBOOK<br />
AUTHORS<br />
Tony A. Ferrar 1 and Mervyn C. Lötter 2<br />
CONTRIBUTIONS BY<br />
Brian Morris 3<br />
Karen Vickers 4<br />
Mathieu Rouget 4<br />
Mandy Driver 4<br />
Charles Ngobeni 2<br />
Johan Engelbrecht 2<br />
Anton Linström 2<br />
Sandy Ferrar 1<br />
This handbook forms part of the three products produced during the compilation of the <strong>Mpumalanga</strong><br />
<strong>Biodiversity</strong> <strong>Conservation</strong> <strong>Plan</strong> (MBCP).<br />
CITATION:<br />
Ferrar, A.A. & Lötter, M.C. 2007. <strong>Mpumalanga</strong> <strong>Biodiversity</strong> <strong>Conservation</strong> <strong>Plan</strong> <strong>Handbook</strong>. <strong>Mpumalanga</strong><br />
Tourism & Parks Agency, Nelspruit.<br />
OTHER MBCP PRODUCTS INCLUDE:<br />
Lötter, M.C. & Ferrar, A.A. 2006. <strong>Mpumalanga</strong> <strong>Biodiversity</strong> <strong>Conservation</strong> <strong>Plan</strong> Map. <strong>Mpumalanga</strong> Tourism &<br />
Parks Agency, Nelspruit.<br />
Lötter. M.C. 2006. <strong>Mpumalanga</strong> <strong>Biodiversity</strong> <strong>Conservation</strong> <strong>Plan</strong> CD-Rom. <strong>Mpumalanga</strong> Tourism & Parks<br />
Board, Nelspruit.<br />
Affiliations: 1 Private, 2 MTPA, 3 DALA, 4 SANBI,<br />
i
ISBN: 978-0-620-38085-0<br />
This handbook is published by the <strong>Mpumalanga</strong> Provincial Government, in Nelspruit, 2007.<br />
It may be freely copied, reproduced quoted and disseminated in any form, especially for educational and scientific<br />
purposes, provided the source is properly cited in each and all instances.<br />
The <strong>Mpumalanga</strong> Tourism and Parks Agency welcomes comment and feedback on the <strong>Handbook</strong>,<br />
in particular the identification of errors and omissions. Provision of new information that should be incorporated<br />
into any revised edition of the <strong>Biodiversity</strong> <strong>Plan</strong> or this handbook would be particularly appreciated. For this or<br />
<strong>Mpumalanga</strong> Tourism and Parks Agency<br />
any other correspondence please contact:<br />
MPUMALANGA TOURISM AND PARKS AGENCY<br />
SCIENTIFIC SERVICES<br />
TEL: 013 759 5300
TABLE OF CONTENTS<br />
Acknowledgements iv<br />
Foreword v<br />
Acronyms vi<br />
Executive Summary vii<br />
1. INTRODUCTION 1<br />
2. POLICY AND LEGISLATION 5<br />
3. MPUMALANGA’S ECOSYSTEMS 9<br />
4. BIODIVERSITY SPATIAL ASSESSMENT 21<br />
5. PROTECTED AREA ASSESSMENT 33<br />
6. LAND-USE GUIDELINES 41<br />
Terrestrial; Aquatic; Wetland<br />
APPENDICES:<br />
Appendix 1 –– Environmental Legislation Aiii<br />
Appendix 2 –– Status of Vegetation Types Avi<br />
Appendix 3 –– Data Summary of Formal and Informal Protected Areas Aix<br />
Glossary Axv<br />
References and further reading Axviii<br />
TABLE OF CONTENTS<br />
iii
MPUMALANGA BIODIVERSITY CONSERVATION PLAN HANDBOOK<br />
iv<br />
ACKNOWLEDGMENTS<br />
The MBCP is a truly cooperative effort. <strong>Mpumalanga</strong> had precious few people with any experience in<br />
systematic biodiversity planning at the start of this project. The support provided was such that, in the end,<br />
these local shortcomings seemed to be an advantage rather than the opposite. It resulted in many people<br />
contributing and a great willingness to listen and learn on the part of the production team. We pay special<br />
thanks to the Development Bank of Southern Africa (DBSA) for its generous financial support of this project.<br />
The authors and the MBCP Steering Committee, under the chairmanship of Charles Ngobeni, would like to<br />
thank sincerely, all those who participated and generously gave of their time. In particular, the personal<br />
drive and strong institutional support from MEC Madala Masuku, was particularly helpful. The long list of<br />
supporters includes:<br />
Koos de Wet<br />
Lientjie Cohen<br />
Gerrie Camacho<br />
Andre Coetzee<br />
Ronell Niemand<br />
Jerry Theron<br />
Francois Roux<br />
Gavin Shaw<br />
Mandy McNamara<br />
Graham Henning<br />
Piet-Louis Grundling<br />
Avian Demography Unit<br />
PRECIS - SABIF<br />
John Burrows<br />
Warren McCleland<br />
Graham Deal<br />
Lourens & Jolisa Grobler<br />
Douglas McMurtry<br />
Shane Burns<br />
Dr Stefan Siebert<br />
Judith Kruger<br />
Dr Philip Desmet<br />
James Wakelin<br />
Pete Goodman<br />
Anthony Emery<br />
Mark Botha<br />
Kristal Maze<br />
Karl Oellerman<br />
Daina Mudimbu<br />
Garth Batchelor<br />
Dr. Bob Smith<br />
Karl & Lesley Lane<br />
Michele Pfab<br />
Pieta Compaan<br />
Dr Tamara Smith<br />
Dr Neels Kleynhans<br />
Gillian Maree<br />
Nancy Job<br />
Gary Marneweck<br />
Dr Harry Biggs<br />
Aimee Ginsburg<br />
Derek Berliner
FOREWORD BY THE MEC<br />
FOR ECONOMIC DEVELOPMENT & PLANNING<br />
MR S.W. LUBISI<br />
<strong>Mpumalanga</strong> is particularly well endowed with living natural resources, collectively referred to as<br />
biodiversity. The conservation of this biodiversity and the ecosystem services that it delivers, is recognised<br />
as a legitimate and sustainable form of land use.<br />
The Provincial Government is determined to ensure the persistent conservation of this biodiversity for<br />
current and future generations. The management and sustainable use of biodiversity contribute to the<br />
health of our people, to the growth of the tourism industry and to the delivery of vital ecosystem services<br />
such as clean air and fresh water.<br />
In recognising these realities, the Province has developed the <strong>Mpumalanga</strong> <strong>Biodiversity</strong> <strong>Conservation</strong> <strong>Plan</strong><br />
(MBCP). This plan has been jointly developed by the <strong>Mpumalanga</strong> Tourism and Parks Agency (MTPA) and<br />
the Department of Agriculture and Land Administration (DALA). The MTPA has since moved to the<br />
Department of Economic Affairs and <strong>Plan</strong>ning (DEDP) and the plan is therefore being supported and<br />
implemented by all these agencies. The completion of the MBCP in 2006 provides us with the first<br />
comprehensive spatial plan that identifies and maps the biodiversity status of land across the Province.<br />
The plan identifies all remaining natural areas in <strong>Mpumalanga</strong> that have not been transformed by<br />
development. It prioritises these areas, based on their biodiversity importance and sensitivity to<br />
degradation. These areas must be managed to protect biodiversity in order to meet our constitutional<br />
commitment to sustainable development and a healthy environment for all.<br />
With a view to implementing the plan, and improving land-use planning, the MBCP includes land-use<br />
management guidelines to ensure that development is appropriate and compatible with biodiversity. The<br />
<strong>Mpumalanga</strong> Provincial Government is committed to ensuring that the MBCP is implemented by provincial<br />
departments and municipalities. We trust that private and corporate landowners will join hands and<br />
support this initiative to promote the sustainable development of <strong>Mpumalanga</strong>.<br />
Signed<br />
Mr S. W. Lubisi (MPL)<br />
M P U M A L A N G A<br />
<strong>Biodiversity</strong><br />
FOREWORD<br />
MEC Economic Development and <strong>Plan</strong>ning<br />
CONSERVATION PLAN HANDBOOK v<br />
FOREWORD
MPUMALANGA BIODIVERSITY CONSERVATION PLAN HANDBOOK<br />
vi<br />
LIST OF ACRONYMS AND ABBREVIATIONS<br />
ARC Agricultural Research Council<br />
CBD Convention on Biological Diversity<br />
CR Critically Endangered conservation status<br />
CSIR Council for Scientific and Industrial Research<br />
DEAT Department of Environment Affairs and Tourism<br />
DEDP Department of Economic Development and <strong>Plan</strong>ning<br />
DWAF Department of Water Affairs and Forestry<br />
EIA Environmental impact assessment<br />
EN Endangered conservation status<br />
GIS Geographic information system<br />
GP Gauteng Province<br />
IUCN World <strong>Conservation</strong> Union<br />
KZN KwaZulu Natal Province<br />
LT Least Threatened conservation status<br />
MBCP <strong>Mpumalanga</strong> <strong>Biodiversity</strong> <strong>Conservation</strong> <strong>Plan</strong><br />
MEC Member of the (provincial) Executive Council<br />
MPB <strong>Mpumalanga</strong> Parks Board<br />
MTPA <strong>Mpumalanga</strong> Tourism and Parks Agency (formerly MPB)<br />
NEMA National Environmental Management Act<br />
NEPAD New <strong>Plan</strong> for African Development<br />
NGO Non-government organisation<br />
NP National park<br />
NSBA National Spatial <strong>Biodiversity</strong> Assessment<br />
PA Protected area<br />
PESC Present ecological status class<br />
SABIF South African <strong>Biodiversity</strong> Information Forum<br />
SADC Southern African Development Community<br />
SANBI South African National <strong>Biodiversity</strong> Institute<br />
SANParks South African National Parks<br />
SBP Systematic biodiversity planning<br />
SEA Strategic environmental assessment<br />
TFCA Trans-frontier conservation area<br />
VU Vulnerable conservation status<br />
WfW Working for Water<br />
WHC World Heritage Convention<br />
> Greater than<br />
< Less than<br />
M P U M A L A N G A<br />
<strong>Biodiversity</strong><br />
CONSERVATION PLAN HANDBOOK
THE MBCP IN CONTEXT<br />
EXECUTIVE SUMMARY<br />
The <strong>Mpumalanga</strong> Tourism and Parks Agency (MTPA) and the Department of Agriculture and Land<br />
Administration (DALA) have jointly developed the <strong>Mpumalanga</strong> <strong>Biodiversity</strong> <strong>Conservation</strong> <strong>Plan</strong> (MBCP). As<br />
the first such plan produced for the Province, it is intended to guide conservation and land-use decisions in<br />
support of sustainable development.<br />
The project has been funded by the Development Bank of Southern Africa and widely supported from<br />
outside the Province by planners and scientists from the South African National <strong>Biodiversity</strong> Institute (SANBI),<br />
and from other provinces, universities and research institutes.<br />
The MBCP takes its mandate from the South African Constitution, the National <strong>Biodiversity</strong> Act (10 of 2004)<br />
and the MTPA Act 10 of 1998. These and other statutes require the state to provide for a conserved and<br />
healthy environment that supports sustainable development and is safe and healthy for all citizens. At national<br />
level the first steps in carrying out this mandate have produced the National Spatial <strong>Biodiversity</strong><br />
Assessment, 2004 (Driver et al. 2005) and National <strong>Biodiversity</strong> Strategy and Action <strong>Plan</strong> (DEAT, 2005).<br />
The MBCP builds on these national plans at the provincial level in <strong>Mpumalanga</strong>. It is intended to be used by<br />
all who are involved in land-use and development planning, most particularly those specialists who need a<br />
comprehensive source of biodiversity information. It provides a basis for MTPA to review its biodiversity<br />
conservation policy and to focus its attention on high value areas for future protection initiatives. The plan,<br />
and in particular its land-use guidelines, are intended to supplement other spatial planning tools such as<br />
municipal Integrated Development <strong>Plan</strong>s and Spatial Development Frameworks. The MBCP will also be a<br />
useful addition to the information disseminated by agricultural extension and environmental education<br />
practitioners in Government and the private sector.<br />
The text of this handbook sets the statutory context by outlining the laws which define the state’s mandate<br />
to protect and manage biodiversity. It then proceeds to broadly describe the biomes and ecosystems that<br />
occur in the Province, treating rivers and wetlands separately and emphasising their importance, both in<br />
biodiversity and water conservation. Aspects of ecosystem functioning are also covered in these descriptions,<br />
to provide some understanding of how habitats differ and the way they respond to various management<br />
activities. The distribution of biomes and vegetation types is displayed in maps. Ecosystem status, a measure<br />
of the extent to which each vegetation type has been transformed by loss of natural habitat, is assessed and<br />
also mapped.<br />
ANALYSIS<br />
The MBCP is founded on an extensive biodiversity database compiled over the last 21 years by the Province’s<br />
conservation biologists. These detailed records, together with the latest mapping and remote sensing data on<br />
vegetation, land use and water resources, have been combined and subjected to sophisticated analyses. The<br />
science on which MBCP is based is the best available and the data, despite having gaps and limitations,<br />
is also the best there is. Nearly 500 biodiversity features were used in the MBCP, 340 terrestrial and 157<br />
aquatic features, covering the entire landscape of the Province.<br />
M P U M A L A N G A<br />
<strong>Biodiversity</strong><br />
The MBCP uses the Systematic <strong>Biodiversity</strong> <strong>Plan</strong>ning approach. This involves selecting a range of<br />
biodiversity features, the data for which are allocated to 65 000 planning units of 118 hectares each.<br />
Quantitative targets are set for each biodiversity feature, indicating how much is needed to ensure their<br />
persistence in the landscape. Using sophisticated GIS-based software and the planning program Marxan, the<br />
EXECUTIVE SUMMARY<br />
CONSERVATION PLAN HANDBOOK vii<br />
EXECUTIVE SUMMARY
MPUMALANGA BIODIVERSITY CONSERVATION PLAN HANDBOOK<br />
viii<br />
distribution of these features relative to their targets is analysed, and allocated ‘irreplaceability’ values. The<br />
mapped output of this analysis displays the most efficient distribution of planning units that allows the<br />
biodiversity feature targets to be met. Marxan was chosen for a variety of technical reasons and because it<br />
provides for greater flexibility and innovation in its outputs. Its advantages include: minimising land use<br />
conflicts; achieving ‘intelligent clumping’ of planning units of equivalent high value; the use of planning units<br />
small enough to allow fine scale as well as provincial scale planning; and the integration of terrestrial<br />
and aquatic biodiversity in a single spatial plan. These features have not appeared before in systematic<br />
biodiversity plans. As these innovations indicate, the MBCP is among the most advanced local applications<br />
of biodiversity planning to date. Several of the advisors to the MBCP are among those South African<br />
scientists considered at the forefront of this technology worldwide.<br />
Two principal maps result from these analyses. The first is the main MBCP map which indicates where the<br />
overall biodiversity priorities are located. The second is the aquatic biodiversity map (Figure 4.2) which<br />
indicates where aquatic biodiversity targets will best be met and at the same time, the location of the most<br />
important subcatchments for water production. Figure 4.2 should not be confused with the Aquatic<br />
<strong>Biodiversity</strong> Assessment map on the MBCP poster (see Chapter 5).<br />
RESULTS<br />
The MBCP maps the distribution of the Province’s known biodiversity into six categories. These are ranked<br />
according to ecological and biodiversity importance and their contribution to meeting the quantitative targets<br />
set for each biodiversity feature. The categories are:<br />
1. Protected areas - already protected and managed for conservation;<br />
2. Irreplaceable areas - no other options available to meet targets––protection crucial;<br />
3. Highly Significant areas - protection needed, very limited choice for meeting targets;<br />
4. Important and Necessary areas - protection needed, greater choice in meeting targets;<br />
5. Ecological Corridors – mixed natural and transformed areas, identified for long term connectivity<br />
and biological movement;<br />
6. Areas of Least Concern – natural areas with most choices, including for development;<br />
7. Areas with No Natural Habitat Remaining – transformed areas that make no contribution to meeting<br />
targets.<br />
The categories 2, 3, 4 and 6 were determined by analysis in Marxan. No Natural Habitat Remaining was<br />
added later. ‘Ecological Corridors’ were then selected along river lines, altitudinal gradients and mountain<br />
ranges, based on expert judgement. Selection of corridors was also guided by the need to link important biodiversity<br />
areas and promote connectivity. Corridor width was set at 7 km, which allows for the needs of most<br />
species to move within habitats that are already fragmented. Due to the existing fragmentation of natural<br />
habitat in corridors, this should be treated as a guideline rather than a precise measure.<br />
The pattern of biodiversity distribution shows the high value areas distributed prominently along the north<br />
eastern escarpment and in known areas of high plant endemism, such as the Barberton, Sekhukhuneland,<br />
Wakkerstroom and Lydenburg/Dullstroom areas. It also clearly shows the lack of protected areas in the grassland<br />
biome and the extent of forestry and agricultural transformation in this region. The savanna region of the<br />
Province is by far the best conserved, due to the dominant contribution of the southern Kruger National Park<br />
M P U M A L A N G A<br />
to the provincial analysis.<br />
<strong>Biodiversity</strong><br />
The significance of sustainable freshwater supplies is acknowledged and integrated into the terrestrial<br />
analysis. About 50% of aquatic irreplaceability values is captured in the overall analysis and incorporated into<br />
the terrestrial biodiversity map. The aquatic data are also mapped and presented separately in the 1 503<br />
CONSERVATION PLAN HANDBOOK
subcatchment planning units. This allows for specific consideration of water conservation issues in strategic<br />
planning.<br />
The MBCP provides a basis for better informed decisions in establishing and managing both existing and<br />
future protected areas. It presents clear priorities for locating as well as for scheduling conservation efforts.<br />
This is especially important for irreplaceable sites that are under pressure from potentially destructive<br />
development. For the first time it empowers biodiversity decision makers to be proactive rather than<br />
reactive, as they have had to be in the past. It also provides land-use and development planners with the<br />
same proactive capability.<br />
LAND-USE GUIDELINES<br />
The MBCP is accompanied by land-use planning guidelines to guide planning and development within each<br />
of the biodiversity conservation categories throughout the Province. In each category there are different landuse<br />
and development consequences. In time the guidelines need to be formalised as distinct ‘Codes of Best<br />
Practice’ and eventually as regulations to achieve sustainable development. The guidelines are arranged to<br />
address terrestrial and aquatic biodiversity issues, with the aquatic ones being split into those relating to rivers<br />
and to wetlands.<br />
As summarised in Table 6.1, the MBCP identifies 24.2% of the Province, outside of protected areas, that must<br />
be managed using biodiversity friendly forms of land use to ensure ‘living landscapes’ into the future.<br />
Protected areas account for a further 14.8%, including the southern Kruger NP at 10.4%. The remaining 61%<br />
of the Province allows for considerable freedom of choice for development, provided EIA procedures guide<br />
all development proposals. The MBCP suggests that ‘Irreplaceable’, ‘Highly Significant’ and ‘Important and<br />
Necessary’ areas should remain unaltered and be managed for biodiversity by various means. Other<br />
categories incorporate increasing options for different types of land use that should be decided by the<br />
application of EIA procedures and negotiation between stakeholders. A land-use suitability matrix presents<br />
these relationships at a glance in Table 6.2.<br />
The guidelines relate to 15 different types of land uses, ranked according to their impact on biodiversity:<br />
Rural land uses that<br />
are more or less<br />
biodiversity friendly<br />
1. <strong>Conservation</strong> management<br />
2. Extensive game farming<br />
3. Extensive livestock production<br />
4. Rural recreational development<br />
Rural land uses that have<br />
moderate to high impact on<br />
biodiversity<br />
5. Rural (communal) settlement<br />
6. Dryland crop cultivation<br />
7. Intensive animal farming<br />
8. Irrigated crop cultivation<br />
9. Timber production<br />
Urban and industrial land uses that<br />
are not only destructive<br />
of biodiversity but export their<br />
negative impacts to rural areas<br />
10. Urban & business development<br />
11. Major development projects<br />
12. Linear engineering structures<br />
13. Water projects & transfers<br />
14. Underground mining<br />
15. Surface mining, dumping, dredging<br />
M P U M A L A N G A<br />
<strong>Biodiversity</strong><br />
CONSERVATION PLAN HANDBOOK<br />
EXECUTIVE SUMMARY<br />
ix<br />
EXECUTIVE SUMMARY
MPUMALANGA BIODIVERSITY CONSERVATION PLAN HANDBOOK<br />
xxii<br />
The guidelines suggest restricting permissible land uses within each biodiversity conservation category<br />
as follows:<br />
Protected Areas<br />
Land use types 1 and 2 only permitted, type 3 allowed under restriction;<br />
Irreplaceable Areas<br />
Land use types 1 to 3 permitted, unavoidable developments require strict controls ;<br />
Highly Significant Areas<br />
Land use types 1 to 3 permitted, type 4 and unavoidable developments, as above;<br />
Important and Necessary Areas<br />
Land use types 1 to 3 recommended, types 4 and 5 allowed under restriction;<br />
Ecological Corridors<br />
Land use types 1 to 3 recommended, all other land uses permitted only under restriction;<br />
timber production (9) and urban development (10) not permitted in corridors;<br />
Areas of Least Concern<br />
All land uses permitted, although several require restrictions (see Table 6.2).<br />
The MBCP also identifies the 35.8% of the Province that has ‘No natural habitat remaining’ and which has<br />
very little biodiversity value. The general mechanism of applying these guidelines will rely substantially on<br />
reinforcing the use of EIA procedures and regulations by means of specialist biodiversity surveys by locally<br />
knowledgeable experts.<br />
M P U M A L A N G A<br />
<strong>Biodiversity</strong><br />
CONSERVATION PLAN HANDBOOK
CHAPTER 1<br />
..........................<br />
INTRODUCTION<br />
CHAPTER 1 - INTRODUCTION<br />
The mandate for conserving biodiversity lies with many state agencies at national, provincial and local levels<br />
of government. It is part of a wider responsibility for the environment and the sustainable use of natural<br />
resources. Constitutional and other national laws require these environmental issues to be dealt with in<br />
cooperative, participatory, transparent and integrated ways. With this in mind the <strong>Mpumalanga</strong> <strong>Biodiversity</strong><br />
<strong>Conservation</strong> <strong>Plan</strong> (MBCP) follows the approach of the National Spatial <strong>Biodiversity</strong> Assessment (Driver et<br />
al. 2005). Both use a scientific analytical approach called Systematic <strong>Biodiversity</strong> <strong>Plan</strong>ning (SBP) and share<br />
certain data sources and assessment procedures (Chapters 4 & 5).<br />
This handbook provides an explanation of the MBCP and how to use it. It is a spatial rather than an<br />
operational plan and forms part of a wider set of national biodiversity planning initiatives supported<br />
by South African National <strong>Biodiversity</strong> Institute (SANBI). It provides a relatively detailed and quantified<br />
provincial contribution to the country-wide biodiversity planning effort that is provided for by both national<br />
and international legislation (Chapter 5).<br />
The text provides background to biodiversity and its importance and outlines the biomes and other<br />
biodiversity highlights of <strong>Mpumalanga</strong> (Chapter 3). It discusses how these features are analysed and<br />
integrated into the spatial plan. Guidelines are provided, describing the most sustainable land uses suited<br />
to areas of different biodiversity value (Chapter 6). Combining the map with the guidelines, via the GISbased<br />
electronic application on CD, enables access to comprehensive biodiversity information at the touch<br />
of a button. The ability to display this information at a range of scales, from provincial to local, provides<br />
for quick and precise identification of development planning issues related to biodiversity.<br />
1<br />
INTRODUCTION
MPUMALANGA BIODIVERSITY CONSERVATION PLAN HANDBOOK<br />
2<br />
Bateleur<br />
Terathopius ecaudatus<br />
It is biodiversity that<br />
directly drives a large<br />
part of the economy of the<br />
Province. The<br />
<strong>Mpumalanga</strong> tourism<br />
industry alone, built on<br />
wildlife and natural<br />
scenic beauty, earned<br />
more than<br />
R6 billion in 2003 and it<br />
creates more than<br />
350 000 jobs in some way<br />
dependent on tourism.<br />
PURPOSE OF THE MBCP<br />
The MBCP is the first spatial biodiversity plan for <strong>Mpumalanga</strong> that is based on scientifically<br />
determined and quantified biodiversity objectives. The purpose of the MBCP is to contribute<br />
to sustainable development in <strong>Mpumalanga</strong><br />
Its specific objectives are:<br />
1. To guide the MTPA in implementing its biodiversity mandate, including working with<br />
landowners to improve the provincial protected area network.<br />
2. To provide biodiversity information that supports land-use planning and helps to<br />
streamline and monitor environmental decision-making.<br />
More broadly, the MBCP provides a scientifically based planning and monitoring tool for<br />
biodiversity conservation for the <strong>Mpumalanga</strong> Tourism and Parks Agency (MTPA). For DALA,<br />
it serves to encourage environmental regulators to be pro-active in dealing with the<br />
competing pressures for economic development and biodiversity conservation. Finding this<br />
delicate balance is the ultimate goal of land use planning and sustainable development.<br />
There has never before been spatial biodiversity information readily available in a single<br />
comprehensive source. Now that it exists, it is vital for it to be used in development<br />
decision making. The biodiversity priority areas identified in MBCP should inform environmental<br />
assessment (including SEA and EIA) and development authorisations, and should be<br />
incorporated into Spatial Development Frameworks.<br />
BOX 1.1: WHAT IS BIODIVERSITY AND<br />
WHY SHOULD WE BE CONCERNED ABOUT IT?<br />
(Driver et al. 2005)<br />
‘The term biodiversity refers to … plants and animals, ecosystems and landscapes, and the<br />
ecological and evolutionary processes that that allow these … to persist over time. South<br />
Africa’s biodiversity provides an important basis for economic growth and development, in<br />
obvious ways such as … rangelands that support commercial and subsistence farming,<br />
horticultural and agricultural industry based on indigenous species, the tourism industry,…<br />
and commercial and non-commercial medicinal applications of indigenous resources.<br />
Keeping our biodiversity intact is also vital for ensuring ongoing provision of ecosystem services<br />
such as production of clean water through good catchment management, prevention of<br />
erosion, carbon storage (to counteract global warming), and clean air. Loss of biodiversity<br />
puts aspects of our … life at risk, and reduces socio-economic options for future generations.<br />
People are ultimately dependent on living, functioning ecosystems and the services they<br />
provide. Loss of biodiversity leads to ecosystem degradation … which tends to harm the<br />
rural poor more directly … while the wealthy are buffered against the loss of ecosystem<br />
services by being able to purchase basic necessities and scarce commodities. Our path<br />
towards sustainable development, poverty reduction and enhanced human well-being for all,<br />
is therefore dependent on how effectively we conserve biodiversity.’
INTENDED USERS<br />
The maps and accompanying text are intended first and foremost<br />
for technical users in MTPA and DALA, and for<br />
development planners. The target audience includes<br />
all stakeholders in the development and environmental<br />
planning profession. This is referred to as the ’primary user<br />
group’. It includes:<br />
MTPA officials and relevant landowners;<br />
DALA officials, including EIA regulators;<br />
<strong>Plan</strong>ning and environmental assessment specialists;<br />
Town and regional planners in municipalities and<br />
provincial government;<br />
<strong>Biodiversity</strong> and conservation scientists in the private<br />
and NGO sectors.<br />
For the local conservation agency (MTPA), the MBCP<br />
includes a review of the Protected Areas (PA) network, both<br />
on public and private land, identifying the relative contribution<br />
of each type of PA. The plan also informs land-use and<br />
development planning throughout the Province to ensure the<br />
persistence of biodiversity and the delivery of vital ecosystem<br />
services. This is the responsibility of the provincial environmental<br />
authority, which is currently DALA. In spite of the<br />
intended users being largely technical people, trouble has<br />
been taken to produce products, especially the map, meaningful<br />
to the general public. Widespread public<br />
understanding of MBCP is vital for its effective implementation<br />
in the long run. A separate technical report, with details of<br />
all the data layers and analyses, is held by the Scientific<br />
Services division of the MTPA (see page iv).<br />
SCOPE OF MBCP<br />
The MBCP covers the whole Province, including all crossboundary<br />
municipalities whose final delimitation is still<br />
unresolved. In terms of scale, MBCP uses relatively small,<br />
118 ha hexagonal planning units which provides a scale that<br />
can be used at both local municipal and provincial level.<br />
M P U M A L A N G A<br />
<strong>Biodiversity</strong><br />
CHAPTER 1 - INTRODUCTION<br />
The MBCP planning domain is flanked by two existing<br />
provincial biodiversity plans, those for KwaZulu Natal and for<br />
Gauteng. The KZN and GP planning teams have been<br />
consulted and the data sets harmonised as far as possible.<br />
Since inception of this work two additional bioregional<br />
planning projects that will overlap with MBCP have been<br />
initiated and/or proposed: the National Grassland<br />
<strong>Biodiversity</strong> Programme, which is in the project design<br />
phase; and the North Eastern Escarpment Bioregional <strong>Plan</strong>,<br />
which is still in the preliminary discussion phase. MBCP will<br />
feed into these two projects as and when required.<br />
A broader aspect of the scope of the MBCP is its<br />
intended contribution to public understanding of biodiversity<br />
conservation. This assessment and, more importantly, any<br />
subsequent ‘Strategy and Action <strong>Plan</strong>’ that results from Phase<br />
2 need to be widely understood and accepted by decision<br />
makers and the public. Public awareness is therefore a focus<br />
of both phases. In Phase 1 we target key leaders, decision<br />
makers and planners; a limited but very important audience<br />
whose support is needed to pave the way for a much wider<br />
public education effort in Phase 2.<br />
IMPLEMENTATION (PHASE 2)<br />
Phase 1 of the MBCP project has produced this handbook<br />
and its accompanying map and CD Rom. Phase 2 will deal<br />
with implementation and capacity building. This is often<br />
referred to as ‘mainstreaming biodiversity’ - into the main<br />
sectors of the economy. Implementation will provide<br />
capacity-building for the agencies mainly responsible for<br />
MBCP, namely MTPA, DEDP and DALA. This will also be<br />
provided more widely to those involved in development<br />
planning, especially planners in local government at district<br />
and local municipalities. As mentioned above, there will also<br />
be a substantial public awareness and education component.<br />
CONSERVATION PLAN HANDBOOK<br />
3<br />
INTRODUCTION
MPUMALANGA BIODIVERSITY CONSERVATION PLAN HANDBOOK<br />
Specifically, Phase 2 will focus on:<br />
Building the capacity of environmental officials and planners to use MBCP and its land-use guidelines in environmental<br />
THE PROJECT PROCESS<br />
After the publication of the Cape Action <strong>Plan</strong> for the Environment (a systematic biodiversity plan for the Cape Floristic Region)<br />
in 2000, both DALA and the then <strong>Mpumalanga</strong> Parks Board (MPB) recognised the need for such an assessment in<br />
<strong>Mpumalanga</strong>. Implementing this idea was no simple task as the necessary skills and support in the form of experienced<br />
4<br />
assessments and development planning;<br />
Supporting a strategic review of MTPA’s biodiversity conservation priorities;<br />
Developing a conservation stewardship programme working with landowners to conserve priority sites;<br />
Filling information gaps for future revision and improvement of MBCP.<br />
Implementation will also need to target planners from the private (development) sector and consulting planners who are often<br />
the contracted service providers to underskilled municipalities. Direct training and mentoring of primary users of the plan<br />
may also be undertaken in situations of most need.<br />
BOX 1.2: CONSERVATION STEWARDSHIP PROGRAMME<br />
A <strong>Conservation</strong> Stewardship programme recognises the value of biodiversity on private land and the conservation role that<br />
private land owners can play in helping to meet provincial biodiversity targets. Stewardship is defined as ‘…the protection,<br />
management and wise use of the natural resources that have been entrusted into your care’.<br />
The programme provides for the legal protection of important biodiversity areas in return for economic, legal and technical<br />
support benefits. Stewardship arrangements are innovative and adaptive to the individual needs of the land owner and yet<br />
provide binding long-term security for biodiversity assets. Such programmes, which are already well developed in other<br />
provinces, are in the earliest stages of development in <strong>Mpumalanga</strong> and not yet fully operational.<br />
Stewardship offers three tangible products to land owners, each providing different levels of protection and support.<br />
Contract nature reserves (minimum period of 30 years);<br />
Protected environments (legal agreements between owners and MTPA);<br />
Conservancies (land owner cooperative agreements).<br />
The first two options offer legally binding status with contract nature reserves having the added benefit of ‘rates exclusion’ ( see<br />
page 8). Conservancies provide a softer option that is not legally binding but attracts technical and managerial support from<br />
MTPA. It is important to note that the programme is NOT a means to provide the MTPA with uninvited access to private land.<br />
Both the conservation initiative and land ownership remain 100% with the land owner.<br />
The process of participating in a Stewardship Programme involves the following steps:<br />
On-site assessment (the land must qualify as being of high biodiversity value);<br />
Definition in writing of the level of commitment from the land owner;<br />
The drafting of management plans jointly by the land owner and MTPA;<br />
Finalising contractual agreements (signed by MEC and land owner);<br />
Declaration of protected area status;<br />
Negotiation with the local municipality to unlock economic benefits.<br />
M P U M A L A N G A<br />
academics and technically skilled NGOs, were almost non-existent in the Province. Those who realised its potential persisted<br />
<strong>Biodiversity</strong><br />
and in early 2004 a joint proposal was forwarded to the Development Bank of Southern Africa to fund the project to the<br />
extent of R550 000. Phase 1 was initiated in February 2005 and has been completed in just over 18 months. It has been<br />
guided by a combined Steering Committee, comprising representatives from the relevant provincial departments, SANBI and<br />
various technical specialists and advisors.<br />
CONSERVATION PLAN HANDBOOK
CHAPTER 2<br />
..........................<br />
POLICY AND LEGISLATION<br />
CHAPTER 2 - POLICY & LEGISLATION<br />
Systematic <strong>Biodiversity</strong> <strong>Plan</strong>ning (SBP) is an empowering tool for applying aspects of South Africa’s bold new<br />
environmental legislation. From the powerful clauses in the Constitution to the yet-to-be written regulations<br />
for the <strong>Biodiversity</strong> Act of 2004, South Africa has never before had such empowering environmental<br />
legislation. The creation of SANBI to support this complex cross-sectoral activity is part of the benefit of<br />
these far-sighted laws. Together they are a wise investment in a brighter, greener future for all South Africans.<br />
As a provincial biodiversity plan, MBCP is part of the broad intention of the legislation to have biodiversity<br />
conservation mainstreamed into all facets of development. The MBCP provides for this to happen with clear<br />
priorities in terms of location and in terms of urgency, by means of its assessment of the pressures affecting<br />
biodiversity. To work, it must be widely publicised to guide the policies, decisions and actions of many<br />
people and agencies.<br />
Globally, there is growing emphasis on biodiversity conservation. This is largely a response to rapidly rising<br />
pressure on, and consumption of, the world’s natural resources. In South Africa, loss and degradation of<br />
natural habitat are the biggest pressures on biodiversity. They are heightened by the strong and expanding<br />
economy and the drive for job creation through growth. The resultant pressure on our globally recognised<br />
biodiversity is marked and widespread. South Africa has world class policies and legislative tools for<br />
biodiversity conservation – the challenge is to implement them effectively.<br />
Policy and laws operate at many levels. There are four significant levels to be aware of:<br />
1. Global / International / Multinational - including NEPAD<br />
2. National / Regional - including SADC<br />
3. Provincial / Subregional - including good neighbour agreements (TFCAs)<br />
4. Municipal, both Local and District<br />
5
MPUMALANGA BIODIVERSITY CONSERVATION PLAN HANDBOOK<br />
NATIONAL AND INTERNATIONAL<br />
LAWS<br />
At the international level, South Africa is signatory to several<br />
conventions and treaties intended to benefit biodiversity and<br />
the environment. These include:<br />
Nine agreements dealing with the use of marine and<br />
6<br />
coastal resources;<br />
Five dealing with global biodiversity conservation<br />
(terrestrial and marine);<br />
Three agreements dealing with commercial and<br />
trade issues;<br />
Three agreements dealing with aspects of global<br />
climate change.<br />
These global agreements are attempts to define international<br />
norms and standards for addressing global problems. In effect<br />
they represent guidelines for ‘universal best practice’. The<br />
agreements rely more on international peer pressure than on<br />
legal enforcement to achieve their objectives, although some<br />
are ratified in terms of our national laws. However, their<br />
direct and indirect influence on South African legislation<br />
has been substantial as many were sources of reference<br />
for the drafting of our own new and widely acclaimed<br />
environmental legislation.<br />
International agreements most relevant to biodiversity in<br />
<strong>Mpumalanga</strong> are: the Convention on Biological Diversity<br />
(CBD, 1992); the Convention on International Trade in<br />
Endangered Species (1973); the World Heritage Convention<br />
(WHC, 1997); and the Kyoto Protocol on World Climate<br />
Change (2003). The first two of these agreements are given<br />
effect in national legislation. The most directly relevant of<br />
these is the CBD which sets out the most succinct and widely<br />
applicable objectives for biodiversity conservation. The<br />
Convention has three objectives:<br />
The conservation of biodiversity;<br />
The sustainable use of biological resources;<br />
The fair and equitable sharing of benefits from the use<br />
of biodiversity.<br />
The CBD, which was signed by 178 governments in Rio de<br />
Janeiro in 1992, was formally adopted by South Africa in<br />
1995. At the same time South Africa became a signatory to<br />
Agenda 21 and adopted a Local Agenda 21 Action <strong>Plan</strong>.<br />
M P U M A L A N G A<br />
Agenda 21 is an international programme centred on the<br />
<strong>Biodiversity</strong><br />
realisation that the world cannot continue with present<br />
policies that increase poverty, hunger, sickness and illiteracy<br />
and cause continuing deterioration of ecosystems on which<br />
all life depends. Local Agenda 21 results from South Africa’s<br />
obligation to its international Agenda 21 agreement. It is<br />
basically a localgovernment-led, community-wide, and<br />
participatory effort to adopt a comprehensive and<br />
sustainable strategy for environmental protection, economic<br />
prosperity and community well-being at the local level (Job,<br />
2006).<br />
At a national level the South African Constitution (Act 108 of<br />
1996) and its Bill of Rights (Section 24) states:<br />
‘Everyone has the right –<br />
a. To an environment that is not harmful to their health<br />
or well-being; and<br />
b. To have the environment protected for the benefit of<br />
present and future generations, through reasonable<br />
legislative and other measures that –<br />
i. prevent pollution and ecological degradation;<br />
ii. promote conservation;<br />
iii. secure ecologically sustainable development<br />
and use of natural resources while promoting<br />
justifiable economic and social development.’<br />
The Constitution provides for these rights to be balanced<br />
with other rights in the fields of social and economic<br />
development. The Constitution also allocates mandates and<br />
powers to various state agencies and requires them to<br />
cooperate at all levels in executing these powers.<br />
Influenced by the Constitution and international norms and<br />
agreements, national laws have been passed giving effect<br />
to these rights. The most important of these for biodiversity<br />
conservation include:<br />
<strong>Conservation</strong> of Agricultural Resources Act (43 of 1983)<br />
Environment <strong>Conservation</strong> Act (73 of 1989) [partly<br />
redundant since the new EIA regulations were<br />
published in 2006]<br />
National Forests Act (84 of 1998)<br />
National Environmental Management Act (NEMA, 107<br />
of 1998)<br />
National Water Act (36 of 1998)<br />
World Heritage Convention Act (49 of 1999)<br />
The Protected Areas Act (Act 57 of 2003)<br />
The <strong>Biodiversity</strong> Act (Act 10 of 2004)<br />
These are the laws most directly relevant for environmental<br />
management and, therefore, biodiversity. There are many<br />
others that have more indirect relevance. A key element is<br />
that all organs of state at all levels are required to contribute<br />
to environmental management including biodiversity<br />
CONSERVATION PLAN HANDBOOK
For summaries of the more important national<br />
legislation relating to land-use planning and environmental regulation, see Appendix 1,<br />
Environmental Legislation. A more comprehensive list with discussion of<br />
these laws is available in DEAT (2005).<br />
NEMA is central to South Africa’s new approach to managing difficult environmental issues.<br />
This is an enabling or framework Act that sets out the overarching principles that guide the<br />
formulation of subsequent laws and regulations. NEMA lists nearly thirty principles, intended<br />
to define the relationship the law seeks to establish between people and their environment.<br />
Much shortened, these principles include:<br />
The need to balance environmental rights with socio-economic rights;<br />
Placing people and their needs at the forefront of concern;<br />
Development must be sustainable, environmentally and socioeconomically;<br />
Negative impacts, e.g. pollution, waste etc., to be avoided, minimised or remedied;<br />
The ‘polluter pays’ principle applies to environmental impacts and their costs;<br />
Environmental management needs to be integrated and participatory;<br />
Environmental justice and equitability must be observed;<br />
People should be informed and empowered by environmental information;<br />
Conflicts of interest must be resolved by negotiation;<br />
Sensitive ecosystems, such as wetlands, require special measures;<br />
(See also Appendix 1 for NEMA’s relevance to development planning).<br />
PROVINCIAL LEGISLATION<br />
Provincial legislation relevant to biodiversity conservation is comprised of two Provincial Acts,<br />
the <strong>Mpumalanga</strong> Nature <strong>Conservation</strong> Act (Act 10 of 1998) and the <strong>Mpumalanga</strong> Tourism<br />
and Parks Agency Act (Act 5 of 2005). The first sets out how wild species are to be managed<br />
in terms of human use, such as collecting, fishing, hunting, capture, transport and trade. It<br />
deals with rare and endangered species and the powers needed to protect them, and the<br />
protection of sensitive natural sites from damage and exploitation.<br />
The second and most recent Act has created the <strong>Mpumalanga</strong> Tourism and Parks Agency<br />
(MTPA) in 2006, with a specific mandate to<br />
‘Promote and sustainably manage tourism and nature conservation and provide<br />
for the sustainable use of natural resources.’<br />
In pursuing its objectives, the MTPA is required to:<br />
Conserve and manage biodiversity and ecosystems;<br />
Develop and manage protected areas;<br />
Promote, develop and market tourism;<br />
Create growth and transformation within the industry, and thereby economic and<br />
employment opportunities for disadvantaged people.<br />
In all that it does, the MTPA is required to liaise and consult with all relevant stakeholders<br />
including,<br />
M P U M A L A N G A<br />
CHAPTER 2 - POLICY & LEGISLATION<br />
Knysna Toraco<br />
Tauraco corythaix<br />
Although South Africa<br />
has very little indigenous<br />
forest, covering only<br />
0.56% of its land area<br />
and only 0.46% of<br />
<strong>Mpumalanga</strong>, the forest is<br />
home to a<br />
disproportionately high<br />
share of biodiversity.<br />
In recent years the few<br />
patches of indigenous<br />
forest we have, have been<br />
subjected to clearance,<br />
encroachment by<br />
plantations, invasion by<br />
alien species, cutting of<br />
timber for fuel and<br />
construction and<br />
destruction of trees<br />
resulting from the<br />
collection of bark used<br />
<strong>Biodiversity</strong><br />
Owners of existing or potential tourist attractions;<br />
Owners of natural resources who may benefit from their use.<br />
for traditional medicines.<br />
CONSERVATION PLAN HANDBOOK 7<br />
POLICY & LEGISLATION
MPUMALANGA BIODIVERSITY CONSERVATION PLAN HANDBOOK<br />
The MTPA’s specific powers and functions include:<br />
8<br />
1. Protecting and managing natural resources, ecosystems and biodiversity and carrying out the necessary<br />
research and other scientific activities;<br />
2. Administering the <strong>Mpumalanga</strong> Nature <strong>Conservation</strong> Act, 1998, and any other conservation law, so as to:<br />
OPPORTUNITIES PRESENTED BY THE<br />
MUNICIPAL PROPERTY RATES ACT (6 OF 2004)<br />
In addition to the obvious tourism value of biodiversity, it makes economic sense for municipalities to manage their<br />
biodiversity sustainably. For example: protecting catchment areas will cost less in the long-term than treating polluted drinking<br />
water; retaining natural vegetation buffers along rivers and wetlands will cost less than repairing the damage after flooding.<br />
Opportunities exist for municipalities to encourage more sustainable forms of land management through their rates policies.<br />
The lost municipal revenue from such ‘forfeited’ rates are a) likely to be smaller than the long-term financial benefits, and<br />
b) may, in future, be recoverable from other sources of environmental support.<br />
Municipalities have several opportunities to encourage sound biodiversity management by including in their rates policies:<br />
Judicious exemptions for properties with threatened ecosystems (per MBCP <strong>Handbook</strong>);<br />
Rebates for property owners that invest in sound land management activities, such as regular clearing of invasive alien<br />
plants;<br />
Penalties for properties not complying with environmental directives;<br />
Allowing the property rates system to reflect reduced property values if the land has legally binding conservation<br />
restrictions.<br />
i. determine and enforce limits to sustainable use of natural resources;<br />
ii. design and implement management and harvesting strategies and techniques;<br />
iii. ensure the protection and survival of rare and endangered species;<br />
iv. manage and control the numbers and spread of invasive alien species, as well as the numbers, spread<br />
and activities of problem animals;<br />
v. establish and develop a representative network of Protected Areas and<br />
manage the use of such areas sustainably;<br />
vi. ensure that natural ecosystems, biodiversity and ecological functions and processes are maintained.<br />
3. Cooperating with responsible state agencies in order to:<br />
i. contribute to land use planning and the evaluation of development proposals;<br />
ii. formulate and implement ecotourism and outdoor recreation policies, strategies and programmes, in<br />
so far as they relate to conservation;<br />
iii. promote environmental education and public awareness of conservation;<br />
iv. provide information and extension services to the public in respect of all conservation issues and their<br />
legal aspects;<br />
v. advance scientific knowledge of conservation and technology transfer.<br />
4. Specifically, the MTPA shall:<br />
i. report annually to the MEC on the most appropriate legal and administrative mechanisms to conserve<br />
natural resources;<br />
ii. at the request of the MEC, enquire into any matter relating to conservation;<br />
iii. promote, plan, finance or assist the carrying out of any conservation project.<br />
Formal protected areas, whether state or privately owned, are automatically eligible for rates exclusion in terms of the<br />
Municipal Property Rates Act. Either a portion or the entire property may be declared a formal protected area.
CHAPTER 3<br />
..........................<br />
MPUMALANGA’S ECOSYSTEMS<br />
An ecosystem is a dynamic complex of plant, animal and microorganism communities and their nonliving<br />
environment, interacting as a functional unit (NEMA). Ecosystems operate at various scales; from a<br />
single wetland to an entire region such as a range of mountains. Groups of ecosystems with common<br />
characteristics at a landscape scale are called biomes. This chapter briefly describes <strong>Mpumalanga</strong>’s main<br />
ecosystems, with some notes on their functioning, diversity and ecological status.<br />
3.1 TERRESTRIAL ECOSYSTEMS<br />
CHAPTER 3 - MPUMALANGA’S ECOSYSTEMS<br />
THE BIOMES<br />
<strong>Mpumalanga</strong> is a warm summer-rainfall province, containing three of South Africa’s nine biomes: grassland<br />
(highveld and escarpment hills), savanna (escarpment foothills and lowveld) and forest (south and east<br />
facing escarpment valleys). Descriptions of these biomes are useful in understanding the biodiversity and<br />
ecological characteristics of the Province (Table 3.1). A map of the biomes is included in Figure 3.1.<br />
9<br />
ECOSYSTEMS
MPUMALANGA BIODIVERSITY CONSERVATION PLAN HANDBOOK<br />
10<br />
Common Greenshank<br />
Tringa nebularia<br />
Most species are<br />
completely dependent on<br />
a narrow range of<br />
environmental<br />
conditions and the food<br />
and shelter offered by<br />
those conditions. Even<br />
small changes can have<br />
lasting and devastating<br />
effects on whole<br />
populations. Birds like<br />
the migrant greenshank<br />
are not rare but they are<br />
restricted to feeding in<br />
water between about<br />
40mm and 120mm deep.<br />
TABLE 3.1 Extent of <strong>Mpumalanga</strong>’s three biomes.<br />
BIOME TOTAL SIZE (km 2 ) % OF REMAINING %TRANSFORMED<br />
MPUMALANGA NATURAL<br />
TRANSFORMATION<br />
Transformation refers to the removal or radical disturbance of natural vegetation, for<br />
example by crop agriculture, plantation forestry, mining or urban development.<br />
Transformation mostly results in a serious and permanent loss of biodiversity and fragmentation<br />
of ecosystems, which in turn lead to the failure of ecological processes. Remnants of<br />
biodiversity may survive in transformed landscapes.<br />
The MBCP transformation layer was created by merging the 1995 and 2000 National Land<br />
Cover maps. These maps were created from satellite images that had been classified (by the<br />
CSIR and ARC) into various land-use types, using remote sensing techniques. The MBCP<br />
transformation layer is the best available representation of lost natural habitat based on<br />
composite, six-year-old data. The composite layer was cross-checked against a false-colour<br />
satellite image taken in 2000, allowing mis-classified areas to be corrected.<br />
GRASSLAND<br />
Grassland defines itself: landscapes dominated by grass. Although grasses are the most visible<br />
plants, grasslands have a higher diversity than other herbaceous species, especially those with<br />
below-ground storage organs such as bulbs or tubers. These plants produce many of our<br />
spectacular wild flowers and contribute to biodiversity that is second only to the Cape Fynbos<br />
in species richness. Grassland species are particularly well adapted to being defoliated,<br />
whether by grazing, fire or frost. Repeated defoliation, within reason, does no real harm to<br />
such plants nor does it reduce productivity.<br />
African grasslands are particularly old, stable and resilient ecosystems. Most plants are<br />
perennials and surprisingly long lived, with very few annual species, which are the pioneer<br />
plants needed to repair disturbance. This makes our grasslands vulnerable to destruction by<br />
cultivation; once ploughed they are invaded by weedy pioneer plants that are mostly alien.<br />
Although many grassland plants do produce seed, very little germinates, most being used as<br />
vital food for their rich rodent and insect fauna.<br />
<strong>Mpumalanga</strong>’s grasslands are mainly found in the highveld above 1000m. These are cool,<br />
M P U M A L A N G A<br />
VEGETATION (km 2 )<br />
Grassland 531 61% 298 44%<br />
Savanna 338 39% 255 25%<br />
Forest 40 0.5% 39 1%<br />
Total 874 100% 558 36%<br />
dry open landscapes, with rainfall of over 500mm/yr. Frost, hail storms and lightning strikes<br />
<strong>Biodiversity</strong><br />
are common. It is the natural occurrence of fire and these other defoliating events that favour<br />
grassland plants over woody species and help maintain the open treeless character of grasslands.<br />
Grasslands have shallowrooted vegetation with a growing season limited to about six<br />
months of the year. The nongrowing seasons are characterised by cool and dry conditions,<br />
during which time most foliage is removed or killed by frost, and dies back to ground level.<br />
CONSERVATION PLAN HANDBOOK
Large parts of our grasslands occur on deep fertile soils of<br />
high agricultural value. Much of this landscape has already<br />
been converted to crops, timber or intensive animal production.<br />
The unproductive winter and spring seasons in<br />
grassland require agricultural strategies for livestock and cultivation<br />
that bridge this gap in economic productivity. Crop<br />
rotation, cultivated pastures and fallow intervals, as well as<br />
supplementary feeding of livestock, including the use of crop<br />
residues, are all part of good farming practice in these<br />
regions.<br />
Grasslands originally covered 61% of <strong>Mpumalanga</strong>, but 44%<br />
of this has been transformed by agriculture and other<br />
development. This substantial and irreversible reduction of<br />
the biome is due mainly to cultivation, especially industrialscale<br />
agriculture and timber growing. These land uses<br />
destroy biodiversity but extensive livestock grazing can be<br />
reasonably biodiversity-friendly, provided good management<br />
and safe stocking rates are applied.<br />
The palatability of grass and its value as food for livestock,<br />
increases with decreasing rainfall, which is also correlated<br />
with altitude. In grazing terms, this corresponds to sourveld<br />
in the moist highveld and sweetveld in the dryer lowveld.<br />
This grass palatability gradient extends from grassland into<br />
savannas. Although sweetveld grasses produce less biomass<br />
than sourveld grasses, they have higher food value and lower<br />
fibre. This means the plant nutrients are more available in<br />
lower rainfall areas due to less leaching of the soil by high<br />
rainfall. The 650mm rainfall isoline approximately separates<br />
these two livestock zones.<br />
Fire is a characteristic feature of grassland (and savannas) and<br />
is a necessary component of good land management.<br />
Grassland plants depend on fire, they resprout annually from<br />
their root-stocks. Without frequent fire, grasslands eventually<br />
become invaded with woody species and some herbaceous<br />
plants die. Regular burning to complement good grazing<br />
management helps to prevent the increase of species<br />
unpalatable to livestock, including woody species that form<br />
bush encroachment. Timber growing is mainly restricted to<br />
grasslands but its impact is not limited to the plantation<br />
“footprint”. It significantly reduces surface and underground<br />
water and causes the spread of some of the most damaging<br />
alien species. These effects, along with flammability of its<br />
M P U M A L A N G A<br />
tree species and the fire protection measures required, also<br />
<strong>Biodiversity</strong><br />
substantially change the fire regime in grasslands.<br />
The large number of rare and endangered species in<br />
grasslands is a particular problem for environmental impact<br />
assessment. They are mostly small, very localised and visible for<br />
only a few weeks in the year when they flower. Most surveys<br />
CHAPTER 3 - MPUMALANGA’S ECOSYSTEMS<br />
will not pick them up and special skills are required to locate<br />
and identify them reliably. Highest biodiversity is found in<br />
rocky grassland habitats and on sandy soils. Clay soils generally<br />
have the lowest biodiversity in grasslands.<br />
SAVANNA<br />
Savanna is the name for the typically African mixture of<br />
trees, shrubs and grass, also referred to as the bushveld, and,<br />
at lower altitudes, the lowveld. It varies from tall dense<br />
woodland in the warmest, wettest areas, through open<br />
woodland, to dense thicket. It includes wooded, shrubby hill<br />
slopes and grassy plains with scattered trees or bush-clumps.<br />
Diversity in savanna is provided by variation in soil-type and<br />
topography; koppies, river lines and anthills (termitaria)<br />
provide localised changes in soil moisture and nutrients<br />
which create different habitats for plants and animals.<br />
Savanna used to cover 39% of <strong>Mpumalanga</strong>, but 25% of the<br />
original area of savanna has been transformed. Savannas are<br />
important for livestock, especially cattle and more recently<br />
the wildlife and tourism industry. Broad-leaved and woody<br />
plants provide a valuable food source for browsers like kudu<br />
and giraffe. Grazing quality varies with rainfall: as rainfall<br />
increases, the nutritional value of grass decreases although<br />
there is more growth; in low rainfall areas there is less grass<br />
but it is more nutritious.<br />
Rain is frequently delivered in thunderstorm events with a<br />
high proportion of surface runoff. This creates flash flooding<br />
and vulnerability to soil erosion. The amount of rain that<br />
remains available to plants is reduced by the long, hot dryseasons,<br />
creating a strong water deficit where evaporation far<br />
exceeds rainfall. This is an important limitation for production<br />
land uses for agriculture and livestock. Only the most fertile<br />
deeper soils are used for cultivation. Bush encroachment or<br />
‘induced thicket’ can result from overgrazing by livestock.<br />
Bush encroachment reduces carrying capacity and is difficult<br />
to reverse, reducing the value of the land for livestock.<br />
Savannas are hotter than grasslands and are deciduous, i.e.<br />
most plants lose their leaves or die back in the dry season to<br />
conserve water. The woody plants are deeprooted, accessing<br />
moisture not available to grasses and herbs. The winter and<br />
spring seasons (May – October) are dry and have high wate<br />
stress for plants. This increases the likelihood of bushfires.<br />
Savannas are adapted to bushfires; grass and woody plants<br />
survive them well, so long as they are not too frequent or too<br />
fierce. A good wet season means lots of grass which in turn<br />
provides more fuel to burn and raises the risk of damaging<br />
wildfires late in the dry season.<br />
CONSERVATION PLAN HANDBOOK<br />
11<br />
ECOSYSTEMS
MPUMALANGA BIODIVERSITY CONSERVATION PLAN HANDBOOK<br />
12<br />
Nile Crocodile<br />
Crocodylus niloticus<br />
Crocodiles were once<br />
found in almost all warm<br />
waters in Africa. These<br />
ancient reptiles extend<br />
back in time even before<br />
the last of the dinosaurs<br />
and have hardly changed<br />
in their bodily form over<br />
the last 100 million years.<br />
Persecution, hunting for<br />
their hides and a<br />
dwindling habitat as a<br />
result of drainage and<br />
other human intervention<br />
has led to a great decline<br />
in their numbers. In<br />
South Africa they are now<br />
virtually restricted to the<br />
larger protected areas.<br />
FOREST<br />
The term ‘forest’ is used only for indigenous natural forests. In this sense commercial timber<br />
plantations are not forests. Indigenous evergreen trees that form a closed canopy are defined<br />
as forests. This year-round cover provides so much shade and moisture-conserving leaf litter<br />
that it limits the growth of ground-layer plants like grass. Forests have little to offer to livestock<br />
and are located mostly on steep slopes with sensitive soils not suited to cultivation.<br />
Forests are normally frost-free. Their dense vegetation and shade allow higher humidity and<br />
lower temperatures than surrounding areas. This means forest patches do not normally burn<br />
in bush-fires except around the perimeter. Very hot fires can shrink forests by continually<br />
eroding their edges. The vulnerability of the forest edge to fire is considerably increased by<br />
the presence of alien plants such as wattle, which increases the penetration of fire into<br />
forests.<br />
In <strong>Mpumalanga</strong>, forests occur in small scattered patches, mostly in river valleys in the escarpment<br />
region. They require high rainfall (over 725mm/yr) boosted through the dry season by<br />
groundwater from associated streams and added precipitation in the form of mist. Their<br />
scattered distribution and small patch size means they have rich biodiversity. This is<br />
dependent on the connectedness of patches, achieved through riverine linkages and access<br />
by specialised forest fauna such as birds and monkeys. Forest patches are vulnerable to<br />
many impacts due to their high edge-to-area ratio.<br />
Forests have significant cultural values as sources of traditional medicines and spiritual<br />
inspiration. Commercial harvesting of valuable plants and medicinal species, and the<br />
need for structural timber, are the main pressures on forest biodiversity. From a scenic and<br />
wilderness point of view forests are very popular with visitors. Their location and interplay<br />
with rivers and mountains provides the backdrop to much of <strong>Mpumalanga</strong>’s most popular<br />
scenic attractions. Hiking trails are strung with forest patches like beads on a necklace,<br />
running through the escarpment region. Indigenous forests protect water sources rather than<br />
drying them out, as is the case with timber plantations of pine and gum trees.<br />
Within biomes there are many ecosystems that can be defined at different scales. A useful<br />
way of classifying biodiversity within biomes is to use vegetation types as surrogates for<br />
ecosystems. Vegetation types work well for terrestrial ecosystems but do not effectively cover<br />
the important aquatic or freshwater systems.
N<br />
VEGETATION TYPES<br />
LEGEND<br />
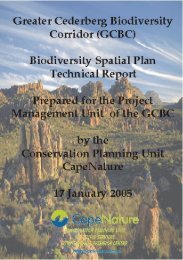
FIGURE 3.1: Distribution of three biomes and 68 vegetation types in <strong>Mpumalanga</strong>.<br />
CHAPTER 3 - MPUMALANGA’S ECOSYSTEMS<br />
BIOMES<br />
BIOMES<br />
Forest<br />
Grassland<br />
Savanna<br />
13<br />
ECOSYSTEMS
MPUMALANGA BIODIVERSITY CONSERVATION PLAN HANDBOOK<br />
14<br />
Painted reed frog<br />
Hyperolius viridiflavus<br />
Amphibians––frogs and<br />
toads––comprise about<br />
130 species in South<br />
Africa. Many of them<br />
play a crucial role in the<br />
control of a variety of<br />
insects including<br />
mosquitoes.<br />
In recent years numbers<br />
of amphibians are<br />
believed to have<br />
decreased drastically.<br />
The reason for the<br />
decline is uncertain but it<br />
is believed to be largely a<br />
result of climate change<br />
and increased<br />
exposure to ultra violet<br />
radiation.<br />
3.2 VEGETATION TYPES<br />
Vegetation types provide a good representation of terrestrial biodiversity because most<br />
animals, birds, insects and other organisms are associated with particular vegetation types<br />
(Rouget et al. 2004). In 2005 SANBI produced an extensively revised vegetation map for<br />
South Africa, Lesotho and Swaziland (Mucina et al. 2005), with 441 vegetation types. Each<br />
vegetation type in the South African vegetation map has a biodiversity target set by the<br />
National Spatial <strong>Biodiversity</strong> Assessment. This vegetation map, with minor refinements, was<br />
used to define 68 vegetation types for <strong>Mpumalanga</strong>, shown in Figure 3.1.<br />
With vegetation types defined and mapped, it is possible to assess their ecosystem status.<br />
Ecosystem status reflects the ecosystem’s ability to function naturally, at a landscape scale<br />
and in the long term. The single biggest cause of loss of biodiversity in South Africa is the<br />
loss and degradation of natural habitat. As the natural habitat in an ecosystem is reduced<br />
and degraded, its ability to persist is compromised. The degradation process is characterised<br />
by: loss of ability to deliver ecosystem services; loss of biodiversity, including local species<br />
extinctions; and irreversible damage to ecological processes. All these combine, eventually<br />
leading to ecological collapse (Rouget et al. 2004).<br />
LISTING OF THREATENED<br />
ECOSYSTEMS IN TERMS OF THE BIODIVERSITY ACT<br />
The <strong>Biodiversity</strong> Act provides for listing threatened and protected ecosystems as follows:<br />
52 (1) (a) The Minister may . . . publish a national list of threatened ecosystems in need<br />
of protection.<br />
(b) An MEC for environmental affairs may . . . similarly publish a provincial list of<br />
threatened ecosystems.<br />
52 (2) The following categories of threatened ecosystems may be listed in terms of<br />
subsection (1):<br />
‘Critically endangered’ ecosystems – that have undergone severe ecological<br />
degradation and are at an extremely high risk of irreversible transformation;<br />
‘Endangered’, or ‘vulnerable’ ecosystems – being categories of reduced<br />
degradation and risk, each less than the previous category above;<br />
‘Protected’ ecosystems – being ecosystems that are not threatened but<br />
nevertheless are worthy of special protection.<br />
NOTE: DEAT and SANBI are in the process of developing criteria for identifying and listing<br />
threatened and protected ecosystems. Systematic biodiversity plans such as the MBCP will<br />
provide an important basis for identifying these ecosystems.<br />
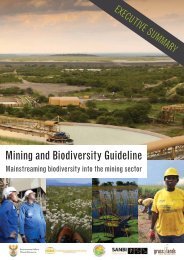
The purpose of defining vegetation types in terms of their ecosystem status is to identify<br />
ecosystems at risk. The ecosystem status categories are similar to those used by the IUCN for<br />
species: Critically Endangered (CR), Endangered (EN), and Vulnerable (VU). These categories<br />
are also used in the National Spatial <strong>Biodiversity</strong> Assessment (Driver et al. 2005). A vegetation<br />
type is allocated an ecosystem status based on the proportion of its original natural<br />
M P U M A L A N G A<br />
habitat that remains. The classification system and categories used here are illustrated in<br />
<strong>Biodiversity</strong><br />
Figure 3.2. In the MBCP analysis the endangered category is split in two in order to identify<br />
those ecosystems closer to critically endangered status.<br />
CONSERVATION PLAN HANDBOOK
% untransformed land<br />
100%<br />
80%<br />
60%<br />
50%<br />
19-28%<br />
0%<br />
FIGURE 3.2: Classification of vegetation types into five ecosystem status categories based on % of<br />
natural habitat remaining.<br />
LEAST THREATENED<br />
VULNERABLE<br />
ENDANGERED: LOW<br />
ENDANGERED: HIGH<br />
CRITICALLY ENDANGERED<br />
FIGURE 3.3: The status of terrestrial ecosystems in <strong>Mpumalanga</strong><br />
LT<br />
VU<br />
EN:L<br />
EN:H<br />
CR<br />
100% of ecosystem intact<br />
CHAPTER 3 - MPUMALANGA’S ECOSYSTEMS<br />
If habitat loss continues, ecosystem functioning will be compromised<br />
Threshold for conserving ecosystem functioning<br />
A higher degree of ecosystem functioning lost - nearing CR status<br />
Point beyond which many species may be lost<br />
15<br />
ECOSYSTEMS
MPUMALANGA BIODIVERSITY CONSERVATION PLAN HANDBOOK<br />
Appendix 2 presents the statistical characteristics of each<br />
vegetation type in <strong>Mpumalanga</strong>:<br />
The names of the 68 vegetation types together with<br />
16<br />
their national biodiversity targets;<br />
The percentage of natural habitat remaining for each;<br />
Their ecosystem status;<br />
The proportion of the biodiversity target protected in<br />
formal protected areas;<br />
Their protection level category;<br />
The relevant biome and its percentage transformation.<br />
Note that a vegetation type can be well protected (i.e.100%<br />
of its biodiversity target included in formal protected areas)<br />
yet still be vulnerable or endangered if a large proportion of<br />
natural habitat in that vegetation type has been lost.<br />
3.3 AQUATIC ECOSYSTEMS<br />
Aquatic ecosystems include both rivers and wetlands. These<br />
two are inter-related, with most wetlands feeding rivers,<br />
thereby extending and stabilising their varied and seasonal<br />
flows. Together they function as arteries for the lifeblood of<br />
our living landscapes and as kidneys that process much of<br />
the waste products of life – and of humanity. These functions<br />
are sensitive to disturbance and overload. Successful<br />
protection of aquatic biodiversity and water supplies is the<br />
foundation stone for sustainable development.<br />
Rivers and wetlands are South Africa’s most important<br />
ecosystems. Apart from the vital water they deliver they are<br />
also our most impacted and damaged ecosystems. Aquatic<br />
biodiversity has its own specifically aquatic characteristics but<br />
is strongly influenced by the terrestrial ecosystems within<br />
each catchment. Freshwater plants, animals and microorganisms<br />
act as useful indicators of the ecological health of<br />
aquatic ecosystems, which has the added benefit of<br />
reflecting aspects of the health of the entire catchment as<br />
well.<br />
Rivers and wetlands are controlled by three basic ‘drivers’<br />
that define their health and ecological characteristics. It is<br />
the balance between these drivers that is important.<br />
Aquatic ecosystem drivers may be summarised as:<br />
Hydrological – the presence and the flow of water ––<br />
which will vary seasonally and after rainfall in terms<br />
M P U M A L A N G A<br />
of speed and volume of flow;<br />
<strong>Biodiversity</strong><br />
Chemical and physical – water quality –– which is a<br />
measure of the dissolved chemicals, pollutants and<br />
sediment contained in and transported by the<br />
water;<br />
Geomorphological - the physical land surface – the<br />
types of rock, soil and the slope of the surfaces over<br />
which the water flows, both in uplands and in the<br />
water-courses of rivers and streams; this includes<br />
the plant cover that controls erosion.<br />
Changes in ecosystem health may be measured by changes<br />
in river biota, such as fish, aquatic insects and riverine vegetation.<br />
Health of a river system, including its wetlands, is<br />
usually good in pristine or well protected catchments. This is<br />
particularly true in headwater and upper level catchments.<br />
However, a section of river does not necessarily reflect the<br />
condition of the catchment it flows through. For example,<br />
the Olifants River flows through a protected part of its catchment<br />
in the Kruger National Park, but the health of the river<br />
has already been seriously compromised upstream.<br />
The management and use of water has the most obvious and<br />
direct effect on aquatic ecosystems. But their ecosystem<br />
status is equally dependent on the irreversible and widespread<br />
changes that take place on the land. Cultivation, hard<br />
surfacing and polluted return-flows from urban and irrigated<br />
land, place pressures on river systems that are permanent<br />
and increasingly costly to manage. These impacts affect<br />
everyone at the personal level and economically at the<br />
regional and national level. Disadvantaged communities are<br />
most vulnerable to these impacts.<br />
RIVER ECOSYSTEMS<br />
Rivers are much more than channels where rainfall runoff<br />
races away to the sea. They provide important ecological<br />
goods and services to the landscape and for human use.<br />
Providing and purifying water are the most obvious of these<br />
but there are many others such as providing fish, aquatic<br />
plants and animals and social goods and services.<br />
Headwaters, middle reaches and lowland stretches of rivers<br />
all perform different environmental functions and need to be<br />
managed differently. <strong>Mpumalanga</strong> has no coastline and no<br />
estuaries, but local river management is also required to<br />
provide water for downstream users in Swaziland and<br />
Mozambique. This responsibility is provided for by international<br />
agreements on shared water resources.<br />
Rivers are flow-driven linear systems, which means their<br />
biodiversity characteristics are difficult to represent and<br />
quantify spatially as we do for terrestrial ecosystems.<br />
(Terrestrial biodiversity is inter-connected like the strands in<br />
a complex fabric of many threads in many directions.<br />
Aquatic biodiversity is more like string, the threads are all<br />
bound together and are more vulnerable to an impact that<br />
might sever one or more of them, especially those that<br />
control the ecosystem drivers.)<br />
CONSERVATION PLAN HANDBOOK
CORRIDORS FOR ECOLOGICAL PROCESSES<br />
M P U M A L A N G A<br />
<strong>Biodiversity</strong><br />
CHAPTER 3 - MPUMALANGA’S ECOSYSTEMS<br />
Ecological processes include an endless list of natural cause-and-effect relationships. Examples include: pollination, migration,<br />
soil erosion, water purification and climate regulation. Such processes are complex and often poorly understood. They are<br />
also difficult to measure or to manage and plan for. Few can be represented spatially on a map. But ecological processes<br />
are as important to the persistence of biodiversity as the biological feature i.e. species, itself.<br />
The protected area conservation system seeks to protect a representative sample of species, communities and ecosystems.<br />
Although many ecological processes will be conserved along with the protected biota, there are some that are not. The most<br />
obvious are those involving species movement and connectivity, i.e. those that are thwarted by habitat fragmentation. These<br />
processes can be spatially represented and are incorporated into MBCP as ecological corridors.<br />
Corridors in MBCP have been aligned using expert opinion, mostly along river-lines and in some cases following altitudinal<br />
gradients and mountain ranges. Set at 7km in width, the purpose of the corridors is to cater for long-term, landscape-scale<br />
movement of plants and animals, and to provide links following high-value biodiversity areas. To be effective they must provide<br />
relatively uninterrupted strips of natural habitat in perpetuity, ultimately with special measures provided to encourage<br />
biological movement along their full length. (See also 'Ecological Corridors' on the MBCP Map and in Chapter 6.)<br />
Rivers are the sites of important ecological processes, mostly characterised by movement along the river line (water and sediment<br />
downstream; aquatic and terrestrial biota in both directions). Selected rivers are used as the basis for many of the<br />
ecological corridors identified by MBCP to provide for long-term response to climate change as described<br />
elsewhere (see Section 6T.5). There are two special functions of rivers that add to their biodiversity value. One is the ability of<br />
river headwaters to provide refugia for species in times of drought. The other is that segments of rivers may be identified as<br />
providing important movement linkages in river systems increasingly interrupted by dams and other developments, that need<br />
protection in order to maintain connectivity.<br />
The flow-driven nature of rivers results in sediments and pollutants having both local and extended downstream effects which<br />
may be cumulative. However, healthy rivers are self-cleansing systems. They are able to trap sediment and stabilise it with<br />
plant growth. They also remove dissolved chemicals (nutrients and pollutants) and convert them into useful biological<br />
resources. But the cleansing capacity of rivers is limited. They are easily overloaded by soil erosion and polluted runoff and<br />
seepage. Extremes of drought and flooding are increasing, due largely to development activities, which reduces the ability of<br />
rivers to perform their natural functions. Present trends in global climate change are likely to worsen these extremes.<br />
Both rivers and wetlands can be classified according to their functional and biodiversity attributes. River ecosystems are classified<br />
using the ‘ecoregion’ concept, which is an expert-based classification that defines regions according to shared ecological<br />
characteristics and in terms of relationships between organisms and their environments (Kleynhans et al. 2005a; see Figure<br />
3.4). Ecoregions are based on the understanding that ecosystems and their biota display regional patterns that mirror causal<br />
factors such as climate, soils, geology, physical land surface and vegetation.<br />
The MBCP identifies healthy subcatchments using a combination of Present Ecological State Category (PESC) (Kleynhans,<br />
2000) and loss of natural habitat in each subcatchment, as surrogate measures for healthy rivers, tributaries and wetlands.<br />
Heavily transformed subcatchments are expected to have degraded wetlands and tributaries. After determining the health of<br />
each subcatchment based on these measures, the proportion of each river type occurring within healthy subcatchments was<br />
calculated as a percentage for each river type. Healthy subcatchments are defined as subcatchments with a PESC of A, and<br />
B subcatchments that are more than 75% untransformed.<br />
CONSERVATION PLAN HANDBOOK<br />
17<br />
ECOSYSTEMS
MPUMALANGA BIODIVERSITY CONSERVATION PLAN HANDBOOK<br />
FIGURE 3.4: Rivers and wetlands in <strong>Mpumalanga</strong>. Rivers are classified into 30 types, based on Level 2 River Ecoregions.<br />
Wetlands are classified into four functional types, pans being temporary or perennial. (Note: not all wetlands are visible on the<br />
map because of map scale)<br />
In a similar approach to that outlined for terrestrial ecosystem status discussed above (Figure 3.2), the ecosystem status of river<br />
types was assessed as the proportion of each type occurring in healthy (natural, unmodified) subcatchments. If a river type<br />
has more than 80% of its length running through healthy subcatchments, it was classified as Least Threatened. If 80-60% of its<br />
length flowed through healthy subcatchments, it was classified as Vulnerable, if less than 60% but more than its biodiversity<br />
target length occurred in healthy subcatchments, it was classified as Endangered. And finally, if less than its target flowed<br />
18<br />
M P U M A L A N G A<br />
through healthy subcatchments, it was classified as Critically Endangered.<br />
<strong>Biodiversity</strong><br />
The results are shown in Figure 3.5. Of <strong>Mpumalanga</strong>’s 30 river types, 83% are threatened. Thirty three percent are Critically<br />
Endangered, 40% are Endangered, and 10% are Vulnerable. A Critically Endangered river type is one for which there are few<br />
remaining rivers occurring in healthy subcatchments and for which rehabilitation of catchments is required in order to meet<br />
biodiversity targets. This puts the biodiversity and ecosystems of these types of river systems at risk.<br />
CONSERVATION PLAN HANDBOOK
FIGURE 3.5: The status of river ecosystems in <strong>Mpumalanga</strong><br />
3.4 WETLAND ECOSYSTEMS<br />
Wetlands are areas that are wet temporarily, seasonally or permanently, including pans of open water. Most wetlands support<br />
a vigorous and diverse cover of water-loving plants, due to the high watertable. A distinguishing feature of all wetlands, even<br />
when they are dry, is that they occur on hydromorphic soils, i.e. soils that have developed under prolonged periods of waterlogging.<br />
These living, porous soils provide for water storage and controlled flow of water above and below the surface.<br />
M P U M A L A N G A<br />
Wetland soil types are site-specific, relatively easy to identify, and highly adapted to local climatic conditions. They are also<br />
<strong>Biodiversity</strong><br />
vulnerable to damage and, once damaged or eroded, are very difficult and expensive to restore or replace.<br />
CHAPTER 3 - MPUMALANGA’S ECOSYSTEMS<br />
Wetlands are specialised systems that perform ecological functions vital for human welfare and environmental sustainability.<br />
They are first and foremost important water management and storage areas - above and below ground. Their vigorous plant<br />
CONSERVATION PLAN HANDBOOK 19<br />
ECOSYSTEMS
MPUMALANGA BIODIVERSITY CONSERVATION PLAN HANDBOOK<br />
20<br />
Malachite Kingfisher<br />
Alcedo cristata<br />
Because of the<br />
ecological, social and<br />
economic importance of<br />
wetlands and their<br />
threatened status in South<br />
Africa, an extensive<br />
inventory of wetlands,<br />
their status and the<br />
threats they face is<br />
underway. The inventory<br />
is spearheaded by the<br />
Department of<br />
Agriculture and Land<br />
Administration but<br />
includes a wide range of<br />
stakeholders including<br />
government departments,<br />
NGOs, conservation<br />
bodies and research<br />
institutes.<br />
cover slows runoff, filters and purifies water and reduces the impacts of droughts and floods<br />
by regulating stream flow. They provide special habitats for many species of plants and<br />
animals. Besides these benefits, wetland vegetation also provides economic resources such<br />
as grazing, food, medicinal plants and natural fibre for thatch and craft making.<br />
Wetlands are controlled by the same basic ‘drivers’ as rivers. These features define their<br />
health and sustainability. A key property of wetlands is that they present a convergence of<br />
aquatic and terrestrial biodiversity at important positions in the landscape. It is here, as well<br />
as in rivers, where the health of key components of natural ecosystems can best be observed<br />
and measured. Our wetlands are typically variable, with over 90 different wetland biodiversity<br />
features recognised in the MBCP. These are based on a functional and Ecoregion<br />
level 2 classification as a surrogate for wetland biodiversity types. All wetlands may be<br />
allocated into four functional categories.<br />
CATEGORIES OF WETLANDS<br />
SEEPAGE WETLANDS – are generally seasonal, small and widely scattered. Often referred<br />
to as seeps or sponges, they mostly occur on obvious slopes and in upland areas. They are<br />
sometimes linear, across the slope and may be associated with bands of impermeable rock<br />
which provide an unexpected ‘perched water-table’. These are the least obvious wetlands<br />
as they are the most temporary and not located in obviously wet valley-bottom landscapes.<br />
VALLEY-BOTTOM WETLANDS – occur in bottom-lands and are generally wetter, and wet<br />
for longer periods, than seeps. In headwater areas they typically occur as seasonally waterlogged,<br />
shallow grassy valleys (vleis). In the mid and lower reaches of rivers they are also<br />
associated with streams and river banks, especially within the floodline. Valley-bottom<br />
wetlands include floodplains of the lower reaches of larger rivers, subjected to high-volume<br />
flood events.<br />
PANS – are shallow, usually seasonal bodies of open water; often circular and not directly<br />
connected to river systems by surface flow. Essentially they are internally draining systems<br />
that may contain either fresh or saline water, depending on local soil conditions. They may<br />
be temporary or perennial. Pans on different soils and at varying altitudes have substantially<br />
different ecological characteristics.<br />
LAKES AND DAMS – there are no true lakes in <strong>Mpumalanga</strong>. Strictly speaking, lakes are<br />
natural impoundments within the continuous river line. Dams are artificial impoundments<br />
that are not considered as wetlands as we have no natural fauna and flora that are adapted<br />
specifically to lake-type environments. The small ‘lakes’ in the Chrissiesmeer area are in<br />
fact pans, occasionally interconnected by wet-season overflows.<br />
M P U M A L A N G A<br />
<strong>Biodiversity</strong><br />
CONSERVATION PLAN HANDBOOK
CHAPTER 4<br />
..........................<br />
BIODIVERSITY SPATIAL ASSESSMENT<br />
WHAT IS A SPATIAL BIODIVERSITY PLAN?<br />
<strong>Biodiversity</strong> is not evenly distributed throughout the landscape. Some areas have higher levels of biodiversity<br />
than others. These ‘higher levels’ may include both a higher number of species or ecosystems, or a large<br />
number of threatened species. A spatial biodiversity plan takes this variability into account by collating and<br />
mapping information about:<br />
<strong>Biodiversity</strong> features (species, ecosystems, ecological processes);<br />
Existing protected areas;<br />
Current patterns of land use;<br />
Potential and conflicting patterns of land use.<br />
CHAPTER 4 - BIODIVERSITY SPATIAL ASSESSMENT<br />
These mapped features can be linked for further analysis using Geographic Information Systems (GIS), to<br />
identify areas of high biodiversity and determine priority areas for action.<br />
Spatial planning can occur at a variety of scales. The NSBA (Driver, et al, 2005) was done at a broad scale<br />
and does not yield information suitable for land use decisions for a municipality or a specific river or catchment.<br />
The finer scale MBCP is suitable for use even at the farm level. This is because the underlying data on<br />
biodiversity features in the Province were recorded and mapped at a finer scale than the national data used<br />
in the NSBA.<br />
21<br />
SPATIAL ASSESSMENT
MPUMALANGA BIODIVERSITY CONSERVATION PLAN HANDBOOK<br />
22<br />
Dung Beetle<br />
possibly Anachalcos convexus<br />
Insects like dung beetles<br />
have an important role to<br />
play as decomposers and<br />
waste removal specialists.<br />
There are several families<br />
and thousands of species<br />
of dung beetle. By<br />
burying and eating dung,<br />
the beetles help nutrient<br />
cycling and improve soil<br />
structure. Dung beetles<br />
reportedly save the<br />
United States cattle<br />
industry an estimated<br />
$380 million annually by<br />
burying above-ground<br />
livestock faeces.<br />
WHAT IS SYSTEMATIC BIODIVERSITY PLANNING?<br />
The process of identifying spatial biodiversity priorities in the MBCP is based on the<br />
Systematic <strong>Biodiversity</strong> <strong>Plan</strong>ning approach of Margules and Pressey (2000), also referred to as<br />
Systematic <strong>Conservation</strong> <strong>Plan</strong>ning. The underlying principle is to identify representative<br />
samples of biodiversity that are located where they can persist over the long term. The<br />
amount of biodiversity requiring protection must then be quantified by setting a target for<br />
each biodiversity feature. This numerical target tells us how much of the feature needs to be<br />
maintained or conserved, in order for it to persist and contribute to ecosystem functioning.<br />
BOX 4.1: STEPS IN SYSTEMATIC BIODIVERSITY PLANNING<br />
(Margules & Pressey 2000)<br />
Systematic <strong>Biodiversity</strong> <strong>Plan</strong>ning has a set (systematic) sequence of procedures<br />
1. Select and collate the biodiversity features and surrogates to be used in the<br />
planning area.<br />
2. Formulate explicit conservation goals that can be expressed as quantifiable<br />
biodiversity targets.<br />
3. Review the extent to which goals have been met in existing reserves.<br />
4. Use systematic methods to locate and design feasible new reserves that are<br />
able to protect the remainder of the biodiversity targets (that are not currently<br />
protected).<br />
5. Prioritise and implement conservation actions on the ground.<br />
6. Manage and monitor (adaptive management) within reserves to maintain<br />
biodiversity features.<br />
Systematic biodiversity planning is at a more advanced stage for terrestrial than for aquatic<br />
ecosystems, usually resulting in such plans being done separately. The MBCP is the first<br />
provincial biodiversity plan to successfully integrate the two. Systematic biodiversity planning<br />
makes use of sophisticated planning software to calculate the most efficient pattern of<br />
planning units required to meet biodiversity targets. The MBCP used a software package<br />
called Marxan (Possingham et al. 2000) briefly explained in the box below.<br />
BOX 4.2: BIODIVERSITY PLANNING SOFTWARE USED IN<br />
MBCP –– MARXAN AND CLUZ<br />
Cluz is a user-friendly ArcView GIS interface that allows users to design protected<br />
area networks based on the Marxan algorithm. Its efficiency lies in linking the Marxan<br />
conservation planning software with ArcView and in importing of data, analysis and<br />
exporting of output data.<br />
Marxan is designed to produce very efficient solutions to the problem of selecting planning<br />
units that meet a suite of biodiversity targets. Although several other conservation planning<br />
packages are available (such as C-plan), Marxan is unique in that it is able to address three<br />
important functions. These are:<br />
Incorporating boundary cost;<br />
Incorporating planning unit cost;<br />
Setting clump targets.<br />
Marxan then aims to minimise the cost of the above three functions by adding a cost value<br />
to them, and then trying to minimise planning unit portfolio costs.<br />
continued overleaf
Box 4.2 Continued<br />
The MBCP used relatively small planning units, dividing the Province into a honeycomb of 65 000 hexagons of 118 hectares<br />
each. The biodiversity features were then overlaid and the amount of each feature occurring in a planning unit was calculated.<br />
The software then identified the required portfolio of planning units that best meets all biodiversity targets in the smallest<br />
possible area. Thus each planning unit is assessed in terms of whether it is needed to meet targets and what the likelihood is of<br />
other planning units being selected to protect the same biodiversity feature (a measure of irreplaceability). Sites with truly<br />
unique biodiversity are crucial in meeting targets. No alternative units will be offered because there are none, i.e. they are<br />
irreplaceable. Other sites may offer various alternative planning units to meet a target and thus have a lower irreplaceability value.<br />
INTEGRATING TERRESTRIAL AND AQUATIC ASSESSMENTS<br />
IN A SINGLE BIODIVERSITY PLAN<br />
The MBCP started from the premise of trying to be as inclusive and integrated as possible. This led to the decision to integrate<br />
the aquatic and terrestrial analyses into a single biodiversity plan. The general approach that underlies this process may be<br />
summarised as:<br />
Recognising the priority to conserve aquatic biodiversity within healthy subcatchments;<br />
Assessing the biodiversity importance of high value subcatchment areas and influencing the selection of terrestrial<br />
priorities towards these areas;<br />
Assessing future land-use pressures and influencing the terrestrial assessment to avoid these areas;<br />
Using spatially intelligent software (Marxan) to combine freshwater and terrestrial assessments in a single biodiversity plan;<br />
Producing a practical, meaningful output, useful at both provincial and municipal scales;<br />
Providing land-use guidelines for biodiversity conservation at the strategic or planning level.<br />
CHAPTER 4 - BIODIVERSITY SPATIAL ASSESSMENT<br />
INCORPORATING BOUNDARY COST<br />
Just selecting planning units on their biodiversity features alone may result in a very fragmented and dispersed portfolio of<br />
planning units. Marxan is ‘spatially intelligent’ in being able cluster units, usually in a connected portfolio (i.e. lower boundary<br />
cost).<br />
INCORPORATING PLANNING UNIT COST<br />
Marxan can also assign a cost to the actual planning unit and use this value to influence selection. Many factors can be used<br />
as a cost, including financial value, habitat transformation, and ecosystem health. Marxan selects planning units which<br />
minimise these costs while still meeting the required biodiversity targets. This can<br />
be used, for example, to minimise land-use conflicts by avoiding areas with high development potential.<br />
In developing MBCP, ecosystem health for each subcatchment was used as a cost surface in the aquatic<br />
biodiversity assessment. A summary of the aquatic assessment was then used as a cost surface for the terrestrial assessment.<br />
The terrestrial cost surface includes areas likely to be subject to future land-use pressures, thereby allowing them to be<br />
avoided to minimise land-use conflict.<br />
SETTING CLUMP TARGETS<br />
Marxan can also set select clumps of biodiversity features so that they meet clump targets. So, for example, it is possible to<br />
select at least three large grassland patches of 10 000 ha. One is able to set a minimum clump size, a required minimum<br />
distance between clumps and the number of clumps required.<br />
CALCULATING ‘IRREPLACEABILITY’ USING MARXAN<br />
Based on the number of runs, the frequency of selection of planning units can be used to derive an<br />
irreplaceability value. If 100 runs are chosen, irreplaceability will range from 0 (never selected) to 100 (always selected – i.e.<br />
irreplaceable). This is, however, different from the irreplaceability measure calculated in C-<strong>Plan</strong>, which is a statistical measure.<br />
23<br />
SPATIAL ASSESSMENT
MPUMALANGA BIODIVERSITY CONSERVATION PLAN HANDBOOK<br />
Thus the process started with the aquatic analysis, which was<br />
then integrated into the terrestrial analysis to produce the<br />
final product, using the following steps:<br />
Aquatic assessment preparation: collate spatial data on<br />
24<br />
biodiversity features, aquatic processes and high<br />
water production areas;<br />
Identify healthy subcatchments;<br />
Set targets for aquatic biodiversity features (Table 4.1);<br />
Do aquatic assessment using Marxan and identify<br />
priority sites within the healthy subcatchments<br />
needed to protect aquatic features;<br />
Convert the identified priority subcatchments into a<br />
GIS layer (cost surface) which will bias the selection<br />
of terrestrial planning units towards these important<br />
areas;<br />
Terrestrial assessment preparation: collate spatial data<br />
on biodiversity, ecological processes and protected<br />
areas;<br />
Set targets for terrestrial biodiversity features (Table 4.2);<br />
Develop a GIS-layer for biodiversity/land-use conflict<br />
(and convert to cost surface);<br />
Combine output of the aquatic assessment with the<br />
land-use conflict layer;<br />
Do terrestrial assessment to meet targets for all<br />
terrestrial features, while combining cost layers<br />
(favouring aquatic priorities and avoiding areas of<br />
land-use conflict);<br />
Sort output into meaningful biodiversity categories;<br />
Create land-use guidelines applicable to these<br />
categories.<br />
Various analyses and trials were conducted to integrate the<br />
aquatic and terrestrial assessments to produce the overall<br />
biodiversity plan. Through this process, various products<br />
were generated, including:<br />
Assessment of the health and integrity of subcatchments<br />
(Figure 4.1);<br />
Assessment of aquatic biodiversity (Figure 4.2);<br />
Assessment of future land-use pressures on biodiversity<br />
(Figure 4.3);<br />
Assessment of terrestrial biodiversity (Figure 4.4);<br />
Guidelines for land-use planning for biodiversity<br />
conservation (Chapter 6).<br />
AQUATIC ANALYSIS<br />
The MBCP aquatic assessment is a first-of-its-kind in South<br />
Africa. It incorporates several novel aquatic biodiversity<br />
features: use of subcatchments as planning units; biasing the<br />
selection of required units to healthy subcatchments; and<br />
using Marxan to assess the required subcatchments to meet<br />
targets.<br />
PLANNING UNITS<br />
Rivers are linear features driven largely by flow dynamics.<br />
They are not well suited to analysis by two-dimensional GIS<br />
based procedures. Wetlands are ecologically and functionally<br />
linked to rivers and the two need to be treated as interdependent.<br />
This indicates the suitability of small<br />
subcatchments as planning units. These were modelled from<br />
the 90m SRTM DEM (digital elevation model).<br />
BIODIVERSITY FEATURES<br />
Rivers can be recognised for their unique biodiversity and<br />
their functional types. They were thus classified according to<br />
both these characteristics using Ecoregion Level 2 criteria (as<br />
surrogate categories for biodiversity) and River Signature<br />
classifications respectively (Driver et al. 2005). Wetlands<br />
include pans and were split into four functional types:<br />
perennial and nonperennial pans; seepage wetlands; and<br />
valley bottom wetlands. Other features include peat<br />
wetlands and four threatened fish species. Important aquatic<br />
processes that were mapped include important pan<br />
and wetland clusters and high water-production areas<br />
for continuity of flow. Table 4.1 summarises the aquatic<br />
biodiversity features used.<br />
M P U M A L A N G A<br />
<strong>Biodiversity</strong><br />
CONSERVATION PLAN HANDBOOK
M P U M A L A N G A<br />
CHAPTER 4 - BIODIVERSITY SPATIAL ASSESSMENT<br />
TABLE 4.1: <strong>Biodiversity</strong> features and processes used in the aquatic biodiversity assessment<br />
FEATURE DESCRIPTION & IMPORTANCE EXTENT/SIZE<br />
Rivers – biodiversity types Ecoregion Level 2 types: surrogate for aquatic biodiversity 30 types; 28 666 km of rivers<br />
Rivers – functional types River signatures: surrogate for functional types of rivers 24 types; 120 675 km of rivers<br />
Seepage and valley bottom Wetlands classified into functional types, 113 628 wetlands; totalling<br />
wetlands then according to Ecoregion Level 2 (for biodiversity) 312 771 ha; 51 types<br />
Pan wetlands Classified into perennial & non-perennial pans,<br />
and Ecoregion Level 2 biodiversity template<br />
23 922 ha of pans; 39 pan types<br />
Peat wetlands Known peat wetlands 77 point records<br />
Fish species Known distribution of 4 threatened fish species 908 km of river length<br />
Important pan clusters All pans buffered with 1 km, transformed and heavily 132 611 ha of important clusters<br />
fragmented areas removed (> 500 ha)<br />
Important wetland clusters Wetlands buffered with 1 km, transformed and 266 820 ha of important clusters<br />
heavily fragmented areas removed (>1000 ha)<br />
High water-production areas Catchments producing 50% of <strong>Mpumalanga</strong>’s runoff High water-production areas equate<br />
mapped as high water-production areas to 19% of MBCP planning domain<br />
Aquatic refugia Refuge areas for maintaining fish populations during<br />
times of drought<br />
Selected subcatchments<br />
Migration areas Areas important for maintaining fish migration Selected subcatchments<br />
HEALTHY SUBCATCHMENTS<br />
No direct measure of subcatchment condition was available so we used a combination of PESC and the extent of terrestrial<br />
transformation, as measures of subcatchment integrity. Present Ecological State Class (PESC) is the degree to which present<br />
ecological conditions of a catchment have been modified from natural (reference) conditions. The measure is based on an<br />
assessment of water quality, biotic indicators and habitat information. Results are classified on a 6-point scale, from Category A<br />
(largely natural) to Category F (critically modified). A limitation of this data set is that PESC was based only on the main rivers<br />
within a quaternary catchment, not the tributaries. Each subcatchment was assigned the PES category of the parent quaternary<br />
catchment.<br />
At the subcatchment level, the extent of habitat transformation is a good proxy for riparian integrity. Thus the extent of transformation<br />
was used as one of the surrogates for subcatchment integrity because in heavily transformed subcatchments, one can<br />
expect to have degraded wetlands and tributaries. So the MBCP used a combination of PESC and habitat transformation for<br />
each subcatchment to identify healthy subcatchments. This output was used in Marxan to bias the selection of planning units<br />
<strong>Biodiversity</strong><br />
to meet targets in these healthy subcatchments first.<br />
CONSERVATION PLAN HANDBOOK<br />
25<br />
SPATIAL ASSESSMENT
MPUMALANGA BIODIVERSITY CONSERVATION PLAN HANDBOOK<br />
FIGURE 4.1: Subcatchment health or integrity. The health was determined using a combination of PESC and subcatchment<br />
transformation values. The subcatchment health is summarised into 3 broad categories. These are then further displayed using<br />
the degree of transformation as shading. The darker the colour, the more transformed the subcatchment.<br />
RESULTS OF THE ASSESSMENT<br />
The smallest and most efficient portfolio of planning units that meets the targets for all aquatic features was determined using<br />
Marxan. The selection of these units was biased towards meeting targets in healthy subcatchments. The results show that 28%<br />
of <strong>Mpumalanga</strong> is identified as important for meeting aquatic biodiversity targets (in addition to protected areas). However, not<br />
26<br />
M P U M A L A N G A<br />
all of this area is in a healthy state. Of the additional required catchments, only 57% are healthy; 30% moderate and 13%<br />
<strong>Biodiversity</strong><br />
modified. This implies that rehabilitation is needed in order to adequately conserve freshwater biodiversity within<br />
healthy subcatchments.<br />
CONSERVATION PLAN HANDBOOK
FIGURE 4.2: Subcatchments required for meeting aquatic biodiversity targets.<br />
Figure 4.2 identifies the most efficient portfolio of planning units able to meet all the aquatic biodiversity targets. These<br />
planning units represent the most healthy subcatchments possible to meet aquatic targets. For sustainable water production as<br />
well as biodiversity conservation, it is critical that measures are taken to prevent degradation and where possible protect and<br />
restore these important catchments.<br />
By comparison, the Aquatic <strong>Biodiversity</strong> Assessment image, (as displayed on the MBCP Map [Lötter & Ferrar, 2006]) identifies<br />
the ‘irreplaceability value’ of each subcatchment. This refers to the likelihood of any subcatchment being required to meet<br />
M P U M A L A N G A<br />
aquatic biodiversity targets and indicates the options for meeting these targets. The most valuable catchments will always be<br />
<strong>Biodiversity</strong><br />
required and this map serves to help prioritise conservation actions.<br />
CHAPTER 4 - BIODIVERSITY SPATIAL ASSESSMENT<br />
CONSERVATION PLAN HANDBOOK 27<br />
SPATIAL ASSESSMENT
MPUMALANGA BIODIVERSITY CONSERVATION PLAN HANDBOOK<br />
28<br />
Wild Dog<br />
Lycaon pictus<br />
Also known as the Cape<br />
hunting dog, this animal<br />
is both the most<br />
successful<br />
hunting carnivore and the<br />
most endangered<br />
carnivore in Africa. Only<br />
about 5 600 are estimated<br />
to survive in the wild.<br />
Most of these live in<br />
Selous Game Reserve in<br />
Tanzania, northern<br />
Botswana and eastern<br />
Namibia. A few are still<br />
found in Zambia, Kenya,<br />
Mozambique, Zimbabwe<br />
and the Kruger Park.<br />
TERRESTRIAL ANALYSIS<br />
The terrestrial approach incorporates:<br />
Use of fine-scale planning units able to be used at provincial and local municipal scales;<br />
Selection of a wide range of species and ecosystem features to define biodiversity;<br />
Use of cost surfaces to create bias for meeting terrestrial biodiversity targets within<br />
important aquatic planning units (subcatchments);<br />
Avoiding areas of conflict or threats from other priority land uses.<br />
This combination of fine scale, large data sets, use of intelligent clumping of planning units<br />
and the integration of aquatic and terrestrial assessments, is also novel.<br />
PLANNING UNITS<br />
The accuracy and fine-scale mapping of biodiversity data has enabled the use of planning<br />
units that are small enough to be useful at the provincial and local municipal levels. A total of<br />
65 000 hexagons were used as planning units, each 118 ha in size. Hexagons were chosen as<br />
they are well suited to Marxan’s ability to cluster planning units and to produce ecologically<br />
sensible patterns of related units.<br />
PROTECTED AREAS<br />
The protected area network layer was updated and mapped to show current levels of protection<br />
for terrestrial biodiversity features. These protected areas are discussed in more detail in<br />
Chapter 5 where both formal and informal protected areas are assessed. Only the<br />
formal protected areas, those managed and/or formally proclaimed as nature reserves, are<br />
included in the terrestrial analysis. Conservancies and Natural Heritage Sites are legally and<br />
administratively weak at present and were not considered as providing effective long-term<br />
protection due to their uncertain future. See Appendix 3 for an extended list of all protected<br />
areas in the Province.<br />
BIODIVERSITY FEATURES<br />
Terrestrial biodiversity data, or surrogates for biodiversity features, were captured in GIS and<br />
allocated to planning units. Data sources included the MTPA’s threatened species databases,<br />
expert biologists, NGOs (e.g. Highland Crane Working Group), and museum databases.<br />
Species were selected based on their conservation importance. This generally included all<br />
Red Data Listed or threatened taxa for which sufficiently precise locality data were available.<br />
Priority was given to local endemics and the MTPA responsibility for protecting these<br />
endemics is reflected in the biodiversity targets for these species. A complete list of species<br />
and their individual biodiversity targets is provided in the MBCP Technical Report. Table 4.2<br />
lists the broad types and numbers of terrestrial biodiversity features used. All 340 terrestrial<br />
biodiversity features are also listed on the main MBCP Map.<br />
BIODIVERSITY TARGETS<br />
As previously mentioned, systematic biodiversity planning requires the setting of a target (e.g.<br />
a population size or area of habitat) for each biodiversity feature (e.g. species, ecosystem,<br />
community or process). The target indicates how much of the feature is needed for it to be<br />
conserved in the long term.<br />
The MBCP used the NSBA targets for vegetation types, except for forests. The NSBA targets<br />
M P U M A L A N G A<br />
are based on the species diversity within each vegetation type: higher species diversity<br />
<strong>Biodiversity</strong><br />
corresponds to a higher target. For the vegetation types that occur in <strong>Mpumalanga</strong>, targets<br />
range from 19% to 28% of the original area of each vegetation type. Targets for forests are<br />
taken from the DWAF national systematic conservation plan for forests. These targets range<br />
from 59.5% to 71.7%. Species targets vary widely, up to 100% for Critically Endangered<br />
species localities. The terrestrial biodiversity features used in the analysis are summarised in<br />
Table 4.2.<br />
CONSERVATION PLAN HANDBOOK
TABLE 4.2: Types of biodiversity features used in the terrestrial assessment<br />
BIODIVERSITY FEATURES DESCRIPTION EXTENT/SIZE<br />
CHAPTER 4 - BIODIVERSITY SPATIAL ASSESSMENT<br />
Vegetation Types 68 Vegetation types: National Vegetation Types 68 Types: 9 forest; 28 grassland; 31<br />
other than forests (biodiversity surrogates) savanna<br />
Amphibians Modelled distributions of important species 3 species<br />
Birds 16 threatened species (known, modelled and/or Feeding and known sites - 19 spp<br />
nesting sites – 24 features in total) Nesting sites - 7 species<br />
Invertebrates Buffered known localities and point localities 17 species<br />
Mammals Modelled distributions, actual distributions and<br />
buffered sites<br />
13 species<br />
<strong>Plan</strong>ts Known point localities 187 species<br />
Reptiles Modelled distributions 10 species<br />
Special features Selected pans and wetlands with unique Point records identify wetlands and pans with<br />
biodiversity; all natural caves unique features. Caves have 250m buffer<br />
Processes Key landscape features maintain ecological and Escarpment/summit corridors;<br />
evolutionary processes centred on biological Centres of endemism; Montane and highveld<br />
movement and connectivity grassland patches; Forest patches<br />
LAND-USE PRESSURES (CURRENT & FUTURE)<br />
In planning for development to avoid areas where biodiversity is threatened, or where there is an anticipated conflict with<br />
existing land use, it is important to assess the socioeconomic context and likely future pressures on biodiversity. Three factors<br />
that put pressure on natural habitats are included in this assessment: land of high agricultural potential (high capability land);<br />
high mining potential; and high urban growth potential. A fourth factor was included, representing areas with a high likelihood<br />
of being degraded by alien plant invasions (Fig 4.3). These factors were combined into one GIS layer representing areas of<br />
likely conflicts with biodiversity and therefore high risk areas for meeting biodiversity targets. Site selection is made to avoid<br />
these areas if options exist for meeting targets elsewhere.<br />
M P U M A L A N G A<br />
<strong>Biodiversity</strong><br />
CONSERVATION PLAN HANDBOOK<br />
29<br />
SPATIAL ASSESSMENT
MPUMALANGA BIODIVERSITY CONSERVATION PLAN HANDBOOK<br />
FIGURE 4.3: Maps showing future pressures on terrestrial biodiversity.<br />
RESULTS<br />
Marxan calculates the smallest area required to meet all targets while minimizing land-use conflict and protecting important<br />
aquatic areas. It is able to calculate the ‘irreplaceability’ value of a parcel of land. This irreplaceability value is defined as the<br />
likelihood of a particular parcel being needed to meet biodiversity targets. The irreplaceability value and the minimum area<br />
required were then sorted into meaningful biodiversity assessment categories. These categories are:<br />
Protected areas: already managed for biodiversity protection;<br />
Irreplaceable: 100% Irreplaceable - no other options available to meet targets;<br />
30<br />
M P U M A L A N G A<br />
Highly Significant: 50 - 99% Irreplaceable - very limited options available to meet targets;<br />
<strong>Biodiversity</strong><br />
Important & Necessary: lower irreplaceability value, less than 50% but still required to meet targets;<br />
Least Concern: areas of natural habitat that could be used to meet some targets but not needed now, as long as other<br />
areas are not lost;<br />
No natural habitat remaining: virtually all natural habitat has been irreversibly lost as a result of cultivation, timber<br />
plantations, mining, urban development.<br />
CONSERVATION PLAN HANDBOOK
Brief descriptions of these biodiversity assessment categories are included on the MBCP Map.<br />
Further details, in terms of how to respond to the designation of these categories in a<br />
particular area of interest, are located at the beginning of Chapter 6.<br />
FIGURE 4.4: Percentage of <strong>Mpumalanga</strong> covered by different biodiversity<br />
assessment categories.<br />
Bohlabela<br />
District<br />
Ehlanzeni<br />
District<br />
Gert<br />
Sibande<br />
District<br />
Metsweding<br />
District<br />
Nkangala<br />
District<br />
Sekhukhune<br />
Cross<br />
Boundary<br />
District<br />
FIGURE 4.5: <strong>Biodiversity</strong> assessment categories as a proportion of each district municipality.<br />
Note: Southern Kruger NP falls within the Bohlabela municipal district. This is obviously unusual as protected area land<br />
makes up 83% of this district. The Ehlanzeni District has the highest proportion of irreplaceable sites at 6.2%.<br />
CHAPTER 4 - BIODIVERSITY SPATIAL ASSESSMENT<br />
Protected area<br />
Irreplaceable<br />
Highly Significant<br />
Important & Necessary<br />
Least Concern<br />
No Natural Habitat<br />
Remaining<br />
Striped Mouse<br />
Rhabdomys pumilio<br />
Aside from humans, the<br />
striped mouse may be the<br />
most common<br />
mammal in<br />
Protected area<br />
southern Africa. They live<br />
Irreplaceable<br />
in a wide range of<br />
Highly Significant<br />
Important & Necessary<br />
habitats from the dry<br />
Least Concern<br />
No Natural Habitat<br />
Kalahari to the<br />
Remaining<br />
grasslands of<br />
M P U M A L A N G A<br />
<strong>Biodiversity</strong><br />
<strong>Mpumalanga</strong> where they<br />
feed on grass seeds,<br />
herbs and berries and<br />
play a role in seed<br />
dispersal.<br />
CONSERVATION PLAN HANDBOOK<br />
31<br />
SPATIAL ASSESSMENT
FIGURE 4.6: Results of the terrestrial biodiversity assessment.<br />
Refer to the MBCP primary map for the aquatic component.<br />
MPUMALANGA BIODIVERSITY<br />
CONSERVATION PLAN MAP<br />
IRREPLACEABLE<br />
HIGHLY SIGNIFICANT<br />
IMPORTANT & NECESSARY<br />
LEAST CONCERN<br />
NO NATURAL HABITAT REMAINING<br />
PROTECTED AREAS<br />
CONSERVANCIES<br />
L E G E N D<br />
BIODIVERSITY ASSESSMENT<br />
PROPOSED CONSERVANCIES<br />
ECOLOGICAL CORIDORS
CHAPTER 5<br />
..........................<br />
PROTECTED AREA ASSESSMENT<br />
CHAPTER 5 - PROTECTED AREA ASSESSMENT<br />
PROTECTED AREAS PAST AND PRESENT<br />
The most widespread method of conserving biodiversity is by establishing a network of formally Protected<br />
Areas (PAs) or nature reserves. For such a network to be effective it must be representative of the variety and<br />
spread of biodiversity throughout the landscape. <strong>Mpumalanga</strong> has 45 formal PAs, (Appendix 3 Aix), most of<br />
which were not established with the aim of conserving a representative sample of biodiversity. The result is<br />
that the Province’s PAs have a strong bias; they more than adequately protect the game-rich savannas but<br />
have neglected the heavily transformed grasslands.<br />
<strong>Biodiversity</strong> conservation is entrenched in national and provincial law and we now have sufficient knowledge<br />
of biodiversity to be able to plan systematically for its protection. Although broad-scale analyses have been<br />
carried out for specific biodiversity features, the MBCP is the first scientific assessment of <strong>Mpumalanga</strong> and its<br />
PA network, in terms of the distribution of nature reserves across the landscape and their effectiveness in<br />
meeting biodiversity conservation objectives.<br />
Many of the Province’s older PAs were created on lands of low economic value (e.g. on poor soil or at high<br />
altitude) in scenic or recreationally attractive areas, or for the protection of one or two charismatic species.<br />
The result, not only in <strong>Mpumalanga</strong> but all over the world, is that scarce conservation funds are being spent<br />
on conservation areas that are not representative or effective in conserving biodiversity because they were<br />
created for other reasons. All state conservation agencies including MTPA now have specific responsibility to<br />
conserve biodiversity in terms of the <strong>Biodiversity</strong> Act. This assessment provides for a comprehensive review of<br />
the PA network in terms of this mandate.<br />
33<br />
PROTECTED AREA
MPUMALANGA BIODIVERSITY CONSERVATION PLAN HANDBOOK<br />
34<br />
African Fish Eagle<br />
Haliaeetus vocifer<br />
The fish eagle has one of<br />
Africa’s most characteristic<br />
calls. It is widespread<br />
over the continent south<br />
of the Sahara but absent<br />
from the North western<br />
Cape, Namaqualand and<br />
southern Namibia. It is<br />
quite common in the<br />
Lowveld of <strong>Mpumalanga</strong>.<br />
The wingspan of females<br />
approaches 2.5 metres.<br />
The birds feed primarily<br />
on fish and have in some<br />
places become key tourist<br />
attractions, feeding<br />
willingly on dead fish<br />
thrown into the water.<br />
They also eat terrapins,<br />
waterfowl and baby<br />
crocodiles.<br />
To measure the effectiveness of a PA network it is necessary to first determine how biodiversity<br />
is distributed across the landscape. Once we know what occurs where, we can analyse how<br />
well the current network captures the full range of known biodiversity. However, it is not<br />
enough simply to know how much biodiversity is being protected. Questions such as which<br />
PAs are contributing the most to conservation and how unprotected areas can contribute to<br />
the overall biodiversity protection task, also need to be answered.<br />
TYPES AND GROUPS OF PROTECTED AREAS<br />
<strong>Mpumalanga</strong>’s 45 formal PAs are state owned and managed. There are 115 additional,<br />
informal PAs comprising private land committed in one way or another to conservation. The<br />
informal PAs may be further subdivided on the basis of their legal and administrative security<br />
(see Groups 1 to 3 below). There are 18 private reserves that are actively managed, relatively<br />
secure and formalised. The remaining 97 PAs are informally conserved areas whose current<br />
and future status is uncertain. Together this forms an extended PA network of sufficient significance<br />
that the full 160 PAs deserve to be assessed for their combined contribution to<br />
provincial biodiversity conservation. Details of the extended PA network are provided in<br />
Appendix 3 and summarised in Table 5.2. In outline it comprises the following:<br />
FORMAL / INFORMAL GROUP NO TYPES OF PROTECTED AREA<br />
Formal protected areas Group 1 45 National Parks; Provincial Parks<br />
and Nature Reserves<br />
Private protected areas Group 2 18 Municipal, Private and leasedland<br />
Nature Reserves<br />
Unsecured protected areas Group 3 97 SA Natural Heritage Sites;<br />
Conservancies on private or<br />
state land.<br />
TYPES OF BIODIVERSITY ASSESSMENT<br />
The MBCP provides for two different types of assessment:<br />
The main assessment of the MBCP (Chapter 4) examined the protection levels of<br />
biodiversity features across the entire Province, together with an analysis of<br />
priority biodiversity areas. Protected areas (mainly formal) were included, but<br />
only for assessing the amount of each biodiversity feature currently protected.<br />
This analysis did not attempt to assess the value within and between protected<br />
areas. In effect each PA was treated as a single planning unit for the purpose of<br />
the analysis. The focus of this type of assessment is to identify biodiversity outside<br />
the PA network for cooperative stewardship programmes or other conservation<br />
initiatives, such as ensuring sustainable development.<br />
The purpose of the PA assessment is to determine the contribution of each PA towards<br />
meeting biodiversity targets. However, this assessment first examined at the level<br />
of protection that each vegetation type was afforded within the formal PA<br />
network. Then the extended network was assessed in terms of each PA’s contribution<br />
towards meeting biodiversity targets (as explained in Chapter 4). This<br />
M P U M A L A N G A<br />
provided an assessment of how well the current PA network is doing in meeting<br />
<strong>Biodiversity</strong><br />
biodiversity targets, as well as identifying opportunities outside current PAs, where<br />
protection of biodiversity needs strengthening. As a foundation for the PA assessment,<br />
the location, extent and status of all formal and informal PAs in the<br />
Province were determined (see Appendix 3).<br />
CONSERVATION PLAN HANDBOOK
PROTECTION LEVELS OF VEGETATION TYPES (Refer to Appendix 2 for values for each vegetation unit.)<br />
The analysis measures the extent to which the biodiversity targets for each vegetation type have been met within the current<br />
formal PA network. The results for the Province are mapped in Figure 5.1 and summarised in Table 5.1 below.<br />
The main source of the savanna bias in the current PA network is obviously the presence of such a large part of the Kruger NP<br />
within the Province (it makes up >70% of formal PA total). Protected areas comprise 14.8% of the Province but only 4.4%<br />
without the Kruger contribution. Figure 5.1 shows the protection levels for each vegetation type. It is obvious from the map that<br />
the savanna vegetation types are well protected while the grassland and highveld vegetation types are very inadequately<br />
protected. Overall, only 2.3% of grasslands are protected, while 34.2% of savannas and 35.4% of the forest biome are protected<br />
within formal protected areas.<br />
TABLE 5.1: Protection levels of vegetation types, based on the proportion<br />
of the biodiversity target included in a formal protected area<br />
% OF BIODIVERSITY TARGET PROTECTION LEVEL NUMBER OF VEGETATION TYPES<br />
INCLUDED IN A FORMAL<br />
PROTECTED AREA<br />
0% zero protected 20<br />
0-5% hardly protected 5<br />
5-50% poorly protected 15<br />
50-100% moderately protected 10<br />
> 100% well protected 18<br />
EXPLANATION: Example of vegetation type ‘x’ with a biodiversity target of 22% of its original area. If 22% or more of ‘x’ is<br />
protected, the biodiversity target has been met and vegetation type ‘x’ is classified as well protected. If 11% to 21.9% of ‘x’ is<br />
protected, then ‘x’ is classified moderately protected. If 1.1% to 10.9% of ‘x’ is protected, it is classified poorly protected.<br />
If < 1.1% of ‘x’ is protected, it is hardly protected. If none of ‘x’ is protected, it has zero protection.<br />
M P U M A L A N G A<br />
<strong>Biodiversity</strong><br />
CHAPTER 5 - PROTECTED AREA ASSESSMENT<br />
CONSERVATION PLAN HANDBOOK 35<br />
PROTECTED AREA
MPUMALANGA BIODIVERSITY CONSERVATION PLAN HANDBOOK<br />
FIGURE 5.1: Protection level classes of <strong>Mpumalanga</strong>’s vegetation types, based on the proportion of the biodiversity target for<br />
each vegetation type that is included in formal protected areas.<br />
COMPARATIVE IMPORTANCE OF PROTECTED AREAS<br />
<strong>Mpumalanga</strong> currently has 160 protected areas (Appendix 3 Aix), classified into three broad groups, based on their legal and<br />
administrative status. These groups are subdivided into into 12 types, from state lands and conservancies all the way through to<br />
provincial nature reserves and national parks (Table 5.2). This subdivision assists in the finer-scale interpretation of this assessment,<br />
as it quantifies the biodiversity or conservation importance of each of these areas. It also enables a template of<br />
36<br />
M P U M A L A N G A<br />
biodiversity priorities to be created against which the MTPA may then review its short- and longer-term conservation strategy. It<br />
<strong>Biodiversity</strong><br />
is likely that there are areas conserving a great deal of biodiversity but that have uncertain futures due to their informal status.<br />
Other studies have identified where gaps exist in PA networks in terms of species diversity or how representative the network is. The<br />
exciting aspect of the the approach used here, namely measuring each individual PA’s contribution to meeting biodiversity targets, is<br />
that it provides a new method of assessing the biodiversity contribution of individual protected areas.<br />
CONSERVATION PLAN HANDBOOK
CHAPTER 5 - PROTECTED AREA ASSESSMENT<br />
WHO IS THIS ASSESSMENT FOR?<br />
The specific aim of this assessment is to provide insight for MTPA decision makers into how well their current PA network is<br />
meeting biodiversity objectives. The assessment is intended to be of value to all current and potential PA owners and managers,<br />
and their local stakeholders. In a wider context it is relevant to all members of the public who have an interest in the future of<br />
biodiversity, protected areas and tourism in <strong>Mpumalanga</strong>.<br />
METHODS<br />
The PA assessment methodology is similar to that of the analysis of biodiversity priority areas (Chapter 4). It is based on the same<br />
terrestrial database of 340 biodiversity features and their targets. The same 118 ha hexagonal planning units are also used but<br />
this time they extend right through all PAs, partitioning the entire Province into planning units regardless of the location of<br />
protected areas. The conservation planning software C-<strong>Plan</strong> (Pressey, 1999) was used to conduct the irreplaceability analysis.<br />
C-<strong>Plan</strong> (which is slightly simpler than Marxan) was used because all that is required is for it to quantify the irreplaceability of<br />
each planning unit throughout the Province, based on its contribution to the targets of the 340 biodiversity features. C-<strong>Plan</strong> was<br />
also used because it is able to process a larger number of planning units than Marxan.<br />
Once irreplaceability was calculated for each planning unit and an irreplaceability map produced (Figure 5.2a), a map of the<br />
extended PA network was overlaid (Figure 5.2 b,c,d). The Province’s 12 PA types were sorted into three groups based on their<br />
legal protection status (taken as a proxy for resource allocation). Group 1 PAs, as listed in Table 5.2, are areas managed by the<br />
MTPA or SANParks. Group 2 PAs are privately owned and managed for biodiversity, but are not necessarily proclaimed in the<br />
legislation. Group 3 PAs are more informally managed areas with diverse and uncertain futures.<br />
TABLE 5.2 Summary of the numbers and types of PAs in <strong>Mpumalanga</strong> and the percentage<br />
of the total PA network contained within each category. The size of Kruger NP dominates the Province’s<br />
PAs and has a substantial influence on our analysis. As a result, the data are shown both with and<br />
without Kruger NP included in the PA network.<br />
GROUP TYPE OF PA ABBR. NUMBER AREA (HA) % OF PA % MINUS<br />
Group 1 National Park NP 2 968 643 50.0 5.2<br />
Provincial Nature Reserve PNR 25 178 298 9.1 17.4<br />
MTPA Flora Reserve MTPA FR 5 95
MPUMALANGA BIODIVERSITY CONSERVATION PLAN HANDBOOK<br />
A measure of the <strong>Conservation</strong> Importance of each PA was determined by calculating the proportion of all planning units within<br />
the PA with an irreplaceability value of greater than 50%. This provided a simple method for quantifying a PA’s contribution to<br />
meeting biodiversity targets. <strong>Conservation</strong> Importance was determined for the entire PA network, for Group 1 vs. Group 2 vs.<br />
Group 3 areas, for each of the 12 types of PA, and finally for each individual protected area in the Province (see Appendix 3).<br />
Other information may be obtained, such as a PA’s representativeness and the number of features whose targets are fully<br />
achieved within it. Representativeness indicates the number of biodiversity features found within the PA, while target achievement<br />
indicates the number of known biodiversity features, that have 100% of their targets met within that PA alone. By<br />
compiling all this information, a quantified profile is produced for each of the Province’s 160 protected areas, indicating its size,<br />
status, conservation importance, sum of target achievement as well as other statistics.<br />
38<br />
a) b)<br />
c) d)<br />
FIGURE 5.2: a) C-<strong>Plan</strong> derived irreplaceability map of<br />
<strong>Mpumalanga</strong> with b) Group 1 conservation areas c) Group<br />
2 conservation areas and d) Group 3 conservation areas<br />
overlaid. The red areas indicate those areas that must be<br />
conserved if biodiversity targets are to be met. Any planning<br />
unit with an irreplaceability score >0.5 (depicted as orange,<br />
maroon, or red on the map) was deemed an ‘important’ site<br />
for meeting biodiversity targets.<br />
LEGEND
RESULTS - WHAT THE ASSESSMENT REVEALED<br />
The assessment revealed that overall <strong>Mpumalanga</strong>’s PAs are better situated to conserve biodiversity<br />
than non-protected areas (Figure 5.2 b). Furthermore, every planning unit within<br />
every PA is shown to contribute to meeting the biodiversity targets for one or more biodiversity<br />
features, which means that none of the PAs in <strong>Mpumalanga</strong> is redundant. However, there<br />
are still several biodiversity features that are not afforded any protection at all, and there are<br />
many features that are inadequately protected with only a portion of their biodiversity target<br />
met within the PA network.<br />
A number of PAs contained biodiversity features that were not found anywhere else in the PA<br />
network and are hence of particular value. Specifically, Blyde River Canyon NP contained 20<br />
biodiversity features represented nowhere else in the PA network. Moreover, of these 20<br />
biodiversity features, 15 had their targets fully achieved in the Blyde River Canyon NP alone.<br />
Kruger National Park contained 15 unique features and fully achieves the targets for all of<br />
them.<br />
The study reveals that the highest proportion of important sites (planning units with an<br />
irreplaceability value of greater than 50) occurs in the informal Group 3 PAs. Figure 5.3a<br />
shows the relative importance of Group 1, 2, and 3 PAs as well as for nonprotected areas.<br />
Analysed in more detail, conservation importance scores can be determined for each of the<br />
12 different types of PA. This shows that within each of the three broad PA groups there are<br />
large differences between the different types (Figure 5.3b).<br />
Group 1 formal PAs are the most representative, meaning that they contain the highest<br />
number of biodiversity features analysed in this assessment (221 of 340). Group 3 PAs contain<br />
181 of the 340 biodiversity features and 42 of these features are unique, meaning they are<br />
not found in either Group 1 or 2 PAs. Based on both conservation importance scores and<br />
representativeness, <strong>Mpumalanga</strong>’s top three protected areas for biodiversity are Verloren Valei<br />
Provincial Nature Reserve, Mooibron Natural Heritage site and Blyde River Canyon National<br />
Park. The analysis calculates detailed conservation importance scores for every PA in the database.<br />
A complete list of conservation importance scores and other PA statistics are presented<br />
in Appendix 3.<br />
ASSESSMENT IMPLICATIONS<br />
A great deal of useful information was derived from analysing the relative biodiversity<br />
importance of protected areas. First, the results showed that the current PA network serves to<br />
meet biodiversity targets quite well, although still underprotecting many biodiversity features.<br />
The land contained within the PA network is home to a higher proportion of key biodiversity<br />
features than the land outside the PA network. This shows that even though in the past the<br />
proclamation of PAs may not have been based on biodiversity criteria, they cannot today be<br />
considered as arbitrary or redundant; every PA assessed is needed to meet the targets of at<br />
least one of the biodiversity features measured.<br />
The formal PA network (Group 1) contributes a great deal towards meeting biodiversity<br />
targets. It adequately protects many of the features measured, including a large number found<br />
M P U M A L A N G A<br />
nowhere else (i.e. in Groups 2 or 3). However, a larger proportion of sites rated as important<br />
<strong>Biodiversity</strong><br />
for meeting targets, i.e. planning units with an irreplaceability value of greater than 50%, are<br />
found in informal Group 3 PAs. While private lands have long been recognised as potentially<br />
important for meeting biodiversity targets, this assessment reveals the extent of their conservation<br />
importance. While it is unlikely the MTPA could afford to purchase or otherwise acquire these<br />
areas, various stewardship arrangements are well established in other provinces, showing<br />
ways that agencies can work with land owners to protect biodiversity (Botha 2001). Currently,<br />
CHAPTER 5 - PROTECTED AREA ASSESSMENT<br />
GRASSVELD<br />
Hippopotamus<br />
BIRDS<br />
Hippopotamus amphibius<br />
Several hundred plant<br />
Hippos play a vital role<br />
species listed as threatened.<br />
in the ecology of rivers<br />
Many are herbaceous plants<br />
and such still as arum water lilies, bodies red by hot<br />
opening pokers, up aloes, reed watsonias, beds and<br />
gladiolii recycling and nutrients. orchids and<br />
They include are widespread medicinal and in<br />
Africa although their<br />
culturally significant plants.<br />
numbers are in many<br />
places declining as a<br />
result of water diversion<br />
and extraction, and<br />
poaching.<br />
They are said to be<br />
Africa’s most dangerous<br />
animal (apart from<br />
disease carrying insects).<br />
They are still common in<br />
the waterways and water<br />
bodies of the Lowveld.<br />
CONSERVATION PLAN HANDBOOK 39<br />
PROTECTED AREA
MPUMALANGA BIODIVERSITY CONSERVATION PLAN HANDBOOK<br />
MTPA has no stewardship programme and is unable to offer incentives to private land owners for conserving their land (this<br />
situation is in the process of being addressed within new MTPA structure). In addition, the SA Natural Heritage Sites, which<br />
contain the highest proportion of conservation-important sites in the Group 3 PAs, were registered as part of a long abandoned<br />
and rather superficial conservation programme. It is intended to be revitalised but at present the SA Natural Heritage Sites are<br />
not formally recognised for their valuable biodiversity. The status of these and other informal PAs are very uncertain in the face<br />
of future land-use pressures. Their importance for biodiversity conservation is highlighted in this analysis, clearly indicating that<br />
programmes to ensure their future integrity must be implemented if legal mandates are to be fulfiled.<br />
Measuring <strong>Conservation</strong> Importance, based on a PA’s contribution to meeting biodiversity targets, is only one of many ways to<br />
determine an area’s conservation value. It is particularly important to note here that a reserve like Kruger National Park, which<br />
protects a huge range of biodiversity features, including many large mammal populations not included in this assessment, has<br />
special attributes that make it important. Size is one; a very important attribute for ensuring the maintenance of functioning<br />
ecosystems and the persistence of species into the future.<br />
Every protected area has a role to play in the global contribution to protecting biodiversity, no matter what its legal or ownership<br />
status. This assessment does not necessarily detract from the value of areas that do not score highly in our ranking of conservation<br />
importance. However, when conservation resources are scarce, methods for allocating those resources must be defensible and<br />
effective. Setting biodiversity conservation goals and working towards achieving them is one of the only ways that parks agencies<br />
can measure their own effectiveness. This assessment provides a new, quantified and strongly scientific basis for setting those<br />
objectives and monitoring progress towards achieving them.<br />
a)<br />
b)<br />
40<br />
MPTA Flora Reserve<br />
IFMCA<br />
Provincial Nature Reserve<br />
National Park<br />
Joint Management Area<br />
Leased Area<br />
Municipal Nature Reserve<br />
Private Reserve<br />
SA Heritage Site<br />
Untransformed State Land<br />
Conservancy<br />
M P U M A L A N G A<br />
<strong>Biodiversity</strong><br />
FIGURE 5.3: a) The conservation importance of formal Group 1 PAs, semi-formal Group 2 PAs, and unsecured Group 3 PAs vs.<br />
non-conservation lands. The dotted line indicates the provincial average or the proportion of important sites in the entire<br />
Province; b) The conservation importance of each of the 12 types of protected areas (IFMCA – Indigenous Forest Mountain<br />
Catchment Area).<br />
CONSERVATION PLAN HANDBOOK<br />
De Hoop Potential Reserve<br />
Non-conservation Areas
PURPOSE<br />
CHAPTER 6<br />
..........................<br />
LAND-USE GUIDELINES<br />
FOR DEVELOPMENT PLANNERS, REGULATORS AND LAND-USE MANAGERS<br />
These land-use guidelines are intended to achieve improved conservation of biodiversity and the persistence<br />
of ecosystem functioning. They should inform decisions at various levels, from provincial planning forums to<br />
individual changes in land use. In covering such a wide range of applications, we make no claim that they<br />
are comprehensive or complete. They are intended in the long run to evolve into regulations, and as such<br />
will benefit from feedback by users as they apply them to real decision-making situations.<br />
Our readership focus is on planners at all levels, from land owners and buyers to central development planners.<br />
The guidelines are intended to inform the decisions of the main provincial environmental and<br />
biodiversity agencies, DALA and MTPA. Their most obvious and frequent use is expected to be:<br />
Informing all parties involved in development applications and their authorisation through the EIA<br />
process;<br />
Informing land-use and development planners in municipalities and the provincial government.<br />
The three ecosystems in this document are identified by a prefix as follows:<br />
Terrestrial – ‘T’<br />
Aquatic (rivers, lakes and impoundments) – ‘A’<br />
Wetlands – ‘W’<br />
CHAPTER 6 - LAND-USE GUIDELINES<br />
41<br />
LAND-USE GUIDEINES
MPUMALANGA BIODIVERSITY CONSERVATION PLAN HANDBOOK<br />
42<br />
Roan<br />
Hippotragus equinus<br />
Antelope form the basis<br />
of a major tourism<br />
industry. Not only do<br />
tourists pay substantial<br />
sums to see antelope but<br />
they also visit to see the<br />
predators of antelope.<br />
Roan antelope are rare or<br />
endangered over most of<br />
their range because they<br />
have very specific habitat<br />
requirements<br />
DATA USE AND LIMITATIONS<br />
The data used to compile this plan and the scientific knowledge that underpins the<br />
biodiversity targets are currently the best available. The MBCP database has been collected<br />
over many years and from diverse sources. Although data and sources have been checked<br />
and verified, gaps and errors may exist. Satellite data, such as the land transformation<br />
coverage, are derived from images taken in 1995 and 2000. This means that six years of<br />
ongoing transformation is not recorded in the MBCP.<br />
All data and the information on the MBCP map, especially in contentious situations, should<br />
be verified on the ground, preferably by an ecologist with local experience, before a<br />
.<br />
decision about land-use is taken. Data from the verification process, especially corrections,<br />
must be captured and archived to update and add to the information on which future<br />
biodiversity planning will be based<br />
The MBCP has created six biodiversity conservation categories for terrestrial ecosystems using<br />
systematic biodiversity planning methods (Table 6.1). This chapter sets out broad land-use<br />
guidelines applicable to each category and all ecosystems.<br />
The MBCP has also identified the most important water catchments in the Province which are<br />
critical for meeting aquatic biodiversity targets (see Figure 4.2). Land-use guidelines for these<br />
catchments are provided to safeguard their current good ecosystem status. All land<br />
uses involving physical development will have significant impacts on these catchments. It is<br />
critical that inappropriate development does not compromise their integrity. Both aquatic<br />
biodiversity and water supplies will be jeopardised if this is allowed to happen.<br />
TERRESTRIAL ECOSYSTEMS<br />
TABLE 6.1: Summary of terrestrial biodiversity conservation categories<br />
BIODIVERSITY CONSERVATION CATEGORY % OF PROVINCE COMMENT ON<br />
LAND USE<br />
1. PAs currently under formal biodiversity protection PAs - 14.8%<br />
2. Irreplaceable, in urgent need of protection and PA status Irrp - 2.4%<br />
3. Highly Significant, protection needed - limited choice for H-S - 12.3%<br />
meeting targets<br />
4. Important and Necessary, protection needed - I&N - 9.5%<br />
more choices for meeting targets<br />
5. Areas of Least Concern, providing options for development L-C - 25.2%<br />
6. Areas with No Natural Habitat remaining, providing NN - 35.8%<br />
preferred sites for all forms of development.<br />
(Ecological corridors (6.7%) are not included as they are not part of the spatial analysis.)<br />
The higher conservation<br />
categories (1 to 4)<br />
need to be managed<br />
for the conservation of<br />
biodiversity.<br />
61% of Province<br />
available for development<br />
via EIA planning<br />
procedures.
T1. PROTECTED AREAS (PAs) - 14.8%<br />
of the Province (10.4% in Kruger National Park)<br />
Protected Areas are managed primarily for biodiversity<br />
conservation, but also for socioeconomic objectives such as<br />
tourism and education. Because PAs are formalised and in<br />
most cases managed by state agencies, their management is<br />
provided for in laws and regulations at national and provincial<br />
level (Chapter 2). These laws are explicit in terms of the<br />
purpose, scope and required procedures involved in<br />
managing PAs. Broadly they follow norms and standards that<br />
are applied widely in other countries. There is no point in<br />
providing more than a brief outline here.<br />
In terms of these statutes a formally approved management<br />
plan is required for each PA. Such plans must identify allowable<br />
activities, uses and developments and allocate them to<br />
appropriate zones. The plans are not just spatial, they also<br />
deal with policy and implementation issues, with timeframes,<br />
staffing, performance criteria and budgets. These<br />
plans are also required to consider public participation,<br />
capacity building, resource use and other social<br />
and economic opportunities, including contractual and<br />
comanagement arrangements. All operational aspects of<br />
managing PAs are subject to their main purpose, being that of<br />
protecting and maintaining biodiversity.<br />
<strong>Biodiversity</strong> issues in the general landscape, outside of<br />
Protected Areas, are the particular focus of the land-use<br />
planning guidelines below.<br />
T2. IRREPLACEABLE – 2.4% of the Province<br />
IRREPLACEABLE areas are the most important areas of the<br />
Province from a biodiversity point of view, outside of the<br />
protected area network. Some IRREPLACEABLE sites may<br />
already be managed carefully and sustainably by well-informed<br />
owners with appropriate resources, but there is currently no<br />
compelling legal or public pressure for this to be so.<br />
Ideally, <strong>Conservation</strong> Management (Land-Use Type 1) should<br />
apply to all IRREPLACEABLE areas. In some circumstances,<br />
Extensive Game Farming and Livestock Production (Land-Use<br />
Types 2 and 3), if well-managed, may also be positive for<br />
M P U M A L A N G A<br />
biodiversity. These two land uses are acceptable so long as<br />
<strong>Biodiversity</strong><br />
they take into account the specific biodiversity values<br />
(e.g. rare species or vegetation remnant) and vulnerabilities<br />
(e.g. open-cast mining or alien plant invasion) of each site.<br />
The most important short-term priority is that the land should<br />
be managed in ways that at least have no further negative<br />
impact on biodiversity.<br />
CHAPTER 6 - LAND-USE GUIDELINES<br />
Undertake specialist studies according to MTPA’s<br />
‘Requirements for Assessing and Mitigating Environmental<br />
Impacts of Development Applications’ document.<br />
Land-use and administrative options for positive biodiversity<br />
outcomes include:<br />
The preferred land use is <strong>Conservation</strong> Management<br />
(Land-Use Type 1) but Types 2 or 3 (extensive game<br />
or livestock management) may be acceptable under<br />
prescribed conditions;<br />
Refer all development applications in IRREPLACEABLE<br />
land to MTPA and or DALA for evaluation by<br />
biodiversity specialists;<br />
Encourage cooperative conservation arrangements such<br />
as Protected Environments, conservancies etc.;<br />
Where appropriate, incorporate these areas into the<br />
formal PA system: by proclamation as a private or<br />
contractual nature reserve, stewardship agreement,<br />
legally entrenched conservancy agreement or other<br />
legal means;<br />
Restore damaged areas to natural ecosystem functioning<br />
where possible (restoration guidelines are required);<br />
Prepare for and conduct high level public awareness<br />
effort on biodiversity values and use of these areas,<br />
especially to land owners;<br />
Priority for MTPA/DALA to carry out regular environ-<br />
mental monitoring and reporting, for biodiversity<br />
and/or change of land use, to prevent unauthorised<br />
development or degradation by neglect or<br />
ignorance (monitoring guidelines are required);<br />
Prioritise these areas for land care projects: i.e. MTPA,<br />
DALA, WfW, Working for Wetlands and NGOs to<br />
direct their conservation projects, programmes and<br />
activities;<br />
The option to provide alternative land as a ‘biodiversity<br />
offset’ in exchange for biodiversity loss in these<br />
areas, should NOT be considered as ALL remaining<br />
natural areas are required to meet targets. In<br />
exceptional circumstances such offsets of different<br />
but comparable value may deserve consideration;<br />
Devise new financial and other incentives (e. g. resource<br />
economic approaches) for achieving sustainable<br />
conservation management;<br />
Develop appropriate legal penalties for non-compliance<br />
such as unauthorised development or destruction of<br />
natural habitat. These, including environmental<br />
auditing procedures, will probably require formal<br />
regulations.<br />
CONSERVATION PLAN HANDBOOK<br />
43<br />
LAND-USE GUIDEINES
MPUMALANGA BIODIVERSITY CONSERVATION PLAN HANDBOOK<br />
T3. HIGHLY SIGNIFICANT – 12.3% of the Province<br />
Land in this category should be maintained as natural vegetation<br />
cover. Permissible land uses should be limited to those that are<br />
least harmful to biodiversity, i.e. Land-Use Types 1 – 4. All cultivation-based<br />
agriculture and all urban/industrial development<br />
(Land-Use Types 5 – 15) should not be permitted. If development<br />
is unavoidable, it must be made sufficiently dispersed<br />
(sometimes clumped) and of the right scale to be as biodiversity<br />
friendly as possible. Specialist ecological advice will be required<br />
in such cases to reinforce standard EIA procedures.<br />
‘<strong>Biodiversity</strong> reinforced EIA procedures’ require that a<br />
specialised biodiversity study be undertaken as part of the<br />
EIA. This requires a survey by an experienced and locally<br />
knowledgeable biodiversity expert. Destruction of biodiversity<br />
on HIGHLY SIGNIFICANT land may result in the<br />
area being moved into the IRREPLACEABLE category.<br />
Undertake specialist studies according to MTPA’s<br />
‘Requirements for Assessing and Mitigating Environmental<br />
Impacts of Development Applications’ document.<br />
Land-use and administrative options for positive biodiversity<br />
outcomes include:<br />
All land in this category should be maintained as<br />
44<br />
natural vegetation cover;<br />
Land-use planners to refer all development<br />
applications in HIGHLY SIGNIFICANT land to<br />
MTPA and or DALA for evaluation by biodiversity<br />
specialists;<br />
Consider economic development only via land use<br />
Types 1 – 4 only, and within specified limits, to<br />
benefit biodiversity, e.g. extensive livestock<br />
management without routine supplementary<br />
feeding or pasture enhancement;<br />
Encourage cooperative conservation arrangements, e.g.<br />
Protected Environments or conservancies where<br />
appropriate;<br />
Conduct focused public awareness and/or extension<br />
effort on biodiversity values and uses of these areas,<br />
especially to land owners;<br />
Prioritise for MTPA/DALA to carry out environmental<br />
monitoring and reporting on biodiversity status<br />
and/or change of land use;<br />
outcomes include:<br />
M P U M A L A N G A<br />
Develop a more detailed list of unsustainable land uses<br />
<strong>Biodiversity</strong><br />
that are site- or area- specific, including relevant<br />
aspects of scale and extent;<br />
Require a biodiversity specialist study as part of the EIA<br />
for all development applications;<br />
Develop best practice guidelines for all permitted land<br />
uses;<br />
Provision for biodiversity offsets being exchanged for<br />
biodiversity loss should only be considered at an<br />
exchange rate of at least 250%, i.e. more than<br />
twice the area or biodiversity value, calculated as a<br />
comparable contribution to targets, and only as a<br />
last resort;<br />
Devise new financial and other incentives (e.g.<br />
resource economic approaches) for achieving<br />
sustainable conservation management;<br />
Unavoidable development requires special mitigation<br />
measures such as dispersed and/or small scale<br />
placement of site;<br />
Consider special projects to develop biodiversity<br />
management / sustainable use guidelines and procedures<br />
for communal land;<br />
Develop and apply appropriate legal penalties for non-<br />
compliance subject to regulation;<br />
Prioritise these areas for land care projects: i.e. MTPA,<br />
DALA, WfW, Working on Wetlands and NGOs to<br />
redirect their conservation projects, programmes<br />
and activities.<br />
T4. IMPORTANT AND NECESSARY – 9.5% of the Province<br />
These areas are significantly important areas of natural vegetation<br />
that play an important role in meeting biodiversity<br />
targets. Their designation as IMPORTANT AND NECESSARY<br />
seeks to minimise conflict with competing land uses and<br />
represents the most efficient selection of areas to meet biodiversity<br />
targets.<br />
No significant increase in the occurrence of Land-Use Types<br />
5 – 9, should be permitted. Every opportunity to revert to<br />
economic options using natural land cover should be taken.<br />
Some agricultural land uses may be permitted but with bestpractice<br />
guidelines made conditional and aimed at benefiting<br />
the biodiversity assets and reducing the vulnerability of each<br />
site.<br />
Undertake specialist studies according to MTPA’s<br />
‘Requirements for Assessing and Mitigating Environmental<br />
Impacts of Development Applications’ document.<br />
Land-use and administrative options for positive biodiversity<br />
Actively encourage economically sustainable land uses<br />
that are dependant on natural habitat such as Types<br />
1 – 4;<br />
Actively discourage intensive land uses which result in<br />
biodiversity loss, Types 5 – 9;<br />
Prioritise the monitoring of changes in land use and loss<br />
CONSERVATION PLAN HANDBOOK<br />
of natural habitat to guide management response to
protect ecosystem functioning and connectivity;<br />
Conduct focused public awareness and/or extension<br />
effort on biodiversity values and uses of these areas, especially to land owners;<br />
Develop best practice guidelines for all permitted land uses;<br />
Encourage cooperative conservation arrangements, e.g. Protected Environments /<br />
conservancies;<br />
Develop best-practice guidelines for encouraging free movement of indigenous plants<br />
and animals across boundaries and barriers in agricultural landscapes;<br />
Regulate for compulsory, full EIA procedures;<br />
Compensatory offsets of at least 150% may be considered;<br />
Prioritise these areas for land-care projects: i.e. MTPA, DALA, WfW, Working on<br />
Wetlands and NGOs to redirect their conservation projects, programmes and<br />
activities.<br />
T5. ECOLOGICAL CORRIDORS<br />
The purpose of ecological corridors is to provide intact pathways for long-term, large-scale<br />
biological movement. They are selected primarily along river lines and altitudinal gradients to<br />
provide for the natural retreat and advance of plants and animals in response to environmental<br />
change. They are also selected to follow the lines of least transformation (maximum<br />
remaining natural habitat) and as links between important biodiversity areas. The mapped<br />
width of ecological corridors is 7 km; in practice this may vary to accommodate local features.<br />
Land-use and administrative options for positive biodiversity outcomes in ecological corridors<br />
include:<br />
Corridors need to retain at least existing natural vegetation cover and in some key<br />
‘critical-link’ areas undergo active repair and restoration of ecosystem<br />
functioning;<br />
Land-use planners to refer development applications to MTPA/DALA for all applications<br />
involving probable biodiversity impacts, e.g. Land Uses 5 - 15;<br />
Prioritise the monitoring of changes in land use and loss of natural habitat to protect<br />
ecosystem functioning and connectivity;<br />
Conduct focused public awareness and/or extension efforts on biodiversity values and<br />
connectivity to limit natural habitat loss and encourage free movement of plants<br />
and animals through biodiversity barriers;<br />
Identify critical link areas where local sites are protected and promoted to a higher<br />
biodiversity conservation category;<br />
Corridors are pre-disposed towards conservancy-type protection and co-operative<br />
management arrangements to provide for cross-barrier movement;<br />
Treat corridorsas priority areas for Working for Water and other alien plant control<br />
projects to deny these species the benefits intended for indigenous species;<br />
Develop activities/procedures for encouraging free movement of indigenous plants and<br />
animals across boundaries and barriers in agricultural landscapes;<br />
EIA applications should assess the impact of the proposed development on the<br />
0 M P U M A L A N G A<br />
functionality of the ecological corridor;<br />
<strong>Biodiversity</strong><br />
Compensatory offsets in corridors can be considered if they result in a net biodiversity<br />
gain and improvement in corridor functioning.<br />
T6. LEAST CONCERN – 25.5% of the Province<br />
<strong>Biodiversity</strong> assets in these landscapes contribute to natural ecosystem functioning, ensure<br />
the maintenance of viable species populations and provide essential ecological and<br />
CHAPTER 6 - LAND-USE GUIDELINES<br />
Herald Snake<br />
Crotaphopeltis hotamboeia<br />
Snakes, although generally<br />
unpopular and even<br />
feared, are an integral<br />
part of our<br />
biodiversity. Southern<br />
Africa is home to about<br />
160 species of snakes,<br />
nearly all of which are<br />
completely harmless to<br />
people. Even the most<br />
aggressive and dangerous<br />
venomous snakes such as<br />
the black mamba avoid<br />
confrontations with<br />
people. Only about six of<br />
the potentially lethal<br />
species are found in<br />
<strong>Mpumalanga</strong>.<br />
CONSERVATION PLAN HANDBOOK 45<br />
LAND-USE GUIDEINES
MPUMALANGA BIODIVERSITY CONSERVATION PLAN HANDBOOK<br />
46<br />
Palm Dove<br />
Streptopelia senegalensis<br />
Birds are major<br />
contributors to the<br />
maintenance of<br />
ecosystems and bio-<br />
diversity. They disperse<br />
seeds, remove and recycle<br />
dead animals, control<br />
insect and rodent pests,<br />
pollinate plants, create<br />
habitat and food supplies<br />
for other species and in<br />
some cases even<br />
contribute vast quantities<br />
of nutrients to soils.<br />
environmental goods and services across the landscape. Although these areas contribute least<br />
to the achievement of biodiversity targets they have significant environmental, aesthetic and<br />
social values and should not be viewed as wastelands or carte-blanche development zones.<br />
Development options are widest in these areas. At the broad scale, these areas and those<br />
where natural habitat has been lost (see 7, below) serve as preferred sites for all forms of<br />
development (Land-Use types 5 – 15). Land-use planners are still required to consider other<br />
environmental factors such as socioeconomic efficiency, aesthetics and the sense-of-place in<br />
making decisions about development. Prime agricultural land should also be avoided for all<br />
nonagricultural land uses.<br />
Land-use and administrative options for positive biodiversity outcomes include:<br />
Where this category of land occurs close to areas of high biodiversity value, it may<br />
provide useful ecological connectivity or ecosystem services functions, e.g.<br />
ecological buffer zones and corridors or water production. In these situations<br />
encouragement needs to be given to biodiversity-friendly forms of management<br />
and even restoration options where appropriate;<br />
Develop incentives to reverse lost biodiversity for selected parcels of land where buffer<br />
zones and connectivity are potentially important;<br />
Standard application of EIA and other planning procedures required;<br />
Along with Category T7. below, these areas to serve as preferred sites for all forms of<br />
urban and industrial development (Land-Use Types 10 – 15).<br />
T7. NO NATURAL HABITAT REMAINING – 35.8% of the Province<br />
This category has already lost most of its biodiversity and its ecological functioning too. In the<br />
remnants of natural habitat that occur between cultivated lands and along riverlines and<br />
ridges, residual biodiversity features and ecological processes do survive. But these disconnected<br />
remnants are biologically impoverished, highly vulnerable to damage and have<br />
limited likelihood of being able to persist. The more transformed a landscape becomes, the<br />
more value is placed on these remnants of natural habitat. (In Australia and England rural<br />
land authorities are promoting the protection and re-establishment of these remnants in<br />
‘industrialised’ agricultural landscapes, including even hedgerows.)<br />
The most widespread cause for terrestrial biodiversity loss in <strong>Mpumalanga</strong> is crop and timber<br />
cultivation. All forms of production agriculture (Types 5 – 9) will benefit from applying codes<br />
of best practice, such as have been developed in the timber growing industry, to reduce<br />
impact on biodiversity.<br />
A different set of factors apply to biodiversity losses in aquatic or riverine systems (see Aquatic<br />
Ecosystems below). The remedies for riverine impacts need to be considered separately, as the<br />
links between cause and effect are not limited to the immediate locality. Both direct and indirect<br />
impacts (including dispersed impacts such as acid rain) result from urban-industrial and<br />
agricultural sources. Management must be considered on a catchment or subcatchment basis<br />
M P U M A L A N G A<br />
as well as applying common-sense conservation practices in the terrestrial landscape.<br />
<strong>Biodiversity</strong><br />
Areas with no natural habitat remaining are preferred sites for development, even more so<br />
than for 6, above. However, in selecting sites for urban and industrial development, planners<br />
need to make a special effort to avoid building on areas of high agricultural potential. Prime<br />
agricultural land is coming under the same pressures as land with high biodiversity value and<br />
needs to be protected for its ability to produce food and fibre sustainably.<br />
CONSERVATION PLAN HANDBOOK
Land-use and administrative options for positive biodiversity outcomes include:<br />
CHAPTER 6 - LAND-USE GUIDELINES<br />
Where this category of land occurs close to areas of high biodiversity value, and is located to potentially serve useful<br />
ecological connectivity functions, such as in ecological corridors, encourage restoration and re-vegetation<br />
options;<br />
For individual parcels of land identified as having specific biodiversity values, actual or potential, develop incentives to<br />
restore lost biodiversity and connectivity;<br />
Consider the negative impacts of land uses on these areas which have off-site impacts, e.g. controlling use of pesticides,<br />
on neighbouring areas of natural habitat, especially if they are of high biodiversity value;<br />
Encourage landowners and developers to use indigenous plants, especially trees, where aesthetic or functional options<br />
exist.<br />
TYPE OF LAND USE<br />
BIODIVERSITY FRIENDLY LAND USE<br />
1. <strong>Conservation</strong> Management<br />
2. Extensive Game Farming<br />
3. Extensive Livestock Production<br />
4. Rural Recreational Development<br />
HIGH IMPACT RURAL LAND USES<br />
5. Rural (Communal) Settlement<br />
6. Dryland Crop Cultivation<br />
7. Intensive Animal Farming (incl. dairy)<br />
8. Irrigated Crop Cultivation<br />
10. Urban & Business Development<br />
11. Major Development Projects<br />
12. Linear Engineering Structures<br />
13. Water Projects & Transfers<br />
TABLE 6.2: Types of Land-Use suited to each biodiversity conservation category<br />
9. Timber Production N<br />
URBAN INDUSTRIAL LAND USES<br />
14. Underground Mining<br />
15. Surface Mining, Dumping & Dredging<br />
LEGEND: Y = YES, permitted and actively encouraged activity.<br />
N = NO, not permitted, actively discouraged activity.<br />
R = RESTRICTED, by site-specific conditions and controls when unavoidable; not usually permitted.<br />
NOTE: – These guidelines apply only to untransformed land with natural vegetation cover.<br />
This table summarises the broad Land-Use Types best suited to each of the biodiversity conservation categories. Application of these<br />
guidelines will result in the most ecologically efficient and sustainable pattern of land use throughout the Province.<br />
PAs<br />
Y<br />
Y<br />
R<br />
N<br />
N<br />
N<br />
N<br />
N<br />
N<br />
N<br />
N<br />
N<br />
N<br />
IRREPLACEABLE<br />
Y<br />
Y<br />
Y<br />
N<br />
N<br />
N<br />
N<br />
N<br />
N<br />
N<br />
N<br />
R<br />
N<br />
N<br />
HIGHLY<br />
SIGNIFICANT<br />
N N N N<br />
Y<br />
Y<br />
Y<br />
R<br />
R<br />
N<br />
N<br />
N<br />
N<br />
N<br />
N<br />
R<br />
R<br />
R<br />
IMPORTANT &<br />
NECESSARY<br />
Y<br />
Y<br />
Y<br />
R<br />
R<br />
N<br />
N<br />
N<br />
N<br />
N<br />
R<br />
R<br />
R<br />
R<br />
ECOLOGICAL<br />
CORRIDORS<br />
Y<br />
Y<br />
Y<br />
R<br />
R<br />
R<br />
R<br />
R<br />
N<br />
N<br />
R<br />
R<br />
R<br />
R<br />
R<br />
LEAST<br />
CONCERN<br />
Y<br />
Y<br />
Y<br />
Y<br />
R<br />
Y<br />
Y<br />
Y<br />
R<br />
Y<br />
R<br />
R<br />
R<br />
Y<br />
R<br />
47<br />
LAND-USE GUIDEINES
MPUMALANGA BIODIVERSITY CONSERVATION PLAN HANDBOOK<br />
48<br />
1 – 4 BIODIVERSITY-FRIENDLY LAND USES<br />
BOX 6.1: DEFINITIONS OF LAND-USE TYPES<br />
(This box relates to Table 6.2)<br />
The first four types of land-use activities have least environmental impact, subject to good management. All are more-or-less<br />
positive in protecting biodiversity assets and ecosystem functioning, i.e. they have least detrimental effect compared with the<br />
conservation ideal or benchmark, <strong>Conservation</strong> Management. Land-Use Types 2 and 3 represent production-orientated land<br />
uses with proven and profitable economies. They provide an economic focus on which to concentrate efforts to improve<br />
biodiversity and ecosystem conservation.<br />
Land-Use Type 1. <strong>Conservation</strong> Management<br />
Includes: formal and informal Protected Areas managed for biodiversity, wildlife production and recreational and<br />
educational tourism, conducted in natural habitats on extensively managed landscapes on public or private<br />
land;<br />
Assumes: specified management objectives to maintain or enhance current biodiversity; controls or guides the<br />
use of resources only at sustainable rates (consumptive and non-consumptive); controls all administrative and<br />
management developments, including zoning, minimal size, facilities carefully dispersed or clumped to achieve<br />
least impact; ecologically and sociologically sensitive practices and processes throughout.<br />
Land-Use Type 2. Extensive Game Farming<br />
Includes: game production and related tourism activities on extensive land portions of natural land cover; includes<br />
sustainable commercial hunting along with other consumptive and non-consumptive use of wild natural<br />
resources;<br />
Assumes: application of similar minimum size criteria for economic sustainability as are applied to rangeland livestock<br />
farming; strictly limited development for revenue generating purposes such as intensified tourism or<br />
sectional ownership.<br />
Land-Use Type 3. Extensive Livestock Production<br />
Includes: mainly cattle and sheep production off extensive areas of natural (unimproved) veld; mixed livestock/wildlife<br />
options; tourism;<br />
Assumes: ecologically and economically sustainable management applied to farm portions above a certain minimum size,<br />
based on ecological and economic viability.<br />
Land-Use Type 4. Rural Recreational Development<br />
Includes: development for ‘lifestyle’ or investment-type recreational ownership such as share-block schemes,<br />
multi-ownership reserves and eco-estates etc, but only for extensive land portions with limited development<br />
(NB: excludes golf estates);<br />
Assumes: maintenance of a large measure of natural land cover and biodiversity friendly management must be<br />
maintained; the development footprint should be limited to
Box 6.1 continued<br />
Land-Use Type 5. Rural (Communal) Settlement – subsistence agriculture<br />
Includes: all communal land used for residential, cultivation and grazing activities;<br />
CHAPTER 6 - LAND-USE GUIDELINES<br />
Assumes: land use generally does not have (commercial) production orientation due to socioeconomic factors and<br />
priority for residential/subsistence needs; communal as opposed to private title forms of ownership.<br />
Land-Use Type 6. Dryland Crop Cultivation<br />
Includes: all tillage cultivation of non-irrigated crops, mostly single-season annuals, but including perennial and<br />
orchard-type tree crops if cultivated with an indigenous grass layer;<br />
Assumes: crop production methods that conserve water and protect against soil erosion; more-or-less limited and<br />
responsible use of fertilisers, pesticides and other agrochemicals and genetically modified organisms (GMOs).<br />
Land-Use Type 7. Intensive Animal Farming<br />
Includes: all intensive animal production systems, of domestic or ‘wild’ species, that are dependent primarily on<br />
imported foodstuffs and confinement; includes dairy farming and all areas in production support for dairy, including<br />
pastures, fodder and grain crops, much of which is usually irrigated;<br />
Assumes: intensive production areas with relatively dense development; not dependent on the use of<br />
natural vegetation for production.<br />
Land-Use Type 8. Irrigated Crop Cultivation<br />
Includes: all irrigated crops and irrigated tree crops (orchards);<br />
Assumes: intensive production activity with high nutrient and agro-chemical inputs and often two crops per year. [but<br />
even just ploughing, with no chemicals etc, results in irreversible loss of natural habitat]<br />
Land-Use Type 9. Timber Production<br />
Includes: all timber plantations, mainly Pinus, Eucalyptus and Acacia spp.;<br />
Assumes: monoculture of alien timber species with heavy impact on hydrology and soil erosion and for introduction<br />
and spread of a variety of the most aggressive alien invasive plants.<br />
10 – 15 URBAN INDUSTRIAL LAND USES<br />
These last six land uses cause the greatest environmental impact and are almost completely destructive of natural vegetation and<br />
natural biodiversity. Where biodiversity persists, it is artificially maintained and generally supports only opportunistic assemblages of<br />
plants and animals. Ecosystem processes are completely disrupted, heavily impacted or artificially maintained at high cost.<br />
These land uses not only produce the highest local impacts but also dominate the dispersed and cumulative impacts. These<br />
are the most destructive and wide ranging, often spreading hundreds of kilometres from their source, especially along river<br />
systems. Only ad hoc benefits occur for biodiversity and ecosystem functioning. These land-use types include nonurban<br />
developments, e.g. mining and linear engineering structures, requiring special provision in land-use planning, impact<br />
assessment and mitigation.<br />
Land-Use Type 10. Urban and Business Development<br />
Includes: all physical, residential, industrial and business development – these are the urban or built landscapes. This<br />
includes peri-urban development, termed ‘rural residential’ by town planners, prescribed as one dwelling unit<br />
per hectare;<br />
Land-Use Type 11. Major Development Projects<br />
Includes: all nonurban infrastructure development, industrial processing, construction etc, not included in any other<br />
category.<br />
continued overleaf<br />
49<br />
LAND-USE GUIDEINES
MPUMALANGA BIODIVERSITY CONSERVATION PLAN HANDBOOK<br />
Box 6.1 continued<br />
50<br />
Land-Use Type 12. Linear Engineering Structures<br />
Includes: all hardened roads, railways, canals and pipelines. It does not necessarily include power and telephone<br />
lines, although these can have a measurable impact on particular species, e.g. power lines on birds.<br />
Land-Use Type 13. Water Projects and Transfers<br />
Includes: all substantial impoundments, dams and weirs, pipelines, canals and bulk water transfer schemes, including<br />
those associated with power generation.<br />
Land-Use Type 14. Underground Mining<br />
Includes: all underground mineral extraction and the surrounding ‘footprint’ of related development, which may<br />
include small areas for residential and industrial uses. It includes all waste dumps, settlement ponds and<br />
disposal sites both above and below ground.<br />
Land-Use Type 15. Surface Mining, Dumping and Dredging<br />
Includes: all strip and opencast mining excavations or quarrying, plus the visual, physical and chemical impacts of<br />
these activities, particularly on ground water reserves; all mine waste and refuse dumps, urban waste sites<br />
and landfill sites for whatever purposes. (Dredging is primarily confined to coastal systems.)<br />
BOX 6.2: BIODIVERSITY IMPACT OF LAND-USE TYPES<br />
(This box relates to Table 6.2)<br />
Table 6.2 provides a summary of the permissibility of Land-Use Types within each biodiversity conservation category. Each<br />
Land-Use Type includes a variety of potential impacts on biodiversity depending, among other things, on factors like the scale of<br />
habitat loss or the style of management. Land-use activities may be grouped and characterised in order to understand why they<br />
impact on biodiversity and ecosystem functioning.<br />
Land-Use Types 1 – 4 are those most beneficial, listed in order of least-to-most impact. The categories below are based loosely<br />
on the land-use impact assessment for grasslands of O’Connor and Kuyler (2005). Modifications accommodate the land-use<br />
management differences between grasslands and savannas.<br />
Land-Use Type 1. The most biodiversity-compatible land use is <strong>Conservation</strong> Management (CM). Specifically aimed at<br />
maintaining and enhancing biodiversity in Protected Areas, the principles of CM are described briefly at the<br />
beginning of these guidelines. Its focus is within PAs and has little to offer in protecting the large-scale ecological<br />
processes that allow species and ecosystems to persist. As a form of land use it extends to include production<br />
where, for instance, game animals are hunted or captured. CM occurs on private land when legally binding,<br />
written formalities are in place, to ensure such management extends beyond the scope of current ownership (see<br />
Box 1.2 on <strong>Conservation</strong> Stewardship).<br />
Land-Use Types 2 and 3 are the next-best land uses for biodiversity, either Game Farming or Extensive Livestock<br />
Production. These are similar in their impact in that they both use extensive areas of natural rangeland.<br />
Differences in effect between the two are small and strongly influenced by quality of management, i.e. a well<br />
managed cattle ranch may have less negative impact than a badly managed game farm, whereas with good<br />
management the reverse would be expected. Any intensification or overdevelopment (e.g. for tourism) of these<br />
areas will increase the negative impacts.<br />
Land-Use Type 4. Rural Recreation, is the third-best land use for biodiversity. This category includes: various types of<br />
multi-owner game reserves and ‘eco-estates’; share-block and sectional title developments in natural areas<br />
provided the density of development is low (
Box 6.2 continued<br />
M P U M A L A N G A<br />
<strong>Biodiversity</strong><br />
CHAPTER 6 - LAND-USE GUIDELINES<br />
density of structures and users increases. Importantly, it excludes intensive recreational developments such as<br />
golf and polo estates. These latter involve a high proportion of habitat loss and very high investments in<br />
infrastructure. They are in effect urban developments outside the urban edge and fall more appropriately into<br />
land-use type 10.<br />
Land-Use Types 5 – 9 are rural and farming activities that have serious impacts on biodiversity. They are mutually<br />
incompatible with biodiversity conservation, often accelerating degradation by causing extensive habitat loss,<br />
soil erosion and hydrological changes. Their impacts vary from moderate to severe depletion of natural biota and<br />
associated distortions of ecosystem functioning. Irrigated Crops and Timber Production impose particularly<br />
heavy impacts on environmental services such as water production. Their actual impact can be considerably<br />
reduced by factors such as small scale, dispersed and sensitive placement and general good land husbandry.<br />
Land-Use Types 10 – 15 comprise urban and industrial developments which pave over and otherwise destroy natural<br />
vegetation and soil. In the metros whole landscapes are modified in this way. Where biodiversity exists or is<br />
deliberately protected, such as in urban nature reserves, it is distorted by its small scale and ecological isolation.<br />
As such, urban biodiversity is largely symbolic, primarily serving social and environmental management needs.<br />
An artificial urban biodiversity is created with the planting of ornamental and fruit trees and a large variety of<br />
‘domestic’, mostly alien, garden plants. Although there are attractive aspects of this local abundance of trees<br />
and birds (for instance) this should not be confused with natural biodiversity; they can be mutually antagonistic,<br />
as when a garden plant becomes an alien invasive, spread by birds. Urban land uses also have important<br />
secondary and cumulative negative impacts over the long-term, such as water pollution, acid mine drainage, and<br />
increased run-off.<br />
CONSERVATION PLAN HANDBOOK<br />
51<br />
LAND-USE GUIDEINES
MPUMALANGA BIODIVERSITY CONSERVATION PLAN HANDBOOK<br />
52<br />
Lowveld Largescale Yellowfish<br />
Labeobarbus marequensis<br />
Some species of fish<br />
provide a clear indication<br />
of the quality of the<br />
aquatic system in which<br />
they live and many<br />
species are under threat.<br />
Many of <strong>Mpumalanga</strong>'s<br />
river systems are<br />
seriously threatened by<br />
toxic industrial and<br />
agricultural<br />
run-off, and water<br />
extraction. Properly<br />
managed fish<br />
populations could<br />
provide abundant<br />
opportunities for job<br />
creation through<br />
sport fishing tourism.<br />
AQUATIC ECOSYSTEMS<br />
These guidelines will assist in planning the location of public sector developments and in<br />
granting or withholding planning permission for private sector development applications.<br />
They particularly apply to all developments that have consequences for water supply and the<br />
generation of effluent and hence the functioning of aquatic ecosystems.<br />
As land-use guidelines, they are broadly stated and intended to supplement, not replace, the<br />
application of normal EIA procedures. They are intended to:<br />
Help protect aquatic ecosystems;<br />
Define norms and standards to avoid or minimise the negative impacts of development;<br />
Support the EIA process in land-use and development planning.<br />
RIVERS AND WATER USE<br />
General description of the nature and sensitivity of river systems is presented in Chapter 3.<br />
Protecting river systems and, therefore, water can seldom be achieved by taking action only at<br />
a specific site. In deciding on protection measures, it is crucial that we recognise that, without<br />
catchment-wide controls, rivers will be exploited to the point where they lose their ability to<br />
sustain the quantity and quality of water they deliver. This has already happened to many<br />
rivers in <strong>Mpumalanga</strong>.<br />
Understanding the natural state and functioning of rivers and their response to development<br />
impacts and water extraction is essential for wise decision making. The biodiversity of river<br />
ecosystems is inseparable from their environmental health and their ability to deliver fresh<br />
water. The presence or absence of key indicator species is used to measure river health and<br />
therefore environmental impact. The flow-related connectedness of rivers means that<br />
the effect of an impact may be felt many kilometres from its source. Being successful in<br />
managing rivers and their water is essential for livelihoods and is the foundation stone of<br />
sustainable development.<br />
The most common development impacts on river systems include:<br />
Water extraction: cumulative reduction of river flow;<br />
Open-cast and strip mining (especially of coal): destruction of water table, acid mine<br />
drainage, toxic ground-water discharge;<br />
<strong>Plan</strong>ting high water-demand crops (e.g. timber and sugar cane): lowers water table,<br />
stream flow reduction, complex soil changes;<br />
Industrial-scale agriculture: causes widespread changes to soil and vegetation cover<br />
with major impacts on soil erosion, infiltration of rainfall, water-table recharge<br />
and sedimentation of rivers;<br />
Atmospheric pollution: changes the chemistry of rain water (acid rain);<br />
Hard paving and built structures (urban development): reduced infiltration and water-<br />
table recharge, enhanced flooding, erosion and sedimentation of river beds,<br />
pollution and changes to overall river ecology;<br />
M P U M A L A N G A<br />
Point-source pollution from sewage, industrial and mining discharges: toxic to<br />
<strong>Biodiversity</strong><br />
biodiversity and humans, damages ecosystem health;<br />
Dams and weirs: change downstream hydrology, flow characteristics, water<br />
temperature, turbidity and dissolved nutrients, provide a physical barrier to fish;<br />
Non-point-source pollution (e.g. groundwater and seepage): from dumps (mine,<br />
industrial and rubbish), surface runoff (agricultural, mine, industrial and urban),<br />
irrigation seepage;<br />
CONSERVATION PLAN HANDBOOK
Engineering/construction/earth moving : causes<br />
accelerated soil erosion, turbidity (suspended<br />
solids) and sedimentation;<br />
Structures such as bridges, causeways, weirs and<br />
dams: can change the natural erosion and sedimentation<br />
characteristics of a river, causing local and<br />
downstream channel modification.<br />
All questions about development and the need for water and<br />
its impact on water supplies must be referred to the<br />
Department of Water Affairs (DWAF). National Water Quality<br />
Standards are set by DWAF and return flows (of effluent) from<br />
any development are subject to these. The process of<br />
determining the ‘ecological reserve’ flow, developed by<br />
DWAF, is an essential tool in managing water use so that rivers<br />
can survive as ecosystems. There are also internationally<br />
accepted standards set for structures like bridges, culverts and<br />
dams and all such developments should be subject to these.<br />
The most visible aspect of riverine biodiversity is the presence<br />
of prominent vegetation along the river line. This is not<br />
always a reliable indicator of river health. Alien plants and<br />
‘enriched’ water can confuse the picture for the untrained<br />
eye. More accurate assessment of river health requires<br />
multiple sampling for dissolved chemicals and in-stream<br />
biological indicators to provide a true reflection of the<br />
condition of a river.<br />
DEVELOPMENT GUIDELINES FOR RIVERS<br />
Any proposed development likely to impact on a river’s ecological<br />
drivers can potentially alter its functioning. Therefore, all<br />
such developments are subject to a full EIA. Impact assessment<br />
requires knowledge of the appropriate ecological reserve flow.<br />
This is determined by DWAF and involves setting standards for<br />
the quantity and quality of water required to satisfy present and<br />
future human needs and to protect aquatic ecosystems.<br />
A1. WATER EXTRACTION:<br />
No significant amount of water may be extracted from a river<br />
for public, private or commercial purposes, without a water<br />
use license provided by DWAF. This applies to direct extraction<br />
from a river or a dam, whether on private or public land.<br />
Water use licences are controlled by Water and Irrigation<br />
M P U M A L A N G A<br />
Boards located in every catchment. Allocations are made<br />
<strong>Biodiversity</strong><br />
according to the possession of ‘water rights’, which are<br />
officially allocated so as to be shared between public and<br />
private users of water. Water for human consumption has<br />
priority in the allocation of water rights, and may not be<br />
exchanged with rights for other uses such as irrigation.<br />
CHAPTER 6 - LAND-USE GUIDELINES<br />
A2. FLOW-CONTROL OR IMPOUNDMENT<br />
STRUCTURES – DAMS AND WEIRS:<br />
Surface water in <strong>Mpumalanga</strong> is already over-committed to<br />
various forms of development and human consumption. All<br />
our major rivers are impacted by water extraction and dam<br />
construction, leading to severely reduced flows in lower<br />
reaches. Because of this, all proposals for dams require<br />
detailed planning and strict adherence to formal EIA<br />
procedures, including serious consideration of alternatives.<br />
Large public development structures will go through a full EIA<br />
process with mandatory public participation. Small farm<br />
dams, however, are often thought to be too small to justify<br />
impact assessment. Historically farm dams were subsidised<br />
by the state, being considered good water conservation<br />
practice. Subsequent study has shown their cumulative effect<br />
has been to reduce stream-flow dramatically as well as several<br />
other negative impacts. In many areas small farm dams are<br />
being deliberately breached to correct this error. All farm<br />
dams and weirs are subject to EIA legislation.<br />
A2.1 FISH PASSES:<br />
Any structure that obstructs or modifies the flow in a<br />
river or creates a sharp increase in water velocity may<br />
require a fish pass to allow for upstream (as well as<br />
downstream) movement of fish. Fish passes are gently<br />
inclined, sometimes stepped, shallow channels that<br />
allow fish to swim upstream to breed. Specialised<br />
expertise is required to design and build fish passes.<br />
These structures should be compulsory wherever movement<br />
of fish up or downstream is necessary. This is<br />
particularly important in the identified priority subcatchments,<br />
important aquatic corridors and in the<br />
lower reaches of rivers. These corridors are identified<br />
on the Aquatic <strong>Biodiversity</strong> Map as critical movement<br />
links to retain some connectivity in our fractured river<br />
systems.<br />
A3. IN-STREAM ENGINEERING -<br />
CHANNEL OR BANK MODIFICATION:<br />
Wherever engineering works will disturb water courses or<br />
when structures such as road and rail crossings,have to be<br />
built through them, special measures must be taken to<br />
ensure minimal disturbance, limiting obstruction to fish<br />
movement or restriction of the channel. This provision must<br />
take into account a generous assessment of expected flood<br />
volumes as there is every indication that flood peaks (and<br />
droughts) will become more extreme as global climate<br />
change proceeds. Design specifications for such structures<br />
must be based on South African conditions and information.<br />
Imported specifications may be from less extreme climates<br />
and have inadequate margins to accommodate extremes.<br />
CONSERVATION PLAN HANDBOOK 53<br />
LAND-USE GUIDEINES
MPUMALANGA BIODIVERSITY CONSERVATION PLAN HANDBOOK<br />
54<br />
A3.1 CANALISATION OF WATER COURSES:<br />
This is often proposed as a means to reduce<br />
flooding in built-up areas as a reaction to poor<br />
catchment management or a symptom of poorly<br />
planned existing development. The hard-surfacing<br />
of the land in urban areas with roads, roofs and<br />
concrete creates severe flash floods by increasing<br />
the speed and volume of water run-off and hence its<br />
capacity for erosion and destruction. Flood events<br />
are increasing and floodplains and low-lying<br />
wetlands near rivers should never be built on.<br />
Canalisation to speed up water flow in highly builtup<br />
areas may sometimes be necessary, but only as a<br />
last resort. Environmentally-friendly planning for<br />
these sites should allow for areas to be inundated to<br />
delay runoff and keep the water on the land to<br />
recharge the water table.<br />
A4. RETURN-WATER AND EFFLUENT WATER QUALITY:<br />
Water that is returned to rivers and wetlands after urban,<br />
industrial or agricultural use must adhere to the biological<br />
and chemical standards set by DWAF. This is particularly<br />
important where discharge water comes from sewage<br />
treatment plants and from industries that use water for<br />
processing and cleansing. All of this water may be referred to<br />
as effluent and considered potentially toxic for people and<br />
the environment.<br />
Municipalities and most mining and manufacturing industries<br />
produce substantial waste and effluent. This includes solid<br />
waste that may convert rainfall into toxic seepage. The liquid<br />
and soluble chemical component ends up in rivers. River<br />
flow moves the problem to other places, where other people<br />
have to bear the cost of upstream pollution. The temptation<br />
to simply flush waste down the drain is strong and the level of<br />
this sort of illegal toxic waste disposal is high. This is particularly<br />
the case with the hundreds of small and medium enterprises<br />
in every municipality. The National Environmental<br />
Management Act requires the polluter to pay, and provides<br />
for very substantial compensation to be recovered through<br />
legal action. Continual and widespread water quality<br />
monitoring, using reliable and sophisticated technology, is the<br />
only defence against this practice.<br />
4.1 RETURN-WATER OUTFLOW STRUCTURES:<br />
M P U M A L A N G A<br />
Second-hand water, when returned to a river, must<br />
<strong>Biodiversity</strong><br />
achieve DWAF quality standards. Depending on the<br />
chemical characteristics of the effluent different<br />
disposal strategies may be prescribed. This is a<br />
specialised field of expertise and appropriate advice<br />
must be obtained. Whether sprayed on the land as<br />
irrigation water or channelled directly into a watercourse,<br />
special precautions must be taken to<br />
minimise environmental impact.<br />
A5. AGRICULTURAL LAND USES:<br />
Extraction of irrigation water from rivers and dams is<br />
controlled by DWAF in terms of the allocation of water rights.<br />
This extraction has obvious consequences in reducing downstream<br />
flow. The allocation of water rights is made by<br />
calculating the total runoff water available and allocating it<br />
equitably between all legitimate users. Because demand is<br />
almost always greater than supply, and because more and<br />
more legitimate users are being identified, this is an increasingly<br />
difficult problem to solve. The use of water pricing to<br />
regulate use is almost inevitable in this regard.<br />
A5.1 IRRIGATION SEEPAGE:<br />
In addition to reducing in-stream flow for downstream<br />
users, irrigation has other impacts on rivers<br />
and water supplies. Irrigated crops are highly<br />
productive, they require intensive soil cultivation<br />
and high levels of fertiliser and biocides. All these<br />
chemicals, as well as those extracted directly from<br />
the soil by irrigation water, end up being flushed out<br />
into the nearest drainage line. This is agricultural<br />
pollution in the form of ‘enriched’ runoff and<br />
seepage. These dissolved pollutants enter river<br />
systems and change the growing conditions for<br />
riverine ecosystems. It is in these disturbed environments<br />
that alien plants, particularly water weeds,<br />
thrive.<br />
A5.2 LIMITS TO PLANTING OF HIGH WATER-<br />
DEMAND CROPS (E.G. TIMBER AND SUGAR<br />
CANE):<br />
DWAF and their technical stakeholders (researchers<br />
and scientists from the agriculture and timber<br />
industries) have been involved in stream flow reduction<br />
studies for many decades. This highly technical work<br />
has established that timber, certain other crops and<br />
alien plant infestations, do substantially lower<br />
water-tables and reduce stream flows. These land<br />
uses consume large quantities of water potentially<br />
available for other uses, including the minimal flow<br />
required for ecosystem maintenance - known as the<br />
‘ecological reserve’.<br />
As a result, a complex authorisation protocol is in<br />
place to issue water-use licenses to approved land<br />
users wanting to grow such crops (see ‘water<br />
CONSERVATION PLAN HANDBOOK
extraction’ above). The licensing process is based on EIA procedures. It is<br />
managed cooperatively through the agricultural and environmental authorities<br />
(DWAF, DALA, MTPA) and the forestry industry. The legally required information<br />
is processed through the SFRALAAC (Stream Flow Reduction Activity Licensing<br />
Assessment Advisory Committee) which makes a recommendation to national<br />
DWAF which issues the water-use license.<br />
License applications are complex and take anything from 8 - 15 months to<br />
process. The assessment considers catchments as stressed or not, depending on<br />
the ratio of water available, over water demand. Water use licensing is intended<br />
to limit water use to sustainable levels and distribute water-use rights equitably<br />
and transparently to those in most need. Any development that has significant<br />
impact on water supply or demand must be processed through the DWAF system.<br />
If water use licences are not obtained the development may not proceed.<br />
A6. GENERAL DEVELOPMENT RESTRICTIONS IN HIGH WATER YIELD<br />
SUBCATCHMENTS:<br />
Subcatchments with high biodiversity value and high water yield potential deserve<br />
special status and priority conservation management at a landscape scale. One<br />
option is to consider various legislative measures for protection. From the wide<br />
array of conservation legislation available, there are several choices:<br />
Proclamation as Protected Mountain Catchment Areas in terms of the<br />
Mountain Catchment Areas Act;<br />
Proclamation as Protected Environments in terms of the Protected Areas Act;<br />
Proclamation as Specially Protected Ecosystems in terms of the <strong>Biodiversity</strong><br />
Act;<br />
Negotiation of Private Nature Reserve or Conservancy agreements.<br />
Additional measures could include:<br />
Strongly discourage or regulate against development that has high impact on<br />
biodiversity or on water resources;<br />
Apply the land-use guidelines listed under the biodiversity conservation<br />
categories Highly Significant and Important and Necessary to these entire<br />
catchments;<br />
Maintain or improve PESC to either A or B. Further degradation of PESC<br />
should not be allowed.<br />
Strongly advocate special water conservation farming methods by agricultural<br />
extension services;<br />
Strict enforcement of wetland and river conservation management practices;<br />
Negotiate between land-owners and relevant environmental and water<br />
authorities to develop land-use ‘best practice’ procedures and later regulate<br />
for these.<br />
Blanket coverage with these management constraints, over even a limited number of these<br />
M P U M A L A N G A<br />
subcatchments, would be difficult to implement because of the number of land-owners and<br />
<strong>Biodiversity</strong><br />
land uses involved.<br />
CHAPTER 6 - LAND-USE GUIDELINES<br />
Secretarybird<br />
Sagittarius serpentarius<br />
Many bird species in the<br />
Province are already<br />
suffering reduced<br />
numbers from habitat loss<br />
such as wetland<br />
drainage, indigenous<br />
forest clearance,<br />
grassland transformation<br />
and often poisoning<br />
through the consumption<br />
of poisoned grain or<br />
poisoned<br />
carcasses laid down for<br />
jackals. All of these<br />
activities attack<br />
biodiversity<br />
indiscriminately,<br />
sometimes with direct<br />
consequences for<br />
humans.<br />
CONSERVATION PLAN HANDBOOK<br />
55<br />
LAND-USE GUIDEINES
MPUMALANGA BIODIVERSITY CONSERVATION PLAN HANDBOOK<br />
56<br />
Red-backed Shrike<br />
Lanius collurio<br />
Each year many bird<br />
species from Europe and<br />
Asia spend the northern<br />
hemisphere<br />
winter here. Others are<br />
migrants from tropical<br />
central Africa. Poor<br />
management of our<br />
ecosystems and poor<br />
environmental<br />
management have<br />
serious impacts on these<br />
migrants. We have a<br />
global responsibility<br />
to ensure that our<br />
ecosystems are managed<br />
in ways which do not<br />
impact negatively on the<br />
shared biodiversity of<br />
the planet.<br />
WETLAND ECOSYSTEMS<br />
These guidelines should be read together with the terrestrial guidelines, in particular those<br />
applying to the IRREPLACEABLE category, which generally apply to wetlands. Wetlands are<br />
special-case patches of landscape where terrestrial and aquatic ecosystem features are most<br />
inextricably combined. Because of this and their vulnerability to development, wetlands<br />
require special measures to ensure those that are left remain functional and productive.<br />
Wetlands throughout the world, and especially in South Africa, have been widely abused and<br />
even destroyed. A combination of agriculture, afforestation and urban/industrial alteration of<br />
wetlands has resulted in 50% of them being transformed and rendered dysfunctional. This is<br />
mostly an irreversible loss, which contributes significantly to the national water crisis. All<br />
wetlands are protected by law (National Water Act, 36 of 1998) because of their importance<br />
as water management and storage areas and their vulnerability to damaging impacts.<br />
USE AND SENSITIVITY OF WETLANDS<br />
A general description of the nature and sensitivity of wetlands is presented in Chapter 3. This<br />
section highlights some key sensitivities most relevant to the land-use guidelines below.<br />
The value of wetlands is comprehensively recognised by laws and regulations worldwide. In<br />
South Africa all wetlands are protected by a number of laws, each with clear penalties for<br />
transgressors. No development applications may go ahead within or affecting wetlands<br />
without obtaining permits and authorisations from several relevant authorities. The legislation<br />
to be complied with includes: the <strong>Conservation</strong> of Agricultural Resources Act 43 of 1983, the<br />
National Environmental Management Act 107 of 1998 and the National Water Act 36 of 1998<br />
(see Appendix 1).<br />
Historically, these laws have not been strictly enforced for a variety of reasons, resulting in<br />
their having little positive impact on the rate of wetland destruction. The most widespread<br />
damage and destruction of our wetlands stems mainly from various agricultural activities,<br />
including cultivation, drainage, damming and the presence of invasive alien plants. The most<br />
serious and expensive impacts are those from timber plantations, urban and industrial<br />
development and mining.<br />
In particular, open-cast mining of coal is totally destructive of wetlands and all wetland<br />
functions. Through acid mine drainage it also pollutes ground water. Deep mining may also<br />
penetrate the water table, causing water loss to lower levels in the mine and subsequent<br />
pollution. These impacts are not limited to the immediate area of the excavation or waste<br />
dump. Acid mine drainage, pollution by heavy metal toxins and major changes in the watertable<br />
will all occur at and near the mining site. In most situations these changes will also occur<br />
at substantial distances from the mine, especially in the down-slope region. Off-site impacts<br />
can affect entire catchments and long stretches of rivers downstream from the origin of the<br />
problem. Where mining occurs together with our gigantic coal-burning power stations, high<br />
levels of atmospheric pollution, including acid rain, add to the off-site impacts of the coal and<br />
M P U M A L A N G A<br />
energy industry. With the Province’s vast shallow coal deposits these impacts have serious and<br />
<strong>Biodiversity</strong><br />
permanent environmental consequences for <strong>Mpumalanga</strong>.<br />
CONSERVATION PLAN HANDBOOK
All wetlands and all parts of every wetland are important.<br />
Their legal protection is extended to include buffer zones to<br />
protect them from off-site and up-slope activities that might<br />
damage them. A buffer of natural vegetation 20m wide,<br />
around the perimeter of all wetlands must be left<br />
undisturbed. The purpose of the buffer is to slow potentially<br />
erosive run-off, capture sediments, absorb nutrients and<br />
provide habitats for wetland-dependant organisms.<br />
The vegetation of wetlands (both live and decomposing) is<br />
usually their most important and visible feature. The waterholding<br />
and nutrient-trapping functions of this vegetation are<br />
particularly important in urban and industrial areas. This is<br />
widely recognised, to the extent that artificial wetlands are<br />
being marketed to purify waste water as an alternative to<br />
mechanical and chemical water-treatment facilities.<br />
Within wetlands the most vital parts are the permanently wet<br />
areas and where there is flowing water. These areas are often<br />
soft and vulnerable to erosion when disturbed. They include<br />
the eye of springs and fountains but are more often located at<br />
lower levels in the wetland and at critical outflow points. In<br />
floodplains, parallel to the watercourse, the outflows occur at<br />
the riverbank or channel, which is subject to high levels of<br />
erosion during seasonal high-flow events and floods. In<br />
protecting or restoring wetlands, these areas must be the focus<br />
of attention. It is critical that natural flows are not interfered<br />
with and that no soil disturbance occurs that in any way lowers<br />
the base-level of a wetland. This can very easily occur in rural<br />
areas along livestock paths, farm roads and trek routes.<br />
DEVELOPMENT GUIDELINES FOR WETLANDS<br />
W1 Map all wetlands within each municipality, according<br />
to the wetland inventory guidelines developed by<br />
DEAT (at 1:50 000 scale).<br />
W2 Ensure all development applications include an<br />
accurate, ground-checked map of all wetlands, as<br />
part of the EIA Scoping procedure. The Scoping<br />
assessment must include wetlands that fall within<br />
the development area and any off-site wetlands that<br />
may be affected by the development.<br />
W3 Obtain specialist advice to draw up management and<br />
M P U M A L A N G A<br />
protection guidelines if a wetland is known to<br />
<strong>Biodiversity</strong><br />
contain high value biodiversity or is located in a<br />
high value subcatchment. The guidelines should<br />
include provision for buffer zones as well as linkages<br />
to other natural areas, according to the specific<br />
requirements of the biota and the nature and layout<br />
of the system.<br />
CHAPTER 6 - LAND-USE GUIDELINES<br />
W4 No excavation, channelling, drainage or in-filling, nor<br />
any building or hardened surfaces, may be located<br />
in any wetland, or within its buffer zone.<br />
W5 No dumping of wet or dry material and, in particular,<br />
no waste disposal of any kind may be permitted in<br />
or near a wetland.<br />
W6 No dams or weirs, other than those specifically<br />
designed for erosion control, may be constructed in<br />
wetlands.<br />
W7 Wetlands should not be cultivated at all. If cultivation<br />
is absolutely unavoidable, such as for food gardens<br />
or other subsistence agricultural use for which there<br />
is no practical alternative, then specialist advice is<br />
required to limit its impact. Such advice should<br />
specify the types of cultivation and crops allowed<br />
and the seasonal and spatial limits for cultivation.<br />
Mechanised cultivation (tractors) may not be<br />
permitted.<br />
W8 Controls must be established for livestock grazing and<br />
any harvesting of wild plants from any wetland.<br />
W9 The presence of alien tree species in wetlands is strictly<br />
forbidden, whether deliberately cultivated or<br />
spread by natural means.<br />
W10 No roads should be permitted to traverse wetlands. If<br />
no alternative route exists, all aspects of the road,<br />
its design, construction, use and maintenance, must<br />
ensure minimal environmental impact. Care must<br />
be taken not to interfere with the flow of water<br />
through the wetland, both above and below<br />
ground. (For example: minimise surface disturbance<br />
and embankment building; avoid excavation;<br />
construct small and dispersed, low-volume, lowvelocity<br />
road-drains and culverts; use bridges or<br />
box culverts rather than pipes.) The base-level of<br />
the wetland must not be disturbed or changed. If a<br />
flow-channel is present, it must not be disturbed<br />
or interfered with in any way, by damming or<br />
excavation.<br />
W11 Where a road or other water channelling structure runs<br />
alongside or close to a wetland and channels water<br />
into it, such water should be dispersed via multiple<br />
entry points with energy-dispersing structures.<br />
These drains must be small, dispersed low-volume,<br />
low-velocity structures. They must also be set back<br />
from the wetland and its buffer zone and be<br />
CONSERVATION PLAN HANDBOOK 57<br />
LAND-USE GUIDEINES
MPUMALANGA BIODIVERSITY CONSERVATION PLAN HANDBOOK<br />
58<br />
Flesh Fly<br />
Sarcophaga<br />
haemorrhoidalis<br />
Whilst insects are<br />
generally seen as pests,<br />
they have a vital role to<br />
play in maintenance of<br />
biodiversity. Many of<br />
them are pollinators;<br />
sometimes a single<br />
species pollinates only a<br />
single plant species.<br />
Others are active and<br />
aggressive hunters of<br />
species that are agricul-<br />
tural and human pests.<br />
Even the flesh flies have a<br />
role to play in that, in<br />
many species, their<br />
larvae contribute to<br />
waste disposal,<br />
especially of faeces.<br />
designed to spill into undisturbed natural vegetation at ground level. These provisions<br />
also apply to all urban storm-water outlets that spill into a wetland or<br />
up-slope of a wetland.<br />
W12 Any development that will affect a wetland must comply with the requirements of the<br />
National Water Act (1998). Through the concept of the ‘ecological reserve’, this<br />
Act seeks to safeguard the production of water of acceptable quantity and quality,<br />
for maintaining the well-being of the nation into the future.<br />
W13 In peri-urban areas, wetlands should never be alienated for subdivision and private<br />
ownership for any form of use or development that has potentially negative<br />
impacts on wetland functions.<br />
W14 Routine wetland management and restoration should include efforts to control all<br />
activities that harm wetlands. Avoid disturbing natural vegetation cover; avoid<br />
compacting any soil surface; control the spread of alien invasive plants; do<br />
nothing that will interfere with water flow, infiltration, or ground-water recharge.<br />
Specialist advice will be required to determine best procedures.<br />
M P U M A L A N G A<br />
<strong>Biodiversity</strong><br />
CONSERVATION PLAN HANDBOOK
APPENDIX 1<br />
..........................<br />
ENVIRONMENTAL LEGISLATION<br />
ENVIRONMENTAL LEGISLATION RELEVANT TO BIODIVERSITY PRIORITY AREAS<br />
CONSERVATION OF AGRICULTURAL RESOURCES ACT (43 OF 1983)<br />
(to be replaced by Sustainable Use of Agricultural Resources Bill)<br />
Authority: National Department of Agriculture<br />
Commenting authority: Provincial Department of Agriculture (DALA) and MTPA<br />
KEY SECTION: Terrestrial and aquatic invasive alien species<br />
APPENDIX 1 - ENVIRONMENTAL LEGISLATION<br />
There are many environmental and planning laws that require planners and decision-makers to consider the<br />
conservation of biodiversity. These apply at all levels of government but are particularly important at the level<br />
of the Local Municipality. It is here, and with the provincial environmental authority, which is currently the<br />
Department of Agriculture and Land Administration (DALA), where these responsibilities are most obviously<br />
and importantly located.<br />
The focus of planning and decision making is necesarily on the future. The future of our natural resources has<br />
already been compromised with over 35% of the province’s natural vegetation cover already transformed and<br />
its biodiversity substantially destroyed. In this context it must be recognised that any further disturbance of<br />
natural habitat has legal implications and in most cases requires a permit from the regulatory authority. A<br />
selection of relevant environmental legislation is set out below for quick reference (adapted from Job, 2006).<br />
Funding is available from National Department of Agriculture to support clearing of<br />
invasive species. Lists of weeds and invader plants are available, (R.280 of March 2001).<br />
REGULATION 16: Control of weeds and invader plants:<br />
1. If invasive weeds (as specified in the Act) occur on any area (also specified) the land<br />
user shall, by any of the following means, control those weeds effectively:<br />
(a) The weeds shall be uprooted, felled or cut off and shall be destroyed by<br />
burning or other suitable method.<br />
(b) The weeds shall be treated with an appropriately registered weed killer.<br />
(c) The measures above shall be applied to the seeds, seedlings or regrowth<br />
of the weeds to prevent them from setting seed or propagating<br />
vegetatively.<br />
Various categories of invasive alien plant species are listed in different sections of the<br />
Act with appropriately strict and specific responses required of any land owner or<br />
occupier in repect of each category of invader plant.<br />
KEY SECTION: Terrestrial ecosystems<br />
REGULATION 2: Cultivation of virgin soil.<br />
No land user shall cultivate any virgin soil except with the authority of a written permit<br />
issued by the executive officer. Virgin soil includes land that was cultivated but has lain<br />
fallow for more than ten years. Such permission may also be granted in terms of<br />
Section 4A of the National Forest Act (68 of 1972).<br />
REGULATION 3: Cultivation of land with a slope.<br />
1. Land with a slope of more than 20% may not be cultivated without a permit.<br />
2. Land with a slope of more than 12% may not be cultivated without a permit if<br />
certain specified soil types or conditions occur on that land.<br />
3. The above prohibitions do not apply to land that was already cultivated when these<br />
regulations came into force, provided such land is already protected effectively<br />
against excessive soil erosion.<br />
Funding is available from National Department of Agriculture for measures to prevent soil<br />
erosion, the restoration of eroded land or degraded veld.<br />
Ai APPENDIX
MPUMALANGA BIODIVERSITY CONSERVATION PLAN HANDBOOK<br />
Aii<br />
NATIONAL FORESTS ACT (84 OF 1998)<br />
Authority: Department of Water Affairs and Forestry,<br />
HYPERLINK "http://www.dwaf.gov.za"<br />
CHAPTER 3 PART 1 Prohibits the destruction of indigenous trees in any natural forest without a licence.<br />
SUBDIVISION OF AGRICULTURAL LAND ACT (70 OF 1970)<br />
Authority: National Department of Agriculture<br />
Commenting authority: Provincial Department of Agriculture (DALA) and MTPA<br />
KEY SECTION A permit is required to subdivide or encumber with restrictions any agricultural land.<br />
MINERAL AND PETROLEUM RESOURCES DEVELOPMENT ACT (50 OF 1991)<br />
Authority: National Department of Minerals and Energy<br />
HYPERLINK "http://www.dme.gov.za”<br />
KEY SECTION: A permit is required from the Department of Minerals and Energy for any mining,<br />
quarrying or other extractive activities. This is in addition to any permits required under<br />
any other legislation such as the National Water Act or NEMA.<br />
NATIONAL ENVIRONMENTAL MANAGEMENT ACT (107 OF 1998)<br />
- see Ch 2, MBCP <strong>Handbook</strong><br />
Authority: Department of Agriculture and Land Administration (DALA) www.deat.gov.za<br />
KEY SECTIONS: The National Environmental Management Act (NEMA) is the first step in giving legal effect<br />
to the environmental rights in the Constitution (Section 24).<br />
THE ACT: Establishes principles to guide the decisions and actions of all organs of state<br />
(NEMA Principles);<br />
Establishes procedures for co-operative governance;<br />
Promotes integrated environmental management by establishing procedures for<br />
environmental impact assessments and enabling any national or provincial<br />
permitting authority to prescribe environmental impact assessment regulations<br />
Of key importance is Section 5, which deals with Environmental Impact Assessment<br />
(EIA) and Environmental Management Frameworks (EMFs). EIA regulations have been<br />
promulgated in terms of Section 5 of NEMA. Development activities must have<br />
environmental authorisation from the relevant environmental authority (namely DALA)<br />
before commencement. In addition, the Province can compile information and maps<br />
in the form of EMFs which will inform the EIA process by identifying environmental<br />
attributes (such as environmental sensitivity, biodiversity, etc. ) for a specific geographic<br />
area. The EMFs will also guide spatial planning for the affected geographic area. EMFs<br />
can be compiled for a local municipal area.<br />
M P U M A L A N G A<br />
<strong>Biodiversity</strong><br />
CONSERVATION PLAN HANDBOOK
NATIONAL WATER ACT (36 OF 1998)<br />
Authority: Department of Water Affairs and Forestry, HYPERLINK "http://www.dwaf.gov.za"<br />
Commenting authority: <strong>Mpumalanga</strong> Tourism and Parks Agency<br />
DEFINITION OF TERMS ‘water resource’ includes a watercourse, surface water, wetland or aquifer;<br />
‘watercourse’ means -<br />
APPENDIX 1 - ENVIRONMENTAL LEGISLATION<br />
(a) a river or spring;<br />
(b) a natural channel in which water flows regularly or intermittently;<br />
(c) a wetland, lake or dam into which, or from which, water flows.<br />
(Reference to a watercourse includes, where relevant, its bed and banks)<br />
‘riparian habitat’ includes the physical structure and associated vegetation of the area<br />
associated with a watercourse. These consist of alluvial soils, sometimes periodically<br />
flooded, supporting characteristic riverine vegetation with species and appearance dis<br />
tinct from adjacent upland areas;<br />
‘wetland’ means land which is transitional between terrestrial and aquatic systems where<br />
the water table is usually at or near the surface, or the land is periodically covered with<br />
shallow water, and which land in normal circumstances supports or would support<br />
vegetation typically adapted to life in saturated soil.<br />
‘aquifer’ means a geological formation which has structures or textures that hold water or<br />
permit appreciable water movement through them.<br />
KEY SECTIONS: Water use<br />
SECTION 21: Lists eleven water uses that must be authorised by DWAF.<br />
For the purposes of Section 21 of this Act, water use includes :<br />
(a) taking water from a water resource;<br />
(b) storing water;<br />
(c) impeding or diverting the flow of water in a watercourse;<br />
(d) engaging in a stream flow reduction activity;<br />
(e) engaging in a ‘controlled activity’ as identified in Sects 37(1) or 38(1);<br />
(f) discharging waste or any water containing waste into a water resource;<br />
(g) disposing of waste in ways that may have detrimental impact on a<br />
water resource;<br />
(h) disposing in any manner of water which contains waste from, or which has<br />
been heated in, any industrial or power generation process;<br />
(i) altering the bed, banks, course or characteristics of a watercourse;<br />
(j) removing or discharging water found underground, necessary for the<br />
efficient continuation of an activity or for the safety of people;<br />
(k) using water for recreational purposes.<br />
SECTION 22: According to Section 22 of the Act, a person may only use water –<br />
(a) without a licence:<br />
1. If that water use is permissible under Schedule 1(reasonable domestic use)<br />
2. If that water use is permissible as a continuation of an existing lawful use<br />
(section 32); or<br />
3. if that water use is permissible in terms of a general authorisation issued<br />
under section 39;<br />
(b) if the water use is authorised by a licence under this Act; or<br />
(c) if the responsible authority has dispensed with a licence requirement (Subsect, 3).<br />
A responsible authority may dispense with the requirement for a licence for water use if<br />
it is satisfied that the purpose of this Act will be met by the grant of a licence, permit or<br />
other authorisation under any other law.<br />
SECTION 144: States DWAF’s view on development surrounding water resources: For the purposes of<br />
ensuring that all persons who might be affected have access to information regarding<br />
potential flood hazards, no person may establish a township, unless the layout plan<br />
shows, in a form acceptable to the local authority, lines indicating the 100 year flood line.<br />
continued overleaf<br />
Aiii<br />
APPENDIX
MPUMALANGA BIODIVERSITY CONSERVATION PLAN HANDBOOK<br />
Aiv<br />
PART 4: Part 4 of the Act lays down clear responsibilities regarding preventing and remedying the<br />
KEY SECTIONS : Aquatic ecosystems<br />
NATIONAL WATER ACT (36 OF 1998)<br />
effect of pollution of water resources.<br />
The Act also provides for an ecological reserve to be determined for every river in South<br />
Africa, limiting the amount of water that can be abstracted from the river. The ecological<br />
reserve is the portion of the river’s streamflow that needs to remain in the river to ensure<br />
the sustainable healthy functioning of aquatic ecosystems. Only water over and above the<br />
ecological reserve may be used.<br />
The Act defines the ecological reserve as the quantity and quality of water required:<br />
(a) to satisfy basic human needs by securing a basic water supply, as prescribed under<br />
the Water Services Act (108 of 1997), for people who are or who will in the near<br />
future, be:<br />
(i) relying upon;<br />
(ii) taking water from; or<br />
(iii) being supplied from, the relevant water resource; and<br />
(b) to protect aquatic ecosystems in order to secure ecologically sustainable<br />
development and use of the relevant water resource.<br />
DWAF may require that an environmental impact assessment (EIA) be undertaken in<br />
support of a licence application. An EIA in terms of the National Water Act would entail<br />
an assessment by a competent person of the likely environmental effects of the proposed<br />
licence on the resource.<br />
REGULATION 7: Use and protection of wetlands and watercourses<br />
1. Wetlands and watercourses may not be used in any way that causes or may cause<br />
deterioration of or damage to the natural agricultural resources of the site. This<br />
includes all areas within the flood zone of a watercourse or within 10 meters hori<br />
zontally outside the flood zone.<br />
2. No land user shall drain or cultivate any wetland or area within the flood zone of<br />
any watercourse (including its 10 metre buffer) except in terms of a written permit.<br />
3. The above prohibitions do not apply to land that was already cultivated when these<br />
regulations came into force, provided such land is already protected effectively<br />
against excessive soil erosion.<br />
REGULATION 8: Regulating the flow pattern of run-off water<br />
1. No water from any watercourse may be diverted to any other watercourse without wrtten<br />
permit.<br />
No obstruction, dam nor any disturbance of the flow pattern of run-off water may be made on any<br />
land, without: provision being made for the collection, passing through and flowing away of run-off<br />
water, around or along the said obstruction, in a way that ensures it will not cause excessive soil<br />
erosion or the deterioration of natural agricultural resources.<br />
M P U M A L A N G A<br />
<strong>Biodiversity</strong><br />
CONSERVATION PLAN HANDBOOK
KEY SECTIONS:<br />
NEM PROTECTED AREAS ACT (57 OF 2003)<br />
Authority: Department of Environmental Affairs and Tourism (DEAT)<br />
HYPERLINK "http://www.deat.gov.za"<br />
APPENDIX 1 - ENVIRONMENTAL LEGISLATION<br />
CHAPTER 2: Outlines a system of protected areas in South Africa consisting of the following:<br />
(a) special nature reserves, nature reserves (including wilderness areas) and protected<br />
environments;<br />
(b) national parks and world heritage sites;<br />
(c) forest nature reserves and forest wilderness areas, declared in terms of the National<br />
Forests Act, 84 of 1998;<br />
(d) mountain catchment areas declared ito the Mountain Catchment Areas Act, 63 of<br />
1970.<br />
CHAPTER 4: Provides for management authority for protected areas to be identified and requires such<br />
authority to manage each reserve in terms of a specified management plan. Management<br />
plans are required to set down the policy and purpose of reserve management,<br />
implementation, zoning and performance criteria and costing of the plan.<br />
KEY SECTIONS:<br />
NEM BIODIVERSITY ACT (10 OF 2004)<br />
Authority: Department of Environmental Affairs and Tourism (DEAT) www.deat.gov.za<br />
CHAPTER 4: Provides for listing of threatened and protected ecosystems by the Minister or MEC.<br />
Once listed, these ecosystems will have to be taken into account in IDPs, and will be<br />
considered special areas in terms of NEMA.<br />
CHAPTER 5: Provides for invasive alien species control.<br />
“All organs of state in all spheres of government must prepare invasive species<br />
monitoring, control and eradication plans for land under their control, as part of<br />
their environmental plans in accordance with Section 11 of the National<br />
Environmental Management Act.”<br />
“Invasive species monitoring, control and eradication plans of municipalities<br />
must be part of their Integrated Development <strong>Plan</strong>s”<br />
M P U M A L A N G A<br />
<strong>Biodiversity</strong><br />
CONSERVATION PLAN HANDBOOK<br />
Av<br />
APPENDIX
MPUMALANGA BIODIVERSITY CONSERVATION PLAN HANDBOOK<br />
Avi<br />
VEGETATION TYPE NAME<br />
Barberton Scarp Forest<br />
Dry Afromontane Forest<br />
Dry Scarp Forest<br />
Lowveld Riverine Forest<br />
Maputaland Scarp Forest<br />
<strong>Mpumalanga</strong> Afromontane Forest<br />
Northern KZN Mistbelt Forest<br />
Northern Mistbelt Forest<br />
Subtropical Afromontane Forest<br />
Amersfoort Highveld Clay Grassland<br />
Andesite Mountain Bushveld<br />
Barberton Montane Grassland<br />
Carletonville Dolomite Grassland<br />
Eastern Highveld Grassland<br />
Eastern Temperate Freshwater Wetlands<br />
Frankfort Highveld Grassland<br />
KaNgwane Montane Grassland<br />
KwaZulu-Natal Highland Thornveld<br />
Lebombo Summit Sourveld<br />
Leolo Summit Sourveld<br />
Long Tom Pass Montane Grassland<br />
Low Escarpment Moist Grassland<br />
Lydenburg Thornveld<br />
Marikana Thornveld<br />
APPENDIX 2<br />
..........................<br />
STATUS OF THE 68 VEGETATION TYPES<br />
FOUND IN MPUMALANGA PLANNING REGION<br />
Northern Escarpment Afromontane Fynbos<br />
Northern Escarpment Dolomite Grassland<br />
% TARGET<br />
62<br />
68<br />
62<br />
70<br />
62<br />
68<br />
72<br />
60<br />
68<br />
24<br />
24<br />
27<br />
24<br />
24<br />
24<br />
24<br />
24<br />
23<br />
24<br />
24<br />
27<br />
23<br />
24<br />
19<br />
27<br />
27<br />
ORIGINAL<br />
AREA HA<br />
3582.1<br />
9554.8<br />
713.9<br />
167.0<br />
3701.9<br />
14691.7<br />
2864.5<br />
221.7<br />
4775.3<br />
281233.3<br />
42216.4<br />
109466.4<br />
5096.2<br />
1241467.2<br />
15881.6<br />
49724.2<br />
604662.2<br />
91.8<br />
941.2<br />
114.9<br />
104990.9<br />
17043.5<br />
155196.7<br />
15116.2<br />
854.7<br />
93713.3<br />
% NATURAL<br />
99.2<br />
98.6<br />
94.9<br />
99.3<br />
93.3<br />
99.7<br />
100.0<br />
100.0<br />
99.9<br />
66.1<br />
71.8<br />
65.1<br />
56.8<br />
42.8<br />
86.7<br />
56.4<br />
49.0<br />
81.8<br />
74.2<br />
99.9<br />
56.5<br />
97.5<br />
76.5<br />
63.3<br />
94.3<br />
43.3<br />
ECOSYSTEM<br />
STATUS<br />
LeastThreatened<br />
Least Threatened<br />
Least Threatened<br />
Least Threatened<br />
Least Threatened<br />
Least Threatened<br />
Least Threatened<br />
Least Threatened<br />
Least Threatened<br />
Vulnerable<br />
Vulnerable<br />
Vulnerable<br />
Endangered: Low<br />
Endangered:High<br />
Least Threatened<br />
Endangered:Low<br />
Endangered:High<br />
Least Threatened<br />
Vulnerable<br />
Least Threatened<br />
Endangered:Low<br />
Least Threatened<br />
Vulnerable<br />
Vulnerable<br />
Least Threatened<br />
Endangered:High<br />
% OF TARGET<br />
PROTECTED<br />
64.6<br />
15.5<br />
0.3<br />
54.7<br />
29.1<br />
78.8<br />
9.8<br />
0.0<br />
93.1<br />
0.0<br />
0.0<br />
147.4<br />
0.0<br />
0.8<br />
8.3<br />
0.0<br />
3.3<br />
0.0<br />
0.0<br />
0.0<br />
83.3<br />
0.0<br />
16.7<br />
0.0<br />
320.0<br />
9.3<br />
PROTECTION<br />
STATUS<br />
Moderately P.<br />
Poorly P.<br />
Hardly P.<br />
Moderately P.<br />
Poorly P.<br />
Moderately P.<br />
Poorly P.<br />
Not P.<br />
Moderately P.<br />
Not P.<br />
Not P.<br />
Well P.<br />
Not P.<br />
Hardly P.<br />
Poorly P.<br />
Not P.<br />
Hardly P.<br />
Not P.<br />
Not P.<br />
Not P.<br />
Moderately P.<br />
Not P.<br />
Poorly P.<br />
Not P.<br />
Well P.<br />
Poorly P.<br />
(BASED ON<br />
TARGET)<br />
BIOME<br />
Forest<br />
Forest<br />
Forest<br />
Forest<br />
Forest<br />
Forest<br />
Forest<br />
Forest<br />
Forest<br />
Grassland<br />
Grassland<br />
Grassland<br />
Grassland<br />
Grassland<br />
Grassland<br />
Grassland<br />
Grassland<br />
Grassland<br />
Grassland<br />
Grassland<br />
Grassland<br />
Grassland<br />
Grassland<br />
Grassland<br />
Grassland<br />
Grassland<br />
BIOME<br />
NATURAL %<br />
98.8<br />
98.8<br />
98.8<br />
98.8<br />
98.8<br />
98.8<br />
98.8<br />
98.8<br />
98.8<br />
55.4<br />
55.4<br />
55.4<br />
55.4<br />
55.4<br />
55.4<br />
33.4<br />
55.4<br />
55.4<br />
55.4<br />
55.4<br />
55.4<br />
55.4<br />
55.4<br />
55.4<br />
55.4<br />
55.4<br />
continued overleaf
Northern Escarpment Quartzite Sourveld<br />
Northern Free State Shrubland<br />
Paulpietersburg Moist Grassland<br />
Rand Highveld Grassland<br />
Sekhukhune Montane Grassland<br />
Soweto Highveld Grassland<br />
Steenkampsberg Montane Grassland<br />
Subtropical Freshwater Wetlands<br />
Subtropical Salt Pans<br />
Tsakane Clay Grassland<br />
Wakkerstroom Montane Grassland<br />
Barberton Serpentine Sourveld<br />
Central Sandy Bushveld<br />
Croc Gorge Mountain Bushveld<br />
Delagoa Lowveld<br />
Gabbro Grassy Bushveld<br />
Gold Reef Mountain Bushveld<br />
Granite Lowveld<br />
Ithala Quartzite Sourveld<br />
Kaalrug Mountain Bushveld<br />
Legogote Sour Bushveld<br />
Loskop Mountain Bushveld<br />
Loskop Thornveld<br />
Lowveld Rugged Mopaneveld<br />
Makuleke Sandy Bushveld<br />
Malelane Mountain Bushveld<br />
Mopane Basalt Shrubland<br />
27<br />
28<br />
105335.0<br />
643.7<br />
51.2<br />
96.4<br />
APPENDIX 2 - STATUS OF THE 68 VEGETATION TYPES<br />
STATUS OF THE 68 VEGETATION TYPES FOUND IN MPUMALANGA PLANNING REGION<br />
VEGETATION TYPE NAME<br />
Mopane Gabbro Shrubland<br />
Northern Lebombo Bushveld<br />
% TARGET<br />
24<br />
24<br />
24<br />
24<br />
27<br />
24<br />
24<br />
24<br />
26<br />
24<br />
19<br />
24<br />
19<br />
19<br />
24<br />
19<br />
27<br />
24<br />
19<br />
24<br />
19<br />
19<br />
19<br />
24<br />
19<br />
19<br />
24<br />
ORIGINAL<br />
AREA HA<br />
128851.3<br />
589365.5<br />
138155.2<br />
975679.0<br />
385703.8<br />
711.6<br />
111.0<br />
21014.0<br />
233996.9<br />
10958.4<br />
457936.3<br />
54002.1<br />
69854.2<br />
74219.5<br />
10389.1<br />
715370.3<br />
23701.1<br />
46551.5<br />
352314.0<br />
177995.6<br />
76038.7<br />
14712.4<br />
3512.7<br />
63044.3<br />
10850.5<br />
3335.9<br />
88691.1<br />
% NATURAL<br />
60.0<br />
52.3<br />
67.0<br />
49.6<br />
79.2<br />
87.8<br />
93.9<br />
57.3<br />
88.9<br />
73.4<br />
59.6<br />
87.2<br />
88.0<br />
99.3<br />
75.9<br />
82.1<br />
68.6<br />
85.7<br />
42.5<br />
95.2<br />
67.8<br />
99.7<br />
99.5<br />
96.4<br />
99.2<br />
99.0<br />
99.3<br />
ECOSYSTEM<br />
STATUS<br />
Endangered:Low<br />
Least Threatened<br />
Vulnerable<br />
Endangered: Low<br />
Vulnerable<br />
Endangered: Low<br />
Vulnerable<br />
Least Threatened<br />
Least Threatened<br />
Endangered: Low<br />
Least Threatened<br />
Vulnerable<br />
Endangered: Low<br />
Least Threatened<br />
Least Threatened<br />
Least Threatened<br />
Vulnerable<br />
Least Threatened<br />
Vulnerable<br />
Least Threatened<br />
Endangered: High<br />
Least Threatened<br />
Vulnerable<br />
Least Threatened<br />
Least Threatened<br />
Least Threatened<br />
Least Threatened<br />
Least Threatened<br />
Least Threatened<br />
% OF TARGET<br />
PROTECTED<br />
70.4<br />
0.0<br />
3.3<br />
5.8<br />
0.0<br />
0.0<br />
6.3<br />
226.2<br />
0.0<br />
0.0<br />
3.5<br />
70.0<br />
24.7<br />
32.9<br />
366.3<br />
523.7<br />
0.0<br />
307.9<br />
0.0<br />
82.1<br />
26.3<br />
71.7<br />
60.5<br />
522.6<br />
524.7<br />
324.2<br />
525.8<br />
526.3<br />
416.3<br />
PROTECTION<br />
STATUS<br />
Moderately P.<br />
Not P.<br />
Hardly P.<br />
Poorly P.<br />
Not P.<br />
Not P.<br />
Poorly P.<br />
Well P.<br />
Not P.<br />
Not P.<br />
Hardly P.<br />
Moderately P.<br />
Poorly P.<br />
Poorly P.<br />
Well P.<br />
Well P.<br />
Not P.<br />
Well P.<br />
Not P.<br />
Moderately P.<br />
Poorly P.<br />
Moderately P.<br />
Moderately P.<br />
Well P.<br />
Well P.<br />
Well P.<br />
Well P.<br />
Well P.<br />
Well P.<br />
(BASED ON<br />
TARGET)<br />
BIOME<br />
Grassland<br />
Grassland<br />
Grassland<br />
Grassland<br />
Grassland<br />
Grassland<br />
Grassland<br />
Grassland<br />
Grassland<br />
Grassland<br />
Grassland<br />
Savanna<br />
Savanna<br />
Savanna<br />
Savanna<br />
Savanna<br />
Savanna<br />
Savanna<br />
Savanna<br />
Savanna<br />
Savanna<br />
Savanna<br />
Savanna<br />
Savanna<br />
Savanna<br />
Savanna<br />
Savanna<br />
Savanna<br />
Savanna<br />
BIOME<br />
NATURAL %<br />
55.4<br />
55.4<br />
55.4<br />
55.4<br />
55.4<br />
55.4<br />
55.4<br />
55.4<br />
55.4<br />
55.4<br />
55.4<br />
74.9<br />
74.9<br />
74.9<br />
74.9<br />
74.9<br />
74.9<br />
74.9<br />
74.9<br />
74.9<br />
74.9<br />
74.9<br />
74.9<br />
74.9<br />
74.9<br />
74.9<br />
74.9<br />
74.9<br />
74.9<br />
continued overleaf<br />
Avii<br />
APPENDIX
MPUMALANGA BIODIVERSITY CONSERVATION PLAN HANDBOOK<br />
Aviii<br />
Sekhukhune Mountain Bushveld<br />
Sekhukhune Plains Bushveld<br />
Southern Lebombo Bushveld<br />
Springbokvlakte Thornveld<br />
Swaziland Sour Bushveld<br />
Sweet Arid Basalt Lowveld<br />
Tzaneen Sour Lowveld<br />
Zululand Lowveld<br />
STATUS OF THE 68 VEGETATION TYPES FOUND IN MPUMALANGA PLANNING REGION<br />
VEGETATION TYPE NAME<br />
Poung Dolomite Mountain Bushveld<br />
Pretoriuskop Sour Bushveld<br />
% TARGET<br />
24<br />
19<br />
24<br />
19<br />
24<br />
19<br />
19<br />
19<br />
19<br />
19<br />
ORIGINAL<br />
AREA HA<br />
34005.4<br />
94291.4<br />
158236.8<br />
99685.9<br />
13649.1<br />
126701.5<br />
87460.6<br />
281799.8<br />
226.3<br />
38468.4<br />
% NATURAL<br />
Nwambyia-Pumbe Sandy Bushveld 69 2570.0 96.8 Least Threatened 144.9 Well P. Savanna 74.9<br />
Ohrigstad Mountain Bushveld<br />
Phalaborwa-Timbavati Mopaneveld<br />
24<br />
19<br />
153332.9<br />
44621.8<br />
85.3<br />
99.2<br />
89.9<br />
73.4<br />
90.3<br />
41.4<br />
76.1<br />
42.5<br />
79.5<br />
88.9<br />
100.0<br />
51.7<br />
ECOSYSTEM<br />
STATUS<br />
Least Threatened<br />
Least Threatened<br />
Least Threatened<br />
Vulnerable<br />
Least Threatened<br />
Endangered:High<br />
Vulnerable<br />
Endangered:High<br />
Vulnerable<br />
Least Threatened<br />
Least Threatened<br />
Endangered:Low<br />
M P U M A L A N G A<br />
<strong>Biodiversity</strong><br />
CONSERVATION PLAN HANDBOOK<br />
% OF TARGET<br />
PROTECTED<br />
19.6<br />
526.3<br />
16.3<br />
209.5<br />
0.0<br />
0.0<br />
0.0<br />
31.6<br />
175.8<br />
414.2<br />
183.7<br />
11.1<br />
PROTECTION<br />
STATUS<br />
Poorly P.<br />
Well P.<br />
Poorly P.<br />
Well P.<br />
Not P.<br />
Not P.<br />
Not P.<br />
Poorly P.<br />
Well P.<br />
Well P.<br />
Well P.<br />
Poorly P.<br />
(BASED ON<br />
TARGET)<br />
BIOME<br />
Savanna<br />
Savanna<br />
Savanna<br />
Savanna<br />
Savanna<br />
Savanna<br />
Savanna<br />
Savanna<br />
Savanna<br />
Savanna<br />
Savanna<br />
Savanna<br />
BIOME<br />
NATURAL %<br />
74.9<br />
74.9<br />
74.9<br />
74.9<br />
74.9<br />
74.9<br />
74.9<br />
74.9<br />
74.9<br />
74.9<br />
74.9<br />
74.9
Coetzeestroom/Elands Valley<br />
Dr Hamilton Nature Reserve<br />
Flora Nature Reserve<br />
Hartebeesvlakte<br />
Morgenzon<br />
Nelsberg<br />
Queensriver<br />
Starvation Creek<br />
Tweefontein<br />
Wonderkloof Nature Reserve<br />
Mananga Community Heritage<br />
Mawewe Cattle/Game Project<br />
Mthethomusha NR<br />
Cynthia Letty<br />
Ida Doyer Nature Reserve<br />
Thorncroft Nature Reserve<br />
*IFMCA/Conservancy<br />
*IFMCA<br />
*IFMCA<br />
*IFMCA<br />
*IFMCA<br />
*IFMCA<br />
*IFMCA<br />
*IFMCA/Conservancy<br />
*IFMCA<br />
*IFMCA<br />
APPENDIX 3 - DATA SUMMARY OF FORMAL AND INFORMAL PROTECTED AREAS<br />
APPENDIX 3<br />
..........................<br />
DATA SUMMARY OF FORMAL AND<br />
INFORMAL PROTECTED AREAS<br />
UNDERSTANDING THE DATA IN THIS TABLE<br />
TYPE OF PA A protected area may be known as more than one ‘type’ because some PAs are located within others.<br />
PA GROUP CLASSES Types of PA are further classified into three groups, based on land ownership and level of protection. While<br />
GROUP 1<br />
some of these classifications may be debateable they are based on informed MTPA opinion as to: level of<br />
GROUP 2<br />
security, ownership and staff attention (a proxy for resource allocation). Group allocation is colour coded in<br />
GROUP 3<br />
the table.<br />
CONSERVATION This is a score between 0 and 1 calculated for each PA, based on C-<strong>Plan</strong>’s irreplaceability analysis. It<br />
IMPORTANCE (CI) represents an irreplaceability value of >0.5 (50%) expressed as a proportion of total area. <strong>Conservation</strong><br />
Importance, measures a PA's total contribution to the 340 biodiversity feature targets measured.<br />
RANK This is the rank of each PA based on its <strong>Conservation</strong> Importance. Many PAs have identical ranks because<br />
they achieved the same CI scores.<br />
# BD FEATURES The number of biodiversity features found per protected area is based on the mapped distributions ofall 340 bio<br />
diversity features.<br />
# UNIQUE FEATURES The number of biodiversity features within a PA that are found in NO other PAs.<br />
SUM OF PERCENTAGE Each biodiversity feature found within a PA makes a percentage contribution to its target (e.g. 100%<br />
CONTRIBUTIONS means a target is fully achieved within a PA). The figure in this column is the SUM of the contributions of<br />
all features to their collective targets within the PA. If this number is a small number (e.g.
MPUMALANGA BIODIVERSITY CONSERVATION PLAN HANDBOOK<br />
Ax<br />
PROTECTED AREA NAME<br />
Tinnie Louw<br />
Vertroosting Nature Reserve<br />
Blyde River Canyon<br />
Kruger National Park<br />
Andover Nature Reserve<br />
Barberton Nature Reserve Phase 1<br />
De Bad Nature Reserve<br />
Jericho Dam Nature Reserve<br />
Kwaggavoetpad Nature Reserve<br />
Loskop Dam Nature Reserve<br />
Mabusa Nature Reserve<br />
Mahushe Shongwe NR<br />
Makobulaan Nature Reserve<br />
Mdala Nature Reserve<br />
Mkombo Nature Reserve<br />
Mount Anderson Catchm't NR<br />
Mountainlands Nature Reserve<br />
Moutse Nature Reserve<br />
Nelshoogte Nature Reserve<br />
Nooitgedacht Dam Nature Reserve<br />
Ohrigstad Dam NR<br />
Overvaal Nature Reserve<br />
Paardeplaats Nature Reserve<br />
Scuinsdraai Nature Reserve<br />
Songimvelo Nature Reserve<br />
SS Skosana Nature Reserve<br />
Sterkspruit Nature Reserve<br />
Verloren Valei Nature Reserve<br />
Witbad Nature Reserve<br />
DATA SUMMARY OF FORMAL AND INFORMAL PROTECTED AREAS<br />
National Park<br />
National Park<br />
TYPE OF<br />
PROTECTED AREA<br />
MTPA Flora Reserve<br />
MTPA Flora Reserve<br />
Provincial Nature Reserve<br />
Provincial Nature Reserve<br />
Provincial Nature Reserve<br />
Provincial Nature Reserve<br />
Provincial Nature Reserve<br />
Provincial Nature Reserve<br />
Provincial Nature Reserve<br />
Provincial Nature Reserve<br />
Provincial Nature Reserve<br />
Provincial Nature Reserve<br />
Provincial Nature Reserve<br />
Provincial Nature Reserve<br />
Provincial Nature Reserve<br />
Provincial Nature Reserve<br />
Provincial Nature Reserve<br />
Provincial Nature Reserve<br />
Provincial Nature Reserve<br />
Provincial Nature Reserve<br />
Provincial Nature Reserve<br />
Provincial Nature Reserve<br />
Provincial Nature Reserve<br />
Provincial Nature Reserve<br />
Provincial Nature Reserve<br />
Provincial Nature Reserve<br />
Provincial Nature Reserve<br />
SIZE IN<br />
HECTARES<br />
9.2<br />
32.00<br />
53795.2<br />
914848.0<br />
3231.2<br />
2424.8<br />
16.0<br />
1915.9<br />
7242.7<br />
22922.8<br />
10339.1<br />
1139.7<br />
1082.5<br />
8204.5<br />
11255.5<br />
13478.3<br />
16685.5<br />
1551.3<br />
279.6<br />
2986.7<br />
2507.9<br />
401.0<br />
2403.5<br />
7838.1<br />
49045.5<br />
1939.7<br />
2337.5<br />
5990.2<br />
1078.4<br />
CONSERVATION<br />
IMPORTANCE<br />
0.000<br />
0.500<br />
0.573<br />
0.028<br />
0.000<br />
0.103<br />
0.000<br />
0.000<br />
0.035<br />
0.012<br />
0.000<br />
0.000<br />
0.429<br />
0.000<br />
0.000<br />
0.130<br />
0.597<br />
0.000<br />
0.000<br />
0.419<br />
0.029<br />
0.000<br />
0.528<br />
0.000<br />
0.412<br />
0.000<br />
0.282<br />
1.000<br />
0.000<br />
RANK<br />
100<br />
32<br />
24<br />
92<br />
100<br />
76<br />
100<br />
100<br />
88<br />
97<br />
100<br />
100<br />
40<br />
100<br />
100<br />
73<br />
23<br />
100<br />
100<br />
43<br />
90<br />
100<br />
29<br />
100<br />
45<br />
100<br />
60<br />
1<br />
100<br />
BD<br />
FEATURES<br />
13<br />
7<br />
79<br />
41<br />
6<br />
13<br />
3<br />
9<br />
8<br />
12<br />
6<br />
5<br />
19<br />
6<br />
6<br />
25<br />
33<br />
6<br />
9<br />
14<br />
13<br />
6<br />
24<br />
3<br />
50<br />
7<br />
22<br />
36<br />
7<br />
UNIQUE<br />
FEATURES<br />
0<br />
0<br />
20<br />
15<br />
0<br />
0<br />
0<br />
0<br />
0<br />
1<br />
0<br />
0<br />
0<br />
0<br />
1<br />
1<br />
2<br />
0<br />
0<br />
0<br />
0<br />
0<br />
1<br />
0<br />
11<br />
0<br />
1<br />
2<br />
0<br />
SUM OF<br />
PERCENTAGE<br />
CONTRIBUTIONS<br />
Not assessed<br />
40.47<br />
9450.06<br />
115093.80<br />
84.71<br />
149.37<br />
0.08<br />
10.73<br />
1172.90<br />
3230.72<br />
3165.73<br />
617.70<br />
184.55<br />
1486.25<br />
321.50<br />
904.74<br />
270339.63<br />
309.14<br />
14.22<br />
143.26<br />
83.32<br />
6.85<br />
12539.84<br />
10.03<br />
4314.51<br />
449.04<br />
485.00<br />
22059.81<br />
8.20<br />
continued overleaf
APPENDIX 3 - DATA SUMMARY OF FORMAL AND INFORMAL PROTECTED AREAS<br />
Ossewakop Leased Area 726.0 0.500 32 19 0 223.67<br />
Wakkerstroom Campsite/Martin's Dam<br />
Wakkerstroom Wetland NR<br />
Barberton Nature Reserve A<br />
Gustav Klingbiel Nature Reserve<br />
Witbank Nature Reserve<br />
Buffelskloof Private NR<br />
Dumaneni Reserve<br />
K'Shani Private Game Reserve<br />
Ligwalagwala Cooperative NR<br />
Morgenstond Dam Nature Reserve<br />
Mt Anderson Properties<br />
Nkomazi Wilderness<br />
Sabi Sabi Game Reserve<br />
Sabie Sand Game Reserve<br />
Sterkspruit Private NR<br />
Tullach-Mohr/Elands Valley<br />
Zemvelo Game Reserve<br />
Amsterdam<br />
Athole/Amsterdam<br />
Bankenveld<br />
Baltrasna<br />
Balule<br />
Bloukop<br />
Blouswaelvlakte/Elands Valley<br />
Bronberg<br />
Brondal<br />
PROTECTED AREA NAME<br />
Crane Creek Farm/Elands Valley<br />
DATA SUMMARY OF FORMAL AND INFORMAL PROTECTED AREAS<br />
Leased Area<br />
Leased Area<br />
Municipal Nature Reserve<br />
Municipal Nature Reserve<br />
Municipal Nature Reserve<br />
Private Nature Reserve<br />
Private Nature Reserve<br />
Private Game Reserve<br />
Private Nature Reserve<br />
Private Nature Reserve<br />
Private Nature Reserve<br />
Private Nature Reserve<br />
Private Game Reserve<br />
Private Game Reserve<br />
Private Nature Reserve<br />
Private Nature Reserve / Cons<br />
Private Game Reserve<br />
Conservancy<br />
SA Nat Heritage Site/ Cons.<br />
Conservancy<br />
Conservancy<br />
Conservancy<br />
Conservancy<br />
SA Nat Heritage Site/ Cons.<br />
Conservancy<br />
Conservancy<br />
TYPE OF<br />
PROTECTED AREA<br />
SA Nat Heritage Site/ Cons.<br />
SIZE IN<br />
HECTARES<br />
90.1<br />
633.3<br />
350.1<br />
2219.7<br />
889.8<br />
1457.4<br />
2664.7<br />
2245.3<br />
12640.1<br />
2181.9<br />
1284.6<br />
17641.9<br />
7712.8<br />
77257.1<br />
825.3<br />
771.5<br />
7491.1<br />
31866.6<br />
4584.4<br />
642.0<br />
39786.7<br />
900.6<br />
6665.1<br />
426.0<br />
270.8<br />
9062.9<br />
225.9<br />
CONSERVATION<br />
IMPORTANCE<br />
1.000<br />
1.000<br />
0.556<br />
0.067<br />
0.000<br />
0.294<br />
0.514<br />
0.000<br />
0.029<br />
0.000<br />
0.409<br />
0.066<br />
0.000<br />
0.000<br />
0.000<br />
0.059<br />
0.011<br />
0.008<br />
0.000<br />
0.000<br />
0.374<br />
0.000<br />
0.000<br />
1.000<br />
0.000<br />
0.027<br />
0.000<br />
RANK<br />
1<br />
1<br />
26<br />
81<br />
100<br />
58<br />
31<br />
100<br />
91<br />
100<br />
47<br />
82<br />
100<br />
100<br />
100<br />
85<br />
98<br />
99<br />
100<br />
100<br />
52<br />
100<br />
100<br />
1<br />
100<br />
94<br />
100<br />
BD<br />
FEATURES<br />
10<br />
16<br />
18<br />
15<br />
2<br />
18<br />
17<br />
9<br />
18<br />
6<br />
26<br />
17<br />
6<br />
21<br />
9<br />
11<br />
10<br />
15<br />
10<br />
26<br />
6<br />
3<br />
9<br />
16<br />
3<br />
15<br />
10<br />
UNIQUE<br />
FEATURES<br />
0<br />
0<br />
0<br />
1<br />
0<br />
2<br />
0<br />
0<br />
1<br />
0<br />
2<br />
0<br />
0<br />
0<br />
0<br />
0<br />
1<br />
1<br />
0<br />
0<br />
0<br />
0<br />
0<br />
0<br />
0<br />
0<br />
0<br />
SUM OF<br />
PERCENTAGE<br />
CONTRIBUTIONS<br />
4.51<br />
11361.13<br />
139.55<br />
2022.35<br />
Not assessed<br />
167.10<br />
275.50<br />
259.31<br />
1499.87<br />
0.84<br />
552.94<br />
272.58<br />
1906.04<br />
14076.86<br />
29.61<br />
59.50<br />
1420.68<br />
659.08<br />
51.31<br />
579.67<br />
3.91<br />
2.60<br />
6.69<br />
34.68<br />
1.94<br />
1169.48<br />
4.68<br />
continued overleaf<br />
Axi<br />
APPENDIX
MPUMALANGA BIODIVERSITY CONSERVATION PLAN HANDBOOK<br />
Axii<br />
De Berg<br />
De Kaap Valley<br />
Elands Valley<br />
Goedgelegen<br />
Hazyview-Kiepersol<br />
Jock of the Bushveld<br />
Kaalbooi/Elands Valley<br />
Kalmoesfontein/Kwena Basin<br />
Klipkop<br />
Kwena Basin<br />
Marlothii Urban Conservancy<br />
Mbobo Mkhulu Cave/Elands Valley<br />
Mhlambanyathi/Goedgelegen<br />
Mhlangampisi<br />
Mhlongamvula/Mhlangampisi<br />
Mooibron/Mhlangampisi<br />
Mount Carmel<br />
Mshonamien/Elands Valley<br />
Ngwempisi<br />
Nu Scotland<br />
Olifants Gorge<br />
Reitvaal<br />
Rooikraal/Mhlangimpisi<br />
Smuts Farm<br />
Spinnekop/Elands Valley<br />
Suikerboschkop/Goedgelegen<br />
Tonteldoos<br />
PROTECTED AREA NAME<br />
Waterval/Kwena Basin<br />
DATA SUMMARY OF FORMAL AND INFORMAL PROTECTED AREAS<br />
Conservancy<br />
Conservancy<br />
Conservancy<br />
Conservancy<br />
Conservancy<br />
Conservancy<br />
SA Nat Heritage Site/ Cons.<br />
SA Nat Heritage Site/ Cons.<br />
Conservancy<br />
Conservancy<br />
Conservancy<br />
SA Nat Heritage Site/ Cons.<br />
SA Nat Heritage Site/ Cons.<br />
Conservancy<br />
SA Nat Heritage Site/ Cons.<br />
SA Nat Heritage Site/ Cons.<br />
Conservancy<br />
SA Nat Heritage Site/ Cons.<br />
Conservancy<br />
Conservancy<br />
Conservancy<br />
Conservancy<br />
SA Nat Heritage Site/ Cons.<br />
Conservancy<br />
SA Nat Heritage Site/ Cons.<br />
SA Nat Heritage Site/ Cons.<br />
Conservancy<br />
TYPE OF<br />
PROTECTED AREA<br />
SA Nat Heritage Site/ Cons.<br />
SIZE IN<br />
HECTARES<br />
40778.3<br />
4081.3<br />
92501.3<br />
12573.5<br />
28335.2<br />
4608.7<br />
385.7<br />
684.7<br />
670.0<br />
48553.9<br />
1615.3<br />
839.9<br />
1004.7<br />
34603.7<br />
1579.2<br />
5460.8<br />
5408.1<br />
144.8<br />
16998.5<br />
15793.6<br />
10134.3<br />
13181.9<br />
1692.9<br />
212.2<br />
257.4<br />
1351.3<br />
4041.8<br />
1095.3<br />
CONSERVATION<br />
IMPORTANCE<br />
0.151<br />
0.263<br />
0.115<br />
0.185<br />
0.030<br />
0.000<br />
0.667<br />
0.333<br />
0.000<br />
0.132<br />
0.000<br />
0.143<br />
0.000<br />
0.416<br />
0.571<br />
0.846<br />
0.085<br />
0.000<br />
0.062<br />
0.000<br />
0.045<br />
0.000<br />
0.333<br />
0.000<br />
0.500<br />
0.000<br />
0.250<br />
1.000<br />
RANK<br />
69<br />
62<br />
74<br />
67<br />
89<br />
100<br />
20<br />
53<br />
100<br />
72<br />
100<br />
70<br />
100<br />
44<br />
25<br />
16<br />
78<br />
1<br />
84<br />
100<br />
87<br />
100<br />
53<br />
100<br />
32<br />
100<br />
63<br />
1<br />
BD<br />
FEATURES<br />
38<br />
18<br />
47<br />
26<br />
14<br />
9<br />
10<br />
9<br />
4<br />
23<br />
6<br />
12<br />
13<br />
34<br />
16<br />
31<br />
17<br />
12<br />
20<br />
14<br />
9<br />
11<br />
13<br />
1<br />
17<br />
8<br />
16<br />
15<br />
UNIQUE<br />
FEATURES<br />
6<br />
0<br />
1<br />
0<br />
1<br />
0<br />
0<br />
0<br />
0<br />
0<br />
0<br />
0<br />
0<br />
1<br />
0<br />
0<br />
0<br />
0<br />
0<br />
0<br />
0<br />
0<br />
0<br />
1<br />
0<br />
0<br />
0<br />
0<br />
SUM OF<br />
PERCENTAGE<br />
CONTRIBUTIONS<br />
Crocriver Mountain Conservancy 36410.7 0.238 66 26 0 8251.88<br />
2186.25<br />
737.62<br />
3633.66<br />
408.32<br />
3448.14<br />
517.85<br />
12.94<br />
15.95<br />
12.38<br />
415.35<br />
65.83<br />
77.72<br />
6.03<br />
1159.96<br />
73.96<br />
554.64<br />
404.17<br />
8.48<br />
232.97<br />
130.92<br />
51.36<br />
32.88<br />
67.6<br />
9.41<br />
212.02<br />
3.38<br />
47.7<br />
42.1<br />
continued overleaf
De Hoop 886 KS<br />
Belfast Vlei<br />
Boondocks<br />
Bossie<br />
Burgersfort<br />
Confidence<br />
Cwantalala<br />
Daisy Kopje<br />
Doornkop<br />
Driekop Caves<br />
Duiker Creek Catchment<br />
E.T.T.C. Nature Reserve<br />
Grootvlei<br />
Hall Nature Reserve<br />
Holkranse<br />
In-De-Diepte Reserve<br />
Inhlaba<br />
Kalkoenvlakte<br />
Kalmoesfontein<br />
Kaapsehoop<br />
Kempshoogte<br />
Kombewaria<br />
Kransbank<br />
Kudushoek<br />
Langfontein<br />
London Nature Reserve<br />
Mbesan<br />
PROTECTED AREA NAME<br />
Misty Mountain<br />
APPENDIX 3 - DATA SUMMARY OF FORMAL AND INFORMAL PROTECTED AREAS<br />
DATA SUMMARY OF FORMAL AND INFORMAL PROTECTED AREAS<br />
TYPE OF<br />
PROTECTED AREA<br />
De Hoop Potential Reserve<br />
SA Nat Heritage Site<br />
SA Nat Heritage Site<br />
SA Nat Heritage Site<br />
SA Nat Heritage Site<br />
SA Nat Heritage Site<br />
SA Nat Heritage Site<br />
SA Nat Heritage Site<br />
SA Nat Heritage Site<br />
SA Nat Heritage Site<br />
SA Nat Heritage Site<br />
SA Nat Heritage Site<br />
SA Nat Heritage Site<br />
SA Nat Heritage Site<br />
SA Nat Heritage Site<br />
SA Nat Heritage Site<br />
SA Nat Heritage Site<br />
SA Nat Heritage Site<br />
SA Nat Heritage Site<br />
SA Nat Heritage Site<br />
SA Nat Heritage Site<br />
SA Nat Heritage Site<br />
SA Nat Heritage Site<br />
SA Nat Heritage Site<br />
SA Nat Heritage Site<br />
SA Nat Heritage Site<br />
SA Nat Heritage Site<br />
SA Nat Heritage Site<br />
SIZE IN<br />
HECTARES<br />
12821.1<br />
1246.0<br />
2695.7<br />
816.4<br />
15322.7<br />
235.4<br />
3406.3<br />
254.3<br />
2702.0<br />
3060.6<br />
436.0<br />
915.3<br />
577.7<br />
377.1<br />
4567.0<br />
4234.7<br />
111.3<br />
116.4<br />
202.3<br />
978.1<br />
126.8<br />
3099.3<br />
840.2<br />
1085.1<br />
2826.8<br />
4131.3<br />
1859.8<br />
215.1<br />
CONSERVATION<br />
IMPORTANCE<br />
0.028<br />
0.500<br />
0.143<br />
0.000<br />
0.015<br />
0.000<br />
0.621<br />
0.000<br />
0.600<br />
0.727<br />
0.000<br />
0.000<br />
0.000<br />
0.000<br />
0.000<br />
0.419<br />
0.000<br />
0.000<br />
1.000<br />
0.429<br />
0.500<br />
0.519<br />
1.000<br />
0.000<br />
0.696<br />
0.324<br />
0.063<br />
NA<br />
RANK<br />
93<br />
32<br />
70<br />
100<br />
95<br />
100<br />
21<br />
100<br />
22<br />
17<br />
100<br />
100<br />
100<br />
100<br />
100<br />
42<br />
100<br />
100<br />
1<br />
40<br />
32<br />
30<br />
1<br />
100<br />
19<br />
57<br />
83<br />
100<br />
BD<br />
FEATURES<br />
12<br />
14<br />
14<br />
10<br />
11<br />
4<br />
17<br />
3<br />
6<br />
20<br />
11<br />
11<br />
5<br />
7<br />
10<br />
18<br />
3<br />
5<br />
8<br />
9<br />
10<br />
18<br />
7<br />
13<br />
21<br />
20<br />
10<br />
6<br />
UNIQUE<br />
FEATURES<br />
0<br />
0<br />
0<br />
0<br />
2<br />
0<br />
1<br />
0<br />
0<br />
0<br />
0<br />
0<br />
0<br />
0<br />
0<br />
0<br />
0<br />
0<br />
0<br />
0<br />
0<br />
0<br />
0<br />
0<br />
0<br />
0<br />
0<br />
0<br />
SUM OF<br />
PERCENTAGE<br />
CONTRIBUTIONS<br />
882.82<br />
38.77<br />
330.54<br />
5.18<br />
129/.13<br />
0.68<br />
562.28<br />
0.51<br />
24.24<br />
95.22<br />
17.17<br />
14.27<br />
0.29<br />
69.25<br />
13.57<br />
47.57<br />
11.56<br />
1<br />
5.64<br />
8.38<br />
62.09<br />
188.02<br />
10.29<br />
15.62<br />
266.64<br />
361.63<br />
88.71<br />
Not assessed<br />
continued overleaf<br />
Axiii<br />
APPENDIX
MPUMALANGA BIODIVERSITY CONSERVATION PLAN HANDBOOK<br />
Mokobulaan<br />
Mondi Cycad Reserve<br />
Mondi Indigenous Forest<br />
Mondi Tree Fern Reserve<br />
Mooibron<br />
Mooifontein<br />
Mount Sheba Nature Reserve<br />
Oshoek<br />
Oudehoutdraai<br />
Poplar Creek<br />
Sudwala Rainforest<br />
Tafelkop<br />
Theespruit<br />
Venus<br />
Alexandria 707 JT<br />
Clermont 414 KT<br />
Dientjie 453 K<br />
Doornfontein 98 JS<br />
Doornnek 88 JS<br />
Elandsdoorn 56 JS<br />
Elandsfontein 435 KT<br />
Langkloof 229 JS<br />
Leeuwfontein 228 JS<br />
Lisbon 531 KT<br />
Morgenzon 525 KT<br />
Pilgrim's Rest<br />
Rietvaly 547 KT<br />
Stroomwater 96 JS<br />
Stukje 55 JS<br />
PROTECTED AREA NAME<br />
Wakkersdal 436<br />
DATA SUMMARY OF FORMAL AND INFORMAL PROTECTED AREAS<br />
TYPE OF<br />
PROTECTED AREA<br />
SA Nat Heritage Site<br />
SA Nat Heritage Site<br />
SA Nat Heritage Site<br />
SA Nat Heritage Site<br />
SA Nat Heritage Site<br />
SA Nat Heritage Site<br />
SA Nat Heritage Site<br />
SA Nat Heritage Site<br />
SA Nat Heritage Site<br />
SA Nat Heritage Site<br />
SA Nat Heritage Site<br />
SA Nat Heritage Site<br />
SA Nat Heritage Site<br />
SA Nat Heritage Site<br />
Untransformed state land<br />
Untransformed state land<br />
Untransformed state land<br />
Untransformed state land<br />
Untransformed state land<br />
Untransformed state land<br />
Untransformed state land<br />
Untransformed state land<br />
Untransformed state land<br />
Untransformed state land<br />
Untransformed state land<br />
Untransformed state land<br />
Untransformed state land<br />
Untransformed state land<br />
Untransformed state land<br />
Untransformed state land<br />
SIZE IN<br />
HECTARES<br />
6200.7<br />
4050.3<br />
3114.4<br />
72.7<br />
969.2<br />
2077.8<br />
1721.7<br />
1734.5<br />
1984.6<br />
489.2<br />
244.6<br />
1207.0<br />
11429.1<br />
402.7<br />
551.7<br />
927.8<br />
1448.6<br />
1134.7<br />
1844.5<br />
2556.6<br />
5671.1<br />
1213.6<br />
2245.0<br />
1493.7<br />
634.1<br />
2144.4<br />
35.3<br />
1182.0<br />
69.5<br />
2093.7<br />
CONSERVATION<br />
IMPORTANCE<br />
0.333<br />
0.000<br />
0.250<br />
0.000<br />
1.000<br />
0.167<br />
0.538<br />
0.105<br />
0.278<br />
0.000<br />
1.000<br />
0.909<br />
0.014<br />
1.000<br />
1.000<br />
0.000<br />
0.250<br />
0.000<br />
0.000<br />
0.000<br />
0.400<br />
0.000<br />
0.000<br />
0.375<br />
0.286<br />
0.529<br />
0.000<br />
0.000<br />
0.000<br />
0.375<br />
RANK<br />
53<br />
100<br />
63<br />
100<br />
1<br />
68<br />
27<br />
75<br />
61<br />
100<br />
1<br />
15<br />
96<br />
1<br />
1<br />
100<br />
63<br />
100<br />
100<br />
100<br />
48<br />
100<br />
100<br />
50<br />
59<br />
28<br />
100<br />
100<br />
100<br />
50<br />
BD<br />
FEATURES<br />
30<br />
7<br />
30<br />
0<br />
23<br />
15<br />
12<br />
20<br />
21<br />
10<br />
11<br />
25<br />
16<br />
10<br />
14<br />
12<br />
10<br />
6<br />
6<br />
3<br />
18<br />
6<br />
4<br />
17<br />
13<br />
15<br />
4<br />
5<br />
4<br />
13<br />
UNIQUE<br />
FEATURES<br />
2<br />
0<br />
2<br />
0<br />
0<br />
0<br />
0<br />
1<br />
0<br />
0<br />
0<br />
0<br />
0<br />
0<br />
0<br />
0<br />
0<br />
0<br />
0<br />
0<br />
0<br />
0<br />
0<br />
0<br />
0<br />
0<br />
0<br />
0<br />
0<br />
0<br />
SUM OF<br />
PERCENTAGE<br />
CONTRIBUTIONS<br />
685.38<br />
5.72<br />
375.88<br />
Not assessed<br />
139.52<br />
112.32<br />
125.06<br />
503.46<br />
312.46<br />
44.5<br />
55.43<br />
471.25<br />
44.87<br />
45.49<br />
25.13<br />
154.96<br />
196.98<br />
2.62<br />
23.29<br />
1.20<br />
701.49<br />
2.84<br />
2.76<br />
77.53<br />
30.97<br />
295.51<br />
0.10<br />
2.33<br />
0.30<br />
277.39
GLOSSARY<br />
This glossary is not a comprehensive list of all technical and scientific terms used in the handbook.<br />
It focuses on those terms that may be interpreted differently by readers with varied backgrounds<br />
ALIEN INVASIVE SPECIES<br />
Any plant or animal species that has<br />
been introduced into South Africa<br />
and which has become naturalised,<br />
i.e. capable of reproducing and<br />
spreading without human assistance.<br />
In the case of plants, such species<br />
may establish in natural vegetation to<br />
the point of replacing it and destroying<br />
biodiversity and ecological functioning.<br />
The worst invader plants are required<br />
by law to be controlled on both<br />
private and state land.<br />
BIODIVERSITY<br />
The variability among all types of living<br />
organisms (animals, plants and<br />
microbes) including those from terrestrial,<br />
aquatic and marine ecosystems.<br />
The term is shorthand for biological<br />
diversity and includes diversity within<br />
species, between species and of<br />
ecosystems and other ecological<br />
complexes, of which all organisms are<br />
a part. It includes the full diversity of<br />
all genes, species and ecological<br />
communities and the ecological and<br />
evolutionary processes that sustain<br />
them.<br />
BIODIVERSITY FEATURE<br />
An element or unit of biodiversity, for<br />
which it is possible to set a quantitative<br />
target for active protection (or<br />
conservation or sustainable use) for<br />
example, a vegetation type, a rare<br />
species, or the spatial component of<br />
an ecological process.<br />
BIODIVERSITY ASSESSMENT<br />
The activity of analysing spatial data<br />
layers (geographic, biological and<br />
ecological) to identify options for<br />
meeting conservation targets for a<br />
range of biodiversity features.<br />
<strong>Biodiversity</strong> assessment should<br />
include the interpretation of the<br />
results of such analyses for a wide<br />
range of stakeholders.<br />
and in different contexts.<br />
BIODIVERSITY OFFSET<br />
An area legally set aside or acquired<br />
for conservation purposes, in<br />
exchange for the permitted destruction<br />
(by development) of a separate area<br />
of biodiversity of recognized value. If<br />
possible, the biodiversity value of the<br />
offset should be at least greater than<br />
that of the area destroyed and as similar<br />
as possible to it.<br />
BIODIVERSITY PLANNING<br />
<strong>Plan</strong>ning at various spatial scales to<br />
identify priority areas for biodiversity<br />
conservation, taking into account<br />
patterns of biodiversity (the principle<br />
of representation) and the ecological<br />
and evolutionary processes that<br />
sustain them (the principle of persistence).<br />
<strong>Biodiversity</strong> planning includes<br />
biodiversity assessment and the<br />
subsequent production of an implementation<br />
strategy and action plan.<br />
BIODIVERSITY TARGET<br />
The quantity of a biodiversity feature,<br />
based on the best scientific knowledge<br />
available, that is an estimate of the<br />
amount of the feature needed to<br />
ensure its vitality and survival in the<br />
long term. This applies to both<br />
‘pattern’ features (e.g. species) and<br />
‘process’ features (e.g. movement) at<br />
various scales. Targets are expressed<br />
as, for example, an area of land or a<br />
number of breeding individuals of a<br />
threatened species.<br />
BIOME<br />
A major ecological community of<br />
organisms (species) usually characterised<br />
by a dominant vegetation type<br />
with which they are associated.<br />
National scale ecological assessment<br />
has led to the classification of eleven<br />
biomes in southern Africa:- desert,<br />
succulent Karoo, fynbos, Nama-<br />
Karoo, grassland, savanna, Indian<br />
Ocean coastal belt, Albany thicket,<br />
forest, and the two island biomes of<br />
sub-Antarctic tundra and polar desert.<br />
BIOREGION<br />
The <strong>Biodiversity</strong> Act defines a bioregion<br />
as a region that ‘contains<br />
whole or several nested ecosystems<br />
and is characterised by its landforms,<br />
vegetation cover, human culture and<br />
history’. The Act further provides for<br />
the publication of Bioregional <strong>Plan</strong>s<br />
for such areas. These <strong>Plan</strong>s should be<br />
spatially delimited to match the nearest<br />
local or district municipal boundaries,<br />
or to provincial boundaries.<br />
BIOREGIONAL PLAN<br />
A bioregional plan should be seen<br />
primarily as a tool for guiding land<br />
and resource-use planning and<br />
decision- making by the full range of<br />
sectors whose policies and decisions<br />
impact on biodiversity, so that biodiversity<br />
priorities and sustainable<br />
management of natural resources are<br />
taken into account in medium- to<br />
long-term planning, and in day-today<br />
decision-making in all of these<br />
sectors.<br />
BIOTA<br />
A general collective term for all living<br />
things in a specific region.<br />
CONNECTIVITY<br />
The ecological connectedness of the<br />
pattern of habitats and distribution of<br />
species within a particular area. High<br />
connectivity facilitates the free<br />
movement of individuals and species.<br />
Habitats that are fragmented by<br />
development, present obstacles to<br />
biological movement and reduced<br />
connectivity in proportion to the<br />
intensity and type of development.<br />
CONSERVATION AREA<br />
A defined area where conservation of<br />
important biodiversity is needed in<br />
GLOSSARY<br />
Axv<br />
GLOSSARY
MPUMALANGA BIODIVERSITY CONSERVATION PLAN HANDBOOK<br />
Axvi<br />
order to ensure sustainable benefits.<br />
In this handbook this refers to areas<br />
outside the formal protected area<br />
network.<br />
CONSERVANCY<br />
A usually contiguous, privately owned<br />
land area (including water) linked by<br />
voluntary agreement between participating<br />
owners, to cooperate in<br />
protecting aspects of their shared<br />
natural resources, including wildlife,<br />
biodiversity and landscapes.<br />
DEFOLIATION<br />
The periodic loss of most of the<br />
leaves from a live plant, which are<br />
normally replaced through seasonal<br />
regrowth. Many plant species,<br />
especially shrubs, grasses and<br />
herbaceous plants, are well adapted<br />
to regular defoliation, total or partial.<br />
Defoliation takes place by means of<br />
grazing, fire, frost, hail, drought and<br />
human harvesting.<br />
ECOLOGICAL RESERVE<br />
(water flow in rivers)<br />
The quality and quantity of water<br />
flow required in a river to allow it to<br />
function ecologically and its aquatic<br />
biodiversity to persist. This minimum<br />
flow must also be sufficient to meet<br />
basic human needs and to secure<br />
ecologically sustainable development<br />
in terms of the National Water Act.<br />
ECOLOGICAL<br />
(and evolutionary) processes<br />
These are the processes that operate<br />
to generate and maintain biodiversity.<br />
Ecological drivers of change operate<br />
over relatively short time scales, while<br />
evolutionary processes operate over<br />
much longer time scales. <strong>Biodiversity</strong><br />
assessment includes mapping and<br />
setting targets for the spatial<br />
components of these processes,<br />
namely the areas of land or water<br />
required to ensure the processes<br />
continue to function. For examples<br />
see Box on page 17.<br />
ECOREGION LEVEL 2<br />
A river classification that is based on<br />
the premise that ecosystems and their<br />
components display repeating regional<br />
patterns. These exist in varied combinations<br />
of causal factors such as<br />
climate, mineral availability (soils and<br />
geology), vegetation and physiography.<br />
This classification is expert<br />
based and the purpose is to identify<br />
regions of relative homogeneity in<br />
ecological characteristics or in<br />
relationships between organisms and<br />
their environments.<br />
ECOSYSTEM<br />
A dynamic complex of plant, animal<br />
and microorganism communities and<br />
their nonliving environment, interacting<br />
as a functional unit.<br />
ECOSYSTEM SERVICES<br />
The goods and services provided to<br />
society by well functioning ecosystems,<br />
such as food, clean water, carbon<br />
storage, climate regulation, disease<br />
management, spiritual fulfillment and<br />
aesthetic enjoyment.<br />
ENDEMIC SPECIES<br />
A plant or animal species, naturally<br />
confined to or exclusive to, a specified<br />
habitat or geographic area.<br />
HABITAT LOSS<br />
Loss of natural habitat occurs with<br />
most forms of development. It is<br />
sometimes referred to as habitat<br />
transformation. Habitat loss may be<br />
irreversible, meaning that biodiversity<br />
patterns and processes can never be<br />
restored, such as with urban development,<br />
crop agriculture and most<br />
forms of mining. In other cases,<br />
habitat loss is more-or-less reversible,<br />
meaning that local biodiversity<br />
features may be restored to some<br />
extent. For example, overgrazed veld<br />
in some ecosystems can recover if the<br />
grazers are reduced and managed.<br />
Habitat loss in South Africa, as well as<br />
world-wide, is the single biggest<br />
cause of biodiversity loss. Halting<br />
biodiversity loss depends on avoiding<br />
habitat loss in areas that are important<br />
for achieving biodiversity targets<br />
and slowing the rate of loss in all<br />
other areas.<br />
INTEGRITY<br />
(ecological)<br />
The integrity of an ecosystem refers<br />
to its functional completeness,<br />
including its components (species) its<br />
patterns (distribution) and its processes<br />
(see above).<br />
LANDSCAPE SCALE<br />
Large scale applications of a concept<br />
or a characteristic at the level of<br />
geographic landscape units, such as a<br />
mountain range, a valley, foothill<br />
formations or a plateau.<br />
MAINSTREAMING<br />
The integration of an understanding<br />
of biodiversity and the functioning of<br />
ecosystems into all human activities<br />
at all levels of organization in society.<br />
In particular the integration of biodiversity<br />
values into land-use<br />
planning and decision making within<br />
structures of Local Government at all<br />
levels.<br />
PROTECTED AREA<br />
The IUCN defines a protected area as<br />
an area of land and/or sea especially<br />
dedicated to the protection and<br />
maintenance of biological diversity<br />
and of natural and associated cultural<br />
resources, and managed through legal<br />
or other effective means. This<br />
implies an area of natural or seminatural<br />
habitat with some form of<br />
conservation management that is<br />
secure for the foreseeable future. A<br />
protected area does not need to be<br />
owned by the state.<br />
QUATERNARY CATCHMENT<br />
A subdivision of a broader catchment<br />
classification system. A catchment<br />
includes all the land area from<br />
mountain top to seashore which is<br />
drained by a single river and its<br />
tributaries. Each catchment is then<br />
subdivided into secondary catch-
ments, which, in turn, have been<br />
divided into tertiary catchments.<br />
Finally, all tertiary catchments have<br />
been divided into quaternary catchments.<br />
A total of 1 946 quaternary<br />
catchments have been identified for<br />
South Africa. These quaternary<br />
catchments are the finest unit used<br />
by DWAF in its ecological studies.<br />
REFUGIA<br />
Localities or habitat patches that<br />
become isolated by natural or<br />
man-induced processes and provide,<br />
(usually temporary), refuges for one<br />
or more threatened species.<br />
STEWARDSHIP<br />
A formalised programme of land care,<br />
usually between a State agency for<br />
conserving biodiversity and/or the<br />
environment, and private landowners.<br />
The programme usually involves<br />
mutual incentives to achieve conservation<br />
of natural resources, often<br />
including economic benefits derived<br />
from the use of natural habitats for<br />
their material resources and for<br />
tourism.<br />
SUBCATCHMENT<br />
A subdivision of a quaternary catchment<br />
based on GIS modelling<br />
procedures, using runoff and digital<br />
elevation models to derive these as<br />
planning units for aquatic assessment.<br />
It is at a finer scale than, and nested<br />
within quaternary catchments.<br />
SUSTAINABLE DEVELOPMENT<br />
Integration of social, economic and<br />
environmental factors into planning,<br />
decision making and implementation,<br />
to ensure that development is<br />
balanced to serve the needs of<br />
present and future generations.<br />
THREATENED<br />
(biodiversity features)<br />
Threatened biodiversity features are<br />
those considered to be ‘critically<br />
endangered’, ‘endangered’ or<br />
‘vulnerable’ in terms of standard<br />
IUCN definitions of conservation<br />
status. Such species, ecosystems or<br />
ecological processes are referred to<br />
collectively and individually as<br />
‘threatened’.<br />
GLOSSARY<br />
Axvii<br />
GLOSSARY
MPUMALANGA BIODIVERSITY CONSERVATION PLAN HANDBOOK<br />
Axviii<br />
REFERENCES AND FURTHER READING<br />
Botha, M. 2001. Incentives for conservation on private land: Options and opportunities. Botanical Society<br />
Cape <strong>Conservation</strong> Unit Summary Report 02/2001. Cape Town, South Africa.<br />
DEAT, 2005. South Africa's National <strong>Biodiversity</strong> Strategy and Action <strong>Plan</strong>. www.deat.gov.za.<br />
Driver, A., Cowling, R. M., & Maze K., 2003. <strong>Plan</strong>ning for Living Landscapes: Perspectives and Lessons<br />
from South Africa. 45pp. www.botanicalsociety.org.za.<br />
Driver, A., Maze, K., Rouget, M., Lombard, A.T., Nel, J., Turpie, J.K., Cowling, R.M., Desmet, P., Goodman,<br />
P., Harris, J., Jonas, Z., Reyers, B., Sink, K. & Strauss, T. (2005). National Spatial <strong>Biodiversity</strong><br />
Assessment 2004: priorities for biodiversity conservation in South Africa. Strelitzia 17. South<br />
African National <strong>Biodiversity</strong> Institute, Pretoria. 45pp. www.<strong>sanbi</strong>.org.<br />
Kleynhans, C. J. 2000. Desktop estimates of the Ecological importance and Sensitivity categories (EISC),<br />
Default Ecological Management Classes (DEMC), Present Ecological Status Categories (PESC),<br />
present Attainable Ecological Management Classes (present AEMC) and best Attainable Ecological<br />
Management Class (best AEMC) for quaternary catchments in South Africa. Draft DWAF report.<br />
Job, N and Driver, A. 2006. <strong>Biodiversity</strong> Priority Areas in Drakenstein Municipality. Supporting land-use<br />
planning and decision-making in threatened ecosystems and special habitats. Botanical Society of<br />
South Africa: <strong>Conservation</strong> Unit. Kirstenbosch. South Africa.<br />
Kleynhans, C. J., Thirion, C. & Moolman, J. 2005a. A Level I River Ecoregion classification System for South<br />
Africa, Lesotho and Swaziland. Report No. N/0000/00/REQ0104. Resource Quality Services,<br />
Department of Water Affairs and Forestry, Pretoria, South Africa.<br />
Kleynhans, C. J., Louw, M. D., Thirion, C., Rossouw, N. & Rowntree, K. 2005b. River Ecoclassification:<br />
Manual for Ecostatus determination, including detailed methods for Fish Assessment Index,<br />
Benthic Invertebrate Response Assessment Index, and Physico-chemical driver assessment index.<br />
Draft Report for training purposes. Department of Water Affairs and Forestry (DWAF).<br />
Lötter, M. C. & Ferrar, A. A. (2006) <strong>Mpumalanga</strong> <strong>Biodiversity</strong> <strong>Conservation</strong> <strong>Plan</strong> Map. <strong>Mpumalanga</strong> Parks<br />
Board, Nelspruit.<br />
Marneweck, G. C., Grundling, P. & Miller, J. L. 2001. Defining and classification of peat wetland ecoregions<br />
in South Africa. Wetland Consulting Services (Pty) Ltd. Report to the Institute for Soil,<br />
Climate and Water (ISCW), Agricultural Research Council for the Directorate for Land and<br />
Resources Management (DLRM), Department of Agriculture, Pretoria, South Africa.<br />
Margules, C. R. & Pressy, R. L. 2000. Systematic conservation planning. Nature, 405: 243-253.<br />
<strong>Mpumalanga</strong> DACE. 2003. 2003 <strong>Mpumalanga</strong> State of Environment Report. <strong>Mpumalanga</strong> Department of<br />
Agriculture, <strong>Conservation</strong> and Environment, Nelspruit.<br />
Mucina, L., Rutherford, M. C. & Powrie, L. W. 2005. Vegetation Map of South Africa, Lesotho and<br />
Swaziland. South African National <strong>Biodiversity</strong> Institute. ISBN 1-919976-22-1.<br />
O'Connor, T & Kuyler, P. 2005. Identifying compatible land uses for maintaining biodiversity integrity.<br />
National Grasslands Initiative. SANBI. Pretoria.<br />
Pressey, R.L. 1994. Ad Hoc Reservations: Forward or backward steps in developing representative reserves<br />
systems? <strong>Conservation</strong> Biology 8(3): 662-668.<br />
Pressey, R.L. 1999. Applications of irreplaceability analysis to planning and management problems. Parks<br />
9(1): 42-51.<br />
Rouget, M., Reyers, B., Jonas, Z., Desmet, P., Driver, A., Maze, K., Egoh, B., Cowling, R.M., Mucina, L. &<br />
Rutherford, M. 2004. South African National Spatial <strong>Biodiversity</strong> Assessment Technical Report.<br />
Volume 1: Terrestrial Component. South African National <strong>Biodiversity</strong> Institute, Pretoria.<br />
Roux, D., Nel, J. & MacKay, H. 2005. Cross sector policy objectives for conservation of South Africa's<br />
Freshwater <strong>Biodiversity</strong>. Discussion paper for Water Research Commission Project K8/642.<br />
Version 2.<br />
Schulze, R. E. 1997. South African Atlas of Agrohydrology and Climatology. Water Research Commission,<br />
Pretoria, Report, TT82/96.
MPUMALANGA BIODIVERSITY CONSERVATION PLAN HANDBOOK<br />
Hamilton-Fynch - KARL LANE: carpe@mweb.co.za