NFEPA Atlas 5.3_20111025_FINAL.indd - Biodiversity GIS - SANBI
NFEPA Atlas 5.3_20111025_FINAL.indd - Biodiversity GIS - SANBI
NFEPA Atlas 5.3_20111025_FINAL.indd - Biodiversity GIS - SANBI
- No tags were found...

You also want an ePaper? Increase the reach of your titles
YUMPU automatically turns print PDFs into web optimized ePapers that Google loves.
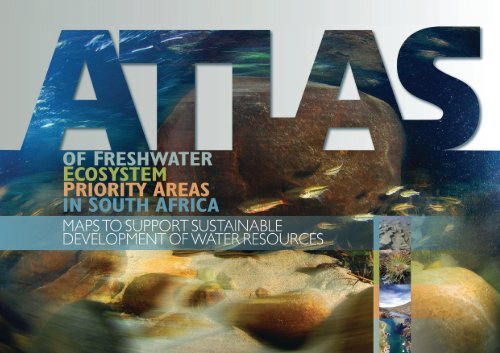
Front Cover: Clanwilliam and Fiery redfins in the RondegatRiver of Cederberg, South AfricaThe Rondegat River is a Freshwater Ecosystem Priority Area in the Olifants/DoornWater Management Area and an extremely important fish sanctuary. It is hometo five threatened fish species, including the Clanwilliam redfin and fiery redfin,both of which are endangered and found only in South Africa. Both species arehighly vulnerable to predation by alien bass and bluegill sunfish, as well as waterabstraction. Both species depend on the delivery of the correct amounts ofwater at the correct times of year for the adults to spawn and feed and for theiryoung to develop and grow. The Rondegat River runs through the CederbergWilderness Area which is managed by CapeNature.Photograph by: Thomas Peschak/WWF-SACover design by: Loretta Steyn Graphic Design StudioDisclaimerThis report has been reviewed by the Water Research Commission (WRC) andapproved for publication. Approval does not signify that the contents necessarilyreflect the views and policies of the WRC, nor does mention of trade names orcommercial products constitute endorsement or recommendation for use.FEPA maps are not guaranteed to be free from error or omission. Consequently,the authors and designers hold no responsibility for any inaccuracies or financialloss. The maps serve as the core freshwater biodiversity informant for waterresource planning and management at a primary to sub-quaternary catchmentscale. They provide context for decision making at the local and site scale;however, their application at this scale has limitations.
ATLASofFRESHWATER ECOSYSTEM PRIORITY AREASin South Africa:Maps to support sustainable development of water resourcesReport to theWater Research CommissionbyJL Nel, A Driver, WF Strydom, A Maherry, C Petersen, L Hill, DJ Roux, S Nienaber, H van Deventer, E Swartz and LB Smith-AdaoObtainable fromWater Research CommissionPrivate Bag X03GEZINA, 0031South Africaorders@wrc.org.zaWRC Report No. TT 500/11August 2011ISBN: 978-1-4312-0146-4Set No. 978-1-4312-0148-8Printed in the Republic of South Africa
AcknowledgementsThe development of this atlas emanates from a project jointly funded by the CSIR, SouthAfrican National <strong>Biodiversity</strong> Institute (<strong>SANBI</strong>), Water Research Commission, Department ofEnvironmental Affairs, Department of Water Affairs, Worldwide Fund for Nature (WWF), SouthAfrican Institute for Aquatic <strong>Biodiversity</strong> (SAIAB) and South African National Parks (SANParks).The WRC project (project no.K5/1810) was titled Identifying and Enabling Protection ofNational Freshwater Ecosystem Priority Areas for South Africa (or the ‘<strong>NFEPA</strong> project’). Thisatlas forms part of a series of three <strong>NFEPA</strong> reports to the Water Research Commission. Theother two reports in the series are the <strong>NFEPA</strong> Technical Report (WRC Report No. 1810/2/11)and the Implementation Manual for Freshwater Ecosystem Priorities areas (WRC Report No.1810/1/11). Enclosed at the back of this report is a DVD containing an electronic version of allthree WRC reports in the series, as well as <strong>GIS</strong> shapefiles and metadata for all <strong>NFEPA</strong> spatialdata layers, A3 PDFs of FEPA maps per Water Management Area, an open source map viewer,The content presented in this atlassummarises the data and on-the-groundknowledge of the freshwater ecologicalcommunity in South Africa, and representsover 1000 person years of experience.Dirk Roux Dirk Rouxand slide presentations on the <strong>NFEPA</strong> project.The development of this atlas was a collaborative effort between the CSIR, South AfricanNational <strong>Biodiversity</strong> Institute (<strong>SANBI</strong>), Water Research Commission, Department ofEnvironmental Affairs, Department of Water Affairs, Worldwide Fund for Nature (WWF), SouthAfrican Institute for Aquatic <strong>Biodiversity</strong> (SAIAB) and South African National Parks (SANParks).councils, several non-governmental organisations (NGOs) and private consultants. Thanksto all these workshop participants (full list of participants provided in Appendix A and B ofthe technical report).The following institutes/individuals are acknowledged for the contribution of their nationalThe content presented in this atlas summarises the data and on-the-ground knowledge ofthe freshwater ecology community in South Africa, and represents over 1000 person yearsof experience. Input data that informed the identification of priority areas were collatedand reviewed in a series of five regional expert workshops in May and June 2009. Resultingdraft priority areas were reviewed in a national stakeholder workshop in July 2010. Withoutexception those involved shared their data, knowledge and experience freely, making theproducts showcased in this atlas not only a consolidation of the best available sciencein freshwater biodiversity planning in South Africa but also an exceptional example ofcollaboration between scientists, managers and other users. Over 100 experts participatedin the input and review workshops, representing a range of stakeholders including: nationaldepartments of Water Affairs and Environmental Affairs, provincial conservation authorities,regional officials and catchment managers for the Department of Water Affairs, scientificDirk Rouxstrategic datasets: SAIAB and Albany Museum (fish data), Endangered Wildlife Trust (cranedata), National and Transvaal Museums (frog data), Animal Demography Unit and BirdLifeSouth Africa (waterbird data). Sub-national datasets were also supplied by Cape Actionfor People and the Environment (wetland delineations), Ezemvelo KwaZulu-Natal Wildlife(wetland delineations), Mpumalanga Tourism and Parks Agency (wetland delineationsand wetland features of conservation importance, and Nancy Job (wetlands for Overberg,Niewoudtville and Kamieskroon).A special thanks to Mark Graham, Wouter Groenewald, Mervyn Lotter, Gordon O’Brien,Francois Roux, Hermien Roux, Brian Sheer and Daan van der Merwe for insights into thefree-flowing river narratives used in the atlas. Thanks also to Pete Ashton and Alida Britzfor their review comments.Dirk RouxDirk RouxDirk Roux Pontso PakkiesNational workshop photographs- ii -
ForewordWater is the lifeblood of South Africa and influences every part of the economy andthe aspirations of our people. The availability of freshwater is a key enabler, and itsunavailability a major constraint, to the economic development of our country andthe well-being of our citizens. And, while most people think of water as coming simplyfrom a tap, or from a dam, the quantity, quality and timing of flows of these preciouswater resources are in fact shaped and controlled by the health of the ecosystemsthrough which they have passed. These ecosystems – our rivers, wetlands, lakes and pans– constitute irreplaceable natural infrastructure for water resource management, andhavens for our rich biodiversity.This atlas provides the first comprehensive assessment of our Freshwater EcosystemPriority Areas, or, in short, those areas of the country that are most important forsustaining the integrity and continued functioning of our freshwater ecosystems.There is no doubt that South Africa’s freshwater ecosystems are under increasingpressure. The recently completed National <strong>Biodiversity</strong> Assessment highlighted that 65%of wetland ecosystem types and 57% of river ecosystem types are already threatened.However, there are also examples of these ecosystems that are still in good condition,often the smaller tributaries. These healthy ecosystems are the lifeblood that replenishesand sustains the hard-working and heavily impacted larger rivers that underpin all oureconomic activities.The mandate for taking care of our freshwater ecosystems is shared between theDepartment of Water Affairs and the Department of Environment Affairs, as well astheir provincial and regional counterparts. Water is also important to a number of sisterdepartments including the Department of Agriculture, Forestry and Fisheries, and theDepartment of Mineral Resources. It is therefore essential that water is dealt with in anintegrated and cooperative manner across these key departments. This atlas provides uswith a unified product that will help to underpin such cooperative governance.The maps presented here, together with the Implementation Manual for FreshwaterEcosystem Priority Areas, will help greatly to ensure that healthy freshwater ecosystemscontinue to form the cornerstone of the implementation of our water resourceclassification system and the development of catchment management strategiesthroughout the country. They also inform planning and decisions about land use and theexpansion of the protected area network. By highlighting which ecosystems should remainin a healthy and well-functioning state, the maps provide a tool to guide our choices forthe strategic development of water resources and to support sustainable development.The atlas is also a remarkable, globally innovative product that all South Africans canbe proud of, drawing together the knowledge of our freshwater science community,as well as practitioners and water resource managers, whose collaboration forms thefoundation for the work presented here. For the first time this wealth of knowledge hasbeen consolidated into a single document, which helps to make excellent science accessible topolicymakers, managers and the public.I encourage you to use these maps in your work, and to work with all sectors of governmentto ensure that our priority rivers and wetlands are maintained in a healthy state, so that theycan continue to support the health and well-being of our people.Mrs Bomo Edith Edna MolewaMinister of Water and Environmental AffairsRepublic of South AfricaPeter Chadwick/WWF-SA- iii -
Table of ContentsPart 1:IntroductionPart 2:Freshwater Ecosystem Priority Area mapsfor Water Management AreasAcknowledgementsForewordBackground1.1 The importance of healthy ecosystems1.2 Guiding principles for managing freshwater ecosystems1.3 Major pressures on freshwater ecosystems1.4 Systematic biodiversity planning1.5 History of freshwater biodiversity planning in South Africa1.6 Planning at different scales2.1 Introduction to Freshwater Ecosystem Priority Area maps2.2 Categories on the Freshwater Ecosystem Priority Area maps2.3 Freshwater Ecosystem Priority Area maps for Water Management Areasiiiii12457910121415Part 3:National map productsPart 4:Data layers used for identifying FreshwaterEcosystem Priority Areas3.1 Density of FEPAs per Water Management Area3.2 Density of FEPAs per sub-Water Management Area3.3 Free-flowing rivers of South Africa3.4 Fish sanctuaries3.5 High water yield areas3.6 High groundwater recharge areas4.1 River ecosystem types4.2 River condition4.3 Wetland ecosystem types4.4 Wetland condition4.5 Landforms4.6 Wetland vegetation groups4.7 Priority estuariesReferencesAcronymsGlossary34363742444547515253545556575859Table of Contents - iv -
BackgroundThe National Freshwater EcosystemPriority Areas projectOther products of the National FreshwaterEcosystem Priority Areas projectSouth Africa’s freshwater ecosystems are diverse, ranging from sub-tropical in the northeasternpart of the country, to semi-arid and arid in the interior, to the cool and temperaterivers of the fynbos. Freshwater ecosystems refer to all inland water bodies whether freshor saline, including rivers, lakes, wetlands, sub-surface waters and estuaries. Consistentwith global trends, high levels of threat have been reported for freshwater ecosystems,with over half of the country’s river and wetland ecosystem types considered threatenedin the National <strong>Biodiversity</strong> Assessment 2011 (Nel et al. 2011). South Africa’s freshwaterfauna also display high levels of threat with at least one third of freshwater fish indigenousto South Africa reported as threatened, and a recent southern African study on theconservation status of major freshwater-dependent taxonomic groups (fishes, molluscs,dragonflies, crabs and vascular plants) reported far higher levels of threat in South Africathan in the rest of the region (Darwall et al. 2009).The maps presented in this atlas are a culmination of the National Freshwater EcosystemPriority Areas project (<strong>NFEPA</strong>), a three-year partnership project between the SouthAfrican National <strong>Biodiversity</strong> Institute (<strong>SANBI</strong>), CSIR, Water Research Commission (WRC),Department of Environmental Affairs (DEA), Department of Water Affairs (DWA),Worldwide Fund for Nature (WWF), South African Institute of Aquatic <strong>Biodiversity</strong> (SAIAB)and South African National Parks (SANParks). <strong>NFEPA</strong> maps provide strategic spatialpriorities for conserving South Africa’s freshwater ecosystems and supporting sustainableuse of water resources. These strategic spatial priorities are known as FreshwaterEcosystem Priority Areas, or ‘FEPAs’. <strong>NFEPA</strong> maps were developed using the principles ofsystematic biodiversity planning, also known as systematic conservation planning (Margulesand Pressey 2000). Systematic biodiversity planning is a well-established field of science inwhich South Africa is considered a world leader (Balmford 2003).This <strong>Atlas</strong> is one of a suite of <strong>NFEPA</strong> products. The accompanying DVD includes the fullrange of <strong>NFEPA</strong> products listed below:• An open source map viewer provides non-technical users with a user-friendly andeasy-to-install interface that can be used to select different data layers for viewing, withthe ability to zoom in and out of different regions.• <strong>GIS</strong> data used in the atlas are provided for technical users in shapefile format togetherwith associated metadata.• Look-up table that lists the ecosystem types, species, biophysical processes and specialfeatures recorded within each river FEPA and Fish Support Area, according to uniquesub-quaternary catchment codes shown on the FEPA maps in Part 2 of this atlas.• PDFs of FEPA maps presented in Part 2 of this atlas that can be printed by users.• An implementation manual describes how <strong>NFEPA</strong> products can be used inUrgent attention is needed to ensure that we conserve some natural examples of thedifferent ecosystems that make up the natural heritage of this country for current andfuture generations. The National Freshwater Ecosystem Priority Areas project (<strong>NFEPA</strong>)responds to this need, providing strategic spatial priorities for conserving South Africa’sfreshwater ecosystems and supporting sustainable use of water resources.The <strong>NFEPA</strong> maps and supporting information form part of a comprehensive approachto sustainable and equitable development of South Africa’s scarce water resources. Forintegrated water resources planning, <strong>NFEPA</strong> provides guidance on how many rivers,wetlands and estuaries, and which ones, should remain in a natural or near-naturalcondition to support the water resource protection goals of the National Water Act (Actplanning and decision-making processes by a range of sectors to support sustainablemanagement of freshwater ecosystems. It also answers frequently asked questionsregarding the project and its outputs, and provides freshwater ecosystem managementguidelines for the key FEPA map categories.• A technical report explains the scientific methods and stakeholder engagement36 of 1998). <strong>NFEPA</strong> products are therefore directly applicable to the National Water Act,process used to create the map products and the analysis of legal and institutional<strong>NFEPA</strong> provides guidance on how manyrivers, wetlands and estuaries, andwhich ones, should remain in a naturalor near-natural condition. It supportsthe implementation of the NationalWater Act, the <strong>Biodiversity</strong> Act and theProtected Areas Act.feeding into Catchment Management Strategies, water resource classification, reservedetermination, and the setting and monitoring of resource quality objectives. <strong>NFEPA</strong>products are also directly relevant to the National Environmental Management: <strong>Biodiversity</strong>Act (Act 10 of 2004), informing both the listing of threatened freshwater ecosystems andthe process of bioregional planning provided for by this Act. <strong>NFEPA</strong> products support theimplementation of the National Environmental Management: Protected Areas Act (Act 57of 2003) by informing the expansion of the protected area network.mechanisms available for implementing <strong>NFEPA</strong> products. It also reflects on insightsgained from case study applications.• Slide presentations of <strong>NFEPA</strong> are given in abridged and unabridged versions, with theformer targeting a policy and implementation audience, and the latter a more scientificaudience.Alida BritzWho should use these maps?Intended users of <strong>NFEPA</strong> products include: the national departments of Water Affairs andEnvironmental Affairs, Catchment Management Agencies and their associated stakeholders,Freshwater ecosystems refer to all inlandwater bodies whether fresh or saline,including rivers, lakes, wetlands, sub-surfacewaters and estuaries.<strong>SANBI</strong>, SANParks, bioregional programmes, provincial conservation authorities, provincialenvironmental affairs departments, national and provincial departments of agriculture, theDepartment of Mineral Resources, municipalities, NGOs, conservancies and environmentalconsultants.<strong>SANBI</strong>’s Freshwater Programme is involved in ongoing support to provinces, municipalitiesand other stakeholders to ensure that <strong>NFEPA</strong> products are available and incorporatedmeaningfully into their respective policies, programmes and decisions. Data and productsare available through <strong>SANBI</strong>’s <strong>Biodiversity</strong> <strong>GIS</strong> website (http://bgis.sanbi.org), whichserves spatial biodiversity information freely to the public. Alternatively, contact <strong>SANBI</strong>’sFreshwater Programme at freshwater@sanbi.org.za.Andrew BrownAndrew BrownPeter Chadwick/WWF-SABackground - 1 -
Part 1: IntroductionThis section describes:1.1 The importance of healthy ecosystems, emphasising theneed for sustainable development of water resources1.2 Guiding principles that should direct the managementof freshwater ecosystems in support of sustainabledevelopment1.3 Major pressures on freshwater ecosystems1.4 Systematic biodiversity planning: how it originated interrestrial settings and has evolved to become applicableto freshwater settings, and how the approach wasapplied to identify Freshwater Ecosystem Priority Areas1.4 History of freshwater biodiversity planning in SouthAfrica: acknowledging the body of work and foundationon which the <strong>NFEPA</strong> project builds1.5 Planning at different scales: resulting in a nested systemof broad-scale and fine-scale plans1.1 The importance of healthy ecosystemsWater affects every activity and aspiration of human society and sustains all ecosystems.Rivers, wetlands, lakes and estuaries have long inspired artists and musicians, enrichingthe human spirit with their beauty. Freshwater ecosystems provide for many of ourfundamental needs: water for drinking and irrigation, food such as fish and waterbirds, andreeds for craftsmanship. Healthy ecosystems also provide important regulating ecosystemservices, such as preventing floods and easing the impacts of droughts. A healthyecosystem supports functional communities of plants and animals that are able to removeexcess nutrients and toxic substances from water, keeping it cleaner for drinking, irrigationand recreation. Healthy rivers, wetlands and groundwater systems also maintain watersupply and buffer the effects of storms, reducing the loss of life and property to floods.Healthy river banks with natural vegetation help to trap sediments, stabilise river banks andbreak down pollutants draining from the surrounding land. Estuaries provide nursery areasfor marine and estuarine animals, and supply fresh water and nutrients to the sea, whichdrive marine food webs and maintain important fisheries (Lamberth et al. 2009).Freshwater ecosystems provide for many ofour fundamental needs: water for drinkingand irrigation, food such as fish andwaterbirds, and reeds for craftsmanship.Healthy ecosystems also provide importantregulating ecosystem services, such aspreventing floods and easing the impacts ofdroughts.Wilma StrydomWater is also one of South Africa’s most limited resources, constraining our future socialand economic development. Its wise use is critical to the sustainable development ofour emerging economy and the well-being of all our citizens, particularly the poorest,who depend directly on the health of natural resources for their livelihoods (MillenniumAssessment 2003). Yet this valuable national asset is in crisis. Pressures arising fromsocial and economic needs have resulted in widespread degradation of freshwaterecosystems. In many regions of the country water demand outstrips supply, and waterquality has declined due to increased pollution from industry, urban expansion, mining,power generation, agriculture, forestry and inadequate sewage treatment. The National<strong>Biodiversity</strong> Assessment 2011 revealed that over half of our river, wetland and estuaryecosystem types in South Africa are threatened (Nel et al. 2011). Such widespreaddegradation of freshwater ecosystems inevitably compromises ecosystem service deliveryand results in more costly management interventions and the loss of resilience to changingcircumstances. This current situation is even more alarming when future pressureson water resources are considered – the demand for water is predicted to escalatedramatically (DWAF 2004) and many parts of the country are expected to become drier asa result of climate change, threatening our water supplies (Schulze 2005).Introduction - 2 -
A focus on sustainable development becomes crucial given these current andfuture pressures on water resources. It is widely accepted that economic, social andecological systems are inextricably bound (Figure 1.1). Protection and utilisationof natural resources therefore need to work hand-in-hand to achieve sustainabledevelopment. In the context of water resources management, this means thatcatchments can be designed to support multiple levels of use, with natural rivers andwetlands that are minimally-used supporting the sustainability of hard-working riversthat often form the economic hub of the catchment. This concept is firmly embeddedin the National Water Act, and forms the foundation of the water resourcesclassification system (Dollar et al. 2010). Keeping some rivers and wetlands in thecatchment in a natural or good condition serves a dual purpose of conserving SouthAfrica’s freshwater biodiversity and promoting the sustainable use of water resourcesin the catchment. This is particularly important if we are to meet governmentobjectives for both sustainable water resources development and freshwaterbiodiversity conservation. The question remains: which rivers and wetlands, and howmany, should be maintained in a natural condition to support these two goals?Healthy freshwater ecosystems supporthuman needs – without them, social andeconomic development is not possible. SouthAfrica’s freshwater ecosystems are underenormous pressure and have already beensubstantially degraded, with more than halfof our river and wetland ecosystem typesclassified as threatened.The <strong>NFEPA</strong> maps presented in this atlasrepresent a joint effort between the waterand biodiversity sectors to incorporatefreshwater ecosystem goals into waterresource planning and management.Economic SystemsSocial SystemsEcological SystemsFigure 1.1: Economic, social and ecological systems are inextricably bound.The health of our ecological systems and associated natural capitalunderpins social and economic growth.The <strong>NFEPA</strong> project addresses this question by synthesising data and existing knowledgeto identify strategic Freshwater Ecosystem Priority Areas, or FEPAs, for promotingsustainable water resource use and achieving the freshwater ecosystem goals of thecountry (Roux et al. 2006). The resulting maps and supporting information representa joint effort between the water and biodiversity sectors to incorporate freshwaterecosystem goals into integrated water resource planning and management in terms ofthe National Water Act. These map products should be used in conjunction with theImplementation Manual for Freshwater Ecosystem Priority Areas, which can be found onthe accompanying DVD (see page 1 of this atlas for the full suite of <strong>NFEPA</strong> products).Roxanne KleinMaronel SteynWilma StrydomWilma StrydomIntroduction- 3 -
1.2 Guiding principles for managingfreshwater ecosystemsBelow are eight principles that should guide the management of freshwater ecosystemsin support of sustainable development. These principles informed the identification ofFEPAs.Principle 1: Fresh water flowing out to sea is not wastedFreshwater inputs to estuaries and the sea are necessary to maintain importantecological processes that keep our marine resources healthy. For example, fresh waterprovides an important environmental cue that helps fish and other marine animalsfind their way to estuary mouths to breed. Nutrients in fresh water also form thefoundation of marine food webs. These ecological processes are vital for maintainingcommercial and recreational fish stocks, as well as for providing a source of foodto poor coastal communities that depend directly on marine resources for food.A certain amount of water is also required to flush and scour the mouth of mostestuaries. Without the scouring effect, sediments build up at the mouth and the riskof back-flooding during storms increases. Artificial breaching of an estuary mouthto minimise this risk is expensive and damages estuarine ecosystems. Apart fromthe scouring effect, fresh water helps to flush estuaries of organic matter and otherpollutants, which otherwise smell unpleasant. If too much water is taken out of a riveralong its length, not enough fresh water reaches the estuary and the sea to maintainthese vital ecological processes.Principle 2: Freshwater ecosystems are connectedsystems that require a source-to-seaapproachNo single ecosystem component can be meaningfully managed in isolation from itsconnected aquatic ecosystems – be they rivers, wetlands, groundwater, estuaries ormarine ecosystems. What happens upstream or in the surrounding landscape affectsdownstream ecosystems and their ability to provide ecosystem services. The nowcommonly acknowledged whole-catchment approach should be taken further tobecome a source-to-sea approach, because freshwater inputs impact significantly onestuarine and marine environments, and the ecosystem services they deliver.Principle 3: Healthy tributaries and wetlands support thesustainability of hard-working riversFreshwater ecosystems in a catchment can be designed to support different levels of use,with natural rivers and wetlands that are minimally-used supporting the sustainability ofheavily-used rivers and wetlands that often form the economic hub of the catchment. Inmany catchments, the desired condition of the estuary (as agreed on through negotiationsbetween stakeholders) will be a determining factor in the management of upstream waterresources connected to the estuary. To ensure that some tributaries and wetlands stay healthy,a catchment can be zoned for varying degrees of use and impact. For example, FEPAs shouldbe zoned for low impact activities; surrounding secondary zones can allow moderate impactactivities; and heavily impacting activities such as high-intensity agriculture, plantation forestryand mining, can be restricted to high impact zones. In addition, buffers of natural vegetationaround all freshwater ecosystems support the maintenance of healthy freshwater ecosystems(see principle 4).Principle 4: Healthy riparian, wetland and estuary buffersreduce the impact of land-based activitiesFreshwater ecosystems are generally the lowest point in the landscape, making them thereceivers of wastes, sediment and pollutants in runoff. This, combined with the strongconnectivity of freshwater ecosystems, means that they are highly susceptible to upstream,downstream and upland impacts. Managing land-based impacts is therefore essential. Whileit is seldom feasible for entire catchments to be ‘locked away’ from human use, catchmentscan be designed to incorporate varying levels of use and impacts on freshwater ecosystemsas discussed in principle 3. Buffers of natural vegetation around all freshwater ecosystems,even heavily-used ones, go a long way to reducing the effects of damaging land-use practices(such as agricultural activities close to river banks). The effective width of the buffer shouldbe determined on a site-specific basis. The Implementation Manual for FEPAs (available on the<strong>NFEPA</strong> DVD) provides some recommendations for delineating management buffers.Principle 5: Groundwater sustains river flows, particularly indry seasonsGroundwater abstracted from boreholes in or close to rivers, streams or wetlands has avery direct influence on river flow, and should be not be viewed as an additional waterresource. Such groundwater plays an important role in sustaining river flows (‘base flows’)and supporting refuge pools in the dry season. Apart from the human benefits of maintainingriver flows in the dry season, refuge pools in seasonal rivers support water-dependent animalsthat would otherwise not survive when the rivers dry up. Healthy riparian zones (riverbanks and their surrounds), which filter pollutants that drain from the land, are also oftenmaintained by groundwater. When groundwater has very weak links to surface water (such asin deep, confined aquifers) it may be possible to abstract it without significantly impacting onfreshwater ecosystems; however, long term impacts are not well understood.Principle 6: Rivers provide ecological corridors in anincreasingly fragmented landscapeRivers form important ecological corridors from water source areas all the way down tothe sea. These river corridors support land and water-based ecosystem processes andbiodiversity that depend on connectivity. The loss of connectivity between different partsof a catchment fundamentally alters ecosystem processes and associated services, andnegatively affects biodiversity. Such landscape connectivity provides social and ecologicalresilience, especially within a changing climate. This contributes to ecosystem-basedadaptation to climate change.Principle 7: Managing freshwater ecosystems requiresstrong cooperation across multiple sectorsThe effective protection of freshwater ecosystems requires close coordination andcooperation among the sectors responsible for protection and management of waterresources, biodiversity conservation, land-use management (including agriculturalresources), and integrated development planning. Coordination and cooperation can begreatly enhanced through a skilled facilitating organisation that can play an intermediaryrole between the water user, science and policy domains. <strong>SANBI</strong>, provincial conservationauthorities and Catchment Management Agencies are well-placed to play such a role infreshwater ecosystem conservation.Principle 8: A strategic and systematic approach toconserving freshwater ecosystems is neededThe intensity of the pressures on freshwater ecosystems means that we cannot manageimpacts just on a river-by-river or wetland-by-wetland basis. A strategic approach toplanning and setting priorities is essential, to focus conservation efforts where theywill have the greatest impact. Systematic biodiversity planning provides a spatialplanning tool for achieving this. With its overarching goal of planning for the longtermpersistence of biodiversity, systematic biodiversity planning identifies those areasthat are essential for conserving biodiversity. Spatial priorities are based on achievingrepresentation of the full spectrum of freshwater ecosystems and associated biodiversitywithin the region of concern. A systematic biodiversity planning approach was used inthe development of the <strong>NFEPA</strong> maps (see Section 1.4 below).Introduction- 4 -
1.3 Major pressures on freshwaterecosystemsMany pressures contribute to thedegradation of freshwater ecosystems,and it is often difficult to isolate a singlecause.1.3.1 Flow alterationFlows can be altered either by removing water from a freshwater ecosystem oradding more water through return flows or water transfer schemes. Altering theflow regime (e.g. timing, frequency, speed or volume of flow) changes river channelcharacteristics and habitats. This alters the functioning of freshwater ecosystemsand has a profound and often negative effect on freshwater plants and animals.Flow alteration ranges from large-scale projects such as the building of large damsand water transfer schemes, to local alterations that are individually small buthave significant cumulative impacts. In South Africa, most large rivers are heavilyutilised and regulated to improve water security, and large dams can store up totwo thirds of the country’s total annual runoff. Water transfer schemes are alsowidespread across the country to cater for areas where water demand exceeds thenatural supply of water. There is growing concern around the cumulative impact ofsmall farm dams which have been shown to have substantial impact on the qualityand quantity of waters in South African rivers (Mantel et al. 2010), and threatenthe sustainability and longevity of large dams within the associated catchments(Boardman et al. 2009).1.3.2 Water pollutionPollution threatens freshwater ecosystemsand available water resources, posing healthrisks to South African society. Pollutionsources include industrial and mining effluent,agricultural pesticides and fertilizers, anddomestic effluent including sewage.Pollution of water is a very serious and growing problem in South Africa, especiallyas failing water treatment infrastructure battles to treat the increasing domestic andindustrial effluent from towns and cities. Many industrial processes produce wastecontaining harmful chemicals that are sometimes discharged directly into sewers, riversor wetlands. Pollution from agricultural pesticides and fertilizers washing into riversor leaching into groundwater is a major problem, exacerbated by decreased dilutioncapacities that result from over-abstraction of water. These problems can increase thesalinity and nutrient loads of water resources, processes that are respectively known as‘salinisation’ and ‘eutrofication’. Salinisation and eutrophication impact human health, theutility of water resources for agriculture and industry, and the structure and functioning offreshwater ecosystems.The single biggest pressure on SouthAfrica’s freshwater ecosystems isalteration of flow, for example throughbuilding dams or transferring waterbetween catchments.Peter Chadwick/WWF-SAWiida BassonLindie Smith-AdaoAcid mine drainageEutrophicationIntroduction - 5 -
1.3.3 Destruction or degradation of natural habitat1.3.4 Invasive alien species1.3.5 Climate changeHabitat destruction or degradation includes direct impacts (such as bulldozing andplanting of crops in wetlands or river channels) and indirect impacts (such as clearingnatural vegetation in the surrounding catchment, resulting in increased sedimentloads and erosion). Wetland ecosystems have been particularly hard hit: in agriculturalareas they have been predominantly dammed or drained for cultivation, and in urbanareas they are frequently completely transformed by infrastructure development. Thewidespread destruction and modification of river banks is a major problem as thisreduces the filtering capacity that healthy buffers of natural vegetation provide anddestroys freshwater plant and animal habitat (see principle 4 in Section 1.2).Destruction of river banksand wetlands, for example by ploughingor building infrastructure, results inoften irreversible damage to freshwaterecosystems and their ability to provideecosystem services.Invasive alien plant species have a substantial impact on riverine habitat and wateryield, consuming an estimated 7% of South Africa’s total annual runoff. The Workingfor Water programme in South Africa has created considerable awareness of theproblems associated with invasive alien plant water use.Invasive alien plants impact on riverhabitat and water yield. Invasive alien fishsuch as bass and trout, often introducedfor aquaculture or recreational fishing,disrupt ecosystem functioning and arethe number one threat to indigenous fishspecies.Less awareness exists around the threats posed to freshwater ecosystems by invasivealien fish, such as trout, bass and carp. These species are often introduced to riversystems for aquaculture and recreational fishing. Even when invasive alien fish arenot directly introduced in rivers, they often escape from farm dams in which they arestocked (e.g. when the dam wall is breached in floods). Invasive alien fish now occurextensively in most large rivers in South Africa, and impact on indigenous freshwaterplants and animals through altering habitats, competing for resources and eatingindigenous plants and animals. Invasive alien fish present a grave threat to indigenousfish species and have led to local extinctions in some river systems. Invasive alien fishhave also been associated with loss of invertebrates such as dragonflies. Un-invadedstreams (often the smaller tributaries of large rivers) frequently serve as the lastremaining refuges for indigenous freshwater species. Preventing invasions of alienfish in un-invaded streams is crucial, as controlling or eradicating invasive alien fishis difficult and expensive. Weirs can be useful for preventing upstream invasions,although an assessment of the environmental impact of the weir to the entirefreshwater ecosystem should be done prior to construction.Predicted changes in rainfall and temperature will impact on water resources. Thesechanges are likely to have a disproportionately large impact on runoff and river flow(Schulze 2005), with implications for future planning and management of water resources,especially around extreme events such as droughts and floods. For example, keepingrivers and wetlands healthy will help to regulate flow and reduce the risk of flooding.Climate change is also likely to impact on freshwater species. Animals may need to moveto rivers at higher altitude with cooler stream temperatures, and barriers in the riverchannel (such as dams) could restrict such movement.Changes in rainfall and temperature as aresult of climate change are likely to havea large impact on river flows. Keepingfreshwater ecosystems healthy will help themadapt to these changes with least disruptionto ecosystem services.Roxanne KleinAlien vegetation Obstructing river flow Habitat destructionErnst SwartzErnst SwartzIntroduction - 6 -
1.4 Systematic biodiversity planningSystematic biodiversity plans identifygeographic priority areas that need tostay in a natural or near-natural conditionto support sustainable development. Thesystematic approach is embedded in policyand practice in South Africa, and representsthe best available science in this field.Systematic biodiversity planning is a strategic and scientific approach to identifyingthose areas that are the most important for biodiversity conservation. The key objectivesof systematic biodiversity planning are to ensure that all ecosystems and species arerepresented, that key ecological processes are kept intact, and that this is achieved in thesmallest, most efficient area possible (Margules and Sarkar 2007).Systematic biodiversity planning in South Africa is firmly embedded in both policy andpractice. The National <strong>Biodiversity</strong> Framework requires provinces to develop provincialbiodiversity plans. The National Protected Area Expansion Strategy is founded onsystematic biodiversity planning principles, providing the strategy to guide national andprovincial authorities in the expansion of the country’s protected areas over the next 20years. Bioregional plans published in terms of the <strong>Biodiversity</strong> Act must use a systematicbiodiversity planning approach to identify Critical <strong>Biodiversity</strong> Areas and EcologicalSupport Areas, and must integrate priorities for terrestrial and freshwater ecosystems.Examples of such maps can be found on <strong>SANBI</strong>’s <strong>Biodiversity</strong> <strong>GIS</strong> website (http://bgis.sanbi.org). <strong>NFEPA</strong> can be used as the freshwater input into an integrated systematicbiodiversity planning exercise to develop Critical <strong>Biodiversity</strong> Areas and EcologicalSupport Areas for provincial biodiversity plans and bioregional plans in terms of the<strong>Biodiversity</strong> Act. For recommendations on how to accomplish this, the reader is referredto the <strong>NFEPA</strong> technical report available on the <strong>NFEPA</strong> DVD or on <strong>SANBI</strong>’s <strong>Biodiversity</strong> <strong>GIS</strong>website (http://bgis.sanbi.org).Systematic biodiversity plans focus onecosystems, species, ecological processesand connectivity. Freshwater biodiversityplans use sub-catchments as planning units,reflecting the need to manage not just thewater resource itself but also the surroundingland.1.4.1 History of systematic biodiversity planningSystematic biodiversity planning has had almost three decades of research and practicein the terrestrial realm, but has only recently been applied to freshwater settings. Theevolution of systematic biodiversity planning has led to a greater applicability of thescience to freshwater ecosystems, with much of the new ground being pioneered in SouthAfrica (Balmford 2003; Roux et al. 2002; Nel et al. 2009a).Systematic biodiversity planning emerged as a field of science in response to therealisation that ad hoc approaches to conservation, where areas were protected forreasons unrelated to their biodiversity, were not delivering the best bang for theconservation buck (Figure 1.2). The first strategic attempts at identifying priority areaswere focused largely on identifying lists of sites that freshwater scientists knew wereof conservation importance based on their experience in the field. This approach wasfurther advanced by developing scoring systems for comparing the relative importanceof different sites, based on attributes such as habitat diversity, naturalness, representativeness,rarity, species richness and special features (Figure 1.2). Using scoring approachesto prioritise conservation action can be problematic. Choosing high scoring areas overlow scoring ones has a tendency to undermine representation even if representativenessis a criterion that is scored and heavily weighted. Early efforts in systematic biodiversityplanning focused very much on addressing the issue of representation through settingexplicit biodiversity targets for representation, and achieving these targets in an efficientmanner by choosing areas that complement, rather than duplicate, their biodiversityfeatures.The first systematic biodiversity plans focused on representation of terrestrial biodiversityin an efficient set of protected areas (Figure 1.2). By the late 1990s, the scope hadexpanded to include planning for the persistence of biodiversity, recognising that manynatural processes responsible for maintaining biodiversity will not persist if they arenot explicitly incorporated into the identification of spatial priority areas. The focus onprotected areas was also broadened to incorporate planning within multi-functionallandscapes with the outputs of biodiversity plans aimed not only at directing theexpansion of the protected area network, but also at informing land-use planning andday-to-day decisions made about land use throughout the landscape (Cadman et al. 2010).In response to the many calls for science to have more impact on the ground, the trend ofthe 2000s is to plan for implementation of the biodiversity planning outputs, embeddingthe entire exercise in a stakeholder-driven implementation process, and designing mapsand accompanying guidelines that are tailored to meet user needs (Figure 1.2). An evenmore recent advance in systematic biodiversity planning is to use it in planning forecosystem-based adaptation to climate change, by incorporating biophysical featuresthat provide climate change resilience into the identification of spatial priority areas (e.g.altitudinal gradients).Ad hoc approachesScoring approachesPlanning for representationPlanning for persistencePlanning for implementationPlanning for climate change adaptationuntil1970s 1980s 1990s 1990s 2000s 2000sSystematicbiodiversityplanningFigure 1.2: Evolution of systematic biodiversity planning approaches in SouthAfricaPlanning for persistence as well as representation, and planning with a view to informinga range of land uses rather than just the location of protected areas, were importantadvances in the applicability of systematic biodiversity planning to freshwater ecosystems.Given the connectivity of freshwater ecosystems, a focus on representing biodiversity inisolated areas, without regard for upstream, downstream or upland areas, is conceptuallyflawed. It is also seldom feasible to declare whole catchments as protected areas, andtherefore varying levels of protection, ranging from high to low use-restrictions, areneeded. The mid-2000s were characterised by a growing momentum in systematicbiodiversity planning for freshwater ecosystems, with several important advances (Nelet al. 2009a; Linke et al. 2011). All freshwater biodiversity plans use sub-catchments asplanning units, thereby incorporating the need to manage the water resource of concernas well as the surrounding land (Lehner et al. 2006; Thieme et al. 2007). Many include thedevelopment of a river tree-network that can be used to assess upstream-downstreamlinkages (Moilanen et al. 2008). Most plans also consider some form of multiple-usezonation in which different levels of protection are recommended depending on the rolethat sub-catchment fulfils in achieving biodiversity goals (Abell et al. 2007; Thieme et al.2007). For example, the maps of Freshwater Ecosystem Priority Areas in this <strong>Atlas</strong> showcategories that are broadly based on diminishing use restrictions: Freshwater EcosystemPriority Areas (‘FEPAs’) focus on representing natural or near-natural examples offreshwater ecosystems, and management is therefore fairly restrictive; Fish Support Areasneed to be maintained in a condition that supports the fish populations they contain– this need not be a natural or near-natural condition; Upstream Management Areasrequire management only to ensure that human activities do not degrade the conditionof FEPAs and Fish Support Areas that occur downstream.Introduction - 7 -
1.5 History of freshwater biodiversityplanning in South Africa<strong>Biodiversity</strong> planning is not new in South African freshwater science. Some three decadesago, our freshwater ecologists had already recognised the need to make strategic useof limited conservation resources. Since the 1970s and at about 10-year intervals, fourplanning exercises have been undertaken for different aspects of South Africa’s freshwaterbiodiversity, identifying strategic priority areas using advancing approaches to biodiversityplanning (Figure 1.2).In the 1970s, Graham Noble evaluated the conservation status of 40 aquatic biotopesand made recommendations for the conservation of 25 sites, recommending formalconservation within protected areas (Figure 1.4a: Noble 1974). These biotopes weredescriptive but not spatially explicit and the sites that were recommended for conservation(a) 1974were relatively well known by experts rather than chosen in a systematic way. In the 1980s,144 “sites of outstanding conservation importance”, were spatially identified across thecountry as a starting point for conservation action (Figure 1.4b: O’Keeffe 1986). These werebased on expert opinion of importance rather than a systematic analysis of river ecosystemtypes and species, recognising that “until we can classify our rivers and river zones in detail,management of different priorities will at best be haphazard” (O’Keeffe et al. 1989). In the1990s, a spatially explicit and systematic biodiversity plan was developed for freshwater fishspecies in South Africa (Skelton et al. 1995). Twenty quarter degree squares (15’ x 15’) of“maximum importance” were identified as the minimum set of sites that would togetherprotect each species at least once (Figure 1.4c).(b) 1986Several sub-national freshwater biodiversityplans undertaken in the mid-2000s, togetherwith the development of key national <strong>GIS</strong>layers over the last decade, provided aneffective basis for undertaking a nationalsystematic biodiversity plan for freshwaterecosystems.As discussed in Section 1.4, the 1990s signified a giant leap forward in South Africa’s abilityto identify priority areas using systematic biodiversity planning approaches, and today thecountry is at the forefront in this field (Balmford 2003). As early as 1999, aquatic ecologistswere exploring the potential use of systematic biodiversity planning for freshwaterecosystems of the Cape Floristic Region of South Africa (Van Nieuwenhuizen and Day2000). The first ever published application of systematic biodiversity planning to freshwaterecosystems arose from a South African project addressing the strategic expansion of theGreater Addo Elephant National Park (Roux et al. 2002). These methods and data weredeveloped, refined and piloted for six of South Africa’s 19 Water Management Areas in2006, namely the Fish-to-Tsitsikamma, Inkomati, Olifants, Usutu-Mhlathuze, Crocodile(West) and Marico, and Olifants-Doorn (Kotze et al. 2006; Nel et al. 2006a; Nel et al.2006b; Smith-Adao et al. 2006). Development of these methods was greatly facilitated byadvances in available <strong>GIS</strong> data such as river ecoregions (Kleynhans et al. 2005), geomorphicprovinces (Partridge et al. 2010), longitudinal zonation of rivers (Rowntree and Wadeson1999), estimated ecological condition for major river systems (Kleynhans 2000), andavailability of national land cover at a 30 metre resolution (Van Den Berg et al. 2008).(c) 1995Aquatic biotopes(d) 2010Expert opinionThe technical advances in freshwater biodiversity planning were also supported bya concurrent cross-sectoral policy process between several national governmentdepartments and national agencies (Roux et al. 2006). This policy process played animportant role in providing a politically accepted national biodiversity target for SouthAfrica’s freshwater ecosystems: participating departments and organisations agreed tomaintain at least 20% of each major freshwater ecosystem type in South Africa in a goodcondition. This 20% target should be refined as new scientific knowledge arises.The work outlined above built the scientific competence necessary to undertake systematicbiodiversity planning for freshwater ecosystems at a national level. It also promoted broadinstitutional support for the products of such an exercise. The <strong>NFEPA</strong> project embarkedon this ambitious venture in August 2008, synthesising current knowledge and identifyingnational priority areas for freshwater ecosystems (Figure 1.4d). It is intended that thisproject too will be updated, most likely on a ten-year cycle.Fish speciesEcosystem typesEcological processesThreatened speciesFigure 1.4: Strategic priority areas that have been identified since the 1970s using advancing approaches to systematic biodiversity planningIntroduction - 9 -
1.6 <strong>Biodiversity</strong> planning at different scales<strong>Biodiversity</strong> planning can be done at a range of spatial scales from broad globalassessments, to regional, national, catchment and sub-catchment assessments (Figure1.5). The most appropriate scale depends on the types of questions that need to beaddressed and how the resulting maps are to be used. The spatial scale at which planningis undertaken should determine the resolution of the input data, such as the detail of theriver network used and the resolution of the data used to classify freshwater ecosystemsand their ecological condition. The finer the scale of interest, the finer the resolution ofdata required. Importantly, finer scale planning is not necessarily required across theentire landscape; with limited resources it makes sense to focus fine-scale planninginitiatives on priority areas that have been identified in a broader scale systematicbiodiversity plan such as <strong>NFEPA</strong>. This results in a nested system of broad-scale and finescaleplans.<strong>NFEPA</strong> provides a national assessmentthat is at a fine enough scale to be usedmeaningfully in Water Management Areasand provinces, identifying priorities at subquaternarycatchment scale.FEPAs have been identified at the sub-quaternary catchment scale (Figure 1.6).Sub-quaternary catchments are watersheds that are approximately nested in theDepartment of Water Affairs quaternary catchments (Midgley et al. 1994). Thewatershed of a sub-quaternary catchment is delineated around each river reach,where a river reach is defined as the portion of river between river confluences onthe Department of Water Affairs 1:500 000 river network <strong>GIS</strong> layer. The maps of FEPAs(Part 2 of this atlas) are at a resolution suitable for planning at the level of a WaterManagement Area, for processes such as catchment visioning, water use scenarioplanning and water resource classification.Each FEPA needs a management plan that identifies the key wetland and river habitatsfor which it was selected, delineates management buffers around these, and addressesspecific pressures that may impact on its conservation. In some instances it may besensible to develop management plans for groups of FEPAs, Fish Support Areas andUpstream Management Areas. A look-up table is provided on the accompanying DVDthat lists the ecosystem types, species, biophysical processes and special featuresrecorded within each river FEPA and Fish Support Area, according to unique subquaternarycatchment codes as shown in Part 2 of this atlas.FEPAs have also been summarised to a coarser level of resolution, providing mapsof the density of Freshwater Ecosystem Priority Areas per Water ManagementArea (Section 3.1) and sub-Water Management Area (Section 3.2). These maps areintended to initiate a dialogue on policy mechanisms that are needed to support theimplementation of national freshwater ecosystem goals, recognising that responsibilityfor achieving these is spread unevenly across the country.Figure 1.5: Planning for freshwater ecosystem conservation and managementshould take place at a hierarchy of spatial scales. Broad-scaleplans inform the focus of finer levels of biodiversity planning andmanagement, from identifying the relative importance of large primarycatchments all the way through to managing priority river reaches andtheir component priority habitats such as pools and riffles.Wilma StrydomAt a finer scale of planning, FEPAs and Fish Support Areas can be used as the basis foridentifying Critical <strong>Biodiversity</strong> Areas and Ecological Support Areas used in provincialbiodiversity plans and bioregional plans. These plans integrate priority areas for freshwaterecosystems with those for terrestrial ecosystems. Critical <strong>Biodiversity</strong> Areas are similar toFEPAs and need to remain in a natural or near-natural condition to conserve biodiversityand ecological functioning. Ecological Support Areas are similar to Fish Support Areas andUpstream Management Areas, and need to be managed to prevent degradation of Critical<strong>Biodiversity</strong> Areas. Using FEPA maps as a basis for identifying Critical <strong>Biodiversity</strong> Areas andEcological Support Areas requires, at a minimum, setting a rule for generating variablewidthbuffers around FEPAs, and assigning Ecological Support Areas to the smaller streamnetwork within sub-quaternary catchments containing river FEPAs (using the 1:50 000 river<strong>GIS</strong> layer). For recommendations on how to accomplish this, the reader is referred to the<strong>NFEPA</strong> technical report available on the <strong>NFEPA</strong> DVD or on <strong>SANBI</strong>’s <strong>Biodiversity</strong> <strong>GIS</strong> website(http://bgis.sanbi.org).Provincial biodiversity plans and district-levelbioregional plans integrate priority areasfor freshwater and terrestrial ecosystems.FEPA maps will feed into the identificationof Critical <strong>Biodiversity</strong> Areas and EcologicalSupport Areas in these plans.Figure 1.6: Quaternary catchments of South Africa were split into subquaternarycatchments using the Water Affairs 1:500 000 rivernetwork. Sub-quaternary catchments are on average six timessmaller than quaternary catchments.Introduction - 10 -
Part 2: FreshwaterEcosystem Priority Areamaps for WaterManagement AreasThis section of the atlas provides a map for each Water Management Area showingFreshwater Ecosystem Priority Areas (FEPAs), as well as Fish Support Areas and UpstreamManagement Areas.South Africa has 19 Water Management Areas used as administrative and managementunits for implementing water policy and legislation. Catchment Management Agenciesare in the process of being established for Water Management Areas or groups of WaterManagement Areas. Water Management Areas are delineated using catchment boundariesand do not match provincial or municipal boundaries (Figure 2.1).FEPA maps provide the basis for the biodiversitysector’s input into Catchment ManagementStrategies, water resource classification, reservedetermination, and resource quality objectives, allundertaken in terms of the National Water Act.This section includes:2.1 Introduction to Freshwater Ecosystem Priority Area maps2.2 Categories on the Freshwater Ecosystem Priority Areamaps2.3 Freshwater Ecosystem Priority Area maps for the 19 WaterManagement AreasJeanne NelWater Management AreasEastern CapeFree StateGautengKwaZulu-NatalLimpopoMpumalangaNorth WestNorthern CapeWestern CapeMap to followData layer is ooops !14Lower Orange10Lower Vaal3Crocodile(West)and Marico9Middle Vaal13Upper Orange1Limpopo8Upper Vaal2Luvuvhu andLetaba4Olifants7ThukelaMvoti toUmzimkulu115Inkomati6Usutu toMhlathuzeFEPA maps show Freshwater Ecosystem Priority Areas,Fish Support Areas and Upstream Management Areas.A range of criteria were used to identify FEPAs,including criteria dealing with ecosystems,ecosystem services and species.17Olifants/Doorn19Berg18Breede16Gouritz15Fish to Tsitsikamma12Mzimvubu toKeiskamma500 kmFigure 2.1: Map of South Africa showing Water Management Area and provincial boundariesFreshwater Ecosystem Priority Area maps for Water Management Areas - 11 -
2.1 Introduction to Freshwater EcosystemPriority Area mapsFEPA maps show rivers, wetlands and estuaries that need to stay in a good condition inorder to conserve freshwater ecosystems and protect water resources for human use.River FEPAs are often tributaries that support hard-working mainstem rivers, and arean essential part of an equitable and sustainable water resource strategy. This does notmean that FEPAs need to be fenced off from human use, but rather that they should besupported by good planning, decision-making and management to ensure that humanuse does not impact on the condition of the ecosystem. The current and recommendedcondition for all river FEPAs is A or B ecological category (see Table 2.1 for a summaryof ecological categories and Table 4.1 for more detailed descriptions of the categories).Wetland FEPAs that are considered in less than a good condition should be rehabilitatedto the best attainable ecological condition.River FEPAs should remain in goodcondition (A or B ecological category)and wetland FEPAs should remain ingood condition or be rehabilitated totheir best attainable ecological condition.Upstream Management Areas needto be managed to prevent degradationof downstream FEPAs.Table 2.1: Present ecological state categories usedEcologicalcategoryABCDEFto describe the current and desired futurecondition of South African rivers (afterKleynhans 2000). For <strong>NFEPA</strong>, rivers in anA or B category were regarded as being ingood condition.DescriptionUnmodified, naturalLargely naturalModerately modifiedLargely modifiedSeriously modifiedCritically/Extremely modifiedEach sub-quaternary catchment hasa unique code, which can be used to look upfurther information about the river FEPAs andFish Support Areas in that sub-quaternarycatchment, using the look-up table on the<strong>NFEPA</strong> DVD.FEPA maps support several policy processes in terms of the National Water Act, the<strong>Biodiversity</strong> Act and the Protected Areas Act (Box 2.1). They provide the basis for thebiodiversity sector’s input into policy processes provided under the National Water Act, suchas the development of Catchment Management Strategies, water resource classification,reserve determination, and the setting and monitoring of resource quality objectives. FEPAmaps also support the listing of threatened ecosystems, and the development of provincialbiodiversity plans, bioregional plans and biodiversity management plans in terms of the<strong>Biodiversity</strong> Act. In addition, FEPA maps should inform the implementation of protected areaexpansion in terms of the Protected Areas Act, including through biodiversity stewardshipprogrammes. The Implementation Manual for FEPAs (available on the <strong>NFEPA</strong> DVD or athttp://bgis.sanbi.org) provides further detail on how to use FEPAs in policy processes thatsupport the management and conservation of freshwater ecosystems.Peter Chadwick/WWF-SAFreshwater Ecosystem Priority Area maps for Water Management Areas - 12 -
Box 2.1. Policy mechanisms supported by FreshwaterEcosystem Priority Area mapsThis box summarises some of the key policy mechanisms for managing andconserving freshwater ecosystems, which should be informed by FEPA maps. Formore detail see the Implementation Manual for FEPAs (available on the <strong>NFEPA</strong> DVDor at http://bgis.sanbi.org).National Water Act• Catchment Management Strategies:FEPA maps form the core of the biodiversity sector inputs into a CatchmentManagement Strategy, including the biophysical situation assessment, catchmentvisioning, water resource protection strategy, and scenario planning, as set outin the Guidelines for the Development of Catchment Management Strategies(DWAF 2007).• Water resource classification:River, wetland and estuary FEPAs should be regarded as significant waterresources. The location of FEPAs should be used to prioritise the allocation ofresource unit nodes, which should be sited immediately downstream of FEPAs.Water-use scenarios should include at least one scenario that achieves thedesired condition for FEPAs (i.e. A or B ecological category). Preferably thisshould be the ecologically sustainable base configuration scenario.• Reserve determination:FEPAs should be used in identifying priority water resources for reservedetermination and should be afforded a higher confidence reservedetermination than desktop or rapid approaches. FEPAs should be takeninto account when allocating resource units for assessment and monitoring,prioritising the allocation of resource nodes immediately downstream of FEPAs.• Setting and monitoring of resource quality objectives:FEPAs should be used to prioritise the allocation of resource unit monitoringnodes, which should be sited immediately downstream of the FEPA. Theecological requirements for setting resource quality objectives (as outlined inthe Department of Water Affairs’ guidelines for resource quality objectives)should be prioritised for FEPAs.<strong>Biodiversity</strong> Act• Listing of threatened ecosystems:The data and analysis undertaken to produce FEPA maps (especially river ecosystemtypes and river condition, Sections 4.1 and 4.2) provide key information for thedevelopment of a list of threatened river ecosystems for publication in terms ofthe <strong>Biodiversity</strong> Act. River ecosystems for which it is no longer possible to meet thebiodiversity target should be listed as Critically Endangered ecosystems.• Development of provincial biodiversity plans and bioregional plans:FEPAs should be favoured in the identification of Critical <strong>Biodiversity</strong> Areas andEcological Support Areas. All river and wetland FEPAs should at least be considered tobe Ecological Support Areas.• Development of <strong>Biodiversity</strong> Management Plans for ecosystems and species:FEPAs, fish sanctuaries (Section 3.4), high water yield areas (Section 3.5) and highgroundwater yield areas (Section 3.6) should be considered in identifying ecosystemsand species of special concern for which biodiversity management plans will bedeveloped.Protected Areas Act• Expansion and management of the protected area network:FEPAs should be considered in decision-making about expanding the protected areanetwork. This includes the expansion of state-owned protected areas, as well as theactivities of provincial biodiversity stewardship programmes which work with privateand communal landowners to develop contractual protected areas. FEPAs should alsobe considered in the development of protected area management plans, which shouldensure that FEPAs remain in a good condition.FEPAs were identified based on:• Representing ecosystem types and flagship free-flowing rivers (Sections 3.3, 4.1,4.3, and 4.7),• Maintaining water supply areas in areas with high water yield (Sections 3.5),• Identifying connected ecosystems,• Representing threatened and near-threatened fish species and associatedmigration corridors (Section 3.4),• Preferentially identifying FEPAs that overlapped with:- Any free-flowing river (Section 3.3),- Priority estuaries identified in the National <strong>Biodiversity</strong> Assessment 2011(Section 4.7),- Existing protected areas and focus areas for protected area expansionidentified in the National Protected Area Expansion Strategy.Although areas with high groundwater recharge were identified (Section 3.6), theydid not influence the identification of FEPAs. Future refinement of FEPAs shouldseek to include groundwater considerations more explicitly.• Water use licensing:FEPAs should be regarded as ecologically important and as generally sensitiveto changes in water quality and quantity. The impact of a license application onthe ecological condition of a FEPA should be thoroughly assessed. If a licenceapplication is approved in a FEPA, stringent conditions should be attached tothe licence to prevent degradation of the ecological condition of the FEPA.Richard BuganFreshwater Ecosystem Priority Area maps for Water Management Areas - 13 -
2.2 Categories on the Freshwater EcosystemPriority Area mapsDifferent categories are shown on the FEPA maps, each with different managementimplications. A sub-quaternary catchment code is also provided on the FEPA maps.This code can be used to look up further information about the river FEPAs and FishSupport Areas in each sub-quaternary catchment. This additional information is useful fordeveloping site specific management plans, and is available in the look-up table on the<strong>NFEPA</strong> DVD or on <strong>SANBI</strong>’s <strong>Biodiversity</strong> <strong>GIS</strong> website (http://bgis.sanbi.org).• River FEPA and associated sub-quaternary catchment:River FEPAs achieve biodiversity targets for river ecosystems and threatened/nearthreatened fish species, and were identified in rivers that are currently in a goodcondition (A or B ecological category). Their FEPA status indicates that they shouldremain in a good condition in order to contribute to national biodiversity goals andsupport sustainable use of water resources.For river FEPAs the whole sub-quaternary catchment is shown in dark green,although FEPA status applies to the actual river reach within such a sub-quaternarycatchment. The shading of the whole sub-quaternary catchment indicates that thesurrounding land and smaller stream network need to be managed in a way thatmaintains the good condition (A or B ecological category) of the river reach.It is important to note that river FEPAs currently in an A or B ecological categorymay still require some rehabilitation effort, e.g. clearing of invasive alien plantsand/or rehabilitation of river banks. From a biodiversity point of view, rehabilitationprogrammes should therefore focus on securing the ecological structure andfunctioning of FEPAs before embarking on rehabilitation programmes in Phase 2 FEPAsor other areas (see below).• Wetland or estuary FEPA:For wetland and estuary FEPAs, only the actual mapped wetland or estuarine functionalzone is shown on the map as a FEPA, indicated by a turquoise outlinearoundthe wetland or estuary. The associated sub-quaternary catchment is not shown indark green (unless it contains a river FEPA). Connected freshwater ecosystems andsurrounding land that need to be managed in order to maintain wetland and estuaryFEPAs in good condition need to be identified at a finer scale and in managementplans for individual wetland or estuary FEPAs. In some cases it may be the wholesub-quaternary catchment and in others it may be a smaller area.Wetland FEPAs were identified using ranks that were based on a combination of specialfeatures and modelled wetland condition. Special features included expert knowledgeon features of conservation importance (e.g. Ramsar wetland status, extensive intactpeat wetlands, presence of rare plants and animals) as well as available spatial data onthe occurrence of threatened frogs and wetland-dependent birds. Wetland conditionwas modelled using the presence of artificial water bodies as well as by quantifying theamount of natural vegetation in and around the wetland (within 50 m, 100 m and 500 mof the wetland). Based on these factors, wetlands were ranked in terms of theirbiodiversity importance. <strong>Biodiversity</strong> targets for wetland ecosystems were met first inhigh-ranked wetlands, proceeding to lower ranked wetlands only if necessary.Although wetland condition was a factor in selection of wetland FEPAs, wetlands didnot have to be in a good condition to be chosen as a FEPA. Wetland FEPAs currentlyin a good ecological condition should be managed to maintain this condition.Thosecurrently in a condition lower than good should be rehabilitated to the best attainableecological condition.Estuary FEPAs are the national priority estuaries identified in the National <strong>Biodiversity</strong>Assessment 2011 (Van Niekerk and Turpie 2011). The functional zone for each estuaryis shown on the map, which includes the main channel or open water as well as thezone to which the estuary may expand during flood (guided largely by the 5 m coastalcontour line). Estuary FEPAs are shown on the map in the same way as wetland FEPAs,with turquoise outlines. The recommended ecological category for priority estuaries islisted in Van Niekerk and Turpie (2011).• Wetland cluster:Wetland clusters are groups of wetlands embedded in a relatively natural landscape.This allows for important ecological processes such as migration of frogs and insectsbetween wetlands. In many areas of the country, wetland clusters no longer existbecause the surrounding land has become too fragmented by human impacts.An orange outline is shown around groups of wetlands that belong to awetland cluster. Wetlands do not have to have FEPA status to belong to a wetlandcluster (although clusters with a high proportion of wetland FEPAs were favoured inidentifying wetland clusters).• Fish sanctuary and associated sub-quaternary catchment:Fish sanctuaries are rivers that are essential for protecting threatened and nearthreatened freshwater fish that are indigenous to South Africa. The associatedsub-quaternary catchment is marked with a red or black fish symbol onthe map. A red fish indicates that there is at least one population of a criticallyendangered or endangered fish species within that sub-quaternary catchment. A blackfish indicates the presence of vulnerable and near threatened fish populations. Somefish sanctuaries are FEPAs, with their associated sub-quaternary catchments shownin dark green; others are Fish Support Areas, with their associated sub-quaternarycatchments shown in medium green (see explanation of Fish Support Areas below).A goal of <strong>NFEPA</strong> is to keep further freshwater species from becoming threatened andto prevent those fish species that are already threatened or near threatened fromgoing extinct. In order to achieve this, there should be no further deterioration inriver condition in fish sanctuaries and no new permits should be issued for stockinginvasive alien fish in farm dams in the associated sub-quaternary catchment. Fishmanagement plans need to be developed for all fish sanctuaries to protect thefish they contain, with priority given to those fish sanctuaries containing criticallyendangered or endangered fish species (indicated by the red fish symbol on the map).These plans should address issues such as management of a particular stretch of riverhabitat within the sub-quaternary catchment, the construction of weirs to keep invasivealien fish species to a minimum (following an environmental impact assessment), andmanaging aquaculture and angling to ensure no further introduction of invasive alienfish species.• Fish Support Area and associated sub-quaternary catchment:Fish sanctuaries in a good condition (A or B ecological category) were identified asFEPAs, and the whole associated sub-quaternary catchment is shown in dark green. Theremaining fish sanctuaries in lower than an A or B ecological condition were identifiedas Fish Support Areas, and the associated sub-quaternary catchment is shown inmedium green. Fish Support Areas also include sub-quaternary catchments thatare important for migration of threatened or near threatened fish species – these arenot marked with a fish symbol.• Upstream Management Area:Upstream Management Areas, shown in very pale green, are sub-quaternarycatchments in which human activities need to be managed to prevent degradation ofdownstream river FEPAs and Fish Support Areas. Upstream Management Areas do notinclude management areas for wetland FEPAs, which need to be determined at a finerscale.• Phase 2 FEPA:Phase 2 FEPAs were identified in moderately modified rivers (C ecological category),only in cases where it was not possible to meet biodiversity targets for river ecosystemsin rivers that were still in good condition (A or B ecological category). River conditionof these Phase 2 FEPAs should not be degraded further, as they may in future beconsidered for rehabilitation once FEPAs in good condition (A or B ecological category)are considered fully rehabilitated and well managed. Phase 2 FEPAs and their associatedsub-quaternary catchments are shown in dark green with white dots.• Free-flowing river:Free-flowing rivers are rivers without dams. These rivers flow undisturbed from theirsource to the confluence with a larger river or to the sea. Dams prevent water fromflowing down the river and disrupt ecological functioning with serious knock-on effectsfor the downstream river reaches and users. Free-flowing rivers are a rare feature inthe South African landscape and part of our natural heritage.Free-flowing rivers are not shown on the FEPA maps, but are mapped separately (seeFigure 3.3 in Section 3.3). Nineteen flagship free-flowing rivers were identified basedon their representativeness of free-flowing rivers across the country, as well as theirimportance for ecosystem processes and biodiversity value. These flagship rivers shouldreceive top priority for retaining their free-flowing character. Flagship free-flowingrivers are listed in Table 3.1, and coded in the river shapefile on the <strong>NFEPA</strong> DVD.Freshwater Ecosystem Priority Area maps for Water Management Areas- 14 -
WMA 1LegendLIMPOPOTownSub-quaternary catchmentWater Management AreaSub-Water Management AreaRiverWetlandRiver FEPA & associatedsub-quaternary catchmentWetland or Estuary FEPAWetland ClusterFish Support Area & associatedsub-quaternary catchmentFish Sanctuary: critically endangered& endangeredFish Sanctuary: other threatenedPhase 2 FEPA & associatedsub-quaternary catchmentUpstream Management AreaMogalakwenaSandNzhelele/NwanedziLephalalaMatlabas/MokoloFreshwater Ecosystem Priority Area maps for Water Management Areas - 15 -
WMA 2LUVUVHU AND LETABALuvuvhu/MutaleLegendTownSub-quaternary catchmentWater Management AreaSub-Water Management AreaRiverWetlandRiver FEPA & associatedsub-quaternary catchmentWetland or Estuary FEPAWetland ClusterFish Support Area & associatedsub-quaternary catchmentFish Sanctuary: critically endangered& endangeredFish Sanctuary: other threatenedPhase 2 FEPA & associatedsub-quaternary catchmentUpstream Management AreaKlein LetabaShingwedziGroot LetabaLower LetabaFreshwater Ecosystem Priority Area maps for Water Management Areas - 16 -
WMA 3CROCODILE(WEST) AND MARICOLegendTownSub-quaternary catchmentWater Management AreaSub-Water Management AreaRiverWetlandLower CrocodileRiver FEPA & associatedsub-quaternary catchmentWetland or Estuary FEPAWetland ClusterFish Support Area & associatedsub-quaternary catchmentFish Sanctuary: critically endangered& endangeredFish Sanctuary: other threatenedPhase 2 FEPA & associatedsub-quaternary catchmentUpstream Management AreaMaricoApies/PienaarsElandsUpper MolopoUpper CrocodileFreshwater Ecosystem Priority Area maps for Water Management Areas- 17 -
WMA 4OLIFANTSLower OlifantsMiddle OlifantsLegendSteelpoortTownSub-quaternary catchmentWater Management AreaSub-Water Management AreaRiverWetlandRiver FEPA & associatedsub-quaternary catchmentWetland or Estuary FEPAWetland ClusterFish Support Area & associatedsub-quaternary catchmentFish Sanctuary: critically endangered& endangeredFish Sanctuary: other threatenedPhase 2 FEPA & associatedsub-quaternary catchmentUpstream Management AreaUpper OlifantsFreshwater Ecosystem Priority Area maps for Water Management Areas - 18 -
WMA 5INKOMATILegendSabieTownSub-quaternary catchmentWater Management AreaSub-Water Management AreaRiverWetlandCrocodileRiver FEPA & associatedsub-quaternary catchmentWetland or Estuary FEPAWetland ClusterFish Support Area & associatedsub-quaternary catchmentFish Sanctuary: critically endangered& endangeredFish Sanctuary: other threatenedPhase 2 FEPA & associatedsub-quaternary catchmentUpstream Management AreaKomati NorthKomati WestFreshwater Ecosystem Priority Area maps for Water Management Areas - 19 -
WMA 6USUTU TO MHLATUZEUpper UsutuLegendTownSub-quaternary catchmentWater Management AreaSub-Water Management AreaRiverWetlandRiver FEPA & associatedsub-quaternary catchmentWetland or Estuary FEPAWetland ClusterFish Support Area & associatedsub-quaternary catchmentFish Sanctuary: critically endangered& endangeredFish Sanctuary: other threatenedPhase 2 FEPA & associatedsub-quaternary catchmentUpstream Management AreaPongolaMfoloziSwazilandMhlatuzeMkuzeFreshwater Ecosystem Priority Area maps for Water Management Areas- 20 -
WMA 7THUKELALegendBuffaloTownSub-quaternary catchmentWater Management AreaSub-Water Management AreaRiverWetlandUpper TugelaRiver FEPA & associatedsub-quaternary catchmentWetland or Estuary FEPAWetland ClusterFish Support Area & associatedsub-quaternary catchmentFish Sanctuary: critically endangered& endangeredFish Sanctuary: other threatenedPhase 2 FEPA & associatedsub-quaternary catchmentUpstream Management AreaLower TugelaMooi/SundaysFreshwater Ecosystem Priority Area maps for Water Management Areas- 21 -
WMA 8UPPER VAALDownstream Vaal DamUpstream Vaal DamLegendWilgeTownSub-quaternary catchmentWater Management AreaSub-Water Management AreaRiverWetlandRiver FEPA & associatedsub-quaternary catchmentWetland or Estuary FEPAWetland ClusterFish Support Area & associatedsub-quaternary catchmentFish Sanctuary: critically endangered& endangeredFish Sanctuary: other threatenedPhase 2 FEPA & associatedsub-quaternary catchmentUpstream Management AreaFreshwater Ecosystem Priority Area maps for Water Management Areas - 22 -
WMA 9MIDDLE VAALMiddle VaalRhenoster/ValsSand/VetLegendTownSub-quaternary catchmentWater Management AreaSub-Water Management AreaRiverWetlandRiver FEPA & associatedsub-quaternary catchmentWetland or Estuary FEPAWetland ClusterFish Support Area & associatedsub-quaternary catchmentFish Sanctuary: critically endangered& endangeredFish Sanctuary: other threatenedPhase 2 FEPA & associatedsub-quaternary catchmentUpstream Management AreaFreshwater Ecosystem Priority Area maps for Water Management Areas - 23 -
WMA 10LOWER VAALLegendTownSub-quaternary catchmentWater Management AreaSub-Water Management AreaRiverWetlandRiver FEPA & associatedsub-quaternary catchmentWetland or Estuary FEPAWetland ClusterFish Support Area & associatedsub-quaternary catchmentFish Sanctuary: critically endangered& endangeredFish Sanctuary: other threatenedPhase 2 FEPA & associatedsub-quaternary catchmentUpstream Management AreaMolopoHartsVaal Downstream/BloemhofFreshwater Ecosystem Priority Area maps for Water Management Areas - 24 -
WMA 11MVOTI TO UMZIMKULUMvotiLegendMgeniTownSub-quaternary catchmentWater Management AreaSub-Water Management AreaRiverWetlandUmzimkuluMkomaziCoastal MvotiRiver FEPA & associatedsub-quaternary catchmentWetland or Estuary FEPAWetland ClusterFish Support Area & associatedsub-quaternary catchmentFish Sanctuary: critically endangered& endangeredFish Sanctuary: other threatenedPhase 2 FEPA & associatedsub-quaternary catchmentUpstream Management AreaCoastal MvotiFreshwater Ecosystem Priority Area maps for Water Management Areas - 25 -
WMA 12MZIMVUBU TO KEISKAMMAMzimvubuKeiMbasheMtataWild CoastLegendTownSub-quaternary catchmentWater Management AreaSub-Water Management AreaRiverWetlandRiver FEPA & associatedsub-quaternary catchmentWetland or Estuary FEPAWetland ClusterFish Support Area & associatedsub-quaternary catchmentFish Sanctuary: critically endangered& endangeredFish Sanctuary: other threatenedPhase 2 FEPA & associatedsub-quaternary catchmentUpstream Management AreaAmatolaFreshwater Ecosystem Priority Area maps for Water Management Areas - 26 -
WMA 13UPPER ORANGERiet/ModderLesothoSenqu LesothoCaledon LesothoVanderkloofLegendKraaiTownSub-quaternary catchmentWater Management AreaSub-Water Management AreaRiverWetlandRiver FEPA & associatedsub-quaternary catchmentWetland or Estuary FEPAWetland ClusterFish Support Area & associatedsub-quaternary catchmentFish Sanctuary: critically endangered& endangeredFish Sanctuary: other threatenedPhase 2 FEPA & associatedsub-quaternary catchmentUpstream Management AreaFreshwater Ecosystem Priority Area maps for Water Management Areas - 27 -
WMA 14LOWER ORANGELegendTownSub-quaternary catchmentWater Management AreaSub-Water Management AreaRiverWetlandRiver FEPA & associatedsub-quaternary catchmentWetland or Estuary FEPAWetland ClusterFish Support Area & associatedsub-quaternary catchmentFish Sanctuary: critically endangered& endangeredFish Sanctuary: other threatenedPhase 2 FEPA & associatedsub-quaternary catchmentUpstream Management AreaCoastal OrangeOrangeOrange TributariesFreshwater Ecosystem Priority Area maps for Water Management Areas - 28 -
WMA 15FISH TO TSITSIKAMMALegendFishTownSub-quaternary catchmentWater Management AreaSub-Water Management AreaRiverWetlandGamtoosSundaysRiver FEPA & associatedsub-quaternary catchmentWetland or Estuary FEPAWetland ClusterFish Support Area & associatedsub-quaternary catchmentFish Sanctuary: critically endangered& endangeredFish Sanctuary: other threatenedPhase 2 FEPA & associatedsub-quaternary catchmentUpstream Management AreaBushmansAlgoaTsitsikammaFreshwater Ecosystem Priority Area maps for Water Management Areas- 29 -
WMA 16LegendGOURITZTownSub-quaternary catchmentWater Management AreaSub-Water Management AreaRiverWetlandRiver FEPA & associatedsub-quaternary catchmentWetland or Estuary FEPAWetland ClusterFish Support Area & associatedsub-quaternary catchmentFish Sanctuary: critically endangered& endangeredFish Sanctuary: other threatenedPhase 2 FEPA & associatedsub-quaternary catchmentUpstream Management AreaGamkaGrootOlifantsCoastal GouritzGouritzFreshwater Ecosystem Priority Area maps for Water Management Areas- 30 -
WMA 17OLIFANTS/DOORNSandveldKnersvlakteOlifants DKoue BokkeveldDoringLegendTownSub-quaternary catchmentWater Management AreaSub-Water Management AreaRiverWetlandRiver FEPA & associatedsub-quaternary catchmentWetland or Estuary FEPAWetland ClusterFish Support Area & associatedsub-quaternary catchmentFish Sanctuary: critically endangered& endangeredFish Sanctuary: other threatenedPhase 2 FEPA & associatedsub-quaternary catchmentUpstream Management AreaFreshwater Ecosystem Priority Area maps for Water Management Areas- 31 -
WMA 18BREEDELegendTownSub-quaternary catchmentWater Management AreaSub-Water Management AreaRiverWetlandUpper BreedeRiver FEPA & associatedsub-quaternary catchmentWetland or Estuary FEPAWetland ClusterFish Support Area & associatedsub-quaternary catchmentFish Sanctuary: critically endangered& endangeredFish Sanctuary: other threatenedPhase 2 FEPA & associatedsub-quaternary catchmentUpstream Management AreaRiviersonderendLower BreedeOverberg WestOverberg EastFreshwater Ecosystem Priority Area maps for Water Management Areas- 32 -
WMA 19BERGLegendTownSub-quaternary catchmentWater Management AreaSub-Water Management AreaRiverWetlandRiver FEPA & associatedsub-quaternary catchmentWetland or Estuary FEPAWetland ClusterFish Support Area & associatedsub-quaternary catchmentFish Sanctuary: critically endangered& endangeredFish Sanctuary: other threatenedPhase 2 FEPA & associatedsub-quaternary catchmentUpstream Management AreaLower BergUpper BergGreater Cape TownFreshwater Ecosystem Priority Area maps for Water Management Areas - 33 -
Part 3: National mapproducts3.1 Density of Freshwater Ecosystem PriorityAreas per Water Management AreaThis part of the atlas presents six national maps that show:3.1 Density of FEPAs per Water Management Areacalculated as the percentage of the total area of thatWater Management Area that has been identified as aFEPA or associated sub-quaternary catchment3.2 Density of FEPAs per sub-Water Management Areacalculated as the percentage of the total area of thatsub-Water Management Area that has been identified as aFEPA or associated sub-quaternary catchment3.3 Free-flowing rivers of South Africa, or rivers withoutdams that flow undisturbed from their source to theconfluence with a larger river or to the sea3.4 Fish sanctuaries for threatened and near threatened fishspecies indigenous to South Africa3.5 High water yield areas, which are sub-quaternarycatchments where mean annual runoff is at least threetimes more than the average for the related primarycatchment3.6 High groundwater recharge areas, which are subquaternarycatchments where groundwater recharge is atleast three times more than the average for the relatedprimary catchmentCaroline GelderblomFreshwater biodiversity is not evenlydistributed across the country; some WaterManagement Areas have a higher densityof FEPAs than others, and thus moreresponsibility for meetingnational freshwater ecosystem goals.Figure 3.1 shows the proportion of each Water Management Area identified as a FEPA,calculated as the percentage of the total area of that Water Management Area that hasbeen identified as a FEPA or associated sub-quaternary catchment. This map shows thatsome Water Management Areas (those that are darker in colour) have more FEPAs to lookafter than others. However, lighter coloured Water Management Areas still have FEPAs toprioritise, just not as many. An important policy question is how we can support WaterManagement Areas with a high proportion of FEPAs in achieving our national freshwaterecosystem goals.The proportion of each Water Management Area made up of FEPAs varies from 10% in theBerg Water Management Area to 38% in the Thukela. This variability is a consequence ofriver and wetland ecosystem heterogeneity and fish species distribution. For example, theInkomati and Usutu to Mhlathuze Water Management Areas have high river ecosystemheterogeneity, and therefore a high proportion of FEPAs (32 and 33% respectively).The proportion of FEPAs in each Water Management Area is also influenced by rivercondition, because only rivers that are still in good condition (A or B ecological category)can be chosen as FEPAs. For example, the Crocodile (West) and Marico and Olifants WaterManagement Areas have high river ecosystem heterogeneity, but there are no longersufficient rivers in a good condition to meet biodiversity targets for river ecosystems,reducing the number of FEPAs identified. The small proportion of FEPAs identified in theseWater Management Areas are generally the only ones left in a good condition. This meansthat FEPAs in low density Water Management Areas are no less important than those in highdensity areas. In fact, in cases where low density of FEPAs results from poor condition ofrivers and wetlands, the FEPAs that have been identified are arguably more important.National map products - 34 -
% Area of WMA selected as FEPA10213012143338202313373823243321 1820102218500 kmFigure 3.1: Density of Freshwater Ecosystem Priority Areas per Water Management AreaNational map products - 35 -
3.2 Density of Freshwater Ecosystem PriorityAreas per sub-Water Management AreaEach Water Management Area is divided into several sub-Water Management Areasbroadly based on the catchments of large tributaries within the Water Management Area.Figure 3.2 shows the proportion of each sub-Water Management Area identified as aFEPA, calculated as the percentage of the total area of that sub-Water Management Areaidentified as a FEPA or associated sub-quaternary catchment.% Area of sub-WMA selected as FEPA1The map shows that even within Water Management Areas, freshwater biodiversity is notevenly distributed. This has important implications for the development of CatchmentManagement Strategies, which often use sub-Water Management Areas in the catchmentvisioning process, and are often managed and implemented at sub-Water ManagementArea level. Sub-Water Management Areas are also often the level at which water userforums operate.60500 kmFigure 3.2: Density of Freshwater Ecosystem Priority Areas per sub-Water Management AreaNational map products - 36 -
3.3 Free-flowing riversA free-flowing river is a long stretch of river that has not been dammed. A freeflowingriver flows undisturbed from its source to the confluence with another largeriver or to the sea. Today there are very few large rivers that remain undammed,or ‘free flowing’. Free-flowing rivers are rare features in our landscape and animportant part of our natural heritage. They offer considerable social, economicand conservation value, supporting the livelihoods of people in the catchment. Poorrural populations with close livelihood links to the river are likely to be impactedmost and benefit least from dams. As discussed in Section 1.2, water flowing out tosea is not wasted but plays an important role in securing a range of estuarine andmarine ecosystem services.Opportunities for conserving free-flowing rivers are fast disappearing with thegrowing demand for development of water resources. While acknowledging theimportance of developing water resources, there is also an urgent need to identifysome free-flowing rivers that can serve as a representative set of our country’s lastremaining free-flowing rivers, and to maintain their free-flowing character.Free-flowing rivers are rivers withoutdams – a rare feature in the South Africanlandscape. Dams prevent water from flowingdown the river and disrupt ecologicalfunctioning with serious knock-on effectsfor the downstream river reaches and users.Nineteen flagship free-flowing rivers havebeen identified. Their free-flowing charactershould be maintained and they shouldremain in a good condition in order toconserve a representative sample of ourheritage.Table 3.1: Free-flowing rivers of South Africa. River names in blue are flagship free-flowingrivers that are top priorities for retaining their free-flowing character. Rivers arelisted from west to east.Eastern CapeRietKapMpekweniMgwalanaKobonqabaiNxaxoQhorha & tributaries*ShixiniNqabarha*NtlonyaneXora*MncwasaMdumbiMtakatye*MnenuSinangwanaMngazanaMntafufuMzintlavaMkoziMsikaba*Mtentu*SikombeMpahlaneMzamba*Mtamvuna & tributaries*Kraai & tributaries** Free-flowing rivers longer than 100 kmKwaZulu-NatalMzimkhulu*MzumbeMpambanyoni*aMahlongwaaMahlongwanaMkomazi & tributaries*Nsuze* (tributary of Thukela)Matigulu & tributaries*Black Mfolozi & tributaries*NsongeNondweniNgogoMfule*Nyalazi*Mkuze & tributaries*MpumalangaNtombe (tributary ofPhongolo)Hlelo*Upper Vaal*Elands*MbyamitiNwanedzi-Sweni*LimpopoMutale-Luvuvhu*MohlapitseNorthern CapeUpper Sak, Klein-Sak &tributaries*NorthWestUpper Groot-MaricoWestern CapeDoring & tributaries*Klaas JaagersRooielsTouwsKaratara-HoekraalHomtiniKnysnaBietou-PalmietGrootBloukransThere are 62 free-flowing rivers in South Africa, of which only 25 are longerthan 100 km (Figure 3.3; Table 3.1). This constitutes only 4% of the length onthe 1:500 000 river network <strong>GIS</strong> layer. Acknowledging that not all of theseare likely to remain free flowing in the light of development needs andobjectives, 19 of the 62 free-flowing rivers have been identified as flagshipfree-flowing rivers. These flagships were identified based on their representativenessof free-flowing rivers across the country, as well as their importancefor ecosystem processes and biodiversity value. These flagship rivers shouldreceive top priority for retaining their free-flowing character. See pages 37-41for stories of selected flagship free-flowing rivers.The upper Groot Marico River inthe North West province is the onlyfree-flowing river representative ofthe entire north-western region ofthe country. The Eastern Cape andKwaZulu-Natal have the highestnumbers of free-flowing rivers, severalof which are short coastal rivers.River reaches satisfying all of the following requirements were selected as freeflowingrivers:• Permanent or seasonally flowing rivers. Rivers that do not flow every year(ephemeral rivers) were not considered.• Rivers in good condition (A or B ecological category).• No dam in the channel throughout its length. This assessment used 1:50 000farm dams (Department of Land Affairs: Chief Directorate Surveys and Mapping2005-2007). Data constraints prevented consideration of farm dams built after2005, as well as weirs. The Upper Vaal and Upper Marico rivers were specialcases where the long stretch of river flowing freely from source to dam wasconsidered free flowing.• Length ≥ 50 km for inland rivers, with no length threshold for coastal rivers.Ernst SwartzNational map products - 37 -
The Eastern Cape and KwaZulu-Natal provinces have the highest number of freeflowingrivers in the country (Table 3.1). Many of these rivers will undoubtedlylose their free-flowing status as these provinces urgently require development ofwater resources to improve water supply to households and agriculture. Flagshipfree-flowing rivers should receive top priority for maintaining their dam-freestatus. The provinces of Gauteng and Free State have no remaining free-flowingrivers. Rivers of the Free State tend to be dry rivers that can go for years withoutflowing; thus, the lack of free-flowing rivers for this region is natural. The lack offree-flowing rivers in the Gauteng province is indicative of rivers working hard tomeet the demands of the largest economic hub of the country – representationof freshwater ecosystems within this region often needs to be sought outsideGauteng in the North West province. This emphasises the immense importance ofthe upper Groot-Marico River, which is the only free-flowing river representativeof the entire north-western region of the country (see narrative on the Groot-Marico River on page 40 below).Free-flowing riversFlagshipsMohlapitseMutaleWhere free-flowing rivers have to be dammed, there are some simple measuresthat can be put in place to mitigate the worst effects of the dams. These include:• undertaking comprehensive environmental flow assessments prior to damconstruction to understand and mitigate the consequences of the dam on thesocial, economic and ecological environments;• designing dams that allow for environmental flow releases; and• constructing passages for fish to by-pass the dam wall.Groot-MaricoUpperElandsNtombeMkuzeBlack MfoloziNsuzeMzimkhuluKraaiMtamvunaSakMtentuMtakatyeNqabarhaDoringKobonqaba460 kmRooielsGrootFigure 3.3: Free-flowing rivers of South Africa. River names are given for the flagship free-flowing rivers. Stories of selected flagship free-flowing riversare provided on pages 37-41.National map products - 38 -
The Mtentu River: An ecotourism assetThe Doring River: Keeping farmers in businessThe Amadiba community of the Mtentu River on the Wild Coast in the Eastern Cape Provinceare well known for protecting and valuing their free-flowing river, the water it provides and thesurrounding environment.The natural beauty of the Mtentu landscape makes it an attraction to tourists who are trying toescape the hustle of cities or more heavily populated tourist areas. Self-catering accommodation,campsites, and guest houses offer tourists a base to experience nature, canoeing, other watersports, hiking, horse riding, and bird and animal watching at its best. The Mkambati NatureReserve is an 8 000 ha coastal reserve flanked by the forested ravines of the Msikaba and Mtenturivers. For plant lovers, this place is special as it is the only one in the world where the PondoCoconut is naturally found. Nearby is the Mkambati Marine Protected Area, which extends sixnautical miles seawards between the eastern bank of the mouth of the Mtentu River and thewestern bank of the mouth of the Msikaba River. This protected area is alive with fish, otters,sharks and other marine life. It is also special for bird lovers, as the endangered Cape Griffonvultures have important nesting sites on the cliffs of the Mtentu and Msikaba gorges.An interesting aspect of many of the tourism initiatives in the area is that they are intentionallygeared towards being ecologically sensitive, and community based. This implies including localcommunities in the development, management and running of the tourism initiatives of thearea and ensuring that direct economic benefit is guaranteed for the communities. Ecotourismprojects that offer hiking, horse-riding, canoeing and communal living are examples of this sortof pro-poor, eco-friendly tourism opportunity in the area.The free-flowing Mtentu River is a node of ecotourismactivity on the Wild Coast. Pro-poor, eco-friendly tourismopportunities in the area offer long term prospects forsocial and economic development, so needed in theEastern Cape Province.From its origins in the majestic Hex River Mountains, the Doring River windsits way through the Cederberg and joins the heavily utilised Olifants River atKlawer in the Western Cape. The Doring is currently free flowing for200 km, making it the second longest free-flowing river in the country.Maintaining the free-flowing nature of the Doring is critical for variousreasons. To start with, a free-flowing and relatively pristine Doring Riverenables greater economic productivity for the Olifants River. Currently theOlifants River is heavily used for activities such as fruit farming, herding ofgoats and sheep, rooibos farming, and salt panning. In order to increasethe economic productivity of this river, the Olifants Dam wall needs to beraised by 15 m to increase its storage capacity. Such development comeswith severe ecological impacts and reduction of stream flow, particularlyimpacting on the area downstream of the dam where there are numerousgrape farms. However, if the Doring River is kept healthy and free flowing,its natural flow and sediment actually replenishes the health of the OlifantsRiver below the dam, thus keeping downstream farmers in business and thesensitive Olifants River estuary in an acceptable state of health.If the Doring River is kept healthyand free-flowing, its natural flowand sediment replenishes the healthof the Olifants River, thus keepingdownstream farmers in businessThe Doring River is abuzz with tourist activities, ranging from guesthouses, to hiking trails, to river rafting, to nature reserves which boastsights like the spectacular Nieuwoudtville Falls. Wouter Groenewald,the director of a prominent rafting company on the river, says that hehas been taking groups of people down the river for the last 22 years.During this time tourists navigate the river by day, sleep on its banksby night, drink from the river and experience magnificent nature at itsbest. Tours are only run during the winter rainy season. Groenewald saysthat any upstream damming severely impacts on the flow of the waterin the lower part of the river where they operate. It is also critical tohis business that the river is clean, in order to ensure the health of hiscustomers.Over and above the economic benefits that the Doring has, it is alsoa critical water source for specific communities and families. Thesepeople depend on the seasonal winter flows of the river to sustainsubsistence farms which exist in the otherwise harsh climate of theDoring River valley. It also forms part of a southern African fish“hotspot” – all indigenous fish are unique to the region and, accordingto global standards, are highly threatened.The beauty of the Mtentu River and its surrounds should not be taken for granted. Since 2007the area has been faced with several controversial prospecting and mining applications forheavy minerals. The mining companies and Department of Mineral Resources have arguedin favour of mining in the area, suggesting that it will bring greater economic revenue andjobs to the communities of the Mtentu. There has been a powerful community level and civilsociety reaction to these claims. A variety of coalitions including the Sustaining the Wild CoastCampaign, the Amadiba Crisis Committee, a group of Wild Coast sangomas, human rightsattorney Richard Spoor, and others have publicly opposed the mining. They argue that thenumber of jobs created will be small, and that mining will destroy the eco-tourism industry inthe area, damage the rich biodiversity of the Mtentu and surrounds, uproot communities fromtheir homes and livelihoods, and reduce longer term economic prospects, which are closelydependent on and tied to the relatively pristine environment.Cleary the people of the Mtentu river and its surrounds are well aware of the precious piece ofenvironment that they inhabit. With this awareness in place the community should have the willto respond to new challenges emerging in the area.Doring RiverRika du PlessisNational map products - 39 -
The upper Groot Marico River: the last remaining freeflowingriver in the north-western regions of the countryThe Mutale River: At the heart of the VhaVendapeople’s livelihoods and spiritualityThe communities of the Upper Groot Marico River in the North West Province know the worthof their river. In what is otherwise a semi-arid region, this river is literally the life source for thecommunities of the area. Over and above providing clean drinking water, the river supportsa variety of activities including traditional rituals, full-time farming, weekend farming, naturereserves, tourism activities, and private weekend getaways. However, the Marico meets morethan just practical needs of its communities. It is a source of the region’s spirituality, identityand sense of community. Peter Phefo, a Koffiekraal municipal representative and communitymember, says “We call our river Madikeweni”, which means the coming together of differentgroups of people. Similarly, Daan van der Merwe, chair of the Marico Catchment ConservationAssociation says, “The Groot Marico River is our ‘lewensaar’ (our main artery). It binds us alltogether as communities.”In response to concerns about ongoing nickel mining applications in the Marico area, alongwith a growing body of science illustrating the importance of keeping this biologically uniqueriver in a healthy state, communities and landowners have gathered together to form variousactivist groups and associations.One such group, called MMutlwa wa Noko (thorn of the porcupine), works to oppose miningapplications which it believes will damage the river and surrounds. It is made up of a diversegroup of community members from the Marico town and downstream rural areas such asKoffiekraal. The group’s coordinator, Brian Sheer, points out that the name ‘thorn of theporcupine’ has been chosen to symbolise that the threat posed by mining applications is“not a black or white issue, but a black and white issue,” just like the porcupine quill itself.Collaboration between all communities of the Groot Marico River is essential in tackling thisissue.The Mutale River valley rests within the former ‘homeland’ of VhaVenda, inthe far north of Limpopo Province. The VhaVenda people depend directlyon the rivers and lakes for their daily water supply due to minimal waterinfrastructure being available in the area. Even where there are taps orboreholes, community members complain of the water being too salty orthe taps being unreliable and thus still resort to fetching water directlyfrom the river. Clearly, given the direct dependence of these communitieson the water supply, the health and quality of the water directly impactson the well-being of the Venda people.The main form of land use in the Mutale river valley is subsistence farming.There is also a modest tourism industry around the river providingaccommodation en route to the Kruger Park via the Punda Maria or Pafurigates. Also Makuya Park, on communally-owned land, is now linked to theKruger National Park.The Mutale River supports one of onlya handful of natural freshwater lakesin South Africa, Lake Fundudzi. TheLake is a sacred site believed to be thedwelling place of the ancestral spirits.Local communities protect thesacred rites of the lake.To the Venda people, water is more than a practicality; it is also intrinsicallytied to the spiritual life of some of the communities. One of the mostsignificant sacred sites is Lake Fundudzi, which lies on the Mutale River.There are many rituals connected with Lake Fundudzi, one of only ahandful of natural freshwater lakes in South Africa. There is a legend thata python god lives in the lake and cares for the crops. In order to pleasethe python, the community pours sacrificial beer, which is brewed by thechief’s sister, onto the water. The lake is also believed to be the dwellingplace of the ancestral spirits of the Vhatavhatsindi people. The guardian ofthe lake is Chief Netshiavha. He discourages all foreigners from going tothe lake unless accompanied by a local who knows the proper formalitiesfor approaching the lake. Terrible things are believed to happen to thosewho do not respect the sacred rites of the lake.Keeping the Mutale River free flowing and in a good ecological conditionhelps supply good quality water to dependent local communities, andsupports the conservation of our cultural heritage.The upper Groot Marico River is the last remainingfree-flowing river in the semi-arid north-western regionsof the country. Diverse communities dependent on theriver have been brought together in response to miningapplications that threaten water quality and quantity.The Marico Catchment Conservation Association is another group formed to protect theriver. Currently there are 70 landowners who are part of this group which spans an area ofapproximately 25 000 ha upstream of the Marico Bosveld Dam. All members of the associationhave applied for conservancy status for their land and many are in the process of applyingfor protected environment or nature reserve status too. In the longer term it could beincorporated into a transfrontier conservation area with Botswana, given the dependence thatGabarone has on the river for water. The Marico Catchment Conservation Association aims toconserve the natural, cultural and historical assets of the Groot Marico. Their objectives are toconserve the river, promote sustainable development and encourage research on their riversystem and its related environment, given the unique ecological nature of the river and itsrelatively pristine state.Marius ClaassenChair of the association, Daan van der Merwe, says that the people of the Marico are rallying toprotect their river because “it is morally and ethically the right thing to do. We are moving awayfrom being just consumers to also being preservers of our river”.Mutale RiverNational map products - 40 -
The Elands River: A unique biodiversity haven and a life linefor its peopleThe Elands River arises on the grassland plateau of the Drakensberg mountains nearMachadodorp, flows downstream until it reaches the Crocodile River in MpumalangaProvince, which links with the Inkomati River that flows across the Mozambican borderand eventually meets the Indian Ocean.Here we have a river that both South Africa and Mozambique are dependent on to ensurethat water quality and quantity needs are met for drinking and other uses. For example,the Crocodile River, into which the Elands River flows, is a major supplier of drinking waterto the town of Nelspruit. The good water quality and quantity of the Elands River helps todilute pollutants in the more heavily used Crocodile River.The Elands River is also a haven for biodiversity in South Africa. Concerned landowners,registered water users, aquatic biologists from the University of Johannesburg and theUniversity of the North, local and national public organisations such as MpumalangaTourism and Parks Agency, the Free State Nature Reserve, and CapeNature, as well as theResource Quality Service specialists from the Department of Water Affairs, are all wellaware of the special nature of this river. This is illustrated by the formation of the ElandsRiver Conservancy which includes a number of landowners. More recently, in 2004, theElands River Yellowfish Conservation Area (ERYCA) was also established.The Elands River helps to provide good qualitydrinking water to downstream towns andusers, for example in Nelspruit and even inMozambique. With a beautiful waterfall at eachend, it is a refuge for many threatened fish whichcould become a major draw card for angling iftheir populations are restored.The Mzimkulu River: Valued from source to seaThis free-flowing river of KwaZulu-Natal arises in the Drakensberg Mountainsand flows downstream to meet the ocean at Port Shepstone. Mzimkulu means“home of all rivers” and considering the rich cultural history surrounding theriver it is clearly also “home to all people” such as the early Khoi and San, theNguni, and the Zulu people; the English, German and Norwegian settlers; andmore recently a range of landowners, rural communities and tourists.The water quality of the Mzimkulu, from its source in the mountains to the seais excellent, with the primary impact on the river being the reduction of waterquantity for farming and other activities. Much of the activity along this riverdepends on its natural state.The Mzimkulu River, from its source inthe mountains to the sea, is in excellentcondition. Much of the activity alongthis river depends on its natural state,including dairy farming, tourism andthe fastest growing canoe race in thecountry.At its source the Mzimkulu lies within the uKhahlamba-Drakensberg Park,which is a World Heritage Site. The area owes this prestigious status to its rarerock paintings, the natural beauty of its basaltic buttresses, sandstone ramparts,high-altitude grasslands, pristine river valleys and gorges, and the resultant habitatswhich provide a home for numerous endemic and globally threatened species ofbirds and plants.The upper to middle part of the river is used for irrigation and dairy farming, bothof which benefit from the good quality of the water. In the lower reaches of theriver many communities depend on the water for subsistence farming livelihoods.At Port Shepstone, the Mzimkulu reaches the ocean in a relatively natural statemaking it one of the few healthy freshwater systems meeting the ocean along thiscoastline.All along the river there is vibrant tourist activity. From hikers drinking puremountain water to multiple secluded riverside resorts, bed and breakfasts andretreats. The river draws hoards of people who use it for swimming, canoeing,boating, fishing and skiing. For canoeing enthusiasts this river is home for thefastest growing race in the country. The “Drakensberg Challenge”, with a Zuluslogan “Abanganlovalu” (not for the faint-hearted), runs on this river because of itsnatural state, and the fact that it is unhindered by dams.By keeping the Mzimkulu in a free-flowing, natural state the river remains ableto offer this broad basket of opportunities to the communities and farmers ofthe Mzimkulu. This also provides a natural reference site to use for studying theecology of South African rivers.ERYCA is an active conservation initiative which aims to conserve a 60 km segment of theElands River which is isolated between two waterfalls – the Waterval-Boven and LindenauFalls. These falls act as natural barriers which have caused a unique array of aquaticorganisms to evolve here alone. The particular conservation focus is on Bushveld smallscaleyellowfish which are found only in this river. If this unique population of fish canbe restored to 1980s levels, it would become a major draw card for angling, one of thelargest sporting industries in South Africa. ERYCA also has the potential to support the reintroductionof the highly threatened Inkomati rock-catlet to the area.Managing the environment of Mpumalanga presents complex challenges. The upper partof the Elands River, for example, has been noted for its rich coal deposits. Mining in thisecologically sensitive area would have huge impacts on water quality and quantity in thearea. Having an active and aware community, working together with other stakeholders,will help promote good planning and decision-making to ensure that the Elands Rivermaintains its free-flowing character, and continues to support water quality and quantityneeds in the region.Brian CollotyMtamvuna RiverNational map products- 41 -
3.4 Fish sanctuariesFish sanctuaries are rivers and associatedsub-quaternary catchments that areimportant for protecting threatened andnear threatened fish species indigenous toSouth Africa. At least one third of SouthAfrica’s indigenous freshwater fish speciesare threatened. The Inkomati and Olifants/Doorn Water Management Areas are‘hotspots’ of threatened fish species.Number of threatened or near threatened fishspecies in each sub-quatenary catchment123-7Fish sanctuaries are rivers and their associated sub-quaternary catchments that areessential for protecting threatened and near threatened freshwater fish that areindigenous to South Africa (Table 3.2). These include large angling species like yellowfishas well as small fish like redfins.Figure 3.4 shows the number of threatened and near threatened fish species within eachfish sanctuary, ranging from one to as many as seven species. A goal of <strong>NFEPA</strong> is to keepfurther freshwater species from becoming threatened and to prevent those fish speciesthat are already threatened from going extinct. In order to achieve this, there should beno further deterioration in river condition in fish sanctuaries and no new permits shouldbe issued for stocking invasive alien fish in farm dams in the associated sub-quaternarycatchments. Fish management plans need to be developed in all fish sanctuaries toprotect the fish they contain. These plans should address issues such as managementof a particular stretch of the river habitat within the sub-quaternary catchment, theconstruction of weirs to keep invasive alien fish species to a minimum (following anenvironmental impact assessment), and managing aquaculture and angling to ensure nofurther introduction of invasive alien fish species.Invasive alien fish such as trout and bassshould not be introduced or stocked insub-quaternary catchments that have beenidentified as fish sanctuaries, whether forangling or aquaculture.500 kmThe IUCN Red List of threatened fish species (http://www.iucnredlist.org/initiatives/freshwater) was used as a starting point for identifying threatened and near threatenedfish species in South Africa, which included those that are critically endangered,endangered, vulnerable and near threatened (Table 3.2). Those species classified by theIUCN as data deficient but deemed by South African fish biologists to be threatened,were also included. In addition, some species contain several distinct lineages andrequire taxonomic updating that will split them into several species, e.g. Galaxiaszebratus may well be split into ten species. These were considered as separate lineagesand each lineage was treated similarly to threatened species.Figure 3.4: Fish sanctuaries for threatened and near threatened freshwater fish species indigenous to South AfricaCritically endangered redfinNational map products - 42 -Ernst Swartz
For species and species lineages considered critically endangered orendangered, a target of 100% of all confirmed existing populations wasset. For vulnerable and near threatened species and species lineages, atarget of ten populations was set (or maximum confirmed populations iffewer than ten exist), coinciding wherever possible with sub-quaternarycatchments selected for critically endangered and endangered species,and species lineages. The target of ten populations was derived fromthe IUCN criteria for conservation status which specify that as soon as aspecies drops below ten populations it becomes endangered (IUCN 2001).Fish point locality data from SAIAB and the Albany Museum were usedto guide selection of rivers and associated sub-quaternary catchmentsthat would serve as fish sanctuaries for each species. This database wassupplemented with expert knowledge from experienced fish biologistsin different regions of the country. Historical records that are no longervalid (owing to local extinctions) were excluded from consideration. Fishsanctuary maps were identified for each species, with three possiblecategories:• Fish sanctuaries: These are rivers and associated sub-quaternarycatchments required to meet threatened and near threatened fishpopulation targets. Fish sanctuaries in a good condition (A or Becological category) were selected as FEPAs, and the remaining onesbecame Fish Support Areas. Fish sanctuaries are shown on the FEPAmaps with a fish symbol (see Part 2 of this atlas). A red fish denotesa fish sanctuary that contains at least one critically endangered orendangered population; the remaining fish sanctuaries are shown witha black fish.• Fish migration areas: These cater for large migratory fish that requireconnectivity between certain habitats, usually between mainstem andtributary habitat. Fish migration areas are shown as Fish Support Areason the FEPA maps, but differ from fish sanctuaries in that they do notcontain a fish symbol (see Part 2 of this atlas).• Fish upstream management areas: These are rivers and associatedsub-quaternary catchments in which human activities need to bemanaged to prevent degradation of downstream fish sanctuariesand fish migration areas. All fish upstream management areas areidentified on the FEPA maps either as Upstream Management Areas, orin some cases as FEPAs if they were also required for representing riverecosystem types.Table 3.2: Freshwater fish species for which fish sanctuaries were explicitly identified. Species marked with an asterisk require taxonomic updating as recent research shows thatthey contain several distinct linrefined by regional fish biologists tocritically endangered (CR), endangered (EN) and vulnerable (VU) – were included. Species classified as data deficient (DD) by IUCN, but which contain several distinctlineages that are considered threatened were also included, as well as near threatened species (NT).Genus Species Common name IUCN Status Genus Species Common name IUCN StatusAmphilius natalensis* Natal mountain catfish DDClarias theodorae Snake catfish LCAustroglanis barnardi Spotted rock catfish ENGalaxias zebratus* Cape Galaxias DDAustroglanis gilli Clanwilliam rock catfish VUHydrocynus vittatus Tigerfish LCAustroglanis sclateri Rock catfish LCKneria auriculata Southern kneria CRBarbus amatolicus Amatole barb VULabeo seeberi Clanwilliam sandfish ENBarbus andrewi Witvis ENLabeo umbratus Moggel LCBarbus anoplus* Chubbyhead barb DDLabeobarbus capensis Clanwillliam yellowfish VUBarbus brevipinnis Shortfin barb NTOpsaridium peringueyi Southern barred minnow LCBarbus calidus Clanwilliam redfin VUOreochromis mossambicus Mozambique tilapia NTBarbus erubescens Twee River redfin CRPseudobarbus afer* Eastern Cape redfin NTBarbus hospes Namakwa barb LCPseudobarbus asper Smallscale redfin ENBarbus lineomaculatus Line-spotted barb VUPseudobarbus burchelli* Burchell’s redfin CRBarbus motebensis Marico barb VUPseudobarbus burgi* Berg River redfin ENBarbus pallidus* Goldie barb DDPseudobarbus phlegeton* Fiery redfin CRBarbus serra Sawfin ENPseudobarbus quathlambae* Maloti redfin ENBarbus sp. “Banhine” Banhine barb CRPseudobarbus tenuis* Slender redfin NTBarbus sp. “Ohrigstad” Ohrigstad barb DDSandelia bainsii Eastern Cape rocky ENBarbus sp. “Waterberg” Waterberg barb NTSandelia capensis* Cape kurper DDBarbus treurensis Treur River barb ENSerranochromis meridianus Lowveld largemouth ENBarbus trevelyani Border barb ENSilhouetta sibaya Sibayi goby ENChetia brevis Orange-fringed river bream ENVaricorhinus nelspruitensis Incomati chiselmouth NTChiloglanis bifurcus Incomati suckermouth ENDescription of IUCN categoriesCR Critically Endangered Facing an extremely high risk of extinction in the wildEN Endangered Facing a very high risk of extinction in the wildVU Vulnerable Facing a high risk of extinction in the wildNT Near Threatened Likely to qualify as CR, EN or VU in the near futureDD Data Deficient Inadequate information to make an assessment of its risk of extinctionLC Least Concern Not threatenedFish sanctuaries for every threatened and near threatened species werecombined and the number of threatened fish populations within eachsub-quaternary catchment was calculated to derive Figure 3.4. A list ofthreatened and near threatened fish that occur within any particularfish sanctuary can be obtained from the <strong>NFEPA</strong> DVD, either by queryingthe fish sanctuary shapefile, or by using the unique sub-quaternary codeshown on the FEPA maps (Part 2 of the atlas) to consult the look-up tableon the DVD.Thomas Peschak/WWF-SANational map products - 43 -
3.5 High water yield areasFigure 3.5 shows those sub-quaternary catchments where mean annual run-off (mm per year)is at least three times more than the average for the related primary catchment. Mean annualrun-off is the amount of water on the surface of the land that can be utilised in a year, whichis calculated as an average (or mean) over several years.High water yield areas are important because they contribute significantly to the overallwater supply of the country. They can be regarded as our water factories, supportinggrowth and development needs that are often a far distance away. Deterioration ofwater quantity and quality in these high water yield areas can have a disproportionatelylarge adverse effect on the functioning of downstream ecosystems and the overallsustainability of growth and development in the regions they support. High water yieldareas should therefore be maintained in a good condition (A or B ecological category).This requires minimising land use activities that reduce stream flow in these areas(e.g. plantation forestry), as well as any activity that would affect water quality (e.g.timber mills, mining, over-grazing). Wetlands also play an important role in these areas,regulating stream flow and preventing erosion. Additionally, clearing of invasive alienplants in these areas would deliver large water yield benefits relative to clearing in otherparts of the catchment.High water yield areas are our waterfactories, supporting growth anddevelopment needs that are often a longdistance away. Land uses that reducestream flow or affect water quality (e.g.mining, plantations, overgrazing) should beavoided in these areas, wetlands should bekept in good condition or rehabilitated, andinvasive alien plants should be cleared.Figure 3.5: Mountain Catchment Areas, delineated by hand in 1959 (Department of Agricultural TechnicalServices. 1961)< 100%100-300%300-500%> 500%High water} yield areasRevitalising the MountainCatchment Areas Act anddeclaring additional MountainCatchment Areas could makea significant contribution toprotecting South Africa’s waterresources.The Mountain Catchment Areas Act (Act 63 of 1970) recognises the need to managehigh water yield areas wisely for the benefit of both people and ecosystems. It enablesmechanisms for prevention of soil erosion, protection of the natural vegetation, clearing ofinvasive alien plants, and implementation of fire protection plans. As early as 1959, MountainCatchment Areas of South Africa had been delineated by hand (Figure 3.5). These correspondwell with the high water yield areas identified by <strong>NFEPA</strong> (Figure 3.6).Unfortunately only a few Mountain Catchment Areas have been declared in terms of theMountain Catchment Areas Act. These declared Mountain Catchment Areas make a relativelylarge contribution to freshwater ecosystem conservation and management relative toother protected area systems (Nel et al. 2009b). Ideally, all high water yield areas should bedeclared in terms of the Mountain Catchment Areas Act, as the Act provides mechanismsand incentives for appropriate land management in these areas. Revitalising the MountainCatchment Areas Act and declaring further Mountain Catchment Areas in high water yieldareas, with a view to protecting the country’s water resources, is a strong recommendation ofthe <strong>NFEPA</strong> project.Figure 3.6: Hat least three times more than the average for the related primary catchment500 kmNational map products - 44 -
The map of high water yield areas was derived using mean annual rainfall data at a 1 x 1minute resolution for the entire country. This was converted into mean annual runoff usingthe rainfall-runoff relationships established in South Africa’s 1990 Water Resource Assessment(Midgley et al. 1994). Mean annual runoff for each sub-quaternary catchment was expressedas a percentage of the mean annual runoff for that primary catchment to identify areas wheremean annual runoff is at least three times more than that of the primary catchment.3.6 High groundwater recharge areasto sustain coastal aquifers over 100 km away, which in turn support high value crops(potatoes). Activities that should be prevented or controlled in these areas includegroundwater abstraction, loss of natural vegetation cover, and invasion by alien plants.High groundwater recharge areas are crucialfor sustaining groundwater resources, whichmay be far away from the recharge area.Groundwater abstraction and loss of naturalvegetation should be avoided in these areas,and invasive alien plants should be cleared.The map of high groundwater recharge areas was derived using the 2005 groundwaterresource assessment data, available at a resolution of 1 km x 1 km (DWAF 2005).Groundwater recharge (mm per year) for each 1 km x 1 km cell was expressed as apercentage of the mean annual rainfall (mm per year) for that cell. This gives a relativeidea of where the proportionally highest recharge areas are in the country, comparedto using absolute numbers (mm per year). Percentage recharge for each sub-quaternarycatchment was expressed as the percentage recharge for the relevant primary catchmentto identify areas where groundwater recharge is at least three times more than that ofthe primary catchment.Groundwater is critical for sustaining river flows, especially in the dry season (Figure3.7). Groundwater recharge, the process by which rainwater seeps into groundwatersystems, is crucial for sustaining groundwater resources and is calculated as an averageover several years. Groundwater recharge is dependent mainly on rainfall and geologicalpermeability, and different areas vary in their ability to recharge groundwater. Figure 3.8shows those sub-quaternary catchments where groundwater recharge is at least threetimes more than the average for the related primary catchment.High groundwater recharge areas can be considered as the recharge hotspots of theregion. Keeping natural vegetation in these areas intact and healthy is critical to thefunctioning of groundwater dependent ecosystems, which can be in the immediatevicinity or far removed from the recharge area. For example, recharge in the GrootWinterhoek Mountains of the Olifants/Doorn Water Management Area is believed< 100%100-300%300-500%> 500%High groundwater} recharge areasWilma Strydom200 kmFigure 3.7: Groundwater sustains river flows and connected ecosystemsFigure 3.8: High gthree times more than the average for the related primary catchmentNational map products - 45 -
Part 4: Data layers usedfor identifying FEPAsThe input data layers used in the development of the FEPA mapsand national maps are shown here. These include:Input data that inform the identification ofFEPAs were collated and reviewed throughfive regional expert workshops around thecountry during May and June 2009. Over 100experts participated in these workshops andmeetings, representing government, privateand civil society.4.1 River ecosystem types4.2 River condition4.3 Wetland ecosystem types4.4 Wetland condition4.5 Landforms4.6 Wetland vegetation groups4.7 Priority estuariesJeanne NelThis part of the atlas shows the input data layers that were used in the development ofthe FEPA maps and national maps presented in Parts 2 and 3. The input data layers shownhere are:• River ecosystem types comprising unique combinations of landscape features, flowvariability and channel slope. River ecosystem types were used for representingnatural examples of the diversity of river ecosystems across the country.• River condition that combines data on present ecological state of rivers (Kleynhans2000 and available updates), river health data, reserve determination data, expertknowledge and natural land cover data. Rivers had to be in a good condition (A or Becological category) to be chosen as FEPAs.• Wetland ecosystem types consisting of unique combinations of landforms (benches,slopes, valley floors and plains) and vegetation types. Wetland ecosystem types wereused for representing the diversity of wetland ecosystems across the country.• Wetland condition modelled using the proportion of natural vegetation in andaround the wetland as an indicator of condition. Wetland condition was used tofavour the selection of wetlands in good condition as FEPAs, although wetlands didnot have to be in a good condition to be chosen as a FEPA.• Landforms that categorise the country’s landscape into benches, slopes, valley floorsand plains. Landforms were used in identifying wetland ecosystem types.• Wetland vegetation groups that are based on groupings of national vegetation typesexpected to have wetlands with similar characteristics. Wetland vegetation groupswere used in combination with the landform map to identify wetland ecosystem types.• Priority estuaries as identified in the National <strong>Biodiversity</strong> Assessment 2011 based ona systematic biodiversity planning approach. Priority estuaries became FEPAs and werealso used to favour the selection of associated river and wetland ecosystems as FEPAs.Input data layers- 46 -
0 10 20 30 40 50BERGBREEDECROCODILE(WEST)FISH TO TSITSIKAMMAGOURITZIMKOMATILIMPOPOLOWER ORANGELOWER VAALLUVUVHU AND LETABAMIDDLE VAALMVOTI TO UMZIMKULUMZIMVUBU TO KEISKAMMAOLIFANTSOLIFANTS/DOORNTHUKELAUPPER ORANGEUPPER VAALUSUTU TO MHLATHUZE4.1 River ecosystem typesRiver ecosystem types were used for representing natural examples of the diversityof river ecosystems across the country. South Africa is a geologically, geomorphologicallyand climatically complex country, giving rise to many different types of riverecosystems and associated biodiversity. For example, a foothill river in the Highveldis very different from one in the Eastern Coastal Belt. Similarly, Highveld mountainstreams, foothill rivers and lowland rivers have different physical characteristics, whichdetermine the types of plants and animals that they support.River ecosystem types are river reaches with similar physical features (such as climate,flow and geomorphology). Under natural conditions, rivers with the same ecosystemtype are expected to share similar biological response potential. River ecosystemtypes can therefore be used as coarse-filter surrogates for river biodiversity, advancingfreshwater conservation beyond dealing only with species, to also conserving habitatsand ecosystems on a systematic basis. As explained in Section 1.5, the biodiversitytarget for freshwater ecosystems in South Africa is 20%, which means that we shouldkeep at least 20% of each river ecosystem type in a good condition (A or B ecologicalcategory). This serves to conserve many common species and communities, and thehabitats in which they evolve. These coarse-filter surrogates were supplemented withdata on threatened and near threatened fish species (Section 3.4).South Africa has had a national map of vegetation types for some time, which providecoarse-filter surrogates for terrestrial biodiversity. However, there has not been anagreed map of river ecosystem types, which are more or less the freshwater equivalentof vegetation types. The need to identify different river ecosystem types, in order tocompare information between rivers and to allocate priority uses to different rivers, haslong been recognised in South Africa (Harrison 1959; Noble 1970; O’Keefe et al. 1989).Early mapping efforts focused on defining relatively coarse regions across the countrythat shared similar characteristics: Harrison (1959) mapped 12 hydrobiological regions inSouth Africa based on water chemistry and aquatic biota; Eekhout et al. (1997) definedten biogeographic regions based on cluster analysis of 645 species of riverine plants, fishand macro-invertebrates; and 6 regions were defined by Dallas et al.(1995) based onwater chemistry. Advances in <strong>GIS</strong> and increasing availability of spatial data now permit theidentification of the finer-scale river ecosystem types used here.<strong>NFEPA</strong> used spatial information on the ecoregions of South Africa (Kleynhans et al. 2005),broad flow variability, and slope category of river channels (Rowntree and Wadeson 1999)to identify 223 river ecosystem types across South Africa. Figure 4.1 shows the number ofriver ecosystem types in each Water Management Area. The Usutu to Mhlathuze, Olifantsand Limpopo Water Management Areas display the highest diversity, with over 20% of thetotal number of river ecosystem types occurring in each of these areas, while the BreedeWater Management Area has a relatively low river ecosystem diversity (7%). The low riverecosystem diversity in the Breede Water Management Area is typical of the Western Caperivers, which generally have lower species richness but high levels of endemism and threat.In future, descriptions and lists of dominant species should be developed for each riverecosystem type, and river ecosystem types could be published in a similar manner to thevegetation map of South Africa, Lesotho and Swaziland (Mucina and Rutherford 2006).The Department of Water Affairs 1:500 000 river network <strong>GIS</strong> layer was used as a basis foridentifying national river ecosystem types for <strong>NFEPA</strong> (http://www.dwaf.gov.za/iwqs/gis_data/river/rivs500k.html). A further 97 coastal rivers were added from the 1:50 000 river network<strong>GIS</strong> layer (Department of Land Affairs: Chief Directorate Surveys and Mapping 2005-2007)based on the addition of several missing South African estuaries along the coastline(the estuary layer was also updated in the process). The ecoregion (Section 4.1.1), flowdescription (Section 4.1.2) and slope category (Section 4.1.3) for each river was combinedto produce 223 distinct river ecosystem types for South Africa.37 39 3438464135314839345221 211917152316Figure 4.1: Number of river ecosystem types in each Water Management AreaDirk RouxInput data layers- 47 -
4.1.1 Level 1 ecoregionsEcoregions classify the landscape into 30 categories based on topography, altitude, slope,rainfall, temperature, geology and potential natural vegetation (Kleynhans et al. 2005).1 Limpopo Plain9 Eastern Bankenveld16 South Eastern UplandsEcoregions broadly characterise the landscape through which a river flows, such thatrivers in the same ecoregion share similar broad ecological characteristics compared tothose in different ecoregions. For example, the Highveld is characterised by extensiveflat plains with gentle meandering rivers, compared to rivers in the Eastern Coastal Beltthat are often in steeply incised and confined valleys (Figure 4.2 and accompanyingphotographs).2 Soutpansberg3 Lowveld4 North Eastern Highlands5 Northern Plateau8 Bushveld Basin10 Northern Escarpment Mountains11 Highveld12 Lebombo Uplands13 Natal Coastal Plain14 North Eastern Uplands17 North Eastern Coastal Belt22 Southern Coastal Belt24 South Western Coastal Belt25 Western Coastal Belt31 Eastern Coastal Belt6 Waterberg30 Ghaap Plateau29 Southern Kalahari28 Orange River GorgeWilma Strydom Wilma Strydom Wilma Strydom Wilma Strydom12356897101242930111314282726151725181631232124192022Figure 4.ecosystem types.27 Namaqua Highlands 26 Nama Karoo 23 Western Folded Mountains 21 Great Karoo 20 South Eastern Coastal BeltWilma StrydomWilma StrydomWilma StrydomWilma Strydom7 Western Bankenveld15 Eastern Escarpment Mountains18 Drought Corridor19 Southern Folded MountainsWilma Strydom Wilma Strydom Wilma Strydom Wilma Strydom Wilma StrydomInput data layers- 48 -
4.1.2 Flow variability categoriesThe 1:500 000 river network <strong>GIS</strong> layer was classified into two categories, permanent and notpermanent, using flow descriptions in the Department of Water Affairs 1:500 000 rivers andthe 1:50 000 rivers of the Department Land Affairs: Chief Directorate Surveys and Mapping(2005-2007). ’Permanent‘ includes both perennial and seasonal rivers and ’Not permanent‘includes ephemeral rivers that can go for years without flowing (Figure 4.3). Rivers withdifferent flow variability are expected to have different ecological characteristics. Ideally,flow variability for the 1:500 000 rivers should be described in more than two categories.While this is accomplished by the hydrological index developed by Hannart and Hughes(2003), it is only available for mainstem quaternary rivers. The 1:500 000 rivers require amuch finer resolution than the resolution of the existing hydrological indices. Developinghydrological indices for the 1:500 000 rivers should be a future focus for improving thedescription of river ecosystem types.PermanentNot permanentPermanent riverWilma StrydomKevin Murray500 kmFigure 4.3: Flow descriptions for the 1:500 000 river network <strong>GIS</strong> layer. ’Permanent’ refersto rivers that flow for at least some time every year; ‘Not permanent’ refers toephemeral rivers that do not flow every year. This <strong>GIS</strong> layer was one of the threeused to derive river ecosystem types.Not permanent riverInput data layers- 49 -
4.1.3 Slope categoriesSlope categories are based on geomorphological zonation work by Rowntree and Wadeson(1999). Geomorphological river zones characterise the ability of river reaches to store ortransport sediment, with each zone representing a different physical template availablefor the biota. Moolman et al. (2002) used <strong>GIS</strong> slope profiles to stratify the 1:500 000 riversaccording to the slope categories proposed by Rowntree and Wadeson (1999). For <strong>NFEPA</strong>,these were grouped into four classes for depicting ecological characteristics at a nationallevel: mountain streams, upper foothills, lower foothills and lowland rivers (Figure 4.4).These zones have different physical and hydrological characteristics and are expected tohave distinct biota (Figure 4.5). For example the macro-invertebrate functional feedinggroups shift from shredders and collectors in mountain streams, to grazers and collectorsin foothill streams, to collectors in lowland rivers. Fish tend to occur in lower foothill andlowland rivers. Mountain streams tend to be less impacted by human activities but theseJeanne Nelzones contain many endemic and specialised species that are likely to be less resilient tohuman impacts. Upper foothills are vulnerable zones because they often contain sensitiveendemic species and present some of the best opportunities for damming. Lower foothillsand lowland rivers are usually heavily impacted by agriculture and urban development. Themaintenance of healthy natural vegetation along river banks is particularly important inlowland rivers as it provides filtering capacity for pollutants in runoff.Mountain streamDavid le MaitreUpper foothillMountain streamUpper foothillLower foothillLowland river25 kmLower foothillLowland riverJeanne Nel Kate SnaddonFigure 4.4: Slope categories for the 1:500 000 river network <strong>GIS</strong> layer, showing an area on the Agulhas Plain.Figure 4.5: Schematic of profiles used to derive the four slope categories which share broadly similarThis <strong>GIS</strong> layer was one of the three used to derive river ecosystem types.ecological characteristics and functioningInput data layers- 50 -
% River length0 20 40 60 80 1004.2 River conditionRiver condition describes the extent to which the river has been modified by humanactivity. In South Africa, river condition is described in six ‘present ecological state’(PES) categories ranging from natural (A) to critically modified (F) (Table 4.1). Only riverecosystems in good condition (A or B ecological category) were chosen as FEPAs, becauserivers in a C or lower ecological condition are considered to have lost too much of theirbiodiversity to be representative samples of South Africa’s freshwater ecosystems. From apractical point of view, natural ecosystems tend to be more self-sustaining, thus requiringless conservation management. For example, a river with healthy natural vegetation alongits banks is able to filter pollutants from the surrounding landscape and is likely to havebetter quality water. Rivers that are in good condition may nevertheless require somemanagement, for example clearing of invasive alien trees and associated rehabilitation ofriver bank vegetation. The cost of managing rivers to keep them in good condition is lowerthan the cost of rehabilitating modified rivers, and the likelihood of success is greater.Table 4.1: Present ecological state (PES) categories used to describe the currentEcologicalcategoryABCDEFZand desired future condition of South African rivers (after Kleynhans2000). For <strong>NFEPA</strong>, rivers in an A and B category were regarded asbeing in good condition.DescriptionUnmodified, natural.Largely natural with few modifications. A small change in naturalhabitats and biota may have taken place but the ecosystem functions areessentially unchanged.Moderately modified. A loss and change of natural habitat and biotahave occurred but the basic ecosystem functions are still predominantlyunchanged.Largely modified. A large loss of natural habitat, biota and basic ecosystemfunctions have occurred.Seriously modified. The loss of natural habitat, biota and basic ecosystemfunctions are extensive.Critically/Extremely modified. Modifications have reached a critical leveland the system has been modified completely with an almost completeloss of natural habitat and biota. In the worst instances the basicecosystem functions have been destroyed and the changes are irreversible.Rivers C-F where no data and no expert opinion is available, modelledbased on percentage natural land cover.good condition (A or B ecological category) if the percentage natural land cover within aseries of buffers around each sub-quaternary river reach never dropped below 75% and thepercentage erosion within 500 m of the river reach was less than 5%. The percentage naturalland cover in the area surrounding a river reach is a strong indicator of the condition ofthe river reach. This is because loss of natural vegetation, for example as a result of urbandevelopment, cultivation or mining, together with the water use and pollutants associatedwith these activities, dramatically disturbs the ecological functioning of rivers in almost allcases. Erosion was used to take account of land degradation, which unlike outright lossof natural habitat is often not picked up directly in the land cover map but is a problemespecially in drier regions of the country. Where erosion sheets exist they often occur alongriver banks, indicating severe land degradation in the surrounding area, which impactsnegatively on the condition of the rivers.Updated information on river condition for main rivers and tributaries was also collatedfrom various sources. These additional data, combined with on-the-ground knowledge ofaquatic ecologists, was used to review and update the draft river condition map in a series ofregional expert workshops. Sources of updated information included:• Updated present ecological state data for 7 of the 19water management areas obtained from the Departmentof Water Affairs Resource Quality Services office;• Desktop, rapid, intermediate and comprehensive reservedetermination data from the Department of WaterAffairs Surface Water Reserve Requirements database(http://www.dwa.gov.za/groundwater/gwoffices.aspx).•Only 55% of the sites had coordinates and could be used,although expert input at the workshop filled in some ofthese gaps;Site-level data from the River Health Programme,obtained from the Department of Water Affairs RiversABCDEFZDatabase (http://www.dwaf.gov.za/iwqs/rhp/naehmp.htm), State of Rivers Reports, a recent review of theRiver Health Programme (Strydom et al. 2006) andunpublished data from regional River Health Programmechampions.6535Main rivers4357Tributaries5347Main rivers &tributariesGood conditionNot in goodconditionFigure 4.6: Percentage of main rivers versus tributaries in good condition. Thesedata show that tributaries are overall in better condition than mainrivers.A draft map of river condition was derived by combining the 1999 present ecologicalstate categories for quaternary mainstem rivers (Kleynhans 2000: Table 4.1) with modelledcategories for tributaries. Quaternary mainstem rivers are the 1:500 000 rivers thatpass through quaternary catchments, and are hereafter referred to as ‘main rivers’. Theremaining 1:500 000 rivers are nested within quaternary catchments, and are referred to as‘tributaries’.The modelled condition categories for tributaries used the percentage of natural landcover from the 30 m resolution <strong>SANBI</strong> ‘Mosaic National Land Cover 2009’, which updatesthe National Land Cover 2000 <strong>GIS</strong> layer (Van den Berg et al. 2008) with more recent andimproved provincial land cover data where it exists. Tributaries were considered to be inThe resulting map of river condition is shown in Figure 4.7.A previous assessment showed that only a third of thelength of South Africa’s main rivers are in a good condition(Nel et al. 2007). This more comprehensive assessment ofriver condition, which included both main rivers and their1:500 000 tributaries, shows clearly that tributaries aregenerally less heavily impacted than main rivers. Nearlyhalf of the rivers are in good condition if main rivers andtributaries are considered together, compared with about athird when considering main rivers alone (Figure 4.6). Thisemphasises the important role that healthy tributaries playin keeping our heavily impacted main rivers functioning.500 kmFigure 4.7: River condition in South Africa, based on a combination of empirical data and expert knowledge.River condition categories follow the present ecological state (PES) categories of Kleynhans (2000).Input data layers- 51 -
4.3 Wetland ecosystem typesWetland ecosystem types were used for representing natural examples of the diversity ofwetland ecosystems across the country. Wetlands of the same ecosystem type are expectedto share similar functionality and ecological characteristics. For example, seeps functiondifferently to valley-bottom wetlands; valley-bottom wetlands in the mesic highveldgrassland have different characteristics to valley-bottom wetlands in sandstone fynbos. Asexplained in Section 1.5, the biodiversity target for freshwater ecosystems in South Africais 20%, which means that we should keep at least 20% of each wetland ecosystem type ina natural or near-natural condition. This serves to conserve many common species andcommunities, and the habitats in which they evolve. The coarse-filter surrogate providedby wetland ecosystem type was supplemented with information on Ramsar status (http://ramsar.wetlands.org/), known threatened frog (http://www.adu.org.za/; http://www.adu.org.za/docs/FrogData.csv) and waterbird occurrences (http://cwac.adu.org.za/cwac_map.php?Pv=GP) and expert knowledge on biodiversity importance. These additional datasources helped in identifying wetland FEPAs (see Section 2.2 of the atlas).Planning for wetlands at the landscape level (rather than on a site-by-site basis) ischallenging. The best national information available prior to <strong>NFEPA</strong> was the <strong>SANBI</strong> NationalWetland Map 3 (completed in 2009; http://bgis.sanbi.org), which maps the extent ofDepressionMountain seepPeter Chadwick/WWF-SAKate Snaddon25 kmSeepValleyhead seepUnchannelled valley-bottomChannelled valley-bottomFloodplainDepressionFlatsome 100 000 wetland systems. The delineations are based largely on remotely-sensedimagery and therefore do not include historic wetlands lost through drainage, ploughingand concreting. Irreversible loss of wetlands is especially high in some areas, such as urbancentres and intensively cultivated areas.<strong>NFEPA</strong> augmented the National Wetland Map 3 with finer scale wetland maps that wereavailable from various sub-national biodiversity planning exercises. This produced an <strong>NFEPA</strong>wetland map of almost 200 000 wetlands. Sub-national wetland data included:• Wetlands for the entire KwaZulu-Natal Province (available from Ezemvelo KZN Wildlife);• Cape Action for People and the Environment (C.A.P.E.) fine-scale biodiversity planningwetlands of Saldanha/Sandveld, Riversdale plain and Upper Breede River Valley(available from http://bgis.sanbi.org);• Overberg, Niewoudtville and Kamieskroon wetlands (available from http://bgis.sanbi.org);• Selected wetlands of conservation importance in Mpumalanga Province (available fromMpumalanga Parks and Tourism Agency).Although there are still gaps in mapping wetlands in South Africa, enormous progresshave been made over the last several years. <strong>SANBI</strong> has an ongoing wetland inventoryingprogramme that is improving the <strong>GIS</strong> layer for national wetlands to support futureplanning and management.Another important advance towards landscape-level planning for wetlands was thecompletion of the national wetland classification system (<strong>SANBI</strong> 2009). Levels 1 to 4of the classification system identify broad groups of wetlands sharing similar regionalcontext, landform and broad hydrology. Levels 5 and 6 describe site characteristics suchas hydroperiod, geology, vegetation, substratum, salinity, pH and naturalness. Wetlands inthe <strong>NFEPA</strong> wetland map were classified into wetland ecosystem types according to Level4 of the national wetland classification system.Level 4 wetland ecosystem types were derived using the landforms (Section 4.5) andwetland vegetation groups (Section 4.6). First the four landform classes (benches, slopes,plains and valley-floors) were used in conjunction with the 1:50 000 pans <strong>GIS</strong> layer(Department of Land Affairs: Chief Directorate Surveys and Mapping 2005-2007) and1:500 000 river network <strong>GIS</strong> layer to classify each wetland into one of seven ‘hydrogeomorphictypes’ (Figure 4.8):• Seep• Valleyhead seep• Unchannelled valley-bottom• Channelled valley-bottom• Floodplain• Flat• DepressionSecond, each wetland was assigned the wetland vegetation group that occupied themajority of its area, to characterise the regional context (e.g. climate, soil, geology) withinwhich the wetland occurs. For each wetland, the hydrogeomorphic type was combinedwith its corresponding wetland vegetation group, producing 791 distinct wetlandecosystem types across the country. Although there are many gaps and challenges withthe <strong>NFEPA</strong> wetland ecosystem types, they represent a major achievement and provide asignificant new national product that can now be further refined and debated.FloodplainKate SnaddonFigure 4.8: An example of the hydrogeomorphic types used to derive wetland ecosystem types in South Africa. The inset mapshows the location of the area on the main map. The hydrogeomorphic type of a wetland was used together withthe wetland vegetation group in which it was embedded (Section 4.6) to determine its wetland ecosystem type.DepressionKate SnaddonInput data layers- 52 -
4.4 Wetland conditionWetland condition describes the extent to which a wetland has been modified by humanactivity. There are many approaches to assessing wetland condition in the field. However,in the absence of field survey data for most wetlands across the country, wetlandcondition was modelled by <strong>NFEPA</strong> to serve as a relative measure for informing choices inselecting wetland FEPAs. As explained in Section 2.2, choices in the selection of wetlandFEPAs were made using wetland ranks, which were based on a combination of specialfeatures and wetland condition. Wetlands with known special features (e.g. presence ofrare plants and animals, extensive intact peat wetlands) were selected as the first choicefor achieving biodiversity targets for wetland ecosystem types. Any remaining targets wereachieved first in wetlands of good condition, proceeding only if necessary to wetlands ofprogressively modified condition (Table 4.2). Wetland FEPAs did not have to be in a goodcondition to be chosen as a FEPA, but those wetland FEPAs currently in less than goodcondition should be rehabilitated to the best attainable ecological condition.Wetlands that had the majority of their area coinciding with 1:50 000 artificial water bodies(Department of Land Affairs: Chief Directorate Surveys and Mapping 2005-2007) wereassigned a heavily- to critically-modified wetland condition (equivalent of D, E or Fecological category for rivers: Table 4.1). For the remaining wetlands, the percentagenatural land cover in and around the wetland was used as a surrogate measure of wetlandcondition. The same land cover data as used for modelling condition of tributaries wasapplied (Section 4.2). Percentage natural land cover was calculated within four areas:the wetland itself, and the wetland surrounded by <strong>GIS</strong> buffers of 50 m, 100 m and 500 mfrom the edge of the wetland. The lowest of these four resulting percentages of naturalland cover was used to guide the condition category of the wetland (Table 4.2; Figure 4.9),using the following rules:Natural or goodModerately modifiedHeavily to critically modified• Non-riverine wetlands were considered to be in a good, moderately modified orheavily modified condition if the lowest percentage natural land cover in and aroundthe wetland was 75% or more, 25-75%, or less than 25% respectively.• This same rule was applied to riverine wetlands associated with natural or moderatelymodified rivers (i.e. in an A, B, or C ecological category) because in such cases thesurrounding land use is more likely to be a driver of wetland ecosystem degradationthan the condition of the associated river.• Riverine wetlands associated with a largely modified, seriously modified or criticallymodified river (i.e. in a D, E or F ecological category) were assigned a heavily modifiedcondition irrespective of the surrounding natural land cover.• Several riverine wetlands are associated with rivers too small to be included onthe 1:500 000 river network <strong>GIS</strong> layer – in these instances, the river condition wasunknown and the wetland was assigned a condition based on the lowest percentagenatural land cover.It is very difficult to assess accurately how much of South Africa’s wetland area hasalready been irreversibly lost. However, we know it is substantial, especially in urbanareas and intensively cultivated areas. Over and above this irreversible loss that hasalready taken place, approximately 45% of our remaining wetland area in South Africa isin a heavily or critically modified condition, owing to human impacts such as damming,draining and bulldozing of wetlands. This is of immense concern given the importantregulating ecosystem services that healthy wetlands provide, such as purifying water andregulating floods.Figure 4.been accentuated to make them more visible.500 kmTable 4.2: Wetland condition categoriesWetland condition Assessment criteria * % of total wetland area **Good Natural land cover ≥ 75% 44Moderately modified Natural land cover 25-75% 18Heavily modified Riverine wetland associated with a D, E, F or Z category river 9Critically modified Wetland where the majority of its area coincides with a 1:50 000artificial inland water body, or where natural land cover < 25%* Percentage natural land cover was calculated within four areas: the wetland itself, and the wetland surrounded by<strong>GIS</strong> buffers of 50 m, 100 m and 500 m from the edge of the wetland. The lowest of these four percentages wasused.** Note that this excludes the extent of wetlands that have already been irreversibly lost due to draining, ploughingand concreting.36Input data layers - 53 -
4.5 LandformsLandforms describe the topography of a land surface in the context within which it occurs, identifyinga range of landform classes such as valley floors, slopes and benches. Landforms provide a frameworkfor the role the landscape plays in processes related to geology, hydrology and ecology. Landformswere developed by <strong>NFEPA</strong> for classifying wetlands according to the landscape setting within which theyfall, and provided one of the primary determinants for classifying wetland ecosystem types (Section4.3). Four landform classes recommended by the national wetland classification system (<strong>SANBI</strong> 2009)were identified: benches, plains, slopes and valley floors (Figure 4.10).Valley floorsSlopesPlainsBenchesThese landform classes are useful to a wide range of planning and management applications beyondbiodiversity planning, such as assessments of soil, geology, hydrology, fire and flood risk, hazardprediction, forestry, agricultural and forestry potential, climate change as well as numerous engineeringand military applications.50 kmBENCHseepSLOPEdepressionBENCHVALLEY FLOORchannelledvalley-bottom wetlandunchannelledvalley-bottom wetlandWilma StrydomPLAINriver channelfloodplain wetlandflatdepression500 kmFigure 4.10: Schematic showing the different landscape settings of each landform class (after<strong>SANBI</strong> 2009), which inform classification of the different wetland ecosystemtypes. Landform classes are shown in upper case, and the wetland ecosystemtypes that they potentially contain are shown in lower case.Landforms for the country were generated using a 50 m resolution digital elevation model generatedfrom contours at 20 m intervals and spot height data per 1:50 000 data sheets. The Arc<strong>GIS</strong> 9.3Landform Tool was used, which calculates the standard deviation from the average elevation ina specified search area to identify landform classes. This tool offers the option of using a smallneighbourhood to consider the landform within a local context, and a large neighbourhood toreflect the regional context within which the landform occurs. The maximum valley widths pergeomorphic province (as calculated by Partridge et al. 2010) were used to inform selection of the smallneighbourhood across the country, and the maximum width tertiary catchments (Midgley et al. 1994)informed selection of the large neighbourhood (van Deventer et al. in review). The results (Figure 4.11)were compared to 260 random points that were classified manually using Google Earth imagery andtopographical maps, and showed a 50-60% overall accuracy. The Landform Tool tended to overestimatebenches and valleys, and underestimate slopes. This level of congruency suggests that this landformlayer may be suitable for coarse-scale national application, but will have to be further refined for useat the local scale.Figure 4.11: Landforms of wetland vegetation groups (Section 4.6) to classify wetland ecosystem types.Input data layers- 54 -
4.6 Wetland vegetation groupsWetland vegetation groups were used to characterise the regional context within whichwetlands occur based on the premise that wetlands in a particular vegetation group arelikely to be more similar to one another than to wetlands in other vegetation groups.Broad vegetation groupings reflect differences in geology, soils and climate, which in turnaffect the ecological characteristics and functionality of wetlands.Wetland vegetation groups were derived by grouping the 438 vegetation types of SouthAfrica, Lesotho and Swaziland (Mucina and Rutherford 2004) into groups thought toreflect the turnover of wetland biodiversity at a national level. The expert knowledgeof regional wetland ecologists was used to do the grouping, resulting in a map of 133wetland vegetation groups (Figure 4.12). This was then used, in combination with thelandform map (Section 4.5), to classify wetland ecosystem types. Future research shouldfocus on improving these groupings using cluster analysis of representative surveys ofwetlands across the country.(a)(b)800 kmFigure 4.12: (a) Vegetation Wetland vegetation groups were used to characterise the regional context within which wetlands occur (after <strong>SANBI</strong> 2009).Input data layers - 55 -
ReferencesAbell, R., Allan, J.D., & Lehner, B. 2007. Unlocking the potential of protected areas forfreshwaters. Biological Conservation, 134: 48-63.Balmford, A. 2003. Conservation planning in the real world: South Africa shows the way.Trends in Ecology and Evolution, 18: 435-438.Boardman, J., Foster, I.D.L., Rowntree, K., Mighall, T. & Parsons, A.J. 2009. Small farm dams:A ticking time bomb? Water Wheel, 8(4): 30-35.Cadman, M., Petersen, C., Driver, A., Sekhran, N., Maze, K. & Munzhedzi, S. 2010.<strong>Biodiversity</strong> for Development: South Africa’s landscape approach to conservingbiodiversity and promoting ecosystem resilience. South African National <strong>Biodiversity</strong>Institute, Pretoria, South Africa.Dallas, H.F., Day, J.A., and Reynolds, E.G., 1995. The effects of water quality variables onriverine biotas. WRC Report No 351/1/94, Water Research Commission, Pretoria,South Africa.Darwall, W.R.T., Smith, K.G., Tweddle, D. & Skelton, P. (eds.) 2009. The status anddistribution of freshwater biodiversity in Southern Africa. International Union forConservation of Nature (IUCN): Gland, Switzerland and South African Institute forAquatic <strong>Biodiversity</strong> (SAIAB): Grahamstown, South Africa, 120 pp.Dollar, E.S.J., Nicolson, C.R., Brown, C.A., Turpie, J. K., Joubert, A.R., Turton, A.R,. Grobler,D.F., Pienaar, H.H., Ewart-Smith, J. & Manyaka, S.M. 2010. The development of theSouth African Water Resource Classification System (WRCS): a tool towards thesustainable, equitable and efficient use of water resources in a developing country.Water Policy, 12(4): 479-499. Doi:10.2166/WP.2009.213.Eekhout, S., King, J.M. & Wackernagel, A. 1997. Classification of South African rivers,Volume 1. Departmental of Environmental Affairs and Tourism, Pretoria, SouthAfrica.Hannart, P. & Hughes, D.A., 2003. A desktop model used to provide an initial estimateof the ecological instream flow requirements of rivers in South Africa. Journal ofHydrology, 270: 167-181.Harrison, A.D. 1959. General statement of South African hydrobiological regions. Report No1, Internal Report (Project 6.8H), National Institute for Water Research, Council forScientific and Industrial Research, Pretoria, South Africa.International Union for Conservation of Nature (IUCN). 2001. IUCN red list categories andcriteria: Version 3.1, IUCN Species. Survival Commission, IUCN, Gland, Switzerlandand Cambridge, UK, 30 pp. Available online: http://www.iucnredlist.org/documents/redlist_cats_crit_en.pdfLinke, S., Turak, E. & Nel, J.L. 2010. Freshwater conservation planning: The case for systematicapproaches. Freshwater Biology, 56: 6-20.Mantel, S.K., Muller, N.W.J. & Hughes, D.A. 2010. Ecological impacts of small dams on SouthAfrican rivers: Part 2 Biotic response – abundance and composition of macroinvertebratecommunities. Water SA, 36: 361-370.Margules, C.R. & Sarkar, S. 2007. Systematic Conservation Planning. Cambridge UniversityPress, Cambridge.Margules, C.R. & Pressey, R.L. 2000. Systematic conservation planning. Nature, 405: 243-253.Midgley D.C., Pitman W.V. & Middleton B.J. 1994. Surface Water Resources of South Africa1990: User’s Manual. WRC Report No 298/1/94, Water Resource Commission, Pretoria,South Africa.Millennium Assessment (MA). 2003. Ecosystems and human well-being: A framework forassessment. World Resources Institute, Island Press, Washington, DC. Available online:http://www.maweb.org/en/Framework.aspxMoilanen, A., Leathwick, J. & Elith, J. 2008. A method for spatial freshwater conservationprioritization. Freshwater Biology, 53: 577-592.Department of Agricultural Technical Services. 1961. Report of the Inter-DepartmentalCommittee on the Conservation of Mountain Catchments in South Africa. TheGovernment Printer, Pretoria, South Africa, 79 pp.Department of Land Affairs: Chief Directorate Surveys and Mapping (DLA: CDSM). 2005-2007. 1: 50 000 inland waterbodies and rivers. Department of Land Affairs: ChiefDirectorate Surveys and Mapping, Pretoria, South Africa.Department of Water Affairs and Forestry (DWAF). 2004. National Water ResourcesStrategy. First Edition. September 2004. Department of Water Affairs and Forestry,Pretoria. Available online: http://www.dwaf.gov.za/Documents/Policies/NWRS/Default.htmDepartment of Water Affairs and Forestry (DWAF). 2005. Groundwater ResourceAssessment II: Recharge Literature Study Report 3A. Department of Water Affairs andForestry, Pretoria, South Africa.Department of Water Affairs and Forestry (DWAF). 2007. Guidelines for the Developmentof Catchment Management Strategies: Towards Equity, Efficiency and Sustainabilityin Water Resources Management. By S.R. Pollard, D. du Toit, Y. Reddy and T. Tlou.Department of Water Affairs and Forestry, Pretoria, South AfricaKleynhans, C.J. 2000. Desktop Estimates of the Ecological Importance and SensitivityCategories (EISC), Default Ecological Management Classes (DEMC), PresentEcological Status Categories (PESC), Present Attainable Ecological ManagementClasses (Present AEMC), and Best Attainable Ecological Management Class (BestAEMC) for Quaternary Catchments in South Africa. DWAF report, Institute for WaterQuality Studies, Department of Water Affairs and Forestry, Pretoria, South Africa.Kleynhans, C.J., Thirion, C. & Moolman, J. 2005. A Level I Ecoregion classification systemfor South Africa, Lesotho and Swaziland. Report No N/0000/00/REQ0104, ResourceQuality Services, Department of Water Affairs and Forestry, Pretoria, South Africa.Kotzé, I.M., Reyers, B., Schonegevel, L.Y., Nel, J.L. & Roux, D. 2006. A Conservation Visionfor the Freshwater <strong>Biodiversity</strong> of the Olifants, Inkomati and Usutu-MhlathuzeWater Management Areas: Final report. CSIR Report Number CSIR/NRE/ECO/ER/2006/0199/C, Council for Scientific and Industrial Research, Stellenbosch, SouthAfrica.Lamberth, S.J., Drapeau L. & Branch, G.M. 2009. The effects of altered freshwater inflowson catch rates of non-estuarine-dependent fish in a multispecies nearshorelinefishery. Estuarine, Coastal and Shelf Science, 84: 527-538.Lehner, B., Verdin, K. & Jarvis, A. 2006. HydroSHEDS Technical Documentation V1.0. WWF,Washington, DC. Available online: www.worldwildlife.org/hydroshedsMoolman, J., Kleynhans, C.J. & Thirion, C. 2002. Channel slopes in the Olifants, Crocodile andSabie River Catchments. Internal Report No N/0000/00REH/0102, Institute for WaterQuality Studies, Department of Water Affairs and Forestry, Pretoria, South Africa,41 pp.Mucina, L. & Rutherford, M.C. (eds.) 2006. The vegetation of South Africa, Lesotho andSwaziland. Strelitzia 19, South African National <strong>Biodiversity</strong> Institute, Pretoria, SouthAfrica.Nel, J.L., Belcher, A., Impson, N.D., Kotze, I.M., Paxton, B., Schonegevel, L.Y. & Smith-Adao,L.B. 2006a. Conservation assessment of freshwater biodiversity in the Olifants/DoornWater Management Area: Final report. CSIR Report No CSIR/NRE/ECO/ER/2006/0182/C, Council for Scientific and Industrial Research, Stellenbosch, South Africa.Nel, J.L., Smith-Adao, L., Roux, D.J., Adams, J., Cambray, J.A., de Moor, F.C., Kleynhans, C.J.,Kotze, I., Maree, G., Moolman, J., Schonegevel, L.Y., Smith, R.J. & Thirion, C. 2006b.Conservation Planning for River and Estuarine <strong>Biodiversity</strong> in the Fish-to-TsitsikammaWater Management Area. WRC Report No TT 280/06, Water Research Commission,Pretoria, South Africa.Nel, J.L., Roux, D.J., Maree, G., Kleynhans, C.J., Moolman, J., Reyers, B., Rouget, M. & Cowling,R.M. 2007. Rivers in peril inside and outside protected areas: A systematic approach toconservation assessment of river ecosystems. Diversity and Distributions, 13: 341-352.References - 57 -
Nel, J.L., Roux, D.J., Cowling, R.M., Abell, R., Ashton, P.J., Higgins, J.A., Thieme, M. & Viers,J.C. 2009a. Progress and challenges in freshwater conservation planning. AquaticConservation: Marine and Freshwater ecosystems, 19: 474-485.Nel, J.L., Reyers, B., Roux, D.J. & Cowling, R.M. 2009b. Expanding protected areas beyondtheir terrestrial comfort zone: identifying spatial options for river conservation.Biological Conservation, 142: 1605-1616.Nel, J.L., Driver, A. & Swartz, E. 2011. National <strong>Biodiversity</strong> Assessment 2011: Freshwatercomponent. CSIR Report, Council for Scientific and Industrial Research,Stellenbosch, South Africa.Noble, R.G. 1974. An evaluation of the conservation status of aquatic biotopes. Koedoe,17: 71-83.O’Keeffe, J.H. (ed.) 1986. The conservation of South African rivers. South African NationalScientific Programmes Report No 131, Foundation for Research Development,Council for Scientific and Industrial Research, Pretoria, South Africa, 117 pp.O’Keeffe, J.H., Davies, R., King, J.M. & Skelton, P.H. 1989. The conservation status ofsouthern African rivers. In: Huntley, B.J. (ed.), Biotic Diversity in Southern Africa:Concept and conservation. Oxford University Press, Oxford, 276-299 pp.Partridge, T.C., Dollar, E.S.J., Moolman, J. & Dollar, L.H. 2010. The geomorphic provincesof South Africa, Lesotho and Swaziland: A physiographic subdivision for earth andenvironmental scientists. Transactions of the Royal Society of South Africa, 65: 1-47.Roux, D.J., de Moor, F.C., Cambray, J.A. & Barber-James, H.M. 2002. Use of landscape-levelriver signatures in conservation planning: a South African case study. ConservationEcology, 6(2): 6. Available online: http://www.consecol.org/vol6/iss2/art6Roux, D.J., Nel, J.L., MacKay, H.M. & Ashton, P.J. 2006. Cross-sector policy objectives forconserving South Africa’s inland water biodiversity. WRC Report No TT 276/06,Water Research Commission, Pretoria, South Africa.Rowntree, K.M. & Wadeson, R.A. 1999. A Hierarchical Geomorphological Model for theClassification of Selected South African Rivers. Water Research Commission ReportNo 497/1/99, Water Research Commission, Pretoria, South Africa.<strong>SANBI</strong> (South African <strong>Biodiversity</strong> Institute). 2009. Further Development of a ProposedNational Wetland Classification System for South Africa. Primary Project Report.Prepared by the Freshwater Consulting Group (FCG), South African National<strong>Biodiversity</strong> Institute, Pretoria, South Africa.Schulze, R.E. 2005. Setting the Scene: The Current Hydroclimatic “Landscape” in SouthernAfrica. In: Schulze, R.E. (ed.), Climate change and water resources in Southern Africa:Studies on scenarios, impacts, vulnerabilities and adaptation. Chapter 6, WRC ReportNo 1430/1/05, Water Research Commission, Pretoria, South Africa, 83-94 pp.Skelton, P.H., Cambray, J.A., Lombard, A. & Benn, G.A. 1995. Patterns of distribution andconservation status of freshwater fishes in South Africa. South African Journal ofZoology, 30: 71-81.Smith-Adao, L.B., Nel, J.L., Roux, D.J., Schonegevel, L., Hardwick, D., Maree, G., Hill, L.,Kleynhans, C.J., Moolman, J., Thirion, C. & Todd, C. 2006. A systematic conservationplan for the freshwater biodiversity of the Crocodile (West) and Marico WaterManagement Area. CSIR Report No CSIR/NRE/ECO/ER/2006/0133/C, Council forScientific and Industrial Research, Pretoria, South Africa.Strydom, W. F., Hill, L. & Eloff, E. (eds.) 2006. Achievements of the River Health Programme1994-2004: A national perspective on the ecological health of selected South Africanrivers. Department of Water Affairs and Forestry, Department of EnvironmentalAffairs and Tourism, Water Research Commission and Council for Scientific andIndustrial Research, Pretoria, South Africa.Thieme, M., Lehner, B., Abell, R., Hamilton, S.K., Kellndorfer, J., Powell, G. & Riveros, J. 2007.Freshwater conservation planning in data-poor areas: An example from a remoteAmazonian basin (Madre de Dios River, Peru and Bolivia). Biological Conservation,135: 484-501.Van den Berg, E.C., Plarre, C., Van den Berg, H.M. & Thompson, M.W. 2008. The SouthAfrican National Land Cover 2000. Agricultural Research Council (ARC) and Councilfor Scientific and Industrial Research (CSIR), Pretoria. Report No. GW/A/2008/86.Van Deventer, H., Nel, J.L., Maherry, A. & Mbona, N. In review. Calculating landforms at acountry-wide scale. Landscape and urban planning.Van Niekerk, L. & Turpie, J.K. (eds) 2011. National <strong>Biodiversity</strong> Assessment 2011: EstuariesComponent. CSIR Report, CSIR, Stellenbosch, South Africa.Van Nieuwenhuizen, G.D.P. & Day, J. 2000. Cape Action Plan for the Environment: TheConservation of Freshwater Ecosystems in the Cape Floral Kingdom. Freshwater Unit,University of Cape Town, South Africa.AcronymsB<strong>GIS</strong><strong>Biodiversity</strong> <strong>GIS</strong> Website (http://bgis.sanbi.org)C.A.P.E. Cape Action Plan for People and the EnvironmentCSIRCouncil for Scientific and Industrial ResearchFEPA Freshwater Ecosystem Priority Area<strong>GIS</strong>Geographic Information SystemKZNKwaZulu-Natal<strong>NFEPA</strong> National Freshwater Ecosystem Priority AreaNGO Non-Governmental OrganisationSAIAB South African Institute of Aquatic <strong>Biodiversity</strong><strong>SANBI</strong> South African National <strong>Biodiversity</strong> InstituteSanParks South African National ParksWRC Water Research CommissionWWF Worldwide Fund for NatureAcronyms - 58 -
GlossaryBench (landform): An area of mostly level or nearly level high ground (relativeto the broad surroundings), including hilltops/crests (areas at the top of a mountainor hill flanked by down-slopes in all directions), saddles (relatively high-lying areasflanked by down-slopes on two sides in one direction and up-slopes on two sides in anapproximately perpendicular direction), and shelves/terraces/ledges (relatively high-lying,localised flat areas along a slope, representing a break in slope with an up-slope on oneside and a down-slope on the other side in the same direction).Best attainable ecological category: The ecological category that is mostclose to natural (category A) to which an ecosystem can be rehabilitated/restored. Seeglossary descriptions for ecological category and rehabilitation/restoration.<strong>Biodiversity</strong>: The diversity of genes, species, ecosystems and landscapes on Earth,and the ecological and evolutionary processes that maintain this diversity.<strong>Biodiversity</strong> feature: An element of biodiversity for which it is possible to set aquantitative biodiversity target, for example a vegetation type, a river ecosystem type, aspecies, or the spatial component of an ecological process.Bioregional plan (published in terms of the <strong>Biodiversity</strong> Act):A map of biodiversity priority areas (critical biodiversity areas and ecological supportareas), for a municipality or group of municipalities, accompanied by contextualinformation, land- and resource-use guidelines and supporting <strong>GIS</strong> information. Themap must be produced using the principles and methods of systematic biodiversityplanning. A bioregional plan represents the biodiversity sector’s input to planning anddecision-making in a range of other sectors. The development of a bioregional plan isusually led by the relevant provincial conservation authority or provincial environmentalaffairs department. A bioregional plan that has not yet been published in the GovernmentGazette in terms of the <strong>Biodiversity</strong> Act is referred to as a biodiversity sector plan.Catchment: A catchment is the area (a geographical region) where water fromrain (or snow) becomes concentrated and drains downhill into a river or lake. The termincludes all land surface, streams, rivers, and lakes between the source and where thewater enters the ocean.Channelled valley-bottom wetland: A mostly flat valley-bottom wetlanddissected by and typically elevated above a channel. The dominant water supply is usuallyfrom the channel, as surface flow resulting from overtopping of the channel banks, asinterflow, or from adjacent valley-side slopes (as overland flow or interflow).Condition: The ecological health or integrity of an ecosystem, assessed usingcategories that describe the degree of modification from natural condition. For <strong>NFEPA</strong>,condition was assessed using all available data, including present ecological statedata (Kleynhans 2000), River Health Programme data, reserve determination data andmodelling of land cover where no other data existed, as well as expert knowledge. (Alsosee ecological category and present ecological state).Critical <strong>Biodiversity</strong> Areas: Those areas required to meet quantitative targets forbiodiversity, as determined by an integrated terrestrial and aquatic systematic biodiversityplan. These areas are critical for conserving biodiversity and maintaining ecosystemfunctioning in the long term. These areas differ from FEPAs in that they are usuallydetermined at a finer, sub-national scale and integrate terrestrial and aquatic priority areas.Depression (landform): A landform with closed elevation contours that increasesin depth from the perimeter to a central area of greatest depth, and within which watertypically accumulates. Water supplied by precipitation, ground water discharge, interflowand (diffuse or concentrated) overland flow. Depressions may be flat-bottomed, referredto as ‘pans’ or round-bottomed, referred to as ‘basins’. They may have any combination ofinlets and outlets or lack them completely.Ecological category: A simplified measure of the extent that an ecosystem has beenaltered from natural condition due to human impact. There are six ecological categories(Table 4.1) ranging from A (natural) to F (critically/extremely modified), derived usingexpert assessment of specific criteria. (Also see condition and present ecological state).Ecological integrity: Used to describe the extent that ecosystems have been alteredby humans from their original natural condition. (Also see condition, ecological categoryand present ecological state).Ecological processes: The processes that operate to maintain and generatebiodiversity and ensure the continued functioning of ecosystems. Ecosystems functionbecause they are maintained by ecological processes such as nutrient cycling, naturaldisturbance regimes (e.g. flow regime), groundwater recharge, filtering of pollutants andmigration of species. Systematic biodiversity plans seek to map and set targets for spatialcomponents of these ecological processes, such as large-scale landscape corridors, groundwaterrecharge areas or the buffer of natural vegetation area around a wetland or river.Ecological processes often form the foundation of ecosystem service delivery for people.Ecological Support Areas: Those areas that play a significant role in supportingecological functioning of Critical <strong>Biodiversity</strong> Areas and/or delivering ecosystem services, asdetermined in a systematic biodiversity plan.Ecoregions: Areas with relative homogeneity in ecosystems. Within an ecoregion themosaic of ecosystem components (biotic and abiotic, as well as terrestrial and aquatic) isdifferent to that of adjacent ecoregions.Ecosystem: Refers to the assemblage of living organisms, the interactions betweenthem and with their physical environment. Every ecosystem is characterised by itscomposition (living and non-living components of which it consists), the structure (howthe components are organised in space and time) and the ecological processes (functionssuch as nutrient cycling) that maintain the structure and composition and so maintain theecosystem as a functioning unit. Ecosystems can operate at different scales – from verysmall (a pond) to whole landscapes (an entire Water Management Area).Ecosystem-based adaptation: Using biodiversity and ecosystem services aspart of an overall strategy to help people adapt to the adverse effects of climate change.It involves maintaining ecosystems in a natural, near-natural or functioning state, orrestoring ecosystems where necessary, to support human adaptation to climate change.Ecosystem services: The benefits that people obtain from ecosystems, includingprovisioning services (such as food, water, reeds), regulating services (such as floodcontrol), cultural services (such as recreational fishing), and supporting services (such asnutrient cycling, carbon storage) that maintain the conditions for life on Earth.Endemic: A plant or animal species, or an ecosystem type, which is naturally restrictedto a particular defined region (not to be confused with indigenous). For example, a fishmay be endemic to South Africa in which case it occurs naturally in no other country, orendemic only to a specific river, which means it occurs naturally only in that particularriver and nowhere else in the country or world.Fish Migration Corridor: These areas cater for large migratory threatened andnear threatened fish species that require connectivity between habitats, usually betweenthe mainstem and tributary habitats.Dirk RouxGlossary - 59 -
Fish Support Area: Fish sanctuaries are sub-quaternary catchments that arerequired to meet biodiversity targets for threatened and near threatened fish speciesindigenous to South Africa. Fish sanctuaries in sub-quaternary catchments associatedwith a river reach in good condition (A or B ecological category) were selected as FEPAs;the remaining fish sanctuaries became Fish Support Areas. Fish Support Areas alsoinclude sub-quaternary catchments that are important for migration of threatened andnear threatened fish species. River reaches in Fish Support Areas need to be maintainedin a condition that supports the associated populations of threatened fish species, whichneed not necessarily be an A or B ecological category.Flat wetland: A wetland area with little or no relief or gradient, situated on a plainor a bench. Water is mainly supplied by precipitation, with the exception of coastal flatswhere the water may be supplied by a high water table (i.e. groundwater).Floodplain wetland: A flat or gently sloping wetland area adjacent to andformed by a lowland or upland floodplain river. Periodic inundation by overtopping ofthe channel bank may occur and water and sediment input is mainly via overtoppingof a major channel, although there could be some overland or subsurface flow fromadjacent valley side-slopes (if present).Freshwater Ecosystem Priority Areas (FEPAs): Strategic spatialpriorities for conserving freshwater ecosystems and associated biodiversity, determinedthrough a process of systematic biodiversity planning and identified using dataon freshwater ecosystem types, species and ecological processes. FEPAs are oftentributaries and wetlands that support hard-working main rivers, and are an essentialpart of an equitable and sustainable water resource strategy. FEPAs need to stay in agood condition to manage and conserve freshwater ecosystems, and to protect waterresources for human use. This does not mean that FEPAs need to be fenced off fromhuman use, but rather that they should be supported by good planning, decision-makingand management to ensure that human use does not impact on the condition ofthe ecosystem. The current and recommended condition for all river FEPAs is A or Becological category (see Table 1 for description of ecological categories). Wetland orestuary FEPAs that are currently in a condition lower than A or B should be rehabilitatedto the best attainable ecological condition.Mountain Catchment Areas: High water yield areas that contribute significantlyto the overall water supply in the country. They are located in high mountainous areasand are regarded as ‘water factories’, supporting growth and development needs that arelocated long distances away.National <strong>Biodiversity</strong> Framework: The <strong>Biodiversity</strong> Act provides forthe publication of a National <strong>Biodiversity</strong> Framework, which provides a framework toco-ordinate and align the efforts of the many organisations and individuals involvedin conserving and managing South Africa’s biodiversity, in support of sustainabledevelopment. The first National <strong>Biodiversity</strong> Framework, published in 2009, identifies 33priority actions for the period 2008 to 2013, providing an agreed set of priorities to guidethe work of the biodiversity sector in South Africa.National Protected Area Expansion Strategy: Provides a strategy toguide the national and provincial conservation authorities in the expansion of the country’sprotected areas over the next 20 years. The spatial component of the strategy integratespriority areas for terrestrial and freshwater ecosystems and is based on systematicbiodiversity planning principles. The first National Protected Area Expansion Strategy wasdeveloped in 2008, to be reviewed every five years.National wetland classification system: A recently completed hydrogeomorphologicalframework , which was used to identify wetland ecosystem types for <strong>NFEPA</strong>.It is a six-tiered framework, with four spatially-nested primary levels that are applied ina hierarchical manner to distinguish between different wetland ecosystem types on thebasis of ‘primary discriminators’ (i.e. criteria to distinguish consistently between differentcategories at each level of the hierarchy). <strong>NFEPA</strong> wetland ecosystem types were determinedto Level 4 of the hierarchy using desktop data on freshwater ecoregions, vegetation typesand position of the wetland in the landscape. (Also see hydrogeomorphic wetland types).Plain (landform): An extensive area of low relief characterised by relatively level,gently undulating or uniformly sloping land. This includes coastal plains (borderingthe coastline), interior plains (characteristic of the Karoo region), and plateaus (areasof low relief but high altitude occurring at the edge of the escarpment). Plains aredifferentiated from valley floors based on that they are not located in between twoside-slopes (typical of mountain ranges, hills, or other uplands).Present ecological state (PES): The present condition of a river at thetime of assessment or survey, which describes the extent to which a river or wetlandhas been altered by humans from its original, natural condition. Present ecologicalstate is described in six ecological categories (Table 4.1) ranging from A (natural) to F(critically/extremely modified), and is derived using expert assessment of criteria knownto influence the condition of freshwater ecosystems. The ecological categories representa simplified measure of the extent of ecological alteration as assessed by regional experts.(Also see condition and ecological category).Priority estuary: Priority estuaries were identified for the National <strong>Biodiversity</strong>Assessment 2011 (Van Niekerk and Turpie 2011) using systematic biodiversity planning.The estuarine functional zones of all priority estuaries were identified as FEPAs (includesthe main channel of the estuary as well as the zone to which the estuary may expandduring floods). Priority estuaries in good condition (A or B ecological category) need toremain in this condition; those that are currently in a condition lower than A or B shouldbe rehabilitated to the best attainable ecological condition.Protected areas: Areas of land or sea that are formally protected by law (i.e.recognised in terms of the Protected Areas Act) and managed mainly for biodiversityconservation.Freshwater ecosystems: All inland water bodies whether fresh or saline,including rivers, lakes, wetlands, sub-surface waters and estuaries. The incorporation ofgroundwater considerations into the FEPA maps was rudimentary and future refinementof FEPAs should seek to include groundwater more explicitly.Function/functioning/functional: Used here to describe ecosystemsworking or operating in a healthy way (opposite to dysfunctional which means workingpoorly or in an unhealthy way).Dirk RouxHydrogeomorphic wetland types: A framework for mapping wetlandecosystem types based on hydrological and geomorphological characteristics. Thistype of framework uses factors that influence how wetlands function (e.g. climate,landscape setting). For <strong>NFEPA</strong>, wetland ecosystem types were mapped using the recentlycompleted national wetland classification system, which is a hydrogeomorphologicalframework. (Also see national wetland classification system).Glossary - 60 -
Quaternary catchment: South Africa has a system of catchment delineations usedextensively in water resources assessment, planning and management. These catchmentsare nested hydrological units from the primary drainage basin, through to secondary andtertiary catchments, with the smallest operational unit being the quaternary catchment(Midgley et al. 1994).Ramsar wetland: A wetland listed under the ‘Convention on Wetlands ofInternational Importance’, which gives it recognition by the international community asbeing of significant value, not only for the country, but for humanity as a whole (seewww.ramsar.org).Rehabilitation/restoration (Ecological restoration): The process ofassisting the recovery of an ecosystem that has been degraded, damaged, or destroyed,which involves the repair of the natural environment to a state close to its original state.For example, this can be achieved through the removal of invasive alien plants, or the repairof eroded sites and the replanting of indigenous plants. Restoration involves not only thereparation of ecosystem processes, productivity and services, but also the re-establishmentof species composition and community structure.River condition: See condition, ecological category, ecological integrity and presentecological state.River ecosystem types: River reaches with similar physical features, comprisingunique combinations of landscape features, flow variability and channel slope. Rivers withthe same ecosystem type are expected to share similar biological responses under naturalconditions. For <strong>NFEPA</strong>, river ecosystem types were used to represent natural examplesof the diversity of river ecosystems across the country. They were mapped using uniquecombinations of Level 1 ecoregions (Kleynhans et al. 2005), slope categories (Rowntree andWadeson 1999) and permanence of flow (Department of Land Affairs: Chief DirectorateSurveys and Mapping 2005-2007).Sustainable development: Development that serves the needs of both presentand future generations equitably, involving the integration of social, economic and ecologicalfactors into planning, implementation and decision-making.Systematic biodiversity planning: Also known as a systematic conservationplanning. A scientific method for determining spatial areas of biodiversity importance. Itinvolves: mapping biodiversity features (such as ecosystems, species, spatial components ofecological processes); mapping a range of information related to these biodiversity featuresand their condition; setting quantitative targets for biodiversity features; analysing theinformation using software linked to <strong>GIS</strong>; and developing maps that show spatial biodiversitypriorities. The configuration of priority areas is designed to be spatially efficient (i.e. to meetbiodiversity targets in the smallest area possible) and to avoid conflict with other land andwater resource activities where possible.Systematic Conservation Plan: See systematic biodiversity planning.Threatened ecosystems: Ecosystems with a high risk of undergoing significantdegradation of ecological structure, function or composition as a result of human activities.In South Africa, the <strong>Biodiversity</strong> Act provides for listing of threatened ecosystems that aredescribed in three categories with the level of threat escalating as an ecosystem movesfrom vulnerable to endangered to critically endangered. The purpose of listing threatenedecosystems is primarily to reduce the rate of ecosystem and species extinction. This includespreventing further degradation and loss of structure, function and composition of threatenedecosystems.Threatened species: Species at a high risk of extinction as a result of human activities.The IUCN has developed criteria for assessing the conservation status of a species and includesdifferent categories of escalating threat (http://www.iucnredlist.org/). In South Africa, the<strong>Biodiversity</strong> Act provides for listing of threatened species to halt further extinction of species.Unchannelled valley-bottom wetland: Mostly flat valley-bottom wetlandarea without any major channels and there are no distinct channel banks or diffuse flowsoccurring even during and after high rainfall events. Water supply is typically from anupstream channel, as the flow becomes dispersed, from adjacent slopes (if present) orgroundwater.Upstream Management Areas: These are sub-quaternary catchments inwhich human activities need to be managed to prevent the degradation of downstreamFEPAs and Fish Support Areas.Valleyhead seep: A gently sloping wetland area located on a bench setting at thehead of a drainage line, with water inputs mainly from subsurface flow (although there isusually also a convergence of diffuse overland water flow in these areas during and afterrainfall events). Horizontal, unidirectional (down-slope) movement of water in the form ofinterflow and diffuse surface flow dominates within a valleyhead seep, while water exits atthe downstream end as concentrated surface flow where the valleyhead seep becomes achannel.Water Management Area: South Africa has 19 Water Management Areas usedas administrative and management units for implementing water policy and legislation.Catchment Management Agencies are in the process of being established for WaterManagement Areas or groups of Water Management Areas. Water Management Areasare delineated using catchment boundaries and do not match provincial or municipalboundaries.Wetland cluster: A group of wetlands within 1 km of each other that areembedded in a relatively natural landscape matrix through which dispersal betweenwetlands can occur (e.g. of frogs and invertebrates). This allows for important ecologicalprocesses such as migration between wetlands.Slope (landform): An inclined stretch of ground that is not part of a valley floor,which is typically located on the side of a mountain, hill or valley.Sub-quaternary catchment: These are sub-catchments that are broadly nestedin the quaternary catchments used by Department of Water Affairs (Midgley et al. 1994).The watershed is delineated around each river reach, where a river reach is defined as theportion of river between the confluences on the 1:500 000 river network <strong>GIS</strong> layer. (Also seequaternary catchment).Sub-Water Management Area: Areas within a Water Management Area thatusually serve as management units. They are broadly based on the catchments of largetributaries within the Water Management Area.Lesa van RooyenGlossary - 61 -