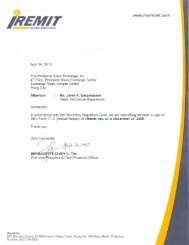
SEC Form 20-IS - iRemit Global Remittance
SEC Form 20-IS - iRemit Global Remittance
SEC Form 20-IS - iRemit Global Remittance

You also want an ePaper? Increase the reach of your titles
YUMPU automatically turns print PDFs into web optimized ePapers that Google loves.
Below are the comparative key performance indicators of the Company (Parent Company and subsidiaries):<br />
Performance Indicator Definition December 31, <strong>20</strong>09 December 31, <strong>20</strong>08<br />
Return on Equity (ROE)<br />
Net income* over average stockholders’ equity during the<br />
period<br />
11% 12%<br />
Return on Assets (ROA) Net income* over average total assets during the period 6% 8%<br />
Earnings per Share (EPS) Net income* over average number of outstanding shares PHP 0.24 PHP 0.23<br />
Sales Growth<br />
Total transaction value in USD in present period over the<br />
previous year<br />
2% 42%<br />
Gross Income Revenue less total cost of services (PHP millions) 547.7 565.4<br />
* Net Income attributable to equity holders of the Parent Company and Minority Interest. EPS computed using Net Income<br />
attributable to equity holders of the Parent Company for the year ended December 31, <strong>20</strong>09 and for the year ended<br />
December 31, <strong>20</strong>08 are PHP 0.25 and PHP 0.23, respectively.<br />
Below are the comparative key performance indicators of the Company’s subsidiaries:<br />
International <strong>Remittance</strong> (Canada) Ltd.<br />
Performance Indicator Definition December 31, <strong>20</strong>09 December 31, <strong>20</strong>08<br />
Return on Equity (ROE)<br />
Net income over average stockholders’ equity during the<br />
period<br />
33% 62%<br />
Return on Assets (ROA) Net income over average total assets during the period 10% 9%<br />
Earnings per Share (EPS) Net income over average number of outstanding shares PHP 18.18 PHP 26.60<br />
Sales Growth<br />
Total transaction value in USD in present period over the<br />
previous year<br />
11% 35%<br />
Gross Income Revenue less total cost of services (PHP millions) 99.7 85.8<br />
Lucky Star Management Limited<br />
Performance Indicator Definition December 31, <strong>20</strong>09 December 31, <strong>20</strong>08<br />
Return on Equity (ROE)<br />
Net income over average stockholders’ equity during the<br />
period<br />
47% 61%<br />
Return on Assets (ROA) Net income over average total assets during the period 14% 40%<br />
Earnings per Share (EPS) Net income over average number of outstanding shares PHP 11.18 PHP 15.67<br />
Sales Growth<br />
Total transaction value in USD in present period over the<br />
previous year<br />
<strong>20</strong>% 7%<br />
Gross Income Revenue less total cost of services (PHP millions) 21.4 <strong>20</strong>.9<br />
IRemit <strong>Global</strong> <strong>Remittance</strong> Limited<br />
Performance Indicator Definition December 31, <strong>20</strong>09 December 31, <strong>20</strong>08<br />
Return on Equity (ROE)<br />
Net income over average stockholders’ equity during the<br />
period<br />
60% 5%<br />
Return on Assets (ROA) Net income over average total assets during the period 4.08% 0.2%<br />
Earnings per Share (EPS) Net income over average number of outstanding shares PHP 10,021.79 PHP 666.34<br />
Sales Growth<br />
Total transaction value in USD in present period over the<br />
previous year<br />
-17% -4%<br />
Gross Income Revenue less total cost of services (PHP millions) 46.9 42.2<br />
I-Remit Australia Pty Ltd<br />
Performance Indicator Definition December 31, <strong>20</strong>09 December 31, <strong>20</strong>08<br />
Return on Equity (ROE)<br />
Net income over average stockholders’ equity during the<br />
period<br />
176% 108%<br />
Return on Assets (ROA) Net income over average total assets during the period 24% 17%<br />
Earnings per Share (EPS) Net income over average number of outstanding shares PHP 1,859,480.93 PHP 1,623,710.00<br />
Sales Growth<br />
Total transaction value in USD in present period over the<br />
previous year<br />
- -<br />
Gross Income Revenue less total cost of services (PHP millions) 0.2 0.4<br />
Worldwide Exchange Pty Ltd<br />
Performance Indicator Definition December 31, <strong>20</strong>09 December 31, <strong>20</strong>08<br />
Return on Equity (ROE)<br />
Net income over average stockholders’ equity during the<br />
period<br />
41% 91%<br />
Return on Assets (ROA) Net income over average total assets during the period 11% 45%<br />
Earnings per Share (EPS) Net income over average number of outstanding shares PHP 29.75 PHP 106.93<br />
Sales Growth<br />
Total transaction value in USD in present period over the<br />
previous year<br />
-5% 40%<br />
Gross Income Revenue less total cost of services (PHP millions) 32.6 35.0<br />
10