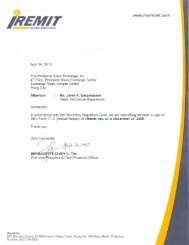
SEC Form 20-IS - iRemit Global Remittance
SEC Form 20-IS - iRemit Global Remittance
SEC Form 20-IS - iRemit Global Remittance

Create successful ePaper yourself
Turn your PDF publications into a flip-book with our unique Google optimized e-Paper software.
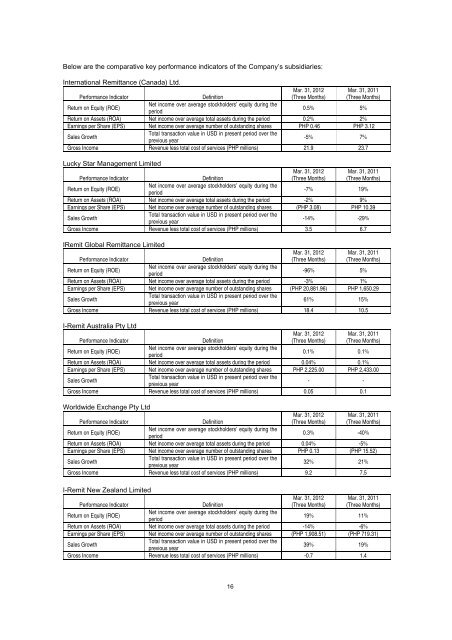
Below are the comparative key performance indicators of the Company’s subsidiaries:<br />
International <strong>Remittance</strong> (Canada) Ltd.<br />
Mar. 31, <strong>20</strong>12 Mar. 31, <strong>20</strong>11<br />
Performance Indicator Definition<br />
(Three Months) (Three Months)<br />
Return on Equity (ROE)<br />
Net income over average stockholders’ equity during the<br />
period<br />
0.5% 5%<br />
Return on Assets (ROA) Net income over average total assets during the period 0.2% 2%<br />
Earnings per Share (EPS) Net income over average number of outstanding shares PHP 0.46 PHP 3.12<br />
Sales Growth<br />
Total transaction value in USD in present period over the<br />
previous year<br />
-5% 7%<br />
Gross Income Revenue less total cost of services (PHP millions) 21.9 23.7<br />
Lucky Star Management Limited<br />
Mar. 31, <strong>20</strong>12 Mar. 31, <strong>20</strong>11<br />
Performance Indicator Definition<br />
(Three Months) (Three Months)<br />
Return on Equity (ROE)<br />
Net income over average stockholders’ equity during the<br />
period<br />
-7% 19%<br />
Return on Assets (ROA) Net income over average total assets during the period -2% 9%<br />
Earnings per Share (EPS) Net income over average number of outstanding shares (PHP 3.08) PHP 10.39<br />
Sales Growth<br />
Total transaction value in USD in present period over the<br />
previous year<br />
-14% -29%<br />
Gross Income Revenue less total cost of services (PHP millions) 3.5 6.7<br />
IRemit <strong>Global</strong> <strong>Remittance</strong> Limited<br />
Mar. 31, <strong>20</strong>12 Mar. 31, <strong>20</strong>11<br />
Performance Indicator Definition<br />
(Three Months) (Three Months)<br />
Return on Equity (ROE)<br />
Net income over average stockholders’ equity during the<br />
period<br />
-96% 5%<br />
Return on Assets (ROA) Net income over average total assets during the period -3% 1%<br />
Earnings per Share (EPS) Net income over average number of outstanding shares (PHP <strong>20</strong>,881.96) PHP 1,650.29<br />
Sales Growth<br />
Total transaction value in USD in present period over the<br />
previous year<br />
61% 15%<br />
Gross Income Revenue less total cost of services (PHP millions) 18.4 10.5<br />
I-Remit Australia Pty Ltd<br />
Mar. 31, <strong>20</strong>12 Mar. 31, <strong>20</strong>11<br />
Performance Indicator Definition<br />
(Three Months) (Three Months)<br />
Return on Equity (ROE)<br />
Net income over average stockholders’ equity during the<br />
period<br />
0.1% 0.1%<br />
Return on Assets (ROA) Net income over average total assets during the period 0.04% 0.1%<br />
Earnings per Share (EPS) Net income over average number of outstanding shares PHP 2,225.00 PHP 2,433.00<br />
Sales Growth<br />
Total transaction value in USD in present period over the<br />
previous year<br />
- -<br />
Gross Income Revenue less total cost of services (PHP millions) 0.05 0.1<br />
Worldwide Exchange Pty Ltd<br />
Mar. 31, <strong>20</strong>12 Mar. 31, <strong>20</strong>11<br />
Performance Indicator Definition<br />
(Three Months) (Three Months)<br />
Return on Equity (ROE)<br />
Net income over average stockholders’ equity during the<br />
period<br />
0.3% -40%<br />
Return on Assets (ROA) Net income over average total assets during the period 0.04% -5%<br />
Earnings per Share (EPS) Net income over average number of outstanding shares PHP 0.13 (PHP 15.52)<br />
Sales Growth<br />
Total transaction value in USD in present period over the<br />
previous year<br />
32% 21%<br />
Gross Income Revenue less total cost of services (PHP millions) 9.2 7.5<br />
I-Remit New Zealand Limited<br />
Mar. 31, <strong>20</strong>12 Mar. 31, <strong>20</strong>11<br />
Performance Indicator Definition<br />
(Three Months) (Three Months)<br />
Return on Equity (ROE)<br />
Net income over average stockholders’ equity during the<br />
period<br />
19% 11%<br />
Return on Assets (ROA) Net income over average total assets during the period -14% -6%<br />
Earnings per Share (EPS) Net income over average number of outstanding shares (PHP 1,908.51) (PHP 719.31)<br />
Sales Growth<br />
Total transaction value in USD in present period over the<br />
previous year<br />
39% 19%<br />
Gross Income Revenue less total cost of services (PHP millions) -0.7 1.4<br />
16