abridged report - Nielsen
abridged report - Nielsen
abridged report - Nielsen

Create successful ePaper yourself
Turn your PDF publications into a flip-book with our unique Google optimized e-Paper software.
Member Implications<br />
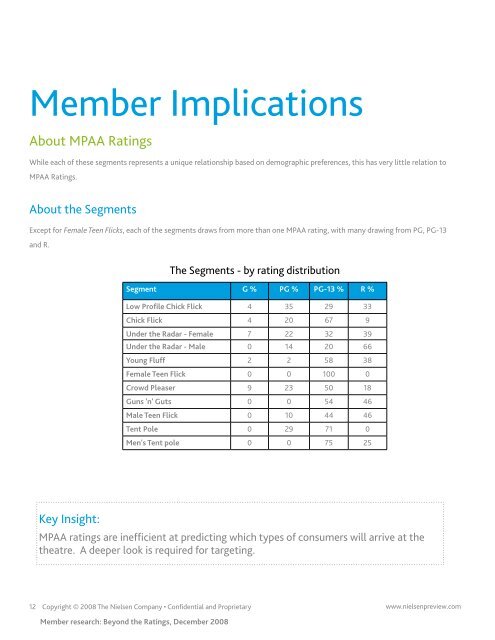
About MPAA Ratings<br />
While each of these segments represents a unique relationship based on demographic preferences, this has very little relation to<br />
MPAA Ratings.<br />
About the Segments<br />
Except for Female Teen Flicks, each of the segments draws from more than one MPAA rating, with many drawing from PG, PG-13<br />
and R.<br />
Key Insight:<br />
MPAA ratings are inefficient at predicting which types of consumers will arrive at the<br />
theatre. A deeper look is required for targeting.<br />
12 Copyright © 2008 The <strong>Nielsen</strong> Company • Confidential and Proprietary www.nielsenpreview.com<br />
Member research: Beyond the Ratings, December 2008<br />
The Segments - by rating distribution<br />
Segment G % PG % PG-13 % R %<br />
Low Profile Chick Flick 4 35 29 33<br />
Chick Flick 4 20 67 9<br />
Under the Radar - Female 7 22 32 39<br />
Under the Radar - Male 0 14 20 66<br />
Young Fluff 2 2 58 38<br />
Female Teen Flick 0 0 100 0<br />
Crowd Pleaser 9 23 50 18<br />
Guns 'n' Guts 0 0 54 46<br />
Male Teen Flick 0 10 44 46<br />
Tent Pole 0 29 71 0<br />
Men's Tent pole 0 0 75 25