2010 Radio Ratings Survival Kit - Nielsen
2010 Radio Ratings Survival Kit - Nielsen
2010 Radio Ratings Survival Kit - Nielsen

Create successful ePaper yourself
Turn your PDF publications into a flip-book with our unique Google optimized e-Paper software.
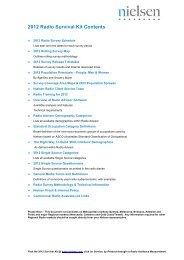
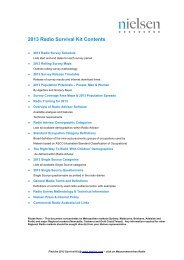
<strong>2010</strong> <strong>Radio</strong> <strong>Survival</strong> <strong>Kit</strong> Contents<br />
♦ <strong>2010</strong> <strong>Radio</strong> Survey Schedule<br />
Lists start and end dates for each survey period<br />
♦ <strong>2010</strong> Rolling Survey Map<br />
Outlines rolling survey methodology<br />
♦ <strong>2010</strong> Survey Release Timetable<br />
Release of survey results, Internet download and collection times,<br />
and <strong>Radio</strong> Data download guide<br />
♦ <strong>2010</strong> Population Potentials – People, Men & Women<br />
By Age/Sex and Grocery Buyer<br />
♦ Survey Coverage Area Maps & <strong>2010</strong> Population Spreads<br />
♦ <strong>Nielsen</strong> <strong>Radio</strong> Client Service Team<br />
♦ <strong>Radio</strong> <strong>Ratings</strong> Internet Website<br />
♦ <strong>Radio</strong> Training for <strong>2010</strong><br />
♦ Overview of <strong>Radio</strong> Advisor Software<br />
Available analyses and features<br />
Technical requirements<br />
♦ <strong>Radio</strong> Advisor Demographic Categories<br />
Lists all available demographics within <strong>Radio</strong> Advisor<br />
♦ Standard Occupation Category Definitions<br />
Broad definition of the nine socio-economic groups of occupations used by<br />
<strong>Nielsen</strong> based on ASCO (Australian Standard Classification of Occupations)<br />
♦ <strong>2010</strong> Single Source Categories<br />
Lists all available Single Source categories<br />
♦ <strong>2010</strong> Single Source Questionnaire<br />
Single Source questionnaire as printed in the radio diaries<br />
♦ <strong>Radio</strong> Facts Sheet<br />
♦ Panorama and AdEx Reviews<br />
♦ General Media Terms and Definitions<br />
Definitions of commonly used radio audience terms, with examples<br />
♦ <strong>Radio</strong> Survey Methodology & Technical Information<br />
♦ Digital <strong>Radio</strong> in Australia – Fast Facts<br />
♦ Commercial <strong>Radio</strong> Australia Ltd - Code of Ethics<br />
Relating to use of Survey Information<br />
♦ <strong>Nielsen</strong> Press & Internet Policy<br />
♦ Map of Commercial and ABC stations<br />
Please Note: - This document concentrates on Metropolitan markets (Sydney, Melbourne, Brisbane, Adelaide and<br />
Perth) and major Regional markets (Newcastle, Canberra and Gold Coast/Tweed). Any information required for other<br />
Regional <strong>Radio</strong> markets should be sought directly from your <strong>Nielsen</strong> representative.<br />
Find the <strong>2010</strong> <strong>Survival</strong> <strong>Kit</strong> @ www.nielsen.com, click on Service, by Product through to <strong>Radio</strong> Audience Measurement.
WEEK NO<br />
Survey Weeks<br />
Sunday-Saturday<br />
01 Dec 27 Jan 2<br />
02 Jan 3 9<br />
03 10 16<br />
04 17 23<br />
05 24 30<br />
06 31 Feb 6<br />
07 Feb 7 13<br />
08 14 20<br />
09 21 27<br />
10 28 Mar 6<br />
11 Mar 7 13<br />
12 14 20<br />
13 21 27<br />
14 28 Apr 3<br />
15 Apr 4 10<br />
16 11 17<br />
17 18 24<br />
18 25 May 1<br />
19 May 2 8<br />
20 9 15<br />
21 16 22<br />
22 23 29<br />
23 30 Jun 5<br />
24 Jun 6 12<br />
25 13 19<br />
26 20 26<br />
27 27 Jul 3<br />
28 Jul 4 10<br />
29 11 17<br />
30 18 24<br />
31 25 31<br />
32 Aug 1 Aug 7<br />
33 8 14<br />
34 15 21<br />
35 22 28<br />
36 29 Sep 4<br />
37 Sep 5 11<br />
38 12 18<br />
39 19 25<br />
40 26 Oct 2<br />
41 Oct 3 9<br />
42 10 16<br />
43 17 23<br />
44 24 30<br />
45 31 Nov 6<br />
46 Nov 7 13<br />
47 14 20<br />
48 21 27<br />
49 28 Dec 4<br />
50 Dec 5 11<br />
51 12 18<br />
52 19 25<br />
SYDNEY<br />
NOTE:<br />
Some Survey dates may be subject to change. Subscribers will be advised of any<br />
changes to the above schedule.<br />
Survey dates for major regional markets are yet to be determined. They will be added<br />
to this schedule after they have been determined.<br />
MELBOURNE<br />
2005 <strong>2010</strong> <strong>Radio</strong> Survey Schedule<br />
BRISBANE<br />
ADELAIDE<br />
PERTH<br />
NEWCASTLE<br />
CANBERRA<br />
GOLD<br />
WOLLONGONG<br />
COAST/TWEED<br />
CAMPBELLTOWN<br />
WOLLONGONG<br />
EASTER<br />
OTHER<br />
GOLD COAST<br />
REGIONAL<br />
Metropolitan Release Dates:<br />
Survey #1 - Thu, Feb 25<br />
Survey #2 - Tue, Mar 30<br />
Survey #3 - Tue, May 11<br />
Survey #4 - Tue, Jun 22<br />
Survey #5 - Tue, Aug 10<br />
Survey #6 - Tue, Sep 14<br />
Survey #7 - Mon, Nov 1<br />
Survey #8 - Tue, Dec 14<br />
OTHER<br />
REGIONAL<br />
School Holidays<br />
EASTER April 2-4
<strong>2010</strong> Reporting Periods for<br />
Rolling Surveyed Markets<br />
SYDNEY, MELBOURNE, BRISBANE, ADELAIDE, PERTH<br />
SURVEY No. REPORTING PERIODS RELEASE DATE<br />
1 Jan 17 to Feb 13 Thu February 25<br />
2 Jan 31 to Mar 20 Tue March 30<br />
3 Feb 14 to Mar 20 and Mar 28 to May 1 Tue May 11<br />
4 Mar 28 to May 1 and May 9 to Jun 12 Tue June 22<br />
5 May 9 to Jun 12 and Jun 27 to Jul 31 Tue August 10<br />
6 Jun 27 to Sep 4 Tue September 14<br />
7 Aug 1 to Sep 4 and Sep 19 to Oct 23 Mon November 1<br />
8 Sep 19 to Oct 23 and Oct 31 to Dec 4 Tue December 14<br />
NEWCASTLE<br />
SURVEY No. REPORTING PERIODS RELEASE DATE<br />
1 Jan 17 to Apr 17 ** Fri April 23<br />
2 2nd half of #1 & Apr 25 to Jul 24 ** Fri July 30<br />
3 Apr 25 to Jul 24 & Aug 1 to Oct 30 ** Fri November 5<br />
** ‘Blind’ Surveys (eg. Newcastle waves 1, 2 & 3)<br />
Rather than a fixed two-week period, where the sample is<br />
placed evenly across 2 or more weeks, the blind survey<br />
concept utilises a 3-month (13-week) period.<br />
The sample is placed evenly over a minimum of eight of the<br />
thirteen weeks within the period, and a relatively even number<br />
of SLA’s are surveyed each week. These selected weeks<br />
need not necessarily be consecutive and would not be<br />
disclosed to the participating stations.<br />
The nature of regional radio markets will possibly lead to<br />
knowledge by the stations of when the first diaries are placed<br />
in the market. However, as the diaries will be placed over at<br />
least another seven weeks and with probably a number of nonsurvey<br />
weeks in the period, it would be difficult for stations to<br />
implement any promotional activity that would bear rewards of<br />
increased audience within the measured period.<br />
All other aspects of the survey would remain identical to the<br />
system used in the past.<br />
For a more detailed explanation of the ‘blind’ survey<br />
methodology, please contact your local <strong>Nielsen</strong> Media<br />
representative.<br />
REGIONAL MARKETS<br />
SURVEY No. RELEASE DATE<br />
Canberra #1 Wed Apr 7<br />
Wollongong #1 tba<br />
Gold Coast/Tweed #1 Thu Apr 22<br />
Canberra #2 Wed Sep 16<br />
Gold Coast/Tweed #2 Thu Oct 14<br />
Central Coast (NSW) #1 tba<br />
NOTE: Survey reporting periods may be subject to change. Subscribers will be advised of any changes to the<br />
above schedule.
Wk<br />
No<br />
Survey Weeks<br />
Sunday-Saturday<br />
<strong>2010</strong> ROLLING SURVEY SCHEDULE<br />
Sydney, Melbourne, Brisbane, Adelaide, Perth<br />
Interviewing<br />
Weeks<br />
Survey<br />
Release<br />
Dates<br />
01 Dec 27 Jan 2<br />
02 Jan 3 9<br />
03 10 16<br />
04 17 23<br />
05 24 30 Wave Report Thu<br />
06 31 Feb 6 #1 #1 Feb 25<br />
07 Feb 7 13<br />
08 14 20<br />
09 21 27 Wave Report Tue<br />
10 28 Mar 6 #2 #2 Mar 30<br />
11 Mar 7 13<br />
12 14 20<br />
13 21 27<br />
14 28 Apr 3<br />
15 Apr 4 10 Wave Report Tue<br />
16 11 17 #3 #3 May 11<br />
17 18 24<br />
18 25 May 1<br />
19 May 2 8<br />
20 9 15<br />
21 16 22 Wave Report Tue<br />
22 23 29 #4 #4 Jun 22<br />
23 30 Jun 5<br />
24 Jun 6 12<br />
25 13 19<br />
26 20 26<br />
27 27 Jul 3<br />
28 Jul 4 10 Wave Report Tue<br />
29 11 17 #5 #5 Aug 10<br />
30 18 24<br />
31 25 31<br />
32 Aug 1 Aug 7<br />
33 8 14 Wave Report Tue<br />
34 15 21 #6 #6 Sep 14<br />
35 22 28<br />
36 29 Sep 4<br />
37 Sep 5 11<br />
38 12 18<br />
39 19 25<br />
40 26 Oct 2 Wave Report Mon<br />
41 Oct 3 9 #7 #7 Nov 1<br />
42 10 16<br />
43 17 23<br />
44 24 30<br />
45 31 Nov 6<br />
46 Nov 7 13 Wave Report Tue<br />
47 14 20 #8 #8 Dec 14<br />
48 21 27<br />
49 28 Dec 4<br />
50 Dec 5 11<br />
51 12 18<br />
52 19 25<br />
The <strong>Nielsen</strong> Company - <strong>2010</strong> <strong>Radio</strong> <strong>Survival</strong> <strong>Kit</strong> .
<strong>2010</strong> Metropolitan <strong>Radio</strong> Survey Release<br />
Timetable for <strong>Radio</strong> Stations<br />
Below is the timetable for the data files download availability and Survey Release times for <strong>Radio</strong><br />
Stations for <strong>2010</strong><br />
Release to radio stations will be in the form of a telephone call to management with top-line results, and security password<br />
for downloaded survey data.<br />
Survey #1<br />
Data Download from<br />
Wednesday Feb 24<br />
Survey Release Time<br />
Thursday Feb 25<br />
Survey #2<br />
Data Download from<br />
Monday Mar 29<br />
Survey Release Time<br />
Tuesday Mar 30<br />
Sydney Melbourne Brisbane Adelaide Perth<br />
9:00am* 9:00am*<br />
9:00am* 9:00am*<br />
9:00am*<br />
(10:00am)<br />
9:30am<br />
(10:30am)<br />
9:00am*<br />
(10:00am)<br />
9:30am<br />
(10:30am)<br />
9:00am*<br />
(9:30am)<br />
10:00am<br />
(10:30am)<br />
9:00am*<br />
(9:30am)<br />
10:00am<br />
(10:30am)<br />
9:00am*<br />
(1:00pm)<br />
8:30am<br />
(11:30pm)<br />
9:00am*<br />
(1:00pm)<br />
8:30am<br />
(11:30pm)<br />
Survey #3 (Daylight Saving ends Apr 4)<br />
Data Download from<br />
Monday May 10<br />
Survey Release Time<br />
Tuesday May 11<br />
Survey #4<br />
Data Download from<br />
Monday Jun 21<br />
Survey Release Time<br />
Tuesday Jun 22<br />
Survey #5<br />
Data Download from<br />
Monday Aug 9<br />
Survey Release Time<br />
Tuesday Aug 10<br />
Survey #6<br />
Data Download from<br />
Monday Sept 13<br />
Survey Release Time<br />
Tuesday Sept 14<br />
9:00am* 9:00am* 9:00am*<br />
9:00am* 9:00am* 9:00am*<br />
9:00am* 9:00am* 9:00am*<br />
9:00am* 9:00am* 9:00am*<br />
9:00am*<br />
(9:30am)<br />
9:00am*<br />
(9:30am)<br />
9:00am*<br />
(9:30am)<br />
9:00am*<br />
(9:30am)<br />
9:00am*<br />
(11:00am)<br />
8:30am<br />
(10:30am)<br />
9:00am*<br />
(11:00am)<br />
8:30am<br />
(10:30am)<br />
9:00am*<br />
(11:00am)<br />
9:00am*<br />
(11:00am)<br />
Survey #7 (Daylight Saving starts Oct 3)<br />
Data Download from<br />
Friday Oct 29**<br />
Survey Release Time<br />
Monday Nov 1**<br />
Survey #8<br />
Data Download from<br />
Monday Dec 13<br />
Survey Release Time<br />
Tuesday Dec 14<br />
10:00am 10:00am<br />
10:00am 10:00am<br />
10:00am 10:00am<br />
9:00am* 9:00am*<br />
9:00am* 9:00am*<br />
10:30am<br />
10:00am 10:00am 10:30am<br />
9:00am*<br />
(10:00am)<br />
9:00am*<br />
(10:00am)<br />
10:00am<br />
(10:30am)<br />
10:00am<br />
(10:30am)<br />
9:00am*<br />
(9:30am)<br />
9:00am*<br />
(9:30am)<br />
9:00am*<br />
(1:00pm)<br />
9:00am*<br />
(1:00pm)<br />
NOTE: Times shown are local (Time in brackets is EST/EDST, ie. Sydney time)<br />
* We will endevour to have data download available by the specificed time above. If this is not possible it will then be available by Midnight.<br />
** Tuesday Nov 2 Melbourne Cup Day<br />
Newcastle, Canberra & Gold Coast/Tweed - download 12md day prior to release. Release day: Results 10am.<br />
The <strong>Nielsen</strong> Company - <strong>2010</strong> <strong>Radio</strong> <strong>Survival</strong> <strong>Kit</strong>.<br />
10:00am 10:00am 10:30am<br />
10:00am 10:00am 10:30am<br />
10:00am 10:00am<br />
10:00am 10:00am<br />
9:30am<br />
(10:30am)<br />
9:30am<br />
(10:30am)<br />
10:00am<br />
(10:30am)<br />
10:00am<br />
(10:30am)<br />
10:00am<br />
(10:30am)<br />
10:00am<br />
(10:30am)<br />
8:30am<br />
(10:30am)<br />
8:30am<br />
(10:30am)<br />
8:30am<br />
(11:30pm)<br />
8:30am<br />
(11:30pm)
How do I download my survey data?<br />
- for radio stations, data files are ‘password protected’ until 2pm on the day of survey release.<br />
- for ad agency and other subscribers, data files are released after 2pm on the day of survey<br />
release.<br />
Log on to the Gateway site – http://nmr.nielsenmedia.com.au – using your assigned UserID and<br />
Password.<br />
Don’t forget to check for special instructions/announcements<br />
Any special instructions or announcements – things like important update files required for<br />
<strong>Radio</strong> Advisor – are displayed at the top of the Gateway home-page.<br />
It is essential that you check this part of the home-page for any new information.<br />
The <strong>Nielsen</strong> Company – <strong>2010</strong> <strong>Survival</strong> <strong>Kit</strong>.<br />
<strong>Radio</strong> Gateway<br />
Data Download System
How do I download my survey data?<br />
1. Your allocated files, for the current survey, will automatically display on screen<br />
2. You have two options to download the files:<br />
2.1. Check the “Download” box (automatically checking all files) and then click the<br />
“Download” button – this will download one single ‘master’ file.<br />
2.2. Download each file separately – click on the text in the Item Name column.<br />
3. If you choose Step 2.2, then jump to Step 5.<br />
4. Locate the ‘master’ file which you downloaded - NMR179_4_04_2007_4_05_10_PM.exe -<br />
and double-click it…this will expand each of the individual files contained inside…you’re<br />
now ready to ‘unlock’ the password-protected files.<br />
(<strong>Radio</strong> stations only) Note that after 2pm on ‘survey day’, the ‘password-protected’ files are<br />
replaced with non password-protected files. This means you would skip steps 6 and 7 below.<br />
5. (<strong>Radio</strong> stations only) Receive password either from your manager or via email.<br />
6. (<strong>Radio</strong> stations only) Double-click each data file and enter the password when prompted.<br />
7. View the Summary (.pdf) files, or load the <strong>Radio</strong> Advisor data files as required.<br />
The Gateway site acts as your permanent ‘archive’ of past surveys<br />
Simply make your selection at the top of the home page and click ‘Display’<br />
The <strong>Nielsen</strong> Company – <strong>2010</strong> <strong>Survival</strong> <strong>Kit</strong>.
<strong>2010</strong> Population Potentials by Demographics<br />
SYDNEY MELBOURNE BRISBANE ADELAIDE PERTH<br />
Minimum Sample Size 2,400 2,400 2,000 1,750 1,850<br />
PEOPLE 10+ 3,983,000 3,840,000 1,765,000 1,066,000 1,486,000<br />
10-17 440,000 415,000 212,000 116,000 176,000<br />
18-24 482,000 476,000 225,000 127,000 186,000<br />
25-39 1,088,000 1,017,000 467,000 247,000 382,000<br />
40-54 924,000 897,000 412,000 247,000 355,000<br />
55+ 1,049,000 1,035,000 449,000 329,000 387,000<br />
13+ 3,821,000 3,688,000 1,687,000 1,024,000 1,423,000<br />
18+ 3,543,000 3,425,000 1,553,000 950,000 1,310,000<br />
16-24 597,000 584,000 280,000 159,000 232,000<br />
25-34 737,000 683,000 312,000 166,000 256,000<br />
35-44 669,000 648,000 298,000 164,000 249,000<br />
45-59 861,000 828,000 384,000 239,000 331,000<br />
60+ 794,000 790,000 334,000 254,000 288,000<br />
MEN 10+ 1,953,000 1,892,000 869,000 515,000 746,000<br />
10-17 224,000 213,000 108,000 58,000 90,000<br />
18-24 244,000 243,000 113,000 64,000 97,000<br />
25-39 540,000 510,000 234,000 124,000 198,000<br />
40-54 455,000 443,000 202,000 120,000 177,000<br />
55+ 490,000 483,000 212,000 149,000 184,000<br />
13+ 1,871,000 1,814,000 829,000 494,000 713,000<br />
18+ 1,729,000 1,679,000 761,000 457,000 656,000<br />
16-24 303,000 298,000 141,000 80,000 120,000<br />
25-34 366,000 345,000 157,000 84,000 134,000<br />
35-44 331,000 320,000 148,000 81,000 126,000<br />
45-59 422,000 407,000 187,000 115,000 163,000<br />
60+ 366,000 364,000 156,000 113,000 136,000<br />
WOMEN 10+ 2,030,000 1,948,000 896,000 551,000 740,000<br />
10-17 216,000 202,000 104,000 58,000 86,000<br />
18-24 238,000 233,000 112,000 63,000 89,000<br />
25-39 548,000 507,000 233,000 123,000 184,000<br />
40-54 469,000 454,000 210,000 127,000 178,000<br />
55+ 559,000 552,000 237,000 180,000 203,000<br />
13+ 1,950,000 1,874,000 858,000 530,000 710,000<br />
18+ 1,814,000 1,746,000 792,000 493,000 654,000<br />
16-24 294,000 483,000 139,000 79,000 112,000<br />
25-34 371,000 338,000 155,000 82,000 122,000<br />
35-44 338,000 328,000 150,000 83,000 123,000<br />
45-59 439,000 421,000 197,000 124,000 168,000<br />
60+ 428,000 426,000 178,000 141,000 152,000<br />
The <strong>Nielsen</strong> Company - <strong>2010</strong> <strong>Radio</strong> <strong>Survival</strong> <strong>Kit</strong>.
<strong>2010</strong> Population Potentials by Demographics<br />
SYDNEY<br />
Minimum Sample Size 2,400 2,400 2,000 1,750 1,850<br />
GROCERY BUYERS<br />
All 1,713,000 1,692,000 775,000 500,000 678,000<br />
Working 1,033,000 997,000 483,000 260,000 409,000<br />
Non-Working 680,000 695,000 292,000 240,000 269,000<br />
With Teens/Children 671,000 612,000 291,000 153,000 257,000<br />
With Children 0-9 428,000 374,000 186,000 96,000 153,000<br />
With Children 10-17 370,000 350,000 162,000 86,000 153,000<br />
Under 40 576,000 535,000 265,000 140,000 226,000<br />
40 Plus 1,137,000 1,157,000 510,000 360,000 452,000<br />
ALL PEOPLE 10+<br />
Area 1 1,013,000 984,000 329,000 235,000 650,000<br />
Area 2 690,000 1,121,000 325,000 265,000 237,000<br />
Area 3 572,000 993,000 409,000 289,000 162,000<br />
Area 4 705,000 742,000 204,000 277,000 437,000<br />
Area 5 1,003,000 - 498,000 - -<br />
NOTES ON POPULATION POTENTIALS<br />
MELBOURNE<br />
BRISBANE ADELAIDE PERTH<br />
Please refer to Survey Area Maps for each market's area definition.<br />
The “TOTAL POPULATION 10+” is our estimate based on the latest information available from the<br />
Australian Bureau of Statistics.<br />
The “MINIMUM SAMPLE SIZE” represents the minimum number of diaries that will be fed into the computer<br />
for the production of each report in <strong>2010</strong>.<br />
All other figures are “POTENTIALS”. These are our estimates of the number of people in that age group in<br />
the Survey Area.<br />
The “TOTAL POPULATION” and “POTENTIALS” are all estimates at June 30, <strong>2010</strong>. Thus, the figures<br />
shown will be slight over-estimates for the early part of the year and slight under-estimates for the latter part<br />
of the year.<br />
While the number of people in the various components will vary from survey to survey, appropriate raising<br />
factors are used to ensure that each element of the sample is given its correct weight according to the<br />
potential shown.<br />
The <strong>Nielsen</strong> Company - <strong>2010</strong> <strong>Radio</strong> <strong>Survival</strong> <strong>Kit</strong>.
<strong>2010</strong> Population Potentials by Demographics<br />
NEWCASTLE GOLD COAST<br />
/TWEED<br />
CANBERRA<br />
Minimum Sample Size 1,500 1,500 1,100<br />
PEOPLE 10+ 482,000 530,200 PEOPLE 10+ 345,900<br />
10-17 57,000 58,700 10-17 38,900<br />
18-24 55,000 58,800 18-24 45,000<br />
25-39 107,000 126,300 25-39 95,700<br />
40-54 110,000 122,100 40-54 82,300<br />
55+ 153,000 164,300 55+ 84,000<br />
13+ 461,000 509,100<br />
18+ 425,000 471,500<br />
16-24 70,000 74,200<br />
25-34 70,000 83,500<br />
35-44 72,000 83,600<br />
45-59 109,000 117,400<br />
60+ 119,000 128,200<br />
MEN 10+ 238,000 261,600 MEN 18+ 151,900<br />
10-17 30,000 30,300 18-39 71,700<br />
18-24 28,000 29,900 25-39 48,400<br />
25-39 54,000 63,600 25-54 89,000<br />
40-54 54,000 59,300 40+ 80,200<br />
55+ 72,000 78,500<br />
13+ 227,000 250,700<br />
18+ 208,000 231,300<br />
16-24 36,000 37,900<br />
25-34 35,000 42,400<br />
35-44 36,000 41,200<br />
45-59 54,000 56,800<br />
60+ 55,000 61,000<br />
WOMEN 10+ 244,000 268,600 WOMEN 18+ 155,100<br />
10-17 27,000 28,400 18-39 69,000<br />
18-24 27,000 28,900 25-39 47,300<br />
25-39 53,000 62,700 25-54 89,000<br />
40-54 56,000 62,800 40+ 86,100<br />
55+ 81,000 85,800<br />
13+ 234,000 258,400<br />
18+ 217,000 240,200<br />
16-24 34,000 36,300<br />
25-34 35,000 41,100<br />
35-44 36,000 42,400<br />
45-59 55,000 60,600<br />
60+ 64,000 67,200<br />
The <strong>Nielsen</strong> Company - <strong>2010</strong> <strong>Radio</strong> <strong>Survival</strong> <strong>Kit</strong>.
<strong>2010</strong> Population Potentials by Demographics<br />
Minimum Sample Size 1,500 1,500 1,100<br />
GROCERY BUYERS GROCERY BUYERS<br />
All 221,000 240,400 All 154,600<br />
Working 103,000 119,800 With Teens/Children 51,400<br />
Non-Working 118,000 120,600 Under 40 39,600<br />
With Teens/Children 70,000 75,000 40 Plus 115,000<br />
With Children 0-9 43,000 45,500<br />
With Children 10-17 41,000 42,600<br />
Under 40 54,000 60,000<br />
40 Plus 167,000 180,400<br />
ALL PEOPLE 10+<br />
Area 1 199,000 393,600<br />
Area 2 105,000 136,600<br />
Area 3 178,000 -<br />
NOTES ON POPULATION POTENTIALS<br />
NEWCASTLE GOLD COAST<br />
/TWEED<br />
CANBERRA<br />
Please refer to Survey Area Maps for each market's area definition.<br />
The “TOTAL POPULATION 10+” is our estimate based on the latest information available from the<br />
Australian Bureau of Statistics.<br />
The “MINIMUM SAMPLE SIZE” represents the minimum number of diaries that will be fed into the computer<br />
for the production of each report in <strong>2010</strong>.<br />
All other figures are “POTENTIALS”. These are our estimates of the number of people in that age group in<br />
the Survey Area.<br />
The “TOTAL POPULATION” and “POTENTIALS” are all estimates at June 30, <strong>2010</strong>. Thus, the figures<br />
shown will be slight over-estimates for the early part of the year and slight under-estimates for the latter part<br />
of the year.<br />
While the number of people in the various components will vary from survey to survey, appropriate raising<br />
factors are used to ensure that each element of the sample is given its correct weight according to the<br />
potential shown.<br />
The <strong>Nielsen</strong> Company - <strong>2010</strong> <strong>Radio</strong> <strong>Survival</strong> <strong>Kit</strong>.
Sydney <strong>Radio</strong> – Map of Survey Area<br />
REGION<br />
1 – North 4 – South West<br />
2 – Central & Inner West 5 – West<br />
3 – South
SYDNEY <strong>2010</strong> - POPULATION SPREAD BY SLA<br />
Statistical Local Area Population 0+ * %<br />
Sample<br />
Interviewing<br />
Areas<br />
Statistical Local Area Population 0+ * %<br />
Sample<br />
Interviewing<br />
Areas<br />
1 North 4 South-West<br />
Gosford (C) - East 67,995 1.5% 6 Bankstown (C) - North-East 61,280 1.4% 6<br />
Gosford (C) - West 95,962 2.2% 9 Bankstown (C) - North-West 66,382 1.5% 6<br />
Hornsby (A) - North 68,313 1.6% 6 Bankstown (C) - South 54,516 1.2% 5<br />
Hornsby (A) - South 90,898 2.1% 8 Camden (A) 53,394 1.2% 5<br />
Hunter's Hill (A) 14,092 0.3% 1 Campbelltown (C) - North 77,563 1.8% 7<br />
Ku-ring-gai (A) 108,135 2.5% 10 Campbelltown (C) - South 71,508 1.6% 7<br />
Lane Cove (A) 31,638 0.7% 3 Fairfield (C) - East 117,167 2.7% 11<br />
Manly (A) 39,667 0.9% 4 Fairfield (C) - West 73,490 1.7% 7<br />
Mosman (A) 28,356 0.6% 3 Liverpool (C) - East 104,037 2.4% 10<br />
North Sydney (A) 62,668 1.4% 6 Liverpool (C) - West 72,866 1.7% 7<br />
Pittwater (A) 57,018 1.3% 5 Wollondilly (A) 42,397 1.0% 4<br />
Ryde (C) 103,597 2.4% 10 794,600 18.1% 75<br />
Warringah (A) 141,686 3.2% 13<br />
Willoughby (C) 68,008 1.5% 6 5 West<br />
Wyong (A) - North-East 75,703 1.7% 7 Auburn (A) 73,495 1.7% 7<br />
Wyong (A) - South and West 70,886 1.6% 6 Baulkham Hills (A) - Central 72,958 1.7% 7<br />
1,124,622 25.6% 103 Baulkham Hills (A) - North 55,547 1.3% 5<br />
2 Central/Inner West Baulkham Hills (A) - South 42,460 1.0% 4<br />
Ashfield (A) 41,863 1.0% 4 Blacktown (C) - North 96,004 2.2% 9<br />
Burwood (A) 33,269 0.8% 3 Blacktown (C) - South-East 95,683 2.2% 9<br />
Canada Bay (A) - Concord 35,405 0.8% 3 Blacktown (C) - South-West 99,925 2.3% 9<br />
Canada Bay (A) - Drummoyne 36,857 0.8% 3 Blue Mountains (C) 76,719 1.7% 7<br />
Leichhardt (A) 53,217 1.2% 5 Hawkesbury (C) 62,828 1.4% 6<br />
Marrickville (A) 77,141 1.8% 7 Holroyd (C) 97,638 2.2% 9<br />
Randwick (C) 129,171 2.9% 12 Parramatta (C) - Inner 45,396 1.0% 4<br />
Strathfield (A) 35,124 0.8% 3 Parramatta (C) - North-East 45,382 1.0% 4<br />
Sydney (C) - East 50,564 1.1% 5 Parramatta (C) - North-West 35,521 0.8% 3<br />
Sydney (C) - Inner 23,965 0.5% 2 Parramatta (C) - South 35,613 0.8% 3<br />
Sydney (C) - South 55,417 1.3% 5 Penrith (C) - East 97,715 2.2% 9<br />
Sydney (C) - West 42,739 1.0% 4 Penrith (C) - West 83,051 1.9% 8<br />
Waverley (A) 66,852 1.5% 6 1,115,935 25.4% 103<br />
Woollahra (A) 53,866 1.2% 5<br />
735,450 16.7% 67<br />
3 South<br />
Botany Bay (C) 38,628 0.9% 4 TOTAL 4,399,722 100.0% 405<br />
Canterbury (C) 139,985 3.2% 13<br />
Hurstville (C) 78,036 1.8% 7<br />
Kogarah (A) 56,591 1.3% 5<br />
Rockdale (C) 100,007 2.3% 9<br />
Sutherland Shire (A) - East 102,663 2.3% 9<br />
Sutherland Shire (A) - West 113,205 2.6% 10<br />
629,115 14.3% 57<br />
* 2008 Estimated Resident Population
Melbourne <strong>Radio</strong> – Map of Survey Area<br />
REGION<br />
1 – North 3 – East<br />
2 – South 4 – West
MELBOURNE <strong>2010</strong> - POPULATION SPREAD BY SLA<br />
Sample<br />
Sample<br />
Statistical Local Area Population 0+* % Interviewing<br />
Statistical Local Area Population 0+* % Interviewing<br />
Areas<br />
Areas<br />
1 North 3 East<br />
Banyule (C) - Heidelberg 65,393 1.6% 6 Boroondara (C) - Camberwell N. 46,121 1.1% 4<br />
Banyule (C) - North 56,016 1.3% 5 Boroondara (C) - Camberwell S. 52,285 1.3% 5<br />
Brimbank (C) - Keilor 92,038 2.2% 9 Boroondara (C) - Hawthorn 36,062 0.9% 4<br />
Darebin (C) - Northcote 49,606 1.2% 5 Boroondara (C) - Kew 30,925 0.7% 3<br />
Darebin (C) - Preston 87,754 2.1% 8 Knox (C) - North-East 64,946 1.6% 6<br />
Hume (C) - Broadmeadows 65,474 1.6% 6 Knox (C) - North-West 46,666 1.1% 5<br />
Hume (C) - Craigieburn 61,888 1.5% 6 Knox (C) - South 42,376 1.0% 4<br />
Hume (C) - Sunbury 34,898 0.8% 3 Manningham (C) - East 15,914 0.4% 2<br />
Macedon Ranges (S) - Romsey 11,554 0.3% 1 Manningham (C) - West 101,069 2.4% 10<br />
Macedon Ranges (S) Bal 20,647 0.5% 2 Maroondah (C) - Croydon 60,750 1.5% 6<br />
Mitchell (S) - South 22,264 0.5% 2 Maroondah (C) - Ringwood 43,547 1.0% 4<br />
Moonee Valley (C) - Essendon 71,907 1.7% 7 Monash (C) - Waverley East 59,416 1.4% 6<br />
Moonee Valley (C) - West 42,716 1.0% 4 Monash (C) - Waverley West 66,565 1.6% 6<br />
Moreland (C) - Brunswick 44,586 1.1% 4 Stonnington (C) - Malvern 48,239 1.2% 5<br />
Moreland (C) - Coburg 51,193 1.2% 5 Stonnington (C) - Prahran 49,472 1.2% 5<br />
Moreland (C) - North 50,121 1.2% 5 Whitehorse (C) - Box Hill 54,282 1.3% 5<br />
Nillumbik (S) - South 28,605 0.7% 3 Whitehorse (C) - Nunawading E. 46,564 1.1% 5<br />
Nillumbik (S) - South-West 24,849 0.6% 2 Whitehorse (C) - Nunawading W. 52,561 1.3% 5<br />
Nillumbik (S) Bal 9,727 0.2% 1 Yarra (C) - Richmond 27,136 0.6% 3<br />
Whittlesea (C) - North 32,394 0.8% 3 Yarra Ranges (S) - Central 15,406 0.4% 2<br />
Whittlesea (C) - South-East 44,644 1.1% 4 Yarra Ranges (S) - Dandenongs 30,499 0.7% 3<br />
Whittlesea (C) - South-West 62,212 1.5% 6 Yarra Ranges (S) - Lilydale 71,257 1.7% 7<br />
Yarra (C) - North 49,266 1.2% 5 Yarra Ranges (S) - North 13,110 0.3% 1<br />
1,079,752 25.8%<br />
102 Yarra Ranges (S) - Seville 16,002 0.4% 2<br />
1,091,170 26.1%<br />
108<br />
2 South 4 West<br />
Bayside (C) - Brighton 38,218 0.9% 4 Bellarine - Inner 24,541 0.6% 2<br />
Bayside (C) - South 56,400 1.3% 5 Brimbank (C) - Sunshine 89,077 2.1% 9<br />
Cardinia (S) - North 25,088 0.6% 2 Corio - Inner 58,624 1.4% 6<br />
Cardinia (S) - Pakenham 33,627 0.8% 3 Geelong 11,967 0.3% 1<br />
Cardinia (S) - South 5,595 0.1% 1 Geelong West 14,435 0.3% 1<br />
Casey (C) - Berwick 96,701 2.3% 9 Greater Geelong (C) - Pt B 36,390 0.9% 4<br />
Casey (C) - Cranbourne 73,592 1.8% 7 Greater Geelong (C) - Pt C 3,151 0.1% 0<br />
Casey (C) - Hallam 52,483 1.3% 5 Hobsons Bay (C) - Altona 54,617 1.3% 5<br />
Casey (C) - South 15,560 0.4% 2 Hobsons Bay (C) - Williamstown 31,504 0.8% 3<br />
Frankston (C) - East 47,984 1.1% 5 Maribyrnong (C) 69,825 1.7% 7<br />
Frankston (C) - West 77,744 1.9% 8 Melbourne (C) - Inner 13,978 0.3% 1<br />
Glen Eira (C) - Caulfield 82,231 2.0% 8 Melbourne (C) - Remainder 53,427 1.3% 5<br />
Glen Eira (C) - South 51,576 1.2% 5 Melbourne (C) - Southbank-Docklands 16,640 0.4% 2<br />
Gr. Dandenong (C) - Dandenong 59,115 1.4% 6 Melton (S) - East 48,592 1.2% 5<br />
Gr. Dandenong (C) Bal 76,128 1.8% 7 Melton (S) Bal 43,873 1.0% 4<br />
Kingston (C) - North 95,144 2.3% 9 Moorabool (S) - Bacchus Marsh 17,191 0.4% 2<br />
Kingston (C) - South 48,583 1.2% 5 Newtown 10,306 0.2% 1<br />
Monash (C) - South-West 46,759 1.1% 5 Queenscliffe (B) 3,256 0.1% 0<br />
Mornington Peninsula (S) - East 39,165 0.9% 4 South Barwon - Inner (part) 49,781 1.2% 5<br />
Mornington Peninsula (S) - South 49,684 1.2% 5 Surf Coast (S) - East (part) 5,709 0.1% 1<br />
Mornington Peninsula (S) - West 56,507 1.4% 5 Wyndham (C) - North 85,757 2.1% 8<br />
Port Phillip (C) - St Kilda 54,347 1.3% 5 Wyndham (C) - South 22,261 0.5% 2<br />
Port Phillip (C) - West 39,405 0.9% 4 Wyndham (C) - West 24,775 0.6% 2<br />
1,221,636 29.2% 119 789,677<br />
18.9%<br />
76<br />
TOTAL<br />
4,182,235 100% 405<br />
* 2008 Estimated Resident Population
Brisbane <strong>Radio</strong> – Map of Survey Area<br />
REGION<br />
1 – East 4 – City & City North<br />
2 – West 5 – North<br />
3 – South
BRISBANE <strong>2010</strong> - POPULATION SPREAD BY SLA<br />
Statistical Local Area Population 0+ * % of Survey Area<br />
Sample<br />
Interviewing<br />
Areas<br />
Statistical Local Area<br />
Population 0+ * % of Survey Area<br />
1a Southern Inner Suburbs 1c Eastern Inner Suburbs<br />
Annerley Balmoral<br />
Fairfield Bulimba<br />
Greenslopes Cannon Hill<br />
Holland Park Carina<br />
Holland Park West Carina Heights<br />
Moorooka Carindale<br />
Tarragindi Coorparoo<br />
Yeerongpilly East Brisbane<br />
Yeronga TOTAL 63,237 3.3% 10 Hawthorne<br />
1b Eastern Outer Suburbs Morningside<br />
Alexandra Hills Norman Park TOTAL 88,060 4.5% 15<br />
Belmont-Mackenzie<br />
Birkdale<br />
TOTAL AREA ONE 359,921 18.5% 61<br />
Burbank 2a Western Outer Suburbs<br />
Capalaba Anstead<br />
Chandler-Capalaba West Bellbowrie<br />
Cleveland Boonah (S) (part)<br />
Gumdale-Ransome Brookfield (incl. Bris Forest Park) (part)<br />
Hemmant-Lytton Chapel Hill<br />
Lota Darra-Sumner<br />
Manly Doolandella-Forest Lake<br />
Manly West Durack<br />
Moreton Island Ellen Grove<br />
Murarrie Esk (S) (part)<br />
Ormiston Fig Tree Pocket<br />
Redland (S) Bal Inala<br />
Redland Bay Indooroopilly<br />
Sheldon-Mt Cotton Ipswich (C) - Central<br />
Thorneside Ipswich (C) - East<br />
Thornlands Ipswich (C) - North<br />
Tingalpa Ipswich (C) - South-West (part)<br />
Victoria Point Jamboree Heights<br />
Wakerley Jindalee<br />
Wellington Point Karana Downs-Lake Manchester<br />
Wynnum Kenmore<br />
Wynnum West TOTAL 208,624 10.7% 36<br />
Kenmore Hills<br />
Middle Park<br />
Moggill<br />
Mount Ommaney<br />
Oxley<br />
Pinjarra Hills<br />
Pullenvale<br />
Page 1 of 3<br />
Sample<br />
Interviewing<br />
Areas<br />
* 2008 Estimated Resident Population
BRISBANE <strong>2010</strong> - POPULATION SPREAD BY SLA<br />
Statistical Local Area Population 0+ * % of Survey Area<br />
Sample<br />
Interviewing<br />
Areas<br />
Statistical Local Area<br />
Population 0+ * % of Survey Area<br />
2a Western Outer Suburbs (cont'd) 3. Southern Outer Suburbs (cont'd)<br />
Richlands Marsden<br />
Riverhills Mount Gravatt<br />
Seventeen Mile Rocks Mount Gravatt East<br />
Wacol Mt Warren Park<br />
Westlake TOTAL 304,547 15.7% 51 Nathan<br />
Pallara-Heathwood-Larapinta<br />
Western Outer Suburbs Parkinson-Drewvale<br />
2b Chelmer Robertson<br />
Corinda Rochedale<br />
Graceville Rochedale South<br />
Sherwood Rocklea<br />
St Lucia Runcorn<br />
Taringa Salisbury<br />
Toowong TOTAL 52,666 2.7% 9 Shailer Park<br />
TOTAL AREA TWO 357,213 18.4% 60 Slacks Creek<br />
Springwood<br />
Southern Outer Suburbs Stretton-Karawatha<br />
3 Acacia Ridge Sunnybank<br />
Algester Sunnybank Hills<br />
Archerfield Tanah Merah<br />
Beaudesert (S) - Pt A (part) Underwood<br />
Beaudesert (S) - Pt C (part) Upper Mount Gravatt<br />
Beenleigh Waterford West<br />
Bethania-Waterford Willawong<br />
Browns Plains Wishart<br />
Calamvale Wolffdene-Bahrs Scrub<br />
Camp Hill Woodridge<br />
Carbrook-Cornubia TOTAL AREA THREE 460,630 23.7% 77<br />
Coopers Plains<br />
Daisy Hill-Priestdale 4a Northern Inner Suburbs<br />
Eagleby Albion<br />
Edens Landing-Holmview Alderley<br />
Eight Mile Plains Ascot<br />
Greenbank-Boronia Heights Ashgrove<br />
Kingston Bardon<br />
Kuraby Clayfield<br />
Logan (C) Bal Enoggera<br />
Loganholme Ferny Grove<br />
Loganlea Grange<br />
MacGregor Hamilton<br />
Mansfield Hendra<br />
Keperra<br />
Page 2 of 3<br />
Sample<br />
Interviewing<br />
Areas<br />
* 2008 Estimated Resident Population
BRISBANE <strong>2010</strong> - POPULATION SPREAD BY SLA<br />
Statistical Local Area Population 0+ * % of Survey Area<br />
Sample<br />
Interviewing<br />
Areas<br />
Statistical Local Area<br />
Population 0+ * % of Survey Area<br />
4a Northern Inner Suburbs (cont'd) 5 Northern Outer Suburbs (cont'd)<br />
Lutwyche Bridgeman Downs 1<br />
Mitchelton Brighton 2<br />
Newmarket Burpengary-Narangba 4<br />
Pinkenba-Eagle Farm Caboolture (S) - Central 4<br />
The Gap Caboolture (S) - East 3<br />
Upper Kedron Caboolture (S) - Hinterland 1<br />
Wilston Caboolture (S) - Midwest 3<br />
Windsor Carseldine 1<br />
Wooloowin TOTAL 129,704 6.7% 23 Central Pine West 4<br />
Chermside 1<br />
4b City Core Suburbs Chermside West 1<br />
Bowen Hills Clontarf 1<br />
Brookfield (incl. Bris Forest Park) (part) Dakabin-Kallangur-M.Downs 5<br />
City - Inner Deagon 1<br />
City - Remainder Deception Bay 4<br />
Dutton Park Everton Park 1<br />
Fortitude Valley Geebung 1<br />
Herston Griffin-Mango Hill 2<br />
Highgate Hill Hills District 4<br />
Kangaroo Point Kedron 2<br />
Kelvin Grove Lawnton 1<br />
Milton Margate-Woody Point 2<br />
New Farm McDowall 1<br />
Newstead Morayfield 4<br />
Paddington Northgate 1<br />
Red Hill Nudgee 0<br />
South Brisbane Nundah 2<br />
Spring Hill Petrie 2<br />
West End Pine Rivers (S) Bal 3<br />
Woolloongabba TOTAL 92,995 4.8% 15 Redcliffe-Scarborough 3<br />
TOTAL AREA FOUR 222,699 11.5% 38 Rothwell-Kippa-Ring 3<br />
Sandgate 1<br />
Stafford 1<br />
5 Northern Outer Suburbs Stafford Heights 1<br />
Albany Creek 3 Strathpine-Brendale 2<br />
Aspley 2 Taigum-Fitzgibbon 1<br />
Bald Hills 1 Virginia 0<br />
Banyo 1 Wavell Heights 2<br />
Boondall 2 Zillmere 1<br />
Bracken Ridge 3 TOTAL AREA FIVE 542,263 27.91% 94<br />
Bray Park 2<br />
Bribie Island 3<br />
TOTAL 1,942,726 100% 330<br />
Page 3 of 3<br />
Sample<br />
Interviewing<br />
Areas<br />
* 2008 Estimated Resident Population
Adelaide <strong>Radio</strong> – Map of Survey Area<br />
REGION<br />
1 – Central 3 – East & South<br />
2 – North 4 – West & South West
ADELAIDE <strong>2010</strong> - POPULATION SPREAD BY SLA<br />
Statistical Local Area Population 0+ * %<br />
Sample<br />
Interviewing<br />
Areas<br />
Statistical Local Area Population 0+ * %<br />
Sample<br />
Interviewing<br />
Areas<br />
1 Central 3 East and South<br />
Adelaide (C) 18,990 1.6% 5 Adelaide Hills (DC) - Central 13,002 1.1% 3<br />
Charles Sturt (C) - Coastal (part) 16,462 1.4% 4 Adelaide Hills (DC) - Ranges 10,513 0.9% 3<br />
Charles Sturt (C) - Inner East 22,573 1.9% 6 Burnside (C) - North-East 22,086 1.9% 6<br />
Charles Sturt (C) - Inner West 24,934 2.1% 6 Burnside (C) - South-West 21,924 1.9% 6<br />
Charles Sturt (C) - North-East 26,741 2.3% 7 Campbelltown (C) - East 28,361 2.4% 7<br />
Norw. P'ham St Ptrs (C) - East 16,829 1.4% 4 Campbelltown (C) - West 20,232 1.7% 5<br />
Norw. P'ham St Ptrs (C) - West 19,064 1.6% 5 Mitcham (C) - Hills 25,240 2.2% 6<br />
Port Adel. Enfield (C) - Coast 28,720 2.5% 7 Mitcham (C) - North-East 16,151 1.4% 4<br />
Port Adel. Enfield (C) - Port 10,766 0.9% 3 Mitcham (C) - West 23,500 2.0% 6<br />
Prospect (C) 20,710 1.8% 5 Onkaparinga (C) - Hills (part) 2,909 0.2% 1<br />
Unley (C) - East 20,282 1.7% 5 Onkaparinga (C) - Reservoir 25,876 2.2% 7<br />
Unley (C) - West 17,864 1.5% 5 Onkaparinga (C) - Woodcroft (part) 11,961 1.0% 3<br />
Walkerville (M) 7,258 0.6% 2 Tea Tree Gully (C) - Central 26,335 2.2% 7<br />
251,193 21.4% 64 Tea Tree Gully (C) - Hills 12,368 1.1% 3<br />
Tea Tree Gully (C) - North 27,963 2.4% 7<br />
Tea Tree Gully (C) - South 33,220 2.8% 8<br />
2 Northern 321,641 27.5% 82<br />
Gawler (T) 20,257 1.7% 5<br />
Playford (C) - East Central 21,638 1.8% 5 4 West and South West<br />
Playford (C) - Elizabeth 25,567 2.2% 6 Alexandrina (DC)-Strathalbyn (part) 776 0.1% 0<br />
Playford (C) - Hills 3,562 0.3% 1 Charles Sturt (C) - Coastal (part) 14,863 1.3% 4<br />
Playford (C) - West 10,503 0.9% 3 Holdfast Bay (C) - North 20,454 1.7% 5<br />
Playford (C) - West Central 14,053 1.2% 4 Holdfast Bay (C) - South 15,071 1.3% 4<br />
Port Adel. Enfield (C) - East 33,754 2.9% 9 Marion (C) - Central 34,619 3.0% 9<br />
Port Adel. Enfield (C) - Inner 20,662 1.8% 5 Marion (C) - North 26,051 2.2% 7<br />
Port Adel. Enfield (C) - Park 16,020 1.4% 4 Marion (C) - South 22,301 1.9% 6<br />
Salisbury (C) - Central 28,169 2.4% 7 Onkaparinga (C) - Hackham 14,560 1.2% 4<br />
Salisbury (C) - Inner North 25,626 2.2% 7 Onkaparinga (C) - Hills (part) 8,430 0.7% 2<br />
Salisbury (C) - North-East 22,705 1.9% 6 Onkaparinga (C) - Morphett 23,724 2.0% 6<br />
Salisbury (C) - South-East 37,090 3.2% 9 Onkaparinga (C) - North Coast 18,248 1.6% 5<br />
Salisbury (C) Bal 13,924 1.2% 4 Onkaparinga (C) - South Coast 28,212 2.4% 7<br />
293,530 25.1% 75 Onkaparinga (C) - Woodcroft (part) 22,406 1.9% 6<br />
Unincorp. Western 3 0.0% 0<br />
West Torrens (C) - East 25,435 2.2% 6<br />
West Torrens (C) - West 29,629 2.5% 8<br />
304,782 26.0% 79<br />
TOTAL 1,171,146 100% 300<br />
* 2008 Estimated Resident Population
Perth <strong>Radio</strong> – Map of Survey Area<br />
REGION<br />
1 – North & North East 3 – West<br />
2 – South & South East 4 – South West
PERTH <strong>2010</strong> - POPULATION SPREAD BY SLA<br />
Statistical Local Area Population 0+* %<br />
Sample<br />
Interviewing<br />
Areas<br />
Statistical Local Area Population 0+* %<br />
Sample<br />
Interviewing<br />
Areas<br />
1 North and North East 3 Western<br />
Bassendean (T) 14,233 0.9% 3 Cambridge (T) (part) 25,780 1.6% 5<br />
Bayswater (C) 60,089 3.7% 12 Claremont (T) 9,605 0.6% 2<br />
Cambridge (T) (part) 144 0.0% 0 Cottesloe (T) 7,929 0.5% 2<br />
Joondalup (C) - North 53,596 3.3% 10 Mosman Park (T) 9,096 0.6% 2<br />
Joondalup (C) - South 106,390 6.6% 21 Nedlands (C) 22,012 1.4% 4<br />
Mundaring (S) 37,361 2.3% 7 Peppermint Grove (S) 1,688 0.1% 0<br />
Stirling (C) - Central 109,132 6.8% 21 Perth (C) - Inner 1,477 0.1% 0<br />
Stirling (C) - Coastal 67,951 4.2% 13 Perth (C) - Remainder 13,958 0.9% 3<br />
Stirling (C) - South-Eastern 16,972 1.1% 3 Subiaco (C) 18,115 1.1% 4<br />
Swan (C) 105,432 6.6% 20 Victoria Park (T) 31,148 1.9% 6<br />
Wanneroo (C) - North-East 39,853 2.5% 8 Vincent (T) 29,376 1.8% 6<br />
Wanneroo (C) - North-West 47,087 2.9% 9 170,184 10.6% 34<br />
Wanneroo (C) - South 47,318 3.0% 9<br />
705,558 44.0% 136<br />
4 South West<br />
2 South and South East Canning (C) 84,974 5.3% 16<br />
Armadale (C) 55,432 3.5% 11 Cockburn (C) 84,652 5.3% 16<br />
Belmont (C) 33,416 2.1% 7 East Fremantle (T) 7,251 0.5% 1<br />
Gosnells (C) 100,594 6.3% 20 Fremantle (C) - Inner 913 0.1% 0<br />
Kalamunda (S) 53,363 3.3% 10 Fremantle (C) - Remainder 26,540 1.7% 5<br />
Serpentine-Jarrahdale (S) 15,281 1.0% 3 Kwinana (T) 26,387 1.6% 5<br />
258,086 16.1% 51 Melville (C) 99,351 6.2% 19<br />
Rockingham (C) 96,068 6.0% 19<br />
South Perth (C) 42,595 2.7% 8<br />
468,731 29.2% 89<br />
TOTAL 1,602,559 100% 310<br />
* 2008 Estimated Resident Population
Newcastle <strong>Radio</strong> – Map of Survey Area<br />
REGION<br />
1 – Central and North<br />
2 – West<br />
3 – South
NEWCASTLE <strong>2010</strong> - POPULATION SPREAD BY SLA<br />
Region<br />
Statistical Local Area Population 0+ *<br />
% of Survey Area<br />
Sample<br />
Interviewing<br />
Areas<br />
1 Central and North<br />
Newcastle (C) - Inner City 52,417 9.9% 15<br />
Newcastle (C) - Outer West 45,451 8.6% 13<br />
Newcastle (C) - Throsby 54,791 10.3% 16<br />
Port Stephens (A) 65,464 12.3% 19<br />
218,123<br />
41.1% 63<br />
2 West<br />
Cessnock (C) (part) 48,868 9.2% 14<br />
Maitland (C) 67,621 12.8% 19<br />
116,489 22.0% 33<br />
3 South<br />
Lake Macquarie (C) - East 63,486 12.0% 18<br />
Lake Macquarie (C) - North 77,398 14.6% 22<br />
Lake Macquarie (C) - West 54,675 10.3% 16<br />
195,559 36.9% 56<br />
TOTAL 530,171 100%<br />
152<br />
* 2008 Estimated Resident Population
Gold Coast/Tweed <strong>Radio</strong><br />
Map of Survey Area
GOLD COAST/TWEED <strong>2010</strong><br />
POPULATION SPREAD BY SLA<br />
Total Persons * Total Persons *<br />
Statistical Local Area Population 0+ % of Survey Area Statistical Local Area<br />
Population 0+ % of Survey Area<br />
Ashmore-Benowa 20,783 3.7% Mermaid Waters-Clear Island Waters 17,250 3.0%<br />
Biggera Waters-Labrador 22,706 4.0% Miami 6,942 1.2%<br />
Bilinga-Tugun 6,833 1.2% Molendinar 6,651 1.2%<br />
Broadbeach-Mermaid Beach 10,887 1.9% Mudgeeraba-Reedy Creek 23,822 4.2%<br />
Broadbeach Waters 8,220 1.4% Nerang 26,779 4.7%<br />
Bundall 4,513 0.8% Oxenford-Maudsland 13,908 2.5%<br />
Burleigh Heads 8,497 1.5% Pacific Pines-Gaven 13,746 2.4%<br />
Burleigh Waters 13,872 2.4% Palm Beach 14,953 2.6%<br />
Carrara-Merrimac 18,112 3.2% Paradise Point-Runaway Bay 18,016 3.2%<br />
Coolangatta 5,477 1.0% Parkwood-Arundel 19,474 3.4%<br />
Coombabah 10,229 1.8% Pimpama-Coomera 7,775 1.4%<br />
Currumbin 2,987 0.5% Robina 21,855 3.9%<br />
Currumbin Valley-Tallebudgera 7,002 1.2% Southport 27,442 4.8%<br />
Currumbin Waters 10,376 1.8% Surfers Paradise 20,678 3.6%<br />
Elanora 12,454 2.2% Tweed (A) - Tweed Coast 10,148 1.8%<br />
Guanaba-Springbrook 4,423 0.8% Tweed (A) - Tweed-Heads 55,315 9.8%<br />
Helensvale 0.0% Tweed (A) - Pt B 21,370 3.8%<br />
Helensvale 16,678 2.9% Varsity Lakes 14,551 2.6%<br />
Hope Island 7,499 1.3% Worongary-Tallai 10,308 1.8%<br />
Kingsholme-Upper Coomera 21,042 3.7%<br />
Main Beach-South Stradbroke 3,520 0.6%<br />
TOTAL 567,093 100%<br />
* 2008 Estimated Resident Population
Canberra <strong>Radio</strong> – Map of Survey Area
<strong>2010</strong> CANBERRA - POPULATION SPREAD BY SLA<br />
Statistical Local Area Population % of Statistical Local Area Population % of Statistical Local Area Population % of<br />
0+ Survey Area 0+ Survey Area 0+ Survey Area<br />
Queanbeyan (C) (part) 37,502 9.8% Garran 3,310 0.9% Monash 5,564 1.5%<br />
Acton 1,944 0.5% Gilmore 2,948 0.8% Narrabundah 5,795 1.5%<br />
Ainslie 5,147 1.3% Giralang 3,416 0.9% Ngunnawal 9,628 2.5%<br />
Amaroo 6,366 1.7% Gordon 8,096 2.1% Nicholls 7,367 1.9%<br />
Aranda 2,533 0.7% Gowrie 3,268 0.9% Oaks Estate 253 0.1%<br />
Banks 5,293 1.4% Greenway 1,285 0.3% O'Connor 5,354 1.4%<br />
Barton 1,132 0.3% Griffith 4,311 1.1% O'Malley 845 0.2%<br />
Belconnen - SSD Bal 42 0.0% Gungahlin 5,948 1.6% Oxley 1,901 0.5%<br />
Belconnen Town Centre 3,331 0.9% Gungahlin-Hall - SSD Bal 248 0.1% Page 2,802 0.7%<br />
Bonython 3,493 0.9% Hackett 2,982 0.8% Palmerston 5,953 1.6%<br />
Braddon 4,071 1.1% Hall 362 0.1% Parkes 6 0.0%<br />
Bruce 4,733 1.2% Harman 95 0.0% Pearce 2,617 0.7%<br />
Calwell 6,013 1.6% Harrison 2,092 0.5% Phillip 2,049 0.5%<br />
Campbell 3,308 0.9% Hawker 2,948 0.8% Pialligo 132 0.0%<br />
Chapman 2,755 0.7% Higgins 3,162 0.8% Red Hill 3,349 0.9%<br />
Charnwood 3,162 0.8% Holder 2,705 0.7% Reid 1,642 0.4%<br />
Chifley 2,399 0.6% Holt 4,921 1.3% Richardson 3,311 0.9%<br />
Chisholm 5,488 1.4% Hughes 2,989 0.8% Rivett 3,188 0.8%<br />
City 1,014 0.3% Hume 4 0.0% Russell 0 0.0%<br />
Conder 5,418 1.4% Isaacs 2,510 0.7% Scullin 2,875 0.8%<br />
Cook 2,986 0.8% Isabella Plains 4,388 1.1% Spence 2,719 0.7%<br />
Curtin 5,341 1.4% Jerrabomberra 13 0.0% Stirling 2,098 0.5%<br />
Deakin 2,694 0.7% Kaleen 7,797 2.0% Stromlo 74 0.0%<br />
Dickson 2,134 0.6% Kambah 15,893 4.2% Symonston 520 0.1%<br />
Downer 3,505 0.9% Kingston 2,852 0.7% Theodore 4,129 1.1%<br />
Duffy 3,163 0.8% Kowen 48 0.0% Torrens 2,310 0.6%<br />
Dunlop 6,615 1.7% Latham 3,839 1.0% Tuggeranong - SSD Bal 65 0.0%<br />
Duntroon 1,775 0.5% Lyneham 4,809 1.3% Turner 3,455 0.9%<br />
Evatt 5,588 1.5% Lyons 2,527 0.7% Wanniassa 8,096 2.1%<br />
Fadden 3,273 0.9% Macarthur 1,558 0.4% Waramanga 2,585 0.7%<br />
Farrer 3,489 0.9% Macgregor 3,613 0.9% Watson 4,679 1.2%<br />
Fisher 3,159 0.8% Macquarie 2,540 0.7% Weetangera 2,662 0.7%<br />
Florey 5,305 1.4% Majura 124 0.0% Weston 3,257 0.9%<br />
Flynn 3,637 1.0% Mawson 3,040 0.8% Weston Creek-Stromlo - SSD Bal 21 0.0%<br />
Forrest 1,385 0.4% McKellar 2,930 0.8% Yarralumla 3,014 0.8%<br />
Fraser 2,226 0.6% Melba 3,387 0.9%<br />
Fyshwick 62 0.0% Mitchell 5 0.0%<br />
TOTAL 382,759 100%<br />
*2008 Estimated Resident Population
SYDNEY OFFICE<br />
<strong>Radio</strong> Clients – NSW & QLD<br />
Ann-Maree Nolan<br />
Client Service Manager<br />
(02) 8873 7713<br />
ann-maree.nolan@nielsen.com<br />
Debbie Hishon<br />
Client Service Director<br />
(02) 8873 7711<br />
debbie.hishon@nielsen.com<br />
Agency Clients – NSW & QLD<br />
Lara Qualtrough<br />
Client Service Manager<br />
(02) 8873 7629<br />
lara.qualtrough@nielsen.com<br />
Marjorie Medrano<br />
Client Service Manager<br />
(02) 8873 7627<br />
marjorie.medrano@nielsen.com<br />
Tanja Vrankic<br />
Senior Client Service Manager<br />
(02) 8873 7219<br />
tanja.vrankic@nielsen.com<br />
Scott Gillham<br />
Client Service Director<br />
(02) 8873 7622<br />
scott.gillham@nielsen.com<br />
<strong>2010</strong> Media Client Service<br />
The <strong>Nielsen</strong> Company – <strong>2010</strong> <strong>Radio</strong> <strong>Survival</strong> <strong>Kit</strong>.<br />
MELBOURNE OFFICE<br />
All Clients - VIC, SA & Tas<br />
David Burge<br />
Client Service Director<br />
(03) 9207 3980<br />
david.burge@nielsen.com<br />
PERTH OFFICE<br />
All Clients<br />
Richard Webster<br />
Account Manager<br />
0419 904 197<br />
rwebster@ausplastics.com<br />
TECHNICAL SUPPORT<br />
(<strong>Nielsen</strong> software)<br />
All Clients<br />
Free Call: 1800 244 411<br />
Angelo Calma<br />
Media Technical Support Executive<br />
(02) 8873 7723 or 0414 966 866<br />
angelo.calma@nielsen.com<br />
Software Hotline 1800 244 411
The <strong>Nielsen</strong> Company has compiled an essential addition to our existing <strong>Radio</strong> <strong>Ratings</strong> product suite – the On-line<br />
<strong>Radio</strong> Companion.<br />
Programmers, Sales Executives, Media Planners/Buyers, Researchers – in fact anyone who uses radio or works in<br />
the <strong>Radio</strong> Industry, will find information contained on the On-line <strong>Radio</strong> Companion invaluable. At your fingertips are<br />
all those important bits and pieces that you can never find when you need them!<br />
ON-LINE RADIO COMPANION FEATURES<br />
The <strong>Nielsen</strong> Company – <strong>2010</strong> <strong>Radio</strong> <strong>Survival</strong> <strong>Kit</strong>.<br />
<strong>2010</strong> On-Line<br />
<strong>Radio</strong> Companion<br />
Navigation<br />
To Navigation around the site use the Sidebar (pictured). All you need to do is click on<br />
the appropriate heading and you will be taken to the page you are after.<br />
<strong>Radio</strong> <strong>Ratings</strong> - all the latest and historic info!<br />
Metropolitan survey results for more than 50 years are provided up to and including<br />
2009. More recent information such as the <strong>2010</strong> <strong>Survival</strong> <strong>Kit</strong>, <strong>Radio</strong> Training, Survey<br />
Schedule and the latest information on Digital <strong>Radio</strong> in Australia are all included.<br />
The On-line <strong>Radio</strong> Companion, which is<br />
updated every Survey, is FREE to all current<br />
subscribers of The <strong>Nielsen</strong> Company’s <strong>Radio</strong><br />
<strong>Ratings</strong> and is available on-line at<br />
www.nielsen.com. Go to Service, then By<br />
Product, then in the body of the main page<br />
<strong>Radio</strong> Audience Measurement. You will see<br />
<strong>Radio</strong> Companion at the right of screen.<br />
For your login details contact The <strong>Nielsen</strong><br />
Company to access this valuable resource<br />
today!<br />
Survey Area Coverage Maps<br />
Maps detailing radio survey coverage areas are provided for all metropolitan and major regional markets.<br />
<strong>Radio</strong> Advisor Tools – providing insights to clients<br />
Over the years, The <strong>Nielsen</strong> Company has developed many tools for use in conjunction with <strong>Radio</strong> Advisor. These<br />
tools provide clients with quick and simple insights into the data. For example, programmers can easily determine<br />
the effect that a change in time spent listening, reach or market averages will have on overall share positioning,<br />
while on the sales front, you will be able to determine optimum schedule placement in minutes – there’s something<br />
for everyone!<br />
Your On-Line <strong>Radio</strong> Companion client service and support contacts at The <strong>Nielsen</strong> Company are:<br />
<strong>Radio</strong>: Technical: (Free Call 1800 244 411)<br />
Ann-Maree Nolan 02 8873 7713 0410 420 632 Angelo Calma 02 8873 7723 0414 966 866<br />
David Burge 03 9207 3980 0410 420 628<br />
Richard Webster 0419 904 197 Agency:<br />
Lara Qualtrough 02 8873 7629<br />
Tanja Vrankic 02 8873 7219
<strong>Radio</strong> <strong>Ratings</strong> Data<br />
Commercial <strong>Radio</strong> Summary Reports of The<br />
<strong>Nielsen</strong> Company <strong>Radio</strong> Surveys are available<br />
on our website for each of the five metropolitan<br />
markets.<br />
This information is available free to the general<br />
public.<br />
To access this information:<br />
1. Go to our website, www.nielsen.com<br />
2. From the menu at the top of the screen,<br />
select Service, then By Product, then in<br />
the body of the main page <strong>Radio</strong><br />
Audience Measurement, then at the right<br />
of screen under Products & Solutions,<br />
<strong>Radio</strong> <strong>Ratings</strong> Metro Markets.<br />
There is also a link to the <strong>Radio</strong> Gateway data<br />
download site (subscribers only).<br />
The <strong>Nielsen</strong> Company Website<br />
www.nielsen.com<br />
<strong>Radio</strong> Advisor V.3<br />
<strong>Radio</strong> Advisor V.3 was launched in 2008. The new<br />
software has two user modes 1) Cruise 2) Power.<br />
Cruise Mode has been designed for the casual<br />
user. It allows the user to simply choose the<br />
options from “drop down” boxes to select their<br />
data. Cruise mode is idea for basic jobs in Session<br />
Ranking, Reach & Frequency, Program Ranking,<br />
Station Loyalty & Ebb & Flow.<br />
Power Mode is for the experienced user allowing<br />
more flexibility with the software. Users have the<br />
ability to create custom demographic and sessions.<br />
Plus many more new features i.e. Show<br />
Explanation, dropping Charts into PowerPoint etc.<br />
For more information:<br />
1. Go to our website, www.nielsen.com<br />
2. From the menu at the top of the screen, select<br />
Service, then By Product, then in the body of<br />
the main page <strong>Radio</strong> Audience<br />
Measurement, then at the right of screen<br />
under Products & Solutions, <strong>Radio</strong> Advisor.<br />
____________________________________<br />
The <strong>Nielsen</strong> Company Product Information<br />
Information on all The <strong>Nielsen</strong> Company products is available on our website. Simply select the product you are<br />
interested in from the menu at the top of the screen via Service, then By Product.<br />
If you need any further information, please contact your local <strong>Nielsen</strong> representative.
<strong>Radio</strong> Information on the Commercial <strong>Radio</strong> Australia Website<br />
commercialradio.com.au<br />
Members have immediate access to an abundance of vital up to date commercial radio marketing and<br />
audience research information through free membership of the Commercial <strong>Radio</strong> Australia website.<br />
• Latest research from Australia and<br />
around the world<br />
• Latest Commercial <strong>Radio</strong> Market<br />
Profiles, as well as marketing support<br />
material and brochures<br />
• Metropolitan and regional radio<br />
audience survey results, <strong>2010</strong> survey<br />
schedule<br />
• Over 30 years of award winning local<br />
and international radio commercials,<br />
audio out takes and demos<br />
• Coverage of important issues such as<br />
Digital <strong>Radio</strong> and other industry related<br />
news<br />
• Advice on advertising issues and radio<br />
planning<br />
• Useful links to relevant industry<br />
websites<br />
• Current and archived media releases<br />
Join for free NOW @ commercialradio.com.au and follow the prompts.
<strong>2010</strong> <strong>Radio</strong> Training Courses<br />
These training sessions are free to current subscribers of The <strong>Nielsen</strong> Company’s <strong>Radio</strong> <strong>Ratings</strong> Data.<br />
For dates and times of training, please refer to the separate <strong>2010</strong> Training Schedule.<br />
Theory and Software courses available this year are:<br />
<strong>Nielsen</strong> <strong>Radio</strong> <strong>Ratings</strong> Certificate Course<br />
A two part course covering all aspects of <strong>Radio</strong> surveys from the methodology used through to the type of data available<br />
and how to read and use it. To ‘pass’ each module, students will be required to undertake a small quiz. A certificate is<br />
awarded after successful completion of each module. Please note this course does not include software training; please<br />
refer to the following page for software courses.<br />
----------------------------------<br />
Module 1 - Understanding How <strong>Radio</strong> Surveys Are Conducted<br />
Information covered: In this course we discuss <strong>Nielsen</strong>’s <strong>Radio</strong> Audience Measurement. We outline how surveys are<br />
conducted; from the selection of the sample, the areas we use and how to fill out the <strong>Radio</strong> Diary. We explain the<br />
accuracy of the survey data right through to the delivery of the data.<br />
We demonstrate how to read and use the data. We define the 4 basic <strong>Radio</strong> statistics and Reach & Frequency. We<br />
interpret a <strong>Radio</strong> schedule and how it can be used to demonstrate a stations’ ability to reach a client’s specific target<br />
audience. We explain how Reach & Frequency can be used to monitor Music or promo rotation.<br />
By the end of the session you will understand how the <strong>Radio</strong> surveys are conducted. What the 4 basic statistics and<br />
R&F are. How Share, Cumes and Average Audience differ and what other statistics you need to know when you first<br />
start in <strong>Radio</strong>.<br />
Who for? Sales & Marketing; Programmers; Media Buyers/Planners; Researchers etc, either as a refresher for current<br />
staff or as the perfect introduction for new staff.<br />
Pre- Requisite: None Length: 2 Hours<br />
----------------------------------<br />
Module 2 - Understanding the Survey Numbers<br />
Information covered: In the course we re-cap the 4 basic statistics and look at how they are calculated. We define<br />
the relationship between Averages, Cumes, & TSL. We demonstrate what can affect a Station’s Share, and why your<br />
station’s Cume and TSL are important. How to interpret the data and analyse your station through trending survey<br />
results.<br />
We introduce other statistics such as Exclusive Audience, Turnover, Profile etc. The “Do’s and Don’ts” of survey<br />
numbers, what you can and can’t do with the data.<br />
We interpret Ebb & Flow data and see whether or not your listeners are staying with you or going to another <strong>Radio</strong><br />
station. We also interpret Station Loyalty and find out how loyal your Station’s listeners are.<br />
By the end of the session you will have a thorough understanding of the Survey Numbers. How the numbers work<br />
together, what influences your Share figures and how to analyse your Station’s survey results.<br />
Who for? Sales and Marketing; Programmers; Researchers and anyone interested in gaining extensive knowledge of<br />
survey numbers.<br />
Pre- Requisite: Module 1 “Understanding How <strong>Radio</strong> Surveys are Conducted” Length: 2 Hours<br />
The <strong>Nielsen</strong> Company – <strong>2010</strong> <strong>Radio</strong> <strong>Survival</strong> <strong>Kit</strong>.<br />
----------------------------------<br />
For more information on these products, please contact your <strong>Nielsen</strong> representative or refer to the<br />
Media Client Service Contact sheet included within in the <strong>Survival</strong> <strong>Kit</strong>.
<strong>Radio</strong> Advisor – Basic RA3<br />
<strong>2010</strong> <strong>Radio</strong> Training Courses<br />
The <strong>Nielsen</strong> Company – <strong>2010</strong> <strong>Radio</strong> <strong>Survival</strong> <strong>Kit</strong>.<br />
<strong>Nielsen</strong> Software Courses<br />
Information covered: An introductory course to <strong>Radio</strong> Advisor – <strong>Nielsen</strong>’s <strong>Radio</strong> data software tool. Provides an<br />
overview to the system and explores in depth how to set up & read Session Ranking and Reach & Frequency<br />
analyses. Graphing and exporting is also covered.<br />
Who for? Sales & Marketing; Programmers; Media Buyers/Planners; Researchers etc.<br />
Pre- Requisite: Module 1 “Understanding How <strong>Radio</strong> Surveys are Conducted” Length: 2 Hours<br />
----------------------------------<br />
<strong>Radio</strong> Advisor – Advanced RA3<br />
Information covered: For people who want to be able to obtain more information from <strong>Radio</strong> Advisor, outside the<br />
basic statistics. Great for sales planning, programming etc. Can be tailored to suit the group. Covers Ebb & Flow;<br />
Program Ranking; Station Loyalty.<br />
Who for? Sales & Marketing; Programmers; Media Buyers/Planners; Researchers etc.<br />
Pre- Requisite: <strong>Radio</strong> Advisor – Basic (or initial training when installed) Length: 2 Hours<br />
----------------------------------<br />
Other <strong>Nielsen</strong> Software<br />
Training is also available to subscribers of other <strong>Nielsen</strong>’s services such as Panorama & AdEx.<br />
Panorama<br />
Panorama is a national multi-media database consisting of product and media consumption habits, consumer<br />
behaviours and attitudes. Data is collected using the <strong>Nielsen</strong> Company “Your Voice” online panel. Currency data from<br />
<strong>Radio</strong> and TV is then fused into the database providing clients with comprehensive sales & marketing tool.<br />
Using Panorama’s Microscope software, subscribers can create in-depth profiles of listeners/ consumers; identify<br />
potential target audiences or product categories for generating advertising sales; validate advertising performance and<br />
much more. The multi-media R&F available in this system allows clients to ascertain a total reach & frequency for an<br />
advertising campaign utilising different media.<br />
AdEx<br />
<strong>Nielsen</strong> provides the currency for advertising expenditure and volume measurement in Australia. AdEx measures over<br />
95% of main media advertising across Australia each year (excluding Classifieds) and provides clients with a means to<br />
track advertising spend and activity by Media, Category, Agency, Advertiser or Product.<br />
Using Adex’s Ad*Views Reporter software, subscribers can analyse a specific client or agency’s media expenditure<br />
and history; use it as a sales prospecting tool for current or potential clients; analyse the effectiveness of advertising<br />
campaigns and much more.<br />
<strong>Nielsen</strong> Software Workshop<br />
The Software Workshop is a practical training session showing you how to use AdEx, Panorama and <strong>Radio</strong> Advisor<br />
together to create a “story” for your <strong>Radio</strong> Station. In this session we workshop your projects so you gain the<br />
maximum benefit of using <strong>Nielsen</strong>’s data.<br />
Who for? Sales & Marketing; Media Buyers/Planners; Researchers etc.<br />
Pre- Requisite: AdViews Reporter, <strong>Radio</strong> Advisor, Panorama Length: 2 Hours
<strong>2010</strong> <strong>Nielsen</strong> <strong>Radio</strong> Training Schedule<br />
These training sessions are free to current subscribers of The <strong>Nielsen</strong> Company’s <strong>Radio</strong> <strong>Ratings</strong> Data.<br />
Please note: Dates, times and courses may change subject to demand. Please see the <strong>2010</strong> <strong>Radio</strong><br />
Training Course sheet for details on each course.<br />
____________________________________________________________________________________________________________________________<br />
SYDNEY<br />
Held at: The <strong>Nielsen</strong> Company, Level 2, 11 Talavera Rd, Macquarie Park NSW 2113<br />
____________________________________________________________________________________________________________________________<br />
Module 1<br />
How <strong>Radio</strong> Surveys are Conducted & Basic<br />
Statistics including R&F.<br />
The <strong>Nielsen</strong> Company – <strong>2010</strong> <strong>Radio</strong> <strong>Survival</strong> <strong>Kit</strong>.<br />
Module 2<br />
Understanding the Survey Numbers.<br />
Panorama<br />
Introduction to<br />
(This session is theory only).<br />
Jan Wed 20, 10am<br />
Feb Mon 8, 9:30am (Monday)<br />
Mar Wed 3, 10am Wed 3, 2pm Wed 10, 9:30am<br />
Apr Wed 14, 10am Wed 21, 9:30am<br />
May Wed 12, 10am Wed 12, 2pm Wed 19, 9:30am<br />
Jun Wed 16, 10am Wed 23, 9:30am<br />
Jul Wed 7, 10am Wed 7, 2pm Wed 14, 9:30am<br />
Aug Wed 11, 10am Wed 18, 9:30am<br />
Sep Wed 8, 10am Wed 8, 2pm Wed 15, 9:30am<br />
Oct Wed 6, 10am Wed 13, 9:30am<br />
Nov Wed 10, 10am Wed 10, 2pm Wed 17, 9:30am<br />
Panorama Software*<br />
* Users need to be able to use Excel<br />
due to the complexity of the software.<br />
<strong>Radio</strong> Advisor Basic<br />
RA3<br />
<strong>Radio</strong> Advisor Advanced<br />
RA3<br />
AdViews<br />
Jan Thu 21, 10am Thu 21, 2pm Thu 28, 2pm<br />
Feb Mon 8, 11am (Monday)<br />
Mar Wed 10, 11am Thu 4, 10am Thu 4, 2pm Thu 11, 2pm<br />
Apr Wed 21, 11am Thu 15, 10am Thu 15, 2pm Thu 22, 2pm<br />
May Wed 19, 11am Thu 13, 10am Thu 13, 2pm Thu 20, 2pm<br />
Jun Wed 23, 11am Thu 17, 10am Thu 17, 2pm Thu 24, 2pm<br />
Jul Wed 14, 11am Thu 8, 10am Thu 8, 2pm Thu 15, 2pm<br />
Aug Wed 18, 11am Thu 12, 10am Thu 12, 2pm Thu 19, 2pm<br />
Sep Wed 15, 11am Thu 9, 10am Thu 9, 2pm Thu 16, 2pm<br />
Oct Wed 13, 11am Thu 7, 10am Thu 7, 2pm Thu 14, 2pm<br />
Nov Wed 17, 11am Thu 11, 10am Thu 11, 2pm Thu 18, 2pm<br />
____________________________________________________________________________________________________________________________<br />
BRISBANE<br />
Held at The <strong>Nielsen</strong> Company, Level 1, 490 Adelaide Street, Brisbane QLD 4000<br />
____________________________________________________________________________________________________________________________<br />
Module 1<br />
How <strong>Radio</strong> Surveys are Conducted & Basic<br />
Statistics including R&F.<br />
Panorama Module 2<br />
Understanding the Survey Numbers.<br />
Mar Tue 16, 10am Tue 16, 1pm<br />
Apr Tue 27, 10am Tue 27, 1pm Tue 27, 3:30pm<br />
Jun Tue 8, 10am Tue 8, 1pm<br />
Jul Tue 20, 10am Tue 20, 1pm Tue 20, 3:30pm<br />
Aug/Sep Tue 31, 10am (August) Tue 31, 1pm (August)<br />
Oct Tue 19, 10am Tue 19, 1pm Tue 19, 3:30pm<br />
Nov/Dec Tue 30, 10am (November) Tue 30, 1pm (November)<br />
<strong>Radio</strong> Advisor Advanced RA3 <strong>Radio</strong> Advisor Basic RA3 AdViews<br />
Mar Tue 16, 3:30pm Wed 17, 9:30am Wed 17, 11:30am<br />
Apr Wed 28, 9:30am Wed 28, 11:30am<br />
Jun Tue 8, 3:30pm Wed 9, 9:30am Wed 9, 11:30am<br />
Jul Wed 21, 9:30am Wed 21, 11:30am<br />
Aug/Sep Tue 31, 3:30pm (August) Wed 1, 9:30am (September) Wed 1, 11:30am (September)<br />
Oct Wed 20, 9:30am Wed 20, 11:30am<br />
Nov/Dec Tue 30, 3:30pm (November) Wed 1, 9:30am (December) Wed 1, 11:30am (December)<br />
Contact Ann-Maree Nolan (02 8873 7713) for Sydney and Brisbane market training<br />
PTO for Melbourne, Adelaide and Perth training information.
<strong>2010</strong> <strong>Nielsen</strong> <strong>Radio</strong> Training Schedule<br />
These training sessions are free to current subscribers of The <strong>Nielsen</strong> Company’s <strong>Radio</strong> <strong>Ratings</strong> Data.<br />
Please note: Dates, times and courses may change subject to demand. Please see the <strong>2010</strong> <strong>Radio</strong><br />
Training Course sheet for details on each course.<br />
____________________________________________________________________________________________________________________________<br />
MELBOURNE<br />
Held at The <strong>Nielsen</strong> Company, Level 5, The Gateway, 312 St Kilda Rd, Melbourne VIC 3004<br />
Contact: David Burge, (03) 9207 3980<br />
____________________________________________________________________________________________________________________________<br />
Modules 1 & 2<br />
How <strong>Radio</strong> Surveys are Conducted & Basic<br />
Statistics including R&F.<br />
<strong>Radio</strong> Advisor Basic <strong>Radio</strong> Advisor Advanced<br />
Jan<br />
Feb Wed 17, 10am Thu 18, 10am<br />
Mar Wed 17, 10am Thu 18, 10am Thu 18, 1pm<br />
Apr Wed 14, 10am Thu 15, 10am<br />
May Wed 12, 10am Thu 13, 10am Thu 20, 10am<br />
Jun Wed 16, 10am Thu 17, 10am<br />
Jul Wed 14, 10am Thu 15, 10am Thu 22, 10am<br />
Aug Wed 11, 10am Thu 12, 10am<br />
Sep Wed 15, 10am Thu 16, 10am Thu 23, 10am<br />
Oct Wed 13, 10am Thu 14, 10am<br />
Nov Wed 17, 10am Thu 18, 10am Thu 25, 10am<br />
Dec Wed 8, 10am Thu 9, 10am<br />
Panorama AdViews<br />
Jan<br />
Feb Wed 24, 10am Wed 24, 12md<br />
Mar Wed 17, 2pm Wed 17, 4pm<br />
Apr Wed 21, 10am Wed 21, 12md<br />
May Wed 19, 10am Wed 19, 12md<br />
Jun Wed 23, 10am Wed 23, 12md<br />
Jul Wed 21, 10am Wed 21, 12md<br />
Aug Wed 18, 10am Wed 18, 12md<br />
Sep Wed 22, 10am Wed 22, 12md<br />
Oct Wed 20, 10am Wed 20, 12md<br />
Nov Wed 24, 10am Wed 24, 12md<br />
Dec Wed 15, 10am Wed 15, 12md<br />
Training for Adelaide & Perth are all on an ad hoc basis.<br />
Please see below for contact in each market.<br />
____________________________________________________________________________________________________________________________<br />
ADELAIDE<br />
Contact: David Burge, (03) 9207 3980<br />
____________________________________________________________________________________________________________________________<br />
PERTH<br />
Contact: Richard Webster, 0419 904 197<br />
____________________________________________________________________________________________________________________________<br />
The <strong>Nielsen</strong> Company – <strong>2010</strong> <strong>Radio</strong> <strong>Survival</strong> <strong>Kit</strong>.<br />
NIELSEN TRAINING CONDITIONS<br />
Minimum Class size is 3. Once a place is booked in a course, <strong>Nielsen</strong> must receive notification of cancellations no<br />
later than 48hrs before course commences. Someone else from your organisation can attend in your place if<br />
necessary. Please be considerate to others – if no notification is received and the class falls below 3 on the day, the<br />
course will be cancelled at the last moment, causing great inconvenience to other attendees who have arrived.<br />
Cancellations less than 48hrs will incur a $150 cancellation fee.
Available Analyses…<br />
The <strong>Nielsen</strong> Company – <strong>2010</strong> <strong>Radio</strong> <strong>Survival</strong> <strong>Kit</strong>.<br />
<strong>Radio</strong> Advisor is the <strong>Nielsen</strong> re-analysis software<br />
package specifically designed for quick, easy and<br />
flexible analysis of radio audience surveys.<br />
It allows analysis using a variety of pre-set standard<br />
demographics and sessions, or users can create<br />
and save their own demographics and sessions.<br />
Analysis requirements can also be preset so that all<br />
necessary output can be easily and quickly<br />
generated as soon as new radio audience surveys<br />
are released, thereby allowing "batch" processing of<br />
the selected analyses.<br />
Session Ranking<br />
Session Ranking lets you analyse multiple statistics (such as average audience, share, cume,<br />
exclusive audience, TSL, Profile % and Index %) according to user-specified session times,<br />
which can be viewed as an average of the selected session, or drilled down into ¼ hr, ½ hr or<br />
1 hr segments.<br />
Reach & Frequency (1 week through to 52 weeks)<br />
Program Ranking<br />
Reach & Frequency lets you analyse for any given advertising schedule, the number of<br />
different people reached at least once by that schedule (Reach), the total number of impacts<br />
(Gross Impacts) and the average frequency with which the net audience was exposed to the<br />
commercial message (Average Frequency). Different spot weights and station placements<br />
across multiple weeks are also catered for.<br />
Program Ranking lets you analyse programs by average audience and reach statistics for<br />
different demographics as well as filter by program types i.e.: sport, talk-back, adult<br />
contemporary music etc. Weekly totals or day by day results are available.<br />
Ebb & Flow (1/4hr & Session)<br />
The Ebb & Flow report type allows you to analyse the audience movement between two<br />
nominated time periods, isolating and quantifying station switching. Ebb & Flow analyses can<br />
cross-tabulate entire sessions or specific quarter-hours.<br />
Station Loyalty<br />
The Station Loyalty report type allows you to identify the percentage of time that a station's<br />
cume (reach) spends with that station, and the percentages of time that the same station's<br />
cume (reach) spends with other stations. Another way to identify the overall level of ‘loyalty’ of<br />
a station’s audience.<br />
Continued over…
<strong>Radio</strong> Advisor Features…<br />
Cruise and Power User Modes – Cruise mode is designed for novice or infrequent users, while<br />
Power mode provides full flexibility for the more experienced user.<br />
Multi-Market Analysis - analyse multiple markets within a single job (applicable only to<br />
Sydney/Melbourne/Brisbane/Adelaide/Perth markets).<br />
Market Combinations - combine markets to produce a ‘national’ or ‘eastern seaboard’ report<br />
(applicable only to Sydney/Melbourne/Brisbane/Adelaide/Perth markets).<br />
Multiple Surveys (Trending) - select and process multiple surveys within a single job file.<br />
Multi-Survey Combinations - combine surveys together (from within the same year) to produce<br />
survey average reports.<br />
Station Combinations - combine stations to produce ‘network’ or combo-buy results.<br />
Demographics - a comprehensive and easy-to-navigate selection ‘tree’ makes selecting<br />
demographics quick and easy.<br />
On-screen ‘explanations’ - users can easily have results translated into ‘plain English’ definitions.<br />
Comprehensive Charting - data can be plotted in charts and then formatted for directly dropping<br />
into a proposal or report.<br />
Exporting - is now easier and faster with the option to export multiple tables to .XLS or .PDF file<br />
format direct from the results page… the Batch module also allows you to export survey data for<br />
multiple job files automatically.<br />
Market Totals - market totals are automatically displayed on all reports.<br />
Place of Listening - process multiple Place of Listening filters within a single job.<br />
Spot Importer - import a spot schedule direct from a .XLS spreadsheet.<br />
Automated Database Updating - survey data files are automatically copied into the database via<br />
the ‘uploader’.<br />
System Requirements…<br />
Prerequisite software Microsoft Internet Explorer 6.0 SP1 or later (prerequisite for .NET<br />
Framework)<br />
RAM Minimum: 512 MB<br />
Recommended: 1 GB or higher<br />
Hard Disk space 600 MB for SQL Express<br />
280 MB .Net Framework 2<br />
200 MB for RA database, then 10 MB per survey<br />
50 MB for <strong>Radio</strong> Advisor<br />
Processor Pentium Compatible or higher<br />
Minimum: 1 GHz , recommended: 2 GHz or higher<br />
Operating System Windows XP Professional or Home Edition or Media Edition SP2<br />
Windows 2000 Professional Edition or Server Edition SP4<br />
Windows 2000 Advanced Edition SP4<br />
Windows 2000 Datacenter Server Edition SP4<br />
Windows Vista<br />
Software which will be<br />
installed<br />
The <strong>Nielsen</strong> Company – <strong>2010</strong> <strong>Radio</strong> <strong>Survival</strong> <strong>Kit</strong>.<br />
<strong>Radio</strong> Advisor<br />
.Net Framework Version 2<br />
SQL Express
Standard Demographic Categories<br />
Available in <strong>Radio</strong> Advisor<br />
AGE SEX MARITAL STATUS<br />
10-12 YRS MALE NEVER MARRIED<br />
13-14 YRS FEMALE MARRIED/DEFACTO<br />
15 YRS SEPARATED<br />
16-17 YRS DIVORCED<br />
18-19 YRS WIDOWED<br />
20-24 YRS<br />
25-29 YRS<br />
30-34 YRS<br />
35-39 YRS<br />
40-44 YRS<br />
45-49 YRS<br />
50-54 YRS<br />
55-59 YRS<br />
60-64 YRS<br />
65-69 YRS<br />
70+ YRS<br />
CAR DETAILS CHILDREN IN OCCUPATION<br />
HOME (A)<br />
OWNER A- MANAGERS/ADMINIST.<br />
NON OWNER NO CHILDREN B- PROFESSIONALS<br />
WITH C0-4 ONLY C1-PARA PROFESSIONALS,<br />
WITH C5-9 ONLY CLERKS, SALES PPL,<br />
WITH C10-17 ONLY PERSONAL SERV WKRS<br />
WITH C0-4 & C5-9 C2-TRADESPERSONS<br />
WITH C0-4 & C10-17 D- PLANT & MACH. OPER.<br />
WITH C5-9 & C10-17 AND DRIVERS<br />
GROCERY WITH C0-4,5-9 & 10-17 E- LABOURERS &<br />
BUYER RELATED WORKERS<br />
F- UNEMPLOYED<br />
GROC BUYER WKG G- STUDENT/UND SCH AGE<br />
GROC BUYER NWKG H- NOT IN PAID EMPLOYMENT<br />
NOT GROC BUYER /RETIRED/AGED PNSR<br />
LANGUAGE MOST CHILDREN IN OCCUPATION STATUS<br />
SPOKEN AT HOME HOME (B)<br />
(other than English) FULL-TIME<br />
ASIA/PACIFIC NO CHILD (5-17) PART-TIME<br />
MEDITERRANEAN/AMERICAS WITH C5-12 ONLY CASUAL/TEMP<br />
OTHER EUROPEAN WITH C13-17 ONLY<br />
OTHER WITH C5-12 & C13-17 SELF-EMPLOYED<br />
NO OTHER LANGUAGE WITH C0-4 & C5-12 EMPLOYEE<br />
WITH C0-4 & C13-17<br />
WITH C0-4,C5-12 &13-17<br />
The <strong>Nielsen</strong> Company - <strong>2010</strong> <strong>Radio</strong> <strong>Survival</strong> <strong>Kit</strong>. Page 1 of 2
Standard Demographic Categories<br />
Available in <strong>Radio</strong> Advisor<br />
AREA HHOLD SIZE/PERSONS<br />
(Adelaide) A1-CENTRAL 1<br />
A2-NORTHERN 2<br />
A3-EAST & SOUTH 3<br />
A4-WEST & SW 4<br />
(Brisbane) B1-EAST 5<br />
B2-WEST 6<br />
B3-SOUTH 7<br />
B4-CITY & CNTH 8+<br />
B5-NORTH<br />
(Melbrne) M1-NORTH<br />
M2-SOUTH TYPE OF DWELLING<br />
M3-EAST<br />
M4-WEST HOUSE<br />
(Perth) P1-NTH & NE FLAT/UNIT<br />
P2-STH & SE OTHER<br />
P3-WESTERN<br />
P4-STH WEST NO. OF CHILDREN<br />
(Sydney) S1-NORTH AT HOME<br />
S2-CENT/INNER W<br />
S3-SOUTH NO CHILDREN<br />
S4-SOUTH WEST 1-2 CHILDREN<br />
S5-WEST 3+ CHILDREN<br />
(Newc.) N1-NEWC/PT.STEPH.<br />
N2-MAIT/CESSNOCK NO. OF RADIOS IN HOME<br />
N3-LAKE MACQRIE<br />
(Woll.) W1-NORTH-CROWN ST 1<br />
W2-SOUTH-CROWN ST 2<br />
(Cntrl Cst) CC1-GOSFORD 3<br />
NSW CC2-WYONG 4<br />
5<br />
6<br />
7<br />
8+<br />
HOUSEHOLD INCOME HOME/UNIT EDUCATION<br />
OWNERSHIP<br />
LESS THAN $15,000 STILL AT SCHOOL<br />
$15,001 - $20,000 OWNED OUTRIGHT PRIMARY<br />
$20,001 - $30,000 UNDER MORTGAGE LOWER SECONDARY<br />
$30,001 - $40,000 RENTED UPPER SECONDARY<br />
$40,001 - $50,000 OTHER TRADE CERTIFICATE<br />
$50,001 - $60,000 DIPLOMA/CERTIFICATE<br />
$60,001 - $70,000 DEGREE<br />
$70,001 - $80,000<br />
$80,001 - $90,000<br />
$90,001 - $100,000<br />
$100,001 - $110,000<br />
$110,001 - $120,000<br />
$120,001 - $130,000<br />
$130,001 - $140,000<br />
$140,001 - $150,000<br />
MORE THAN $150,000<br />
Any combination of the above elements can be used within <strong>Radio</strong><br />
Advisor to generate a customised demographic (subject to<br />
adequate sample size).<br />
The <strong>Nielsen</strong> Company - <strong>2010</strong> <strong>Radio</strong> <strong>Survival</strong> <strong>Kit</strong>. Page 2 of 2
The <strong>Nielsen</strong> Company – <strong>2010</strong> <strong>Survival</strong> <strong>Kit</strong>.<br />
Occupation<br />
Classifications<br />
(Any combination of the following categories is available within <strong>Radio</strong> Advisor)<br />
A - MANAGERS and ADMINISTRATORS<br />
Legislators, Government Appointed Officials, General Managers, Farmers and Farm Managers,<br />
Managing Supervisors.<br />
B - PROFESSIONALS<br />
Natural Scientists, Building Professionals, Engineers, Health Diagnosis and Treatment Practitioners,<br />
School Teachers, Other Teachers & Instructors, Social Professionals, Business Professionals, Artists<br />
and Related Professionals.<br />
C1 - PARA-PROFESSIONALS, CLERKS, SALESPERSONS and<br />
PERSONAL SERVICE WORKERS<br />
People with technical training, e.g. Technicians, Air & Sea Transport Technical Workers, Registered<br />
Nurses, Police and Air Traffic Controllers. Stenographers & Typists, Personal Assistants, Data<br />
Processing and Business Machine Operators, Clerks, Receptionists, Telephonists, and Messengers.<br />
Investment and Real Estate Salespersons, Sales Representatives, Sales Assistants, Tellers,<br />
Cashiers, Ticket Salespersons and Telesales.<br />
C2 - TRADESPERSONS<br />
Metal Fitting and Machining Tradespersons, Electrical and Electronic Tradespersons, Building<br />
Tradespersons, Printing Tradespersons, Vehicle Tradespersons, Food Tradespersons.<br />
D - PLANT and MACHINE OPERATORS and DRIVERS<br />
Road & Rail Transport Drivers, Mobile Plant Operators (except Transport), Stationary Plant<br />
Operators, Machine Operators.<br />
E - LABOURERS and RELATED WORKERS<br />
Trades Assistants and Factory Hands, Agricultural Workers and Related Workers, Cleaners,<br />
Construction and Mining Labourers, Miscellaneous Labourers & Related Workers.<br />
F – UNEMPLOYED/LOOKING FOR WORK<br />
G - STUDENT OR UNDER SCHOOL AGE<br />
H - NOT IN PAID EMPLOYMENT, RETIRED OR AGED PENSIONER<br />
Please Note: The occupation groupings used by The <strong>Nielsen</strong> Company are the Australian Standard<br />
Classification of Occupations (ASCO) published by the Australian Bureau of Statistics.<br />
Specific occupations listed underneath each category are examples only. This is not an exhaustive<br />
list.
Newspaper Readership (NP)<br />
Read a newspaper in the past 7 days<br />
Newspaper X readers/ non readers in the past 7 days - all major newspapers, local, other<br />
Read a newspaper in the past 7 days (paper version)<br />
Read a newspaper in the past 7 days (online)<br />
Newspaper X readers/ non readers in the past 7 days - all major newspapers, local, other (paper version)<br />
Newspaper X readers/ non readers in the past 7 days - all major newspapers, local, other (online)<br />
Local Messenger readership (Adelaide only)<br />
A Community readership (Perth only)<br />
Valid Data Period<br />
i.e Data is only available for years stated<br />
If no end date, still current<br />
1996 - 2009<br />
1998 - 2009<br />
<strong>2010</strong> -<br />
<strong>2010</strong> -<br />
<strong>2010</strong> -<br />
<strong>2010</strong> -<br />
1996 - 1996<br />
1996 - 1996<br />
Technology (TE)<br />
Have access to a personal computer in the household<br />
1996 -<br />
Have a mobile phone<br />
2001 -<br />
Intend to purchase/ replace/ keep existing mobile phone in the next 12 months<br />
2001 -<br />
Consider changing mobile phone network carrier in next 12 months 2005 -<br />
Have mobile phone prepaid or plan contract 2005 -<br />
Last access to the internet - past week, 1-4 weeks ago, more than 4 weeks ago<br />
2000 - 2007<br />
How often access the internet - daily / weekly / fortnightly / monthly / less often / never 2008 -<br />
Where internet is accessed from - home / work / school / elsewhere<br />
2000 -<br />
Mobile phone network carrier<br />
2002 -<br />
Internet Surfing frequency<br />
2003 -<br />
Access to Internet in past month<br />
1996 - 1999<br />
Type of Internet connection at home -(Dial-Up/Broadband/No Connection) 2006 -<br />
Have a mobile phone (old definition)<br />
1996 - 2000<br />
Intend to buy/ replace mobile phone in next 12 months<br />
1996 - 2000<br />
CD player at home/ in car<br />
1997 - 1999<br />
Compact discs bought in past six months for self or others, by number - less than 5, 5-10, more than 10, none<br />
1997 - 2001<br />
Play home video games<br />
2000 - 2000<br />
Have a music CD player in the car<br />
2000 - 2000<br />
Have a music CD player at home<br />
2000 - 2000<br />
Whether visited a newspaper website<br />
2001 - 2001<br />
Home phone provider<br />
2002 - 2002<br />
Television (TV)<br />
Commercial TV viewing frequency<br />
ABC TV viewing frequency<br />
PAYTV viewing frequency<br />
Personally viewed a rented video/DVD in the past 7 days<br />
Household currently subscribes to Pay TV<br />
Household intends to subscribe to Pay TV<br />
Household does not intend to subscribe to Pay TV<br />
Purchasing Food (FO)<br />
Dined at a restaurant 1-3 times in the past 4 weeks<br />
Dined at a restaurant 4 or more times in the past 4 weeks<br />
Dined at a restaurant in the past 4 weeks<br />
Takeaway food frequency<br />
Bought or ordered T/Away chicken /pizza / burger/ other in the past 4 weeks<br />
Bought or ordered T/Away Asian in the past 4 weeks<br />
Purchase of food/groceries from a convenience store in past month<br />
Purchase of food/groceries from a service station with convenience store facilities in past month<br />
Bought or ordered T/Away chinese in the past 4 weeks<br />
1996 -<br />
2002 -<br />
2003 -<br />
1996 -<br />
1996 -<br />
1996 -<br />
1996 -<br />
1996 -<br />
1996 -<br />
1996 -<br />
1996 -<br />
1996 -<br />
2004 -<br />
2000 -<br />
1996 -<br />
1996 - 1997<br />
Leisure Activities (LA)<br />
Visited a hotel in the past 7 days<br />
1996 -<br />
Visited a licenced club in the past 7 days (not Perth)<br />
1996 -<br />
Regularly participate in TAB betting<br />
1996 -<br />
Regularly participate in Lotto, Instant Lotteries/ Scratchies, Lottery etc.<br />
1996 -<br />
Regularly visit the casino<br />
1996 -<br />
Regularly participate in Internet Gambling 2006 -<br />
Been to a cinema in the past month<br />
2001 -<br />
Attended Major Sporting Event in the past 12 months<br />
2003 -<br />
Participant in horse racing<br />
1996 - 1997<br />
Interest in horse racing<br />
1998 - 2002<br />
Beverages (BE)<br />
Regular buyers of alcohol from bottle shops/hotels for home use<br />
Regular buyers of beer / wine /spirits for home use<br />
Regular buyers of pre-mixed spirits/ready to drink for home use<br />
Travel (TR)<br />
Likely to travel interstate by air within the next 12 months<br />
Likely to travel overseas by air within the next 12 months<br />
Holiday travel destination in next 12 months<br />
Holiday within the state (Perth only)<br />
Holiday - whereabouts (Perth only)<br />
Inter-State travel frequency<br />
Overseas air travel (frequency)<br />
Single Source Categories<br />
Available Through <strong>Radio</strong> Advisor<br />
1996 -<br />
1996 -<br />
2003 -<br />
2000 -<br />
2000 -<br />
2002 -<br />
1996 - 1996<br />
1996 - 1996<br />
1996 - 1999<br />
1996 - 1999<br />
Page 1 of 2
Single Source Categories<br />
Available Through <strong>Radio</strong> Advisor<br />
House & Home (HH)<br />
Likely to buy or sell a house or unit in the next 2 years<br />
Intend to undertake major home renovations in the next 12 months<br />
Type of renovations in next 12 months - Painting<br />
Type of renovations in next 12 months - Landscaping / Gardening<br />
Type of renovations in next 12 months - Extensions / Repair work<br />
Type of renovations in next 12 months - <strong>Kit</strong>chen / Bathroom<br />
Type of renovations in next 12 months - General household refurbishment<br />
Type of renovations in next 12 months - Other type<br />
Pet ownership - dog, cat or other<br />
First home buyers<br />
Valid Data Period<br />
i.e Data is only available for years stated<br />
If no end date, still current<br />
1996 -<br />
1996 -<br />
2003 -<br />
2003 -<br />
2003 -<br />
2009 -<br />
2003 -<br />
2003 - 2008<br />
2001 -<br />
1996 - 1996<br />
Purchase Decisions (PD)<br />
Intend to purchase whitegoods within the next 12 months<br />
1996 -<br />
Intend to purchase general furniture within the next 12 months<br />
1996 -<br />
Intend to purchase TV/ HiFi/ VCR/ DVD within the next 12 months<br />
1996 -<br />
Intend to purchase motor vehicle in next 12 months<br />
1996 -<br />
Intend to purchase a personal computer in the next 12 months<br />
1998 - 2006<br />
Intend to purchase computer software in the next 12 months<br />
1998 -<br />
Intend to purchase small electrical goods in the next 12 months<br />
2001 -<br />
Intend to purchase computer/video games in next 12 months<br />
2003 -<br />
Intend to purchase other computer hardware/accessories in next 12 months<br />
2003 - 2006<br />
Intend to purchase a personal computer, hardware or computer accessories in the next 12 months<br />
2007 -<br />
Intend to purchase air conditioning / heater in the next 12 months 2005 -<br />
Shopped for fashion clothing or accessories in past month<br />
2001 - 2007<br />
Made purchase from a hardware store in past month<br />
2003 -<br />
Made purchase from a garden nursery in past month<br />
1996 -<br />
Made purchase from a pharmacy/chemist in past month<br />
2002 -<br />
Made purchase from a department store in past month<br />
2003 -<br />
Made purchase from a discount retailer in past month<br />
2003 -<br />
Made purchase from a fashion/clothing store in past month<br />
2008 -<br />
Made purchase from a furniture/appliance store in past month<br />
2003 -<br />
Made purchase from a newsagency in past month<br />
2003 -<br />
Made purchase from a bookstore in past month<br />
2003 -<br />
Made purchase from a music/record store in past month<br />
2003 -<br />
Have bought goods/services over the Internet<br />
2003 - 2004<br />
When last purchased goods or services over the internet (past mth, more than mth never) 2005 -<br />
Intend to purchase a computer/ hardware in the next 12 months<br />
1996 - 1997<br />
Intend to purchase new motor vehicle in the next 12 months<br />
1996 - 2001<br />
Intend to purchase used motor vehicle in the next 12 months<br />
1996 - 2001<br />
Made purchase from hardware store in past 14 days<br />
1996 - 2002<br />
Whether people would shop online with a credit card<br />
2001 - 2002<br />
Purchased a DVD or video in past month<br />
2005 - 2006<br />
Purchased a DVD or video, or purchased and downloaded a movie, TV show or music video in the past month<br />
2007 - 2007<br />
Purchased a DVD or video, TV show or music video from a store in past month<br />
2008 -<br />
Watched or downloaded a movie or TV show from the internet in past month 2008 -<br />
Intend to purchase MP3 player / iPod in next 12 months 2007 -<br />
Digital <strong>Radio</strong> (i.e. receives digital radio broadcast) 2009 -<br />
Finance & Insurance (FI)<br />
Have private health insurance<br />
1996 -<br />
Have comprehensive motor vehicle insurance<br />
1999 -<br />
Credit card holders<br />
2002 -<br />
Amex/ Diners Card holders<br />
2003 -<br />
Visa/ Mastercard/ Bankcard holders (note that 'Bankcard' was removed from the definition in 2009)<br />
2003 -<br />
Have a personal loan<br />
1996 -<br />
Have personal investment (excluding Superannuation) - less than $50,000 / $50,000-$150,000 / more than $150,000<br />
2008 -<br />
Have personal investment - less than $10,000 / $10,000-$50,000 / more than $50,000<br />
2003 - 2007<br />
Intend to purchase financial/investment services in next 12 months<br />
2003 -<br />
No. of people working in the household<br />
1998 -<br />
Have a mortgage with a bank/ credit union<br />
2001 -<br />
Have a mortgage with lender (other than bank/credit union)<br />
2000 -<br />
Have no mortgage<br />
2001 -<br />
Would consider changing mortgage lender<br />
Have personal investment $5000+<br />
Have home contents insurance<br />
Have home and/or contents insurance<br />
Amex/ Diners Card holders<br />
Visa/ Mastercard/ Bankcard holders<br />
Employ up to 50 people nationally at place of work<br />
Employ 50 or more people nationally at place of work<br />
These categories are available with survey data collected for<br />
the five capital cities. Other markets will most likely be the<br />
same, however some categories may change.<br />
It is important to remember that when using these filters with<br />
<strong>Radio</strong> Advisor data, the overall sample size of your<br />
demographic will be reduced in most instances, sometimes<br />
significantly. Users should pay strict attention to the sample<br />
size for each demo/category.<br />
2003 -<br />
1996 - 1997<br />
1996 - 1998<br />
<strong>2010</strong> -<br />
1996 - 2000<br />
1996 - 2001<br />
1997 - 2001<br />
1997 - 2001<br />
Have personal investment over $10,000<br />
1998 - 2002<br />
Have personal investment of $5,000 up to $10,000<br />
1998 - 2002<br />
Have a mortgage with a bank<br />
2000 - 2000<br />
Have a mortgage with a credit union<br />
2000 - 2000<br />
How people pay their bills - phone, internet, other<br />
2001 - 2002<br />
Page 2 of 2
METRO LIFESTYLE QUESTIONNAIRE<br />
The following two pages include a number of simple questions which we would like you to answer at any time<br />
during the week. When used with the information on radio listening, these answers will help broadcasters<br />
understand the way in which programmes and stations are chosen by different types of people. Please<br />
remember, the published results only show the total information from groups of people taken together, never<br />
individual information, so all your answers remain confidential.<br />
Thank you again for helping to provide this information which is so greatly<br />
appreciated by the radio industry.<br />
Please answer the following questions by placing a cross in the appropriate boxes <br />
Q1 Which of the following newspapers have you read or<br />
looked into in the past 7 days? (Cross all applicable)<br />
Metro Daily 1<br />
Metro Daily 2<br />
Metro Sunday 1<br />
Metro Sunday 2<br />
Aust. Financial Review<br />
The Australian<br />
Local Community Paper<br />
Other Newspaper<br />
Paper Online No<br />
1<br />
1<br />
1<br />
1<br />
1<br />
1<br />
1<br />
1<br />
2<br />
2<br />
2<br />
2<br />
2<br />
2<br />
2<br />
2<br />
3<br />
3<br />
3<br />
3<br />
3<br />
3<br />
3<br />
3<br />
Q2 On an average day (between Monday and Sunday),<br />
how much time would you spend watching each of the<br />
following types of television? (Do not include time spent<br />
watching videos or DVDs)<br />
(Cross one box only in each column)<br />
Commercial<br />
(7, 9, 10, SBS)<br />
More than 5 hours per day 1<br />
3 to 5 hours per day 2<br />
1 to 3 hours per day 3<br />
Up to 1 hour per day 4<br />
Don’t usually watch 7<br />
ABC Pay TV<br />
1<br />
2<br />
3<br />
4<br />
7<br />
1<br />
2<br />
3<br />
4<br />
7<br />
Q3 Regarding PAY TV, do you (or your household)…?<br />
(Cross one box only) Already subscribe 1<br />
Intend to subscribe 2<br />
Do not intend to subscribe 3<br />
Don’t know whether you will subscribe 4<br />
Q4a Have you personally viewed a rented<br />
DVD or video in the past 7 days?<br />
Q4b Have you purchased a DVD or video,<br />
TV show or music video from a store in<br />
the past month?<br />
Q4c Have you watched or downloaded a<br />
movie/TV show from the internet in the<br />
past month?<br />
Q5 Have you visited a cinema to watch a<br />
movie in the past month?<br />
Q6 In the past 12 months, have you<br />
attended a major sporting event (e.g.<br />
football match, cricket, tennis, golf etc)?<br />
Yes 1<br />
No 2<br />
Yes 1<br />
No 2<br />
Yes 1<br />
No 2<br />
Yes 1<br />
No 2<br />
Yes 1<br />
No 2<br />
Q7 Regarding pets, do you have a? (Cross all applicable)<br />
Dog 1<br />
Other Pet 3<br />
Cat 2<br />
No Pets 4<br />
Q8 Will you purchase any of the following products or<br />
services in the next 12 months? (Cross all applicable)<br />
Whitegoods (e.g. fridge, dryer, microwave)<br />
Air Conditioning / Heater<br />
General furniture (e.g. lounge, bed, table)<br />
Digital <strong>Radio</strong> (i.e. receives digital radio broadcast)<br />
Audio/Visual Equipment (e.g. TV, stereo)<br />
Small electrical goods (e.g. kettle, toaster)<br />
3<br />
Finance and investment<br />
Motor vehicle<br />
Personal computer / hardware / accessories<br />
Computer or video games<br />
Computer software<br />
MP3 Player / iPod<br />
Q9 Do you have a personal computer (not<br />
just computer games or game consoles) in<br />
your household?<br />
Q10a How often do you access the Internet?<br />
(Cross one box only)<br />
Daily 1<br />
Weekly 2<br />
Fortnightly 3<br />
Monthly 4<br />
Yes No<br />
1<br />
1<br />
1<br />
1<br />
1<br />
1<br />
1<br />
1<br />
1<br />
1<br />
1<br />
1<br />
IF YOU HAVE ACCESSED THE INTERNET -<br />
Q10b From where do you access the Internet?<br />
(Cross all applicable)<br />
Q10c<br />
Home 1<br />
Work 2<br />
2<br />
2<br />
2<br />
2<br />
2<br />
2<br />
2<br />
2<br />
2<br />
2<br />
2<br />
2<br />
Yes 1<br />
No 2<br />
Less often 5<br />
Never 6<br />
School / College / University 3<br />
Elsewhere 4<br />
What type of Internet connection do you have at<br />
home? (Cross all applicable)<br />
Dial Up 1 Broadband 2 No Connection 3<br />
Q10d In an average week how long would you spend<br />
‘surfing’ the Internet (do not include time using e-mail)?<br />
(Cross one box only) Up to one hour 1<br />
Q10e<br />
1 to 3 hours 2<br />
3-5 hours 3<br />
More than 5 hours 4<br />
Do not use the Internet for ‘surfing’ 5<br />
When did you last personally purchase goods or<br />
services over the Internet?<br />
Past month 1<br />
More than one month ago 2<br />
Never 3<br />
Q11 In the past month, have you purchased any food or<br />
groceries from a…?<br />
Yes No<br />
Convenience Store<br />
Service station with full<br />
convenience store facilities<br />
1<br />
1<br />
2<br />
2
Q12 In the past month, have you personally made any<br />
purchases from the following store types?<br />
Yes No<br />
Hardware store<br />
Garden nursery<br />
Pharmacy / Chemist<br />
Department store (e.g. Myer)<br />
Discount retailer (e.g. K-mart, Target)<br />
Fashion / Clothing store<br />
Furniture / Appliance store<br />
Newsagency<br />
Book store<br />
Music / Record store<br />
1<br />
1<br />
1<br />
1<br />
1<br />
1<br />
1<br />
1<br />
1<br />
1<br />
Q13a Regarding mobile phones, in the next 12 months do<br />
you intend to…? (Cross one box only)<br />
2<br />
2<br />
2<br />
2<br />
2<br />
2<br />
2<br />
2<br />
2<br />
2<br />
Keep your existing mobile phone 1<br />
Replace your existing mobile phone 2<br />
Purchase a mobile phone (don’t currently have) 3<br />
Don’t have and won’t buy a mobile phone 4<br />
IF YOU HAVE A MOBILE PHONE –<br />
Q13b Who is your current mobile phone network carrier?<br />
(Cross one box only)<br />
Optus 2<br />
3 3<br />
Telstra 4<br />
Vodafone 5<br />
Virgin 6<br />
Other mobile phone carrier 7<br />
Q13c Are you considering changing your mobile phone<br />
network carrier in the next 12 months?<br />
Yes 1 No 2<br />
Q13d Is your mobile phone contract…?(Cross one box only)<br />
Plan 1<br />
Prepaid 2<br />
Q14 How often have you eaten out at a restaurant in the<br />
past month? (Cross one box only)<br />
One to three times 1<br />
Four or more times 2<br />
Not in the past month 3<br />
Q15a In the past month, how often have you bought or<br />
ordered for home delivery, any take-away / fast food?<br />
(Cross one box only) One to three times 1<br />
IF YOU HAVE BOUGHT/ORDERED –<br />
Four or more times 2<br />
Not in the past month 3<br />
Q15b What type of food was that? (Cross all applicable)<br />
Chicken 1<br />
Pizza 2<br />
Burgers 3<br />
Asian 4<br />
(e.g. Chinese, Thai, Japanese, Indian etc)<br />
Other type 5<br />
Q16 Where do you intend to travel for a holiday in the next<br />
12 months? (Cross all applicable)<br />
Overseas 1<br />
To another state 2<br />
Within your own state 3<br />
Do not intend to travel 4<br />
Q17 Are you likely to travel by air in the next 12 months?<br />
(Cross all applicable) Yes, interstate 1<br />
Yes, overseas 2<br />
No, do not intend to travel 3<br />
IF YOU ARE UNDER 18 YEARS OF AGE, THERE IS NO NEED TO<br />
ANSWER THE FOLLOWING QUESTIONS. THANK YOU.<br />
Q18 Are you or a member of your household<br />
likely to purchase or sell a house / unit<br />
within the next two years?<br />
Yes 1<br />
No 2<br />
Q19 What type of major home renovations will you<br />
undertake in the next 12 months?<br />
(Cross all applicable) Painting 1<br />
Landscaping / gardening 2<br />
Extensions / repair work 3<br />
<strong>Kit</strong>chen / Bathroom renovations 7<br />
General household refurbishment 4<br />
None 6<br />
Q20 In the past month, have you visited a…?<br />
Yes No<br />
Hotel (i.e. pub / bar)<br />
Licensed club<br />
1<br />
1<br />
2<br />
2<br />
Q21 Which of the following do you regularly (once a month<br />
or more) purchase to take home or to parties?<br />
(Cross all applicable) Beer 1<br />
Wine 2<br />
Spirits 3<br />
Pre-mixed spirits / ready to drink 4<br />
None 5<br />
Q22 Have you participated in any of the following types of<br />
gambling in the past 2 months? (Cross all applicable)<br />
Yes No<br />
TAB betting<br />
Visited a casino / Licensed Club<br />
Internet Gambling<br />
Lotto, Instant Lotteries / Scratchies,<br />
Lottery Tickets etc<br />
1<br />
1<br />
1<br />
1<br />
2<br />
2<br />
2<br />
2<br />
Q23a Do you have a mortgage with a …?<br />
(Cross all applicable) Bank or Credit Union 1<br />
Q23b IF YOU HAVE A MORTGAGE -<br />
Would you consider changing lending<br />
provider?<br />
Other lender 2<br />
No mortgage 3<br />
Yes 1<br />
Q24 Do you personally have…?<br />
Comprehensive vehicle insurance<br />
Yes<br />
No 2<br />
No<br />
Home and/or Contents Insurance<br />
Private health insurance (exc. Medicare)<br />
Visa / MasterCard<br />
American Express / Diners Club Card<br />
Personal loan<br />
1<br />
1<br />
1<br />
1<br />
1<br />
1<br />
2<br />
2<br />
2<br />
2<br />
2<br />
2<br />
Q25 What level of personal investments (e.g. banks, shares,<br />
etc) do you have (not including superannuation)?<br />
(Cross one box only) More than $150,000 1<br />
$50,000 to $150,000 2<br />
Less than $50,000 3<br />
Have no personal investments 4<br />
THANK YOU ONCE AGAIN FOR YOUR COOPERATION
<strong>Radio</strong> Facts<br />
• On average, 60% of Australians listen to commercial radio every<br />
weekday. 76% listen every week.<br />
• 62% of commercial radio listeners only listen to commercial<br />
radio.<br />
• 79% of weekday commercial radio listeners also listen to<br />
commercial radio on the weekend.<br />
• Each working week, 26% of people listen in the car between<br />
5.30am and 9.00am. 48% of people listen while driving between<br />
4.00pm and 7.00pm.<br />
• All Australian dwellings have at least one radio. 96% have three or<br />
more.<br />
• People spend an average of 16 hours and 36 minutes listening to<br />
commercial radio per week.<br />
• Australians listen to an average of 1.5 radio stations per week.<br />
• The average age of commercial radio listeners is 42 years.<br />
49%<br />
Place of Listening<br />
33%<br />
16% 2%<br />
Home Car Work Other<br />
25<br />
20<br />
15<br />
10<br />
5<br />
0<br />
5:30<br />
6:00<br />
6:30<br />
7:00<br />
7:30<br />
8:00<br />
8:30<br />
9:00<br />
9:30<br />
10:00<br />
10:30<br />
11:00<br />
Average Daily <strong>Radio</strong><br />
Listening Trend<br />
11:30<br />
12:00<br />
12:30<br />
13:00<br />
13:30<br />
14:00<br />
14:30<br />
15:00<br />
15:30<br />
16:00<br />
16:30<br />
17:00<br />
17:30<br />
18:00<br />
18:30<br />
19:00<br />
19:30<br />
20:00<br />
20:30<br />
21:00<br />
Weekday<br />
Weekend<br />
Weekly Time Spent Listening<br />
to Commercial <strong>Radio</strong><br />
10:10<br />
13:50<br />
15:15<br />
17:53<br />
21:30<br />
22:00<br />
22:05<br />
AP 10-17 AP 18-24 AP 25-39 AP 40-54 AP 55+<br />
Source : The <strong>Nielsen</strong> Company, Average of Five Capital Cities, Survey #8 2009, All People 10+ (unless otherwise indicated). All sessions are based on standard sessions.<br />
For more information on The <strong>Nielsen</strong> Company Products, go to www.nielsen.com, click on Service, By Product.<br />
22:30<br />
23:00<br />
23:30
$56,622<br />
Average Personal Income<br />
Commercial <strong>Radio</strong> Listeners (Working)<br />
$51,986<br />
$50,039<br />
$45,692<br />
$55,794<br />
Sydney Melbourne Brisbane Adelaide Perth<br />
Source: The <strong>Nielsen</strong> Company, Panorama Survey 9 2009 , All People 14+<br />
<strong>Radio</strong> Share of Advertising Spend By Category<br />
TOTAL ADVERTI SI NG SPEND<br />
Courier/Cargo<br />
Garden<br />
Serv ices<br />
Building & Construction<br />
Education & Learning<br />
Utilities-Energy & Water<br />
Gambling/Gaming<br />
Media<br />
Government<br />
Retail<br />
8%<br />
10%<br />
13%<br />
12%<br />
16%<br />
15%<br />
17%<br />
19%<br />
22%<br />
Source: The <strong>Nielsen</strong> Company, Adex Jan-Nov 2009 - Top 10 categories shown.<br />
<strong>Radio</strong> Facts<br />
32%<br />
38%<br />
e.g. <strong>Radio</strong> Advertising<br />
e.g. <strong>Radio</strong> Advertising<br />
accounts for 32% of all<br />
accounts for 32% of all<br />
Advertising Spend by<br />
Advertising Spend by<br />
companies in the<br />
companies in the<br />
“Garden” category.<br />
“Garden” category.<br />
Who are Commercial <strong>Radio</strong> Listeners?<br />
*Of all commercial radio listeners:<br />
95% access the Internet from Home<br />
92% access the Internet Daily<br />
85% use the Internet for Electronic Mail<br />
75% have accessed google.com.au in the past month<br />
71% use the Internet for General ‘surfing’<br />
67% use the Internet to check account balance<br />
63% use the Internet for downloading software/files<br />
62% use the Internet for searching information on products<br />
62% use the Internet to Transfer funds between accounts<br />
60% use the Internet to Pay bills online<br />
Source: The <strong>Nielsen</strong> Company, Panorama Survey 9 2009, All People 14+ Internet<br />
Access & Usage. Panorama utilises a 100% Online Methodology.<br />
Health<br />
Conscious<br />
29%<br />
Individualistics<br />
19%<br />
Balance<br />
Seekers<br />
18%<br />
Fun<br />
Seekers<br />
4%<br />
Harmony<br />
Seekers<br />
13%<br />
Success<br />
Driven<br />
17%<br />
Source: The <strong>Nielsen</strong> Company, Panorama Survey 9 2009 PALS , All People 14+
A better understanding of consumer<br />
usage of products and services with<br />
Panorama<br />
Panorama is a national multi-media database consisting of product and media consumption habits,<br />
consumer behaviours and attitudes. Data is collected through a combination of an online self completion<br />
survey and currency data. Currency data from Metropolitan <strong>Radio</strong> and both Metropolitan and Regional TV<br />
is then fused into the database so subscribers can create in-depth profiles of listeners/consumers; identify<br />
potential target audiences or product categories for generating advertising sales; validate advertising<br />
performance and much more. The multi-media R&F available in this system allows clients to ascertain a<br />
total reach & frequency for an advertising campaign across radio, television, on-line, newspapers,<br />
magazines and cinema.<br />
RetailSelect – Insights on consumer intentions and retailer preferences<br />
Retail advertising accounts for almost a quarter of all main media spending, in 2009 retailers invested over<br />
$1.9billion in advertising in order to get customers into their stores. RetailSelect helps advertisers<br />
understand their customer intentions and helps them plan how to more effectively target existing and<br />
prospective customers.<br />
RetailSelect asks people aged 14+ to nominate the stores they would consider purchasing from if they<br />
were in the market to purchase; White Goods, Small Electrical Appliances, Mobile Phones, Computers &<br />
Computer Equipment, CD/DVD, Mobile Phones, Hardware and Household Furniture.<br />
Home Entertainment<br />
When it comes to selecting a preferred<br />
retailer when purchasing Home<br />
Entertainment, The Good Guys is the<br />
preferred choice amongst all people in<br />
Sydney, then Harvey Norman and JB Hi-Fi<br />
follow.<br />
Source: The <strong>Nielsen</strong> Company, Panorama Fused TV/<strong>Radio</strong> Survey 9 2009<br />
Commercial <strong>Radio</strong> Listeners<br />
Other insights enhancements<br />
The <strong>Nielsen</strong> Company – <strong>2010</strong> <strong>Radio</strong> <strong>Survival</strong> <strong>Kit</strong><br />
The Good Guys<br />
Harvey Norman<br />
JB Hi-Fi<br />
Bing Lee<br />
Dick Smith<br />
Big W<br />
Kmart<br />
Retravision<br />
Myer<br />
Other<br />
Target<br />
Domayne<br />
Clive Peeters<br />
David Jones<br />
Betta Electrical<br />
Strathfield<br />
Sydney Hi-Fi<br />
Clive Anthonys<br />
Chandlers<br />
Wow Site & Sound<br />
6.1<br />
5.8<br />
2.8<br />
2.5<br />
1.8<br />
20.2<br />
18.3<br />
18.3<br />
18<br />
14.3<br />
14.1<br />
13.1<br />
12<br />
11.6<br />
10.2<br />
26.5<br />
33.5<br />
45.4<br />
44.4<br />
43.4<br />
0 5 10 15 20 25 30 35 40 45 50<br />
PALS – Personal Aspiration Lifestyle Segments<br />
The segmentation model based on respondents ranking their<br />
priorities for the future – modelled on their aspirations not<br />
their situation now. Designed in consultation with Charlie<br />
<strong>Nielsen</strong> (Foreseechange), to provide subscribers with an<br />
alternative to demographics, which is more closely linked to<br />
behaviour rather than age, sex and market. Once an<br />
advertiser’s core audience is establishing using PALS the<br />
segment can then be linked backed within Panorama to the<br />
traditional demographic breakouts and those individuals’<br />
media consumption habits.<br />
Source: The <strong>Nielsen</strong> Company, Panorama Fused TV/<strong>Radio</strong> Survey 9 2009<br />
In 2009, Panorama expanded the depth of information covered in technology, Internet, beverages, media<br />
and expanded the attitudinal questions.
The <strong>Nielsen</strong> Company – <strong>2010</strong> <strong>Radio</strong> <strong>Survival</strong> <strong>Kit</strong><br />
Advertising Expenditure &<br />
Measurement (AdEx)<br />
The <strong>Nielsen</strong> Company provides the currency for estimated advertising expenditure and volume measurement in<br />
Australia. AdEx measures over 95% of main media advertising across Australia each year (excluding<br />
Subscription TV, Suburban Press and Classifieds) and provides clients with a means to track advertising activity<br />
by Media, Category, Agency, Advertiser or Product.<br />
Using <strong>Nielsen</strong>’s Ad*Views Reporter software, subscribers can analyse a specific client or agency’s media<br />
expenditure and history; use it as a sales prospecting tool for current or potential clients; analyse the<br />
effectiveness of advertising campaigns, run <strong>Radio</strong> Advisor Reach & Frequency and much more.<br />
Below you will find some report styles relevant to the <strong>Radio</strong> Industry.<br />
All Media National Summary <strong>Radio</strong> Network Expenditure Share<br />
<strong>Radio</strong> Network Expenditure Share<br />
Do you have any questions about Panorama or AdEx?<br />
Please contact your <strong>Nielsen</strong> representative:<br />
Sydney/Brisbane: Melbourne/Adelaide: Perth:<br />
Ann-Maree Nolan: 02 8873 7713 David Burge: 03 9207 3980 Richard Webster: 0419 904 197
Some of the more frequently used radio survey terms are outlined below. <strong>Radio</strong> Advisor also<br />
includes a more comprehensive list - just select “Help”, then look under “Terms and<br />
Definitions”. If you have any further questions regarding radio terms and definitions, please<br />
contact your <strong>Nielsen</strong> representative.<br />
Average Audience (or Average Quarter Hour Audience)<br />
used in Session Ranking, Program Ranking, Station Loyalty<br />
The average number of people listening per quarter-hour in any given time-period or session.<br />
e.g. At any given time Mon-Sun 5:30am-12mn there are, on average, 61,000 listeners tuned into<br />
Station A.<br />
Cumulative Audience (or Cumes)<br />
used in Session Ranking, Ebb & Flow; Program Ranking; Station Loyalty<br />
The total number of different people who listen for at least one quarter hour during the<br />
course of a chosen time-period or session.<br />
e.g. 600,000 different people tuned into Station B at some stage during Mon-Sun 5:30am-12mn.<br />
Station Share<br />
used in Session Ranking, Station Loyalty<br />
Share of audience is the percentage of the total radio listening audience in a given time<br />
period tuned to a particular station. Share is a station’s average audience expressed as a<br />
percentage of the total radio audience for the same period of time.<br />
e.g. Between Mon-Sun 5:30am-12mn 9.4% of all radio listening is tuned into Station C.<br />
Time Spent Listening<br />
used in Session Ranking<br />
The average amount of time that those people who listen to radio or a specific station<br />
(cumulative audience), spend listening during a specified time-period. Shown in hours and<br />
minutes (not decimal time) eg. 1:30 is one hour, thirty minutes.<br />
e.g. Station A has 799,000 listeners (cumes) each of these people listen on average for 7 hours & 6<br />
minutes (7:06).<br />
Exclusive Audience<br />
used in Session Ranking; Station Loyalty<br />
The number (000’s) or proportion (%) of listeners who tune in to only one station during a<br />
specified time period. ie. The number of people who listen exclusively to that station.<br />
e.g. Station B has 115,000 listeners who listen exclusively Mon-Sun 5:30am-12mn.<br />
Multi-Station Cume<br />
used in Session Ranking<br />
Terms and Definitions<br />
The total number of different (unduplicated) people who listen to 2 or more stations during<br />
the course of a chosen time-period or session.<br />
Note: Multi-station Cume must be calculated in <strong>Radio</strong> Advisor. Cumes cannot simply be<br />
added together as there will be a number of people who indicate listening to multiple stations<br />
during the specified time period.<br />
The <strong>Nielsen</strong> Company – <strong>2010</strong> <strong>Radio</strong> <strong>Survival</strong> <strong>Kit</strong>. Page 1 of 2
Net Reach (1+ Reach)<br />
used in Reach & Frequency<br />
Terms and Definitions con’t<br />
Refers to the number (000’s) or proportion (%) of different people reached at least once by a<br />
specified number of advertisements. Net reach can be expressed in terms of numbers of<br />
people and/or as a percentage of the population group being targeted. Ie. Net Reach is<br />
similar to Cumulative Audience but is usually quoted in association with the effectiveness of<br />
an advertising campaign, whereas Cumulative Audience is used when analysing timeperiods<br />
or sessions.<br />
Maximum Reach<br />
used in Reach & Frequency<br />
Refers to the total number of people it is possible to reach on the station/s and session/s<br />
selected within a schedule. I.e the total station cume or multiple station cume for the session<br />
chosen.<br />
e.g. If Station B has a total cume 669,0000 it is not possible to reach any more listeners as the station<br />
only has 669,000 listeners. To achieve the maximum reach an advertiser would have to put an<br />
advertisement on every ¼ hour.<br />
Gross Impacts<br />
used in Reach & Frequency<br />
The sum of the quarter-hour audience for all spots in a given advertising schedule. This<br />
figure will most likely include duplication of listeners. It is the total number of times a listening<br />
audience has the opportunity to “hear” an advertisement.<br />
Average Frequency<br />
used in Reach & Frequency<br />
The average number of times that radio listeners “reached” by an advertising campaign are<br />
exposed to an advertisement. Or how many times they have “heard” the advertisement.<br />
e.g. The average frequency for Stations A, B & C is 4.2 times.<br />
Effective Frequency<br />
used in Reach & Frequency<br />
Shows how the reach for a number of advertisements is made up in terms of the numbers<br />
(000’s) and proportion (%) of people who were reached or heard 1 or more, 2 or more, 3 or<br />
more times etc, by a series of advertisements. (e.g 1+,2+, 3+ etc)<br />
Exclusive Frequency<br />
used in Reach & Frequency<br />
Shows how the reach for a number of advertisements is made up in terms of the numbers<br />
(000’s) and proportion (%) of people who were reached or heard exactly once, exactly twice,<br />
exactly 3 times etc, by a series of advertisements. (e.g 1, 2, 3 etc)<br />
Cost Per Thousand (CPM)<br />
used in Reach & Frequency<br />
The cost of each 1000 impacts delivered by an advertising schedule (I.e. the cost of the<br />
schedule divided by the gross impacts gives you a cost per thousand).<br />
The <strong>Nielsen</strong> Company – <strong>2010</strong> <strong>Radio</strong> <strong>Survival</strong> <strong>Kit</strong>. Page 2 of 2
1. SAMPLE DESIGN<br />
The <strong>Nielsen</strong> Company - <strong>2010</strong> <strong>Radio</strong> <strong>Survival</strong> <strong>Kit</strong>.<br />
RADIO SURVEY METHODOLOGY AND OTHER TECHNICAL INFORMATION<br />
The sample on which all radio survey information is based, is a stratified multistage probability sample selected in the following manner:<br />
Page 1 of 5<br />
The total sample requirement of Census Collector's Districts (CDs) is allocated to the regions making up the survey area (see area definitions elsewhere in survival kit) in proportion to<br />
the 2008 Estimated Resident Population. Within each region, the sample of CDs is then allocated to the Statistical Local Areas (SLAs) which make up that region in proportion to the<br />
2008 Estimate of occupied private dwellings. SLAs, which are too small to attract sample, are grouped with SLAs adjacent on a geographically ordered list.<br />
Within each region SLAs (or groups of SLAs) are divided into bands according to the number of CDs required. The CDs are ordered in a geographic serpentine order, and grouped<br />
into bands of adjacent CDs such that the bands have equal numbers of occupied private dwellings according to the 2008 Estimated Resident Population. One CD is selected in each<br />
band in Sydney, Melbourne, Brisbane, Adelaide and Perth. If a selected CD has recently been used in a <strong>Nielsen</strong> Media survey, a further selection is obtained in the same manner. In<br />
some cases CDs are combined to build up the size of the area to a minimum level.<br />
Geographic serpentine ordering of areas is done by starting with the area in the north eastern corner (top right) and proceeding from east to west, and then west to east, gradually<br />
moving southwards, in a winding or serpentine fashion. This method ensures an even spread of the sample across the target area.<br />
Metropolitan Markets<br />
In Sydney, Melbourne, Brisbane, Adelaide and Perth during the first survey wave, a<br />
quarter of the selected CDs, spread throughout the entire survey area, are surveyed each<br />
week. In subsequent survey waves one fifth of the CDs are surveyed each week. Data<br />
from two survey waves are combined in producing a report although only the last two<br />
weeks of data carry over from the first survey into Wave #2 in the markets of Sydney,<br />
Melbourne, Brisbane, Adelaide and Perth.<br />
Selected CDs are mapped, blocks numbered and starting points selected at random. To<br />
achieve the planned sample, a minimum of four diaries is placed in each interviewing area<br />
each week.<br />
Regional Markets<br />
In the majority of regional markets the selected CDs are surveyed across the whole survey<br />
period. In certain larger markets the selected CDs are surveyed across half the survey<br />
period, then re-visited for the other half.<br />
Selected CDs are mapped, blocks numbered and starting points selected at random. To<br />
achieve the planned sample, a minimum number of diaries are placed in each interviewing<br />
area each week. The actual number is depends on the total sample and number of CDs<br />
to be surveyed.<br />
Interviewing follows a prescribed order of blocks within each CD. Sampling is sequential over time with up to three calls being made on every selected household. These calls are<br />
spaced over alternate waves of the survey. Interviewers rotate their calls over different times of the day to give full opportunity for all types of households to participate.<br />
For some regional markets, in some of the more outer lying areas, participants are<br />
recruited by telephone and diaries are mailed to respondents. The sample for these is<br />
designed as a random sample of population with telephones in the defined survey area.<br />
Initially, the survey area is defined in groups of SLAs/CDs as per above. These areas are<br />
then converted into telephone exchange areas as defined by Telstra. Telephone number<br />
ranges available to each exchange are then used to generate telephone numbers at<br />
random. The amount of random telephone numbers generated for each exchange are<br />
selected in proportion to the population within each exchange area.
2. SAMPLE SIZE<br />
Minimum effective target samples for each city per report period as a result of the above sample plan are:<br />
SYDNEY 2,400 individuals of 10 years of age and over.<br />
MELBOURNE 2,400 individuals of 10 years of age and over.<br />
BRISBANE 2,000 individuals of 10 years of age and over.<br />
ADELAIDE 1,750 individuals of 10 years of age and over.<br />
PERTH 1,850 individuals of 10 years of age and over.<br />
NEWCASTLE 1,500 individuals of 10 years of age and over<br />
CANBERRA 1,100 individuals of 10 years of age and over<br />
GOLD COAST/TWEED 1,500 individuals of 10 years of age and over<br />
Other regional samples are determined by each markets individual requirement.<br />
3. DIARY DESIGN<br />
The <strong>Nielsen</strong> Company - <strong>2010</strong> <strong>Radio</strong> <strong>Survival</strong> <strong>Kit</strong>.<br />
Page 2 of 5<br />
A diary is used by each individual in the survey. Each diary contains adequate space for the individual to record all his or her radio listening, both at home and away from home, by<br />
placing crosses in appropriate squares for every quarter-hour of listening (eight minutes or more) 24 hours a day. Stations, quarter-hours, day and place of listening for a period of 9<br />
days commencing on a Friday record the data. The actual days processed are Sunday to Saturday.<br />
Metropolitan Markets<br />
Each diary has the quarter-hours listed along the side for each day. A set of stickers<br />
listing station names are included with each diary. Respondents are to peel of the sticker<br />
for each station listed to and place it in columns in the diary. Up to eight columns are<br />
provided for stickers in each diary. Blank stickers are available for respondents to write in<br />
any station listed to not on the pre-printed list. Additional pages are provided in the diary<br />
to record listening if more than 8 stations are listened to.<br />
There is also provision in the diaries to indicate the device used to listen (AM/FM radio,<br />
Internet and digital radio).<br />
Regional Markets<br />
Stations are pre-listed in the diary across the top and bottom of each page and quarterhours<br />
are listed down the side. Stations are listed in descending order of frequency in half<br />
of the diaries and in ascending order of frequency on the other half. This minimises any<br />
"order of listing" bias. Two additional columns are included in each diary for recording<br />
listening to any other stations (FM & AM) not listed in the diary. Respondents are asked<br />
to write in the call signs of such stations.<br />
In order to improve the recording of all listening, a reminder appears on each diary page to record all listening which takes place away from home as well as in the home.<br />
4. DIARY PLACEMENT<br />
Diary placements are made personally by specially selected and trained interviewers who are supervised by permanent Field Supervisors.<br />
Metropolitan Markets<br />
One diary is left with ONE person only aged 10 years and over in each sampled<br />
household. This person is selected by using the last birthday method (ie. the person in<br />
the home who had the last birthday). In the diary placement, the interviewer personally<br />
demonstrates how the diary should be completed (a demonstration page is included in<br />
each diary). When the diaries are placed, the interviewers explain that they will be calling<br />
personally to collect the completed diary at the end of the survey.<br />
Regional markets<br />
One diary is left for EACH person aged 10 years and over in each sampled household. In<br />
the diary placement, the interviewer personally demonstrates how the diary should be<br />
completed (a demonstration page is included in each diary). A pre-printed demonstration<br />
page is also left with respondents. When the diaries are placed, the interviewers explain<br />
that they will be calling personally to collect the completed diary at the end of the survey.
The <strong>Nielsen</strong> Company - <strong>2010</strong> <strong>Radio</strong> <strong>Survival</strong> <strong>Kit</strong>.<br />
Page 3 of 5<br />
All calls to establish contact are made on Thursday, Friday and Saturday, with the time rotated between day, night and Saturday according to an established procedure. Each<br />
interviewer works through his/her list of areas in a different order to the previous week. In this way the timing of calls on any one home alters from week to week to increase the contact<br />
rate.<br />
People accepting diaries receive a leaflet explaining the purpose of the survey and the importance of accurate recording of listening. In Regional markets, people not at home when<br />
diaries are accepted by their families are reassured through the card that the project is legitimate and worthwhile and that confidentiality is assured.<br />
People temporarily declining also receive a leaflet that explains the importance of the ratings survey. These households are contacted again in the following survey periods in attempts<br />
to obtain participation. Unattended homes are also left the leaflet so that when the interviewer calls again the household members are better prepared to accept diaries.<br />
Homes not contacted on previous calls are called on again to obtain their participation before calls are made on any different new addresses elsewhere in the collector's district. Each<br />
designated dwelling is thus called on up to three different times over several weeks in an attempt to establish contact and obtain participation. Of these three calls at least one of these<br />
calls should be on a Thursday or Friday before 5:00pm, after 5:00pm; or anytime on a Saturday.<br />
Special procedures are used on retirement villages and security flats where access to potential respondents is sometimes difficult.<br />
Relevant classification information for all household members is collected personally at the diary placement interview. Show Cards are shown to respondents to facilitate replies to the<br />
age and occupation questions. The <strong>Nielsen</strong> interview record forms are designed both to assist the interviewer in following the various procedures and to enable thorough supervision<br />
and auditing of fieldwork.<br />
5. MID-WEEK CHECK CALL<br />
In regional markets where some areas are recruited by telephone, relevant classification<br />
information for all respondents is collected over the phone by trained field interviewing<br />
staff and then diaries are mailed to respondents, who then return them in post paid<br />
envelopes at the completion of the diary week.<br />
A mandatory phone call is made on participating households on Tuesday or Wednesday during the week that the diaries are being kept. The purpose of this mid-week call is to ensure<br />
that the respondents in the household are participating in the survey and during this call the interviewer can offer any assistance to the household in regards to the completion of the<br />
diaries.<br />
6. DIARY COLLECTION<br />
Completed diaries are collected on the Sunday following the end of each survey week. Participating households are advised in advance of the intended timing of this call.<br />
Interviewers call personally to collect the diaries from respondent homes. An additional purpose of the collection call is to check the recording in diaries with diary owners to verify any<br />
recordings that may not be clear. Up to two personal calls are made (with a three hour time lapse in between) in an effort to collect all the diaries. State field Supervisors or appointed<br />
trained Media Clerical Support validate many of the completed diaries by telephone and personal calls in accordance with the Industry Quality Assurance Standards.<br />
Interviewers use "calling cards" when they make collection calls when no one is at home, and leave prepaid return envelopes at such addresses if they are not going to make another<br />
personal collection call. A "thank you" card is left at addresses where diaries are collected from meter boxes, under mats etc. if no one is at home. In addition, during the each week of<br />
a survey, when interviewers leave a reply-paid envelope, they will also telephone the homes concerned to impress on them the need for a prompt return of diaries.
Over all cities surveyed, an average of 83% of diaries that are placed are returned useable and entered into the computer to comprise the sample.<br />
The <strong>Nielsen</strong> Company - <strong>2010</strong> <strong>Radio</strong> <strong>Survival</strong> <strong>Kit</strong>.<br />
Page 4 of 5<br />
Whilst the survey method used is loosely called the "diary method", it should more correctly be called the "diary/personal interview method" since diaries are placed and collected<br />
personally in contrast to diary methods used in other parts of the world where diaries are posted to respondents.<br />
7. DATA PREPARATION<br />
After completed diaries are returned to our Sydney office, they are subject to editing by a separate staff of experienced editors, quite independent of field interviewers or data<br />
preparation personnel. In-office editing procedures aim to check the consistency of diary records and to validate the consistency of station identification.<br />
8. COMPUTING<br />
After the in-office editing process, all records are transferred directly into the computer using equipment in our Sydney office. All batch computer runs for reports are conducted on our<br />
in-house computer in Sydney.<br />
9. RAISING FACTORS<br />
Population details for each market are entered into the computer at the start of each year and as each survey is processed, details of the sample composition are also entered into the<br />
computer. By dividing each population figure by its corresponding sample size, the computer calculates raising factors for each age/sex group and for each grocery buyer group. This<br />
means that each person is given a separate "weight" in order to ensure his or her true importance in all projected results as shown in this report. Thus if one particular group is undersampled,<br />
each person in it is given a higher weighting: or if a group is over-sampled, each person is given a lower weighting. All projected results in this report are shown to the<br />
nearest 1,000 persons in Sydney, Melbourne, Brisbane, Adelaide, Perth and Newcastle (nearest 100 persons elsewhere).<br />
10. SPECIFICATIONS<br />
The specifications of this survey meet the requirements of an Industry Committee comprising representatives of Commercial <strong>Radio</strong> Australia Ltd and by invitation, the Australian<br />
Broadcasting Corporation.<br />
<strong>Radio</strong> surveys are audited by an independent auditor (appointed by Commercial <strong>Radio</strong> Australia.) who has free and unrestricted access to all field documents and office procedures.<br />
Details of the Auditor's reports are available upon request to Commercial <strong>Radio</strong> Australia Ltd.<br />
11. ERRORS, OMISSIONS etc.<br />
Each report is issued subject to any errors and omissions. Although every reasonable precaution has been taken to present accurate information, it is possible that there may be some<br />
inaccuracies, such as faulty designation of programmes. In these cases-<br />
As listeners provide the information about the stations to which they listen and the times they listen, and<br />
As the stations provide details of the programmes and their days and times of broadcast, a programme incorrectly listed has no bearing on the validity of the figures in the report.
12. GROCERY BUYERS<br />
The <strong>Nielsen</strong> Company - <strong>2010</strong> <strong>Radio</strong> <strong>Survival</strong> <strong>Kit</strong>.<br />
Page 5 of 5<br />
Grocery Buyers in this report are defined as follows: One person in each home sampled has been classified as the person responsible for most of the grocery shopping. This person<br />
is the household member who has responsibility for deciding what is purchased. A person who is responsible for grocery shopping who is working, for the purpose of the survey, is a<br />
person who has paid or unpaid employment on a full, part-time, or limited basis during the week prior to interview.<br />
13. AUDIENCES BY QUARTER HOURS - IMPORTANT NOTES<br />
As the figures shown in the report are WEEKLY AVERAGES, care must be exercised when considering audience figures for any quarter hours during which a station has been both on<br />
and off the air over all weeks of the survey period. To calculate the actual average station audience for any quarter hour concerned, the figures in the report should be adjusted as<br />
follows:<br />
(a) Suppose "Station A" had broadcast between 6:00-6:15 am for only ONE week of a ten week survey. Because the computer would divide the total ten-week results by ten to<br />
obtain a weekly average, the 6:00-6:15 am audience figure shown for "Station A" will represent approximately one-tenth of the actual audience reached in the one week<br />
concerned. An appropriate adjustment should therefore be made.<br />
(b) Suppose "Station B" had broadcast between 11:30-11:45 pm for only five of the ten weeks of the survey. The 11:30-11:45 pm audience figures shown for "Station B" will<br />
represent approximately 5/10th (one half) of the actual average audience. An appropriate adjustment should therefore be made.<br />
The formula for adjusting any quarter-hour affected is:<br />
Audience as per report multiplied by the number of weeks in survey divided by the number of weeks the station transmitted.
Commercial <strong>Radio</strong> Australia Ltd<br />
ABN 52 059 731 467<br />
Level 5<br />
88 Foveaux Street<br />
Surry Hills NSW <strong>2010</strong><br />
Sydney Australia<br />
T: 02 9281 6577<br />
F: 02 9281 6599<br />
I: digitalradioplus.com.au<br />
radio stations<br />
on digital
Sydney<br />
Melbourne<br />
Brisbane<br />
Adelaide<br />
Perth<br />
ABC – National<br />
SBS – National<br />
Look out for new stations starting soon<br />
December 2009
Digital <strong>Radio</strong><br />
Frequently Asked Questions<br />
Q: When did digital radio become available<br />
in Australia?<br />
All commercial and public service broadcasters are now<br />
broadcasting in high power in the 5 launch cities. Australian<br />
commercial digital radio services switched-on progressively<br />
in May and June 2009 in Sydney, Melbourne, Brisbane, Perth<br />
and Adelaide. The public service broadcasters switched on 1<br />
July 2009.<br />
Q: Will I be able to receive digital radio?<br />
Type your postcode into the search function on<br />
digitalradioplus.com.au or sms your postcode to 0409377587.<br />
Q: Will digital radio cost listeners anything?<br />
No. Listeners simply have to buy a new digital radio to listen to<br />
digital radio with products priced from around $89. There are<br />
no other costs – no subscription fees, no messing about with<br />
signing up, just tune in.<br />
Q: What extra features will digital radio<br />
provide?<br />
Digital radio will provide new stations – see a full listing on<br />
the next page. Digital radio also means you can listen to your<br />
existing favourite radio stations but with digital sound quality.<br />
There are many advantages to digital radio – it will provide<br />
better reception, more details about advertised products,<br />
discussion topics, news items, sports and racing via text,<br />
graphics, pictures and animation. Features like pause and<br />
rewind will be available on some digital receivers, and, you<br />
can tune by station name, not frequency, making it easy to<br />
find your favourite stations.<br />
Q: What radio receivers are available?<br />
To listen to digital radio, consumers need a new receiver.<br />
Digital radios come in all shapes and sizes, including MP3<br />
devices, hi fi systems, portable players and clock radios.<br />
PC adaptors, which plug into a computer and allow receiver<br />
functions to be controlled from the computer screen, will also<br />
be available. In-car adaptors are available and going forward<br />
there are likely to be adaptor kits for mobile phones and<br />
maybe even iPods.<br />
Q: When I first turned on my digital radio I<br />
couldn’t hear all my favourite stations.<br />
When you first switch on your digital radio and when a new<br />
digital radio station is launched, listeners need to simply<br />
press the “full scan” or “auto tune” button on your new digital<br />
radio so that all the stations in your area can be stored in the<br />
memory of the radio. For more information refer to your radio<br />
user guide or check the www.digitalradioplus.com.au website.<br />
Q: Where can I buy a new DAB+ radio?<br />
Over 600 stores throughout Sydney, Melbourne, Brisbane,<br />
Adelaide and Perth are stocking digital radios. Go to<br />
digitalradioplus.com.au for a full listing of retailers.<br />
Q: How much will a DAB+ radio cost?<br />
Like any product range, digital radio prices vary depending<br />
on the features and capabilities. Entry-level receivers (with<br />
scrolling text) start from around $89 and receivers with all<br />
capabilities start at around $299.<br />
Q: Who makes DAB+ digital radios?<br />
Pure, Roberts, Sangean, Bush, Revo, Grundig, Teac, Yamaha<br />
and iRiver are just some of the manufacturers making DAB+<br />
digital radios. Other manufacturers are developing further<br />
products. Check the website for a list of digital radios available.<br />
Q: Will AM and FM radio be switched off?<br />
There are no plans at this stage to switch off AM and FM<br />
radio services. As there is an estimated five radio devices per<br />
home, listeners must be given time to change over all of their<br />
radio devices before any discussion of switch off of analogue<br />
services. In addition, planning needs to continue for the<br />
switch on of digital services to the rest of Australia outside of<br />
the five launch cities.<br />
Q: Can I receive AM and FM on my new<br />
digital radio?<br />
Digital radios will come in a range of different models. To<br />
ensure your radio receives digital radio services in Australia<br />
it must be DAB+ enabled. Some DAB+ radios will also receive<br />
FM. However you’ll be able to hear your favourite AM and FM<br />
stations simulcast on DAB+. Look for the DAB+ enabled logo<br />
on the product pack or in store.
Q: I sometimes get crackling on my AM<br />
signal will this happen with digital radio?<br />
Digital radio provides interference free, digital quality sound<br />
and your radio will find the best signal in your area rather than<br />
you messing around with tuning the dial.<br />
Q: When will I be able to receive digital<br />
radio in other areas outside Sydney,<br />
Melbourne, Brisbane, Adelaide and Perth?<br />
Commercial <strong>Radio</strong> Australia (CRA) has already started<br />
planning the digital radio rollout in other areas throughout<br />
Australia. CRA is working on a regional trial of digital radio.<br />
CRA is calling on the Federal Government to allocate VHF<br />
Band III spectrum in regional areas for the rollout of digital<br />
radio services across Australia so regional broadcasters<br />
can start real planning. It is hoped that a regional trial will be<br />
announced soon.<br />
Q: Is digital radio the same as internet radio?<br />
No, digital radio is broadcast free to air over the airwaves via<br />
DAB+ technology. Internet-only radio services are streamed<br />
over the telecommunications networks and incur a download<br />
cost which varies depending on the internet service provider<br />
package. Free to air broadcast radio stations will also stream<br />
their current radio stations plus any new digital services on<br />
the internet as well as broadcasting, so the content can be<br />
accessed on both platforms.<br />
Q: Can I receive digital radio through my<br />
digital TV set top box?<br />
Currently we are unaware of a digital TV set top box that will<br />
receive DAB+. However, we have been advised that a number<br />
of manufacturers are currently working on integrating DAB+<br />
into a digital TV set top box. As new DAB+ products become<br />
available they will be featured on the www.digitalradioplus.<br />
com.au website.<br />
Q: How do I receive digital radio in my car?<br />
You can buy a digital radio adaptor for your car that is simply<br />
placed in the vehicle like a satellite navigation device and<br />
receives all your favourite stations plus the new DAB+ only<br />
stations. Plus you may also be able to link your portable<br />
DAB+ receiver via Bluetooth in your car or through a car<br />
navigation system.<br />
Commercial <strong>Radio</strong> Australia (CRA) is continuing to work with<br />
the car industry to have DAB+ digital radios in cars. CRA is<br />
working with manufacturers to encourage them to include a<br />
DAB+ solution standard into car navigation systems. Other<br />
receiver manufacturers CRA has spoken with are working on<br />
after-car market options.<br />
Information about any of these topics can<br />
be found at digitalradioplus.com.au<br />
Q: How are you telling listeners about<br />
digital radio?<br />
An extensive advertising campaign is underway in Sydney,<br />
Melbourne, Brisbane, Adelaide and Perth, promoting the<br />
benefits of digital radio for listeners. The $10 million campaign<br />
aims to raise awareness of digital radio as well as the website:<br />
www.digitalradioplus.com.au which contains extensive<br />
information about digital radio. The campaign will continue in<br />
<strong>2010</strong>. We are also working with retailers, manufacturers and<br />
broadcasters to help promote new stations, products and<br />
services as they are launched.<br />
Q: What should I look for when purchasing<br />
a digital radio to ensure it will work in<br />
Australia?<br />
Only DAB+ radios will receive digital radio in Australia. When<br />
buying a new digital radio look for the DAB+ enabled logo.<br />
Commercial and Public Broadcaster<br />
Stations on Digital in 2009<br />
Sydney – 2GB, 2CH, 2UE, 2DAY, TRIPLE M, 2KY, WS-FM,<br />
MIX 106.5, 2SM, NOVA, VEGA, ABC & SBS stations – including<br />
ABC <strong>Radio</strong> National, Triple J, Classic FM, News <strong>Radio</strong>, Local<br />
<strong>Radio</strong>. Hot30 Jelli, Radar, NovaNation, Koffee, WSFM Plus,<br />
Gorilla and The EDGE.<br />
Melbourne – MIX, GOLD, SEN, 3AW, 3MP, FOX, MAGIC,<br />
TRIPLE M, NOVA, VEGA, Sport 927, ABC & SBS stations –<br />
including ABC <strong>Radio</strong> National, Triple J, Classic FM, News<br />
<strong>Radio</strong>, Local <strong>Radio</strong>. Hot30 Jelli, Radar, GOLD Plus, NovaNation,<br />
Koffee, and The EDGE.<br />
Brisbane – 4BC, 4BH, 4KQ, B105, TRIPLE M, NOVA, RADIO<br />
TAB, 97.3 FM, ABC & SBS stations – including ABC <strong>Radio</strong><br />
National, Triple J, Classic FM, News <strong>Radio</strong>, Local <strong>Radio</strong>. Hot30<br />
Jelli, Radar, NovaNation, 4KQ Plus and The EDGE.<br />
Adelaide – 5AA, MIX, SA-FM, TRIPLE M, NOVA, CRUISE,<br />
ABC & SBS stations – including ABC <strong>Radio</strong> National, Triple<br />
J, Classic FM, News <strong>Radio</strong>, Local <strong>Radio</strong>. Hot30 Jelli, Radar,<br />
NovaNation, Koffee, Mix Plus and The EDGE.<br />
Perth – 6IX, 6PR, 96 FM, MIX, 92.9FM, NOVA, ABC & SBS<br />
stations – including ABC <strong>Radio</strong> National, Triple J, Classic FM,<br />
News <strong>Radio</strong>, Local <strong>Radio</strong>. Hot30 Jelli, Radar, MyPerth Digital,<br />
Hot Country and NovaNation.
COMMERCIAL RADIO AUSTRALIA LIMITED<br />
Audience Survey Guidelines and Requirements<br />
Commercial <strong>Radio</strong> Australia Limited Endorsed Surveys<br />
The Code of Ethics and General Survey Standards are guidelines developed to safeguard<br />
the integrity of the radio survey process.<br />
Commercial <strong>Radio</strong> Australia Limited recommends that members adhere to the Code of<br />
Ethics and adopt the Survey Standards to facilitate the provision of timely and valid<br />
comparative information to advertisers and advertising agencies. This, in turn, promotes<br />
effective competition within the radio industry and between radio and other forms of media.<br />
It also promotes commercial radio as a reliable advertising medium.<br />
The benefits to members of adherence to the Code of Ethics and Survey Standards are:<br />
recognition by advertisers and agencies that the commercial radio industry values the<br />
credibility of its information base; and<br />
acceptance of the veracity of the results by advertisers and agencies.<br />
Members should note that the Code of Ethics is largely a statement of the law relating to<br />
misleading and deceptive conduct and misleading statements. Subsequently, a breach of<br />
certain provisions of the Code of Ethics may, in some circumstances, expose members to<br />
action by a third party or regulator under the law relating to such matters.<br />
Where members are in dispute about a matter involving an audience survey, Commercial<br />
<strong>Radio</strong> Australia offers the services of experts to reach a resolution. This service is offered<br />
as an alternative to costly, and often protracted litigation, between members. Compliance<br />
with mediation is voluntary.<br />
The Code of Ethics applies to ALL members of Commercial <strong>Radio</strong> Australia in ALL areas of<br />
Australia regardless of whether members participate in a survey.<br />
___________________________________________________________________<br />
Code of Ethics Relating to Use of Survey Information<br />
All commercial broadcasters have a legal obligation not to engage in misleading and<br />
deceptive conduct. Conduct can be misleading or deceptive despite an absence of intention<br />
to mislead or deceive. Care must be taken when using any survey material to ensure that it<br />
is not used in a misleading or deceptive way. By way of example, conduct can be misleading<br />
or deceptive where survey material is:<br />
a) not accurately presented;<br />
b) is presented selectively;<br />
c) is quoted out of context; or<br />
d) is out of date.
Strict adherence to the specific guidelines set out below will ensure that members do not<br />
engage in misleading or deceptive conduct:<br />
(i) Quotations of research information, and conclusions drawn therefrom, should be<br />
truthful and should not mislead either by implication or by omission.<br />
(ii) In order to avoid any possibility of being misleading, all published matter should<br />
include a clear and understandable description of the area surveyed, the survey<br />
period (date or number or season and year), the type of survey (eg. Diary), the<br />
session(s) or time period(s) to which the figures relate and the appropriate<br />
description of the figures quoted (Cumes, Averages or Shares of either total or<br />
commercial audience).<br />
Example: Population Spread by SLA<br />
Statistical Local Area Total Persons* Planned<br />
No. % Sample<br />
Wollongong (C) 195,722 69.8% 698<br />
Kiama (A) 20,129 7.2% 72<br />
Shellharbour (A) 64,322 23.0% 230<br />
280,173 100.0% 1,000<br />
* 2007 Estimated Resident Population<br />
(iii) Estimates, such as estimated reach and frequency, should be clearly identified as<br />
estimates only and not represented as established fact.<br />
(iv) Quotations from surveys, including statistics and other research information relating<br />
to a station's audience, should only be published if they are from an audience survey<br />
released within the time frames below and adhere to the research codes of ethics of<br />
the Australian Market & Social Research Society (AMSRS).<br />
Metropolitan Markets Provincial Markets Country Markets<br />
Current survey<br />
(other than for trending and<br />
comparative purposes)<br />
Not more than 2 years<br />
old<br />
Not more than 3<br />
years old<br />
If a new station goes to air in a market, existing surveys should be used for no longer<br />
than six months following the new station's introduction.<br />
(v) The name of the Research Company or organisation which undertook the research<br />
should be stated.<br />
(vi) Members should not make direct or oblique on-air reference to, or in any way directly<br />
attempt to encourage the audience to respond in a particular manner to a survey that<br />
is being conducted in the licence area in which the station operates, either<br />
immediately before or during the period of the survey. This applies to all member<br />
stations regardless of financial participation in the survey.<br />
(vii) This code applies to all broadcast, published, printed or duplicated matter, including<br />
advertisements, brochures, pamphlets, submissions, or circulated letters produced<br />
by or on behalf of the member.<br />
N.B: This is only a summary; you should refer to the full version of the Code, which is found in Part A of the <strong>Radio</strong> Audience<br />
Survey Guidelines<br />
For further information on the Code of Ethics relating to the use of Survey Information or a<br />
copy of the Audience Survey Guidelines (January <strong>2010</strong>) please contact Commercial <strong>Radio</strong><br />
Australia on (02) 9281 6577. A PDF copy of the Guidelines can be downloaded from the<br />
Commercial <strong>Radio</strong> website: www.commercialradio.com.au
The <strong>Nielsen</strong> Company<br />
PRESS & INTERNET POLICY<br />
As a result of many requests for access to publish the <strong>Radio</strong> <strong>Ratings</strong> prepared by The<br />
<strong>Nielsen</strong> Company, we would like to outline the current policy to avoid any misunderstanding<br />
about the use and status of that material.<br />
1. The <strong>Radio</strong> <strong>Ratings</strong> prepared by The <strong>Nielsen</strong> Company:<br />
• is confidential information belonging to Commercial <strong>Radio</strong> Australia Limited and The<br />
<strong>Nielsen</strong> Company;<br />
• must only be obtained by subscription from The <strong>Nielsen</strong> Company;<br />
• must not be passed to third parties without written consent from The <strong>Nielsen</strong> Company and<br />
• must be kept confidential.<br />
2. The <strong>Nielsen</strong> Company’s policy is to permit supply by its subscribers to the media of limited<br />
amounts of the <strong>Radio</strong> <strong>Ratings</strong> data for publicity and news purposes. In this context,<br />
‘limited amount’ means an amount that, if published, would not or would be unlikely to<br />
result in any loss of custom to The <strong>Nielsen</strong> Company.<br />
3. In practice, The <strong>Nielsen</strong> Company accepts the supply or publication of:<br />
• The <strong>Radio</strong> <strong>Ratings</strong> in narrative form to support statements or conclusions made in the<br />
course of a story, sales brochure or sales pitch;<br />
• The top line radio Share, Average audience and Cumulative audience figures in each<br />
capital city or regional markets for the standard sessions and demographics:-<br />
The <strong>Nielsen</strong> Company – <strong>2010</strong> <strong>Radio</strong> <strong>Survival</strong> <strong>Kit</strong>.<br />
• Monday - Sunday 5:30am-12mn<br />
• Monday - Friday 5:30am-12mn<br />
• Monday - Friday 5:30am-9am<br />
• Monday - Friday 9am-12md<br />
• Monday - Friday 12md - 4pm<br />
• Monday - Friday 4pm - 7pm<br />
• Monday - Friday 7pm - 12mn<br />
• Saturday & Sunday 5:30am-12mn<br />
• People 10+<br />
• People 10-17<br />
• People 18-24<br />
• People 25-39<br />
• People 40-54<br />
• People 55+<br />
• <strong>Radio</strong> <strong>Ratings</strong> information or data pertaining to OTHER AM, OTHER FM and OTHER<br />
DIGITAL is not to be published.<br />
4. Any supply by subscribers or publication by media of the <strong>Radio</strong> <strong>Ratings</strong> data beyond the<br />
above will breach The <strong>Nielsen</strong> Company and Commercial <strong>Radio</strong> Australia’s rights in<br />
respect of its confidential information.<br />
5. The <strong>Nielsen</strong> Company may discontinue supply to subscribers who provide <strong>Radio</strong> <strong>Ratings</strong><br />
to third parties without authorisation and may commence legal proceedings against<br />
unauthorised recipients of the <strong>Radio</strong> <strong>Ratings</strong> data.<br />
If the <strong>Radio</strong> <strong>Ratings</strong> are used in line with this Press and Internet policy the source:-<br />
‘The <strong>Nielsen</strong> Company <strong>Radio</strong> <strong>Ratings</strong>’ or “The <strong>Nielsen</strong> Company’ must be used in<br />
conjunction with the data release.
COMMERCIAL RADIO STATIONS <strong>2010</strong><br />
Copyright Commercial <strong>Radio</strong> Australia <strong>2010</strong><br />
JANUARY <strong>2010</strong><br />
All<br />
analogue<br />
stations<br />
in<br />
Sydney,<br />
Melbourne,<br />
Brisbane,<br />
Adelaide<br />
and<br />
Perth<br />
can<br />
now<br />
be<br />
heard<br />
on<br />
DAB+<br />
Digital<br />
<strong>Radio</strong>,<br />
as<br />
well<br />
as<br />
a whole<br />
range<br />
of<br />
new<br />
stations.<br />
Find<br />
out<br />
more<br />
@ www.<br />
digitalradioplus.<br />
com.<br />
au.<br />
All analogue stations in Sydney, Melbourne, Brisbane, Adelaide and Perth can now be heard on DAB+ Digital <strong>Radio</strong>, as well as a whole range of new stations. Find out more @ www.digitalradioplus.com.au.