2012 Radio Survival Kit Contents - Nielsen
2012 Radio Survival Kit Contents - Nielsen
2012 Radio Survival Kit Contents - Nielsen

You also want an ePaper? Increase the reach of your titles
YUMPU automatically turns print PDFs into web optimized ePapers that Google loves.
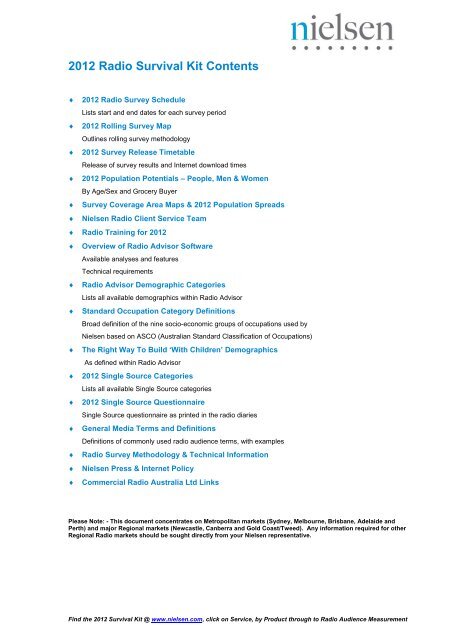
<strong>2012</strong> <strong>Radio</strong> <strong>Survival</strong> <strong>Kit</strong> <strong>Contents</strong><br />
♦ <strong>2012</strong> <strong>Radio</strong> Survey Schedule<br />
Lists start and end dates for each survey period<br />
♦ <strong>2012</strong> Rolling Survey Map<br />
Outlines rolling survey methodology<br />
♦ <strong>2012</strong> Survey Release Timetable<br />
Release of survey results and Internet download times<br />
♦ <strong>2012</strong> Population Potentials – People, Men & Women<br />
By Age/Sex and Grocery Buyer<br />
♦ Survey Coverage Area Maps & <strong>2012</strong> Population Spreads<br />
♦ <strong>Nielsen</strong> <strong>Radio</strong> Client Service Team<br />
♦ <strong>Radio</strong> Training for <strong>2012</strong><br />
♦ Overview of <strong>Radio</strong> Advisor Software<br />
Available analyses and features<br />
Technical requirements<br />
♦ <strong>Radio</strong> Advisor Demographic Categories<br />
Lists all available demographics within <strong>Radio</strong> Advisor<br />
♦ Standard Occupation Category Definitions<br />
Broad definition of the nine socio-economic groups of occupations used by<br />
<strong>Nielsen</strong> based on ASCO (Australian Standard Classification of Occupations)<br />
♦ The Right Way To Build ‘With Children’ Demographics<br />
As defined within <strong>Radio</strong> Advisor<br />
♦ <strong>2012</strong> Single Source Categories<br />
Lists all available Single Source categories<br />
♦ <strong>2012</strong> Single Source Questionnaire<br />
Single Source questionnaire as printed in the radio diaries<br />
♦ General Media Terms and Definitions<br />
Definitions of commonly used radio audience terms, with examples<br />
♦ <strong>Radio</strong> Survey Methodology & Technical Information<br />
♦ <strong>Nielsen</strong> Press & Internet Policy<br />
♦ Commercial <strong>Radio</strong> Australia Ltd Links<br />
Please Note: - This document concentrates on Metropolitan markets (Sydney, Melbourne, Brisbane, Adelaide and<br />
Perth) and major Regional markets (Newcastle, Canberra and Gold Coast/Tweed). Any information required for other<br />
Regional <strong>Radio</strong> markets should be sought directly from your <strong>Nielsen</strong> representative.<br />
Find the <strong>2012</strong> <strong>Survival</strong> <strong>Kit</strong> @ www.nielsen.com, click on Service, by Product through to <strong>Radio</strong> Audience Measurement
WEEK NO<br />
Survey Weeks<br />
Sunday-Saturday<br />
Sunday‐Saturday<br />
01 Jan 1 Jan 7<br />
02 8 14<br />
03 15 21<br />
04 22 28<br />
05 29 Feb 4<br />
06 Feb 5 11<br />
07 12 18<br />
08 19 25<br />
09 26 Mar 3<br />
10 Mar 4 10<br />
11 11 17<br />
12 18 24 Rel: Apr 4<br />
13 25 31 Rel: Apr 4<br />
14 Apr 1 Apr 7<br />
15 8 14<br />
SYDNEY<br />
SYDNEY<br />
MELBOURNE<br />
2005 <strong>2012</strong> <strong>Radio</strong> Survey Schedule<br />
16 15 21 Central<br />
17 22 28 Coast NSW<br />
18 29 May 5<br />
19 May 6 12<br />
20 13 19<br />
21 20 26<br />
22 27 Jun 2<br />
23 Jun 3 9<br />
24 10 16 Rel: Jun 20<br />
25 17 23<br />
26 24 30<br />
27 Jul 1 Jul 7<br />
28 8 14<br />
29 15 21<br />
30 22 28<br />
31 29 Aug 4<br />
32 Aug 5 11<br />
33 12 18<br />
34 19 25<br />
35 26 Sep 1 Rel: Sep 12<br />
36 Sep 2 8<br />
37 9 15<br />
38 16 22<br />
39 23 29<br />
40 30 Oct 6<br />
41 Oct 7 13<br />
42 14 20<br />
43 21 27<br />
44 28 Nov 3<br />
45 Nov 4 10<br />
46 11 17<br />
47 18 24<br />
48 25 Dec 1<br />
49 Dec 2 8<br />
50 9 15<br />
51 16 22<br />
52 23 29<br />
NOTE:<br />
Some Survey dates may be subject to change. Subscribers will be advised of any changes to<br />
the above schedule.<br />
Survey dates for major regional markets are yet to be determined. They will be added to this<br />
schedule after they have been determined.<br />
MELBOURNE<br />
BRISBANE<br />
BRISBANE<br />
ADELAIDE<br />
ADELAIDE<br />
PERTH<br />
PERTH<br />
NEWCASTLE<br />
NEWCASTLE<br />
CANBERRA<br />
CANBERRA<br />
GOLD<br />
COAST/TWEED<br />
WOLLONGONG<br />
EASTER April 6‐9<br />
WOLLONGONG<br />
CAMPBELLTOWN<br />
EASTER<br />
GOLD COAST<br />
OTHER<br />
REGIONAL<br />
as at 1 Mar <strong>2012</strong><br />
OTHER<br />
REGIONAL<br />
OTHER<br />
REGIONAL<br />
Metropolitan Release Dates:<br />
Survey #1 ‐ Thu, Feb 23<br />
Survey #2 ‐ Tue, Mar 27<br />
Survey #3 ‐ Tue, May 8<br />
Survey #4 ‐ Tue, Jun 19<br />
Survey #5 ‐ Tue, Aug 7<br />
Survey #6 ‐ Tue, Sep 11<br />
Survey #7 ‐ Tue, Oct 30<br />
Survey #8 ‐ Tue, Dec 11<br />
School Holidays<br />
Part School Hols.
<strong>2012</strong> Reporting Periods for<br />
Rolling Surveyed Markets<br />
SYDNEY, MELBOURNE, BRISBANE, ADELAIDE, PERTH<br />
SURVEY No. REPORTING PERIODS RELEASE DATE<br />
1 Jan 15 to Feb 11 Thu February 23<br />
2 Jan 29 to Mar 17 Tue March 27<br />
3 Feb 12 to Mar 17 and Mar 25 to Apr 28 Tue May 8<br />
4 Mar 25 to Apr 28 and May 6 to Jun 9 Tue June 19<br />
5 May 6 to Jun 9 and Jun 24 to Jul 28 Tue August 7<br />
6 Jun 24 to Sep 1 Tue September 11<br />
7 Jul 29 to Sep 1 and Sep 16 to Oct 20 Tue October 30<br />
8 Sep 16 to Oct 20 and Oct 28 to Dec 1 Tue December 11<br />
NEWCASTLE<br />
SURVEY No. REPORTING PERIODS RELEASE DATE<br />
1 Jan 15 to Apr 14 ** Fri April 20<br />
2 2nd half of #1 & Apr 22 to Jul 21 ** Fri July 27<br />
3 Apr 22 to Jul 21 & Jul 29 to Oct 27 Fri November 2<br />
GOLD COAST/TWEED<br />
SURVEY No. REPORTING PERIODS RELEASE DATE<br />
1 Jan 22 to Apr 14 ** Fri April 27<br />
2 2nd half of #1 & Apr 29 to Jul 21 ** Thu August 2<br />
3 Apr 29 to Jul 21 & Aug 5 to Oct 27 ** Thu November 8<br />
** ‘Blind’ Surveys (Newcastle and Gold Coast/Tweed - Waves 1, 2 & 3)<br />
Rather than a fixed two-week period, where the sample is placed evenly across 2 or more weeks, the blind survey concept<br />
utilises a 3-month (12-13 week) period.<br />
The sample is placed evenly over a minimum of eight of the twelve or thirteen weeks within the period, and a relatively even<br />
number of SLA’s are surveyed each week. These selected weeks need not necessarily be consecutive and would not be<br />
disclosed to the participating stations.<br />
The nature of regional radio markets will possibly lead to knowledge by the stations of when the first diaries are placed in the<br />
market. However, as the diaries will be placed over at least another seven weeks and with probably a number of non-survey<br />
weeks in the period, it would be difficult for stations to implement any promotional activity that would bear rewards of increased<br />
audience within the measured period.<br />
All other aspects of the survey would remain identical to the system used in the past.<br />
For a more detailed explanation of the ‘blind’ survey methodology, please contact your local <strong>Nielsen</strong> Media representative.
Wk<br />
No<br />
Survey Weeks<br />
Sunday-Saturday<br />
<strong>2012</strong> ROLLING SURVEY SCHEDULE<br />
Sydney, Melbourne, Brisbane, Adelaide, Perth<br />
Interviewing<br />
Weeks<br />
Survey<br />
Release<br />
Dates<br />
01 Jan 1 Jan 7<br />
02 8 14<br />
03 15 21<br />
04 22 28 Wave Report Thu<br />
05 29 Feb 4 #1 #1 Feb 23<br />
06 Feb 5 11<br />
07 12 18<br />
08 19 25 Wave Report Tue<br />
09 26 Mar 3 #2 #2 Mar 27<br />
10 Mar 4 10<br />
11 11 17<br />
12 18 24<br />
13 25 31<br />
14 Apr 1 Apr 7 Wave Report Tue<br />
15 8 14 #3 #3 May 8<br />
16 15 21<br />
17 22 28<br />
18 29 May 5<br />
19 May 6 12<br />
20 13 19 Wave Report Tue<br />
21 20 26 #4 #4 Jun 19<br />
22 27 Jun 2<br />
23 Jun 3 9<br />
24 10 16<br />
25 17 23<br />
26 24 30<br />
27 Jul 1 Jul 7 Wave Report Tue<br />
28 8 14 #5 #5 Aug 7<br />
29 15 21<br />
30 22 28<br />
31 29 Aug 4<br />
32 Aug 5 11 Wave Report Tue<br />
33 12 18 #6 #6 Sep 11<br />
34 19 25<br />
35 26 Sep 1<br />
36 Sep 2 8<br />
37 9 15<br />
38 16 22<br />
39 23 29 Wave Report Tue<br />
40 30 Oct 6 #7 #7 Oct 30<br />
41 Oct 7 13<br />
42 14 20<br />
43 21 27<br />
44 28 Nov 3<br />
45 Nov 4 10 Wave Report Tue<br />
46 11 17 #8 #8 Dec 11<br />
47 18 24<br />
48 25 Dec 1<br />
49 Dec 2 8<br />
50 9 15<br />
51 16 22<br />
52 23 29<br />
<strong>Nielsen</strong> - <strong>2012</strong> <strong>Radio</strong> <strong>Survival</strong> <strong>Kit</strong> .
<strong>2012</strong> Metropolitan <strong>Radio</strong> Survey Release<br />
Timetable for <strong>Radio</strong> Stations<br />
Below is the timetable for the data files download availability and Survey Release times for <strong>Radio</strong><br />
Stations for <strong>2012</strong><br />
Release to radio stations will be in the form of a telephone call to management with top-line results, and security password<br />
for downloaded survey data.<br />
Survey #1<br />
Data Download from<br />
Wednesday Feb 22<br />
Survey #2<br />
Data Download from<br />
Monday Mar 26<br />
Sydney Melbourne Brisbane Adelaide Perth<br />
9:00am* 9:00am*<br />
9:00am* 9:00am*<br />
9:00am*<br />
(10:00am)<br />
9:00am*<br />
(10:00am)<br />
9:00am*<br />
(9:30am)<br />
9:00am*<br />
(9:30am)<br />
9:00am*<br />
(12:00md)<br />
9:00am*<br />
(12:00md)<br />
Survey #3 (Daylight Saving ends Apr 1)<br />
Data Download from<br />
Monday May 7<br />
Survey #4<br />
Data Download from<br />
Monday Jun 18<br />
Survey #5<br />
Data Download from<br />
Monday Aug 6<br />
Survey #6<br />
Data Download from<br />
Monday Sept 10<br />
9:00am* 9:00am* 9:00am*<br />
9:00am* 9:00am* 9:00am*<br />
9:00am* 9:00am* 9:00am*<br />
9:00am* 9:00am* 9:00am*<br />
9:00am*<br />
(9:30am)<br />
9:00am*<br />
(9:30am)<br />
9:00am*<br />
(9:30am)<br />
9:00am*<br />
(9:30am)<br />
9:00am*<br />
(11:00am)<br />
9:00am*<br />
(11:00am)<br />
9:00am*<br />
(11:00am)<br />
9:00am*<br />
(11:00am)<br />
Survey #7 (Daylight Saving starts Oct 7)<br />
Data Download from<br />
Monday Oct 29<br />
Survey #8<br />
Data Download from<br />
Monday Dec 10<br />
<strong>Nielsen</strong> - <strong>2012</strong> <strong>Radio</strong> <strong>Survival</strong> <strong>Kit</strong>.<br />
Survey Release Time<br />
Thursday Feb 23<br />
Survey Release Time<br />
Tuesday Mar 27<br />
Survey Release Time<br />
Tuesday May 8<br />
Survey Release Time<br />
Tuesday Jun 19<br />
Survey Release Time<br />
Tuesday Aug 7<br />
Survey Release Time<br />
Tuesday Sept 11<br />
Survey Release Time<br />
Tuesday Oct 30<br />
Survey Release Time<br />
Tuesday Dec 11<br />
9:00am 9:00am<br />
9:00am 9:00am<br />
9:00am 9:00am<br />
9:00am* 9:00am*<br />
9:00am 9:00am<br />
9:00am* 9:00am*<br />
9:00am 9:00am<br />
8:00am<br />
(9:00am)<br />
8:00am<br />
(9:00am)<br />
9:00am<br />
9:00am 9:00am 9:00am<br />
9:00am 9:00am 9:00am<br />
9:00am 9:00am 9:00am<br />
9:00am*<br />
(10:00am)<br />
8:00am<br />
(9:00am)<br />
9:00am*<br />
(10:00am)<br />
8:00am<br />
(9:00am)<br />
8:30am<br />
(9:00am)<br />
8:30am<br />
(9:00am)<br />
8:30am<br />
(9:00am)<br />
8:30am<br />
(9:00am)<br />
8:30am<br />
(9:00am)<br />
8:30am<br />
(9:00am)<br />
9:00am*<br />
(9:30am)<br />
8:30am<br />
(9:00am)<br />
9:00am*<br />
(9:30am)<br />
8:30am<br />
(9:00am)<br />
8:00am<br />
(11:00am)<br />
8:00am<br />
(11:00am)<br />
8:00am<br />
(10:00am)<br />
8:00am<br />
(10:00am)<br />
8:00am<br />
(10:00am)<br />
8:00am<br />
(10:00am)<br />
9:00am*<br />
(12:00md)<br />
8:00am<br />
(11:00am)<br />
9:00am*<br />
(12:00dm)<br />
8:00am<br />
(11:00am)<br />
NOTE: Times shown are local (Time in brackets is EST/EDST, ie. Sydney time)<br />
* We will endevour to have data download available by the specificed time above. If this is not possible it will then be available by Midnight.<br />
Newcastle, Canberra & Gold Coast/Tweed - download 12md day prior to release. Release day: Results 10am EST/ESDT.
<strong>2012</strong> Population Potentials by Demographics<br />
SYDNEY MELBOURNE BRISBANE ADELAIDE PERTH<br />
Minimum Sample Size 2,400 2,400 2,000 1,750 1,850<br />
PEOPLE 10+ 4,098,000 3,966,000 1,820,000 1,082,000 1,556,000<br />
10-17 444,000 426,000 215,000 115,000 180,000<br />
18-24 500,000 498,000 240,000 131,000 199,000<br />
25-39 1,132,000 1,065,000 482,000 254,000 402,000<br />
40-54 947,000 919,000 423,000 251,000 370,000<br />
55-64 494,000 478,000 221,000 145,000 196,000<br />
65+ 581,000 580,000 239,000 186,000 209,000<br />
13+ 3,934,000 3,810,000 1,742,000 1,040,000 1,492,000<br />
18+ 3,654,000 3,540,000 1,605,000 967,000 1,376,000<br />
16-24 614,000 611,000 297,000 162,000 246,000<br />
25-34 779,000 729,000 326,000 172,000 275,000<br />
35-44 686,000 665,000 306,000 166,000 258,000<br />
45-59 873,000 841,000 389,000 242,000 343,000<br />
60+ 816,000 807,000 344,000 256,000 301,000<br />
MEN 10+ 2,014,000 1,952,000 894,000 527,000 780,000<br />
10-17 228,000 219,000 109,000 58,000 92,000<br />
18-24 253,000 255,000 120,000 67,000 103,000<br />
25-39 562,000 533,000 240,000 127,000 206,000<br />
40-54 468,000 452,000 209,000 123,000 186,000<br />
55+ 503,000 493,000 216,000 152,000 193,000<br />
13+ 1,930,000 1,872,000 854,000 506,000 747,000<br />
18+ 1,786,000 1,733,000 785,000 469,000 688,000<br />
16-24 312,000 313,000 149,000 83,000 127,000<br />
25-34 387,000 366,000 163,000 86,000 142,000<br />
35-44 340,000 329,000 152,000 82,000 131,000<br />
45-59 429,000 412,000 191,000 118,000 170,000<br />
60+ 377,000 371,000 159,000 116,000 142,000<br />
WOMEN 10+ 2,084,000 2,014,000 926,000 555,000 776,000<br />
10-17 216,000 207,000 106,000 57,000 88,000<br />
18-24 247,000 243,000 120,000 64,000 96,000<br />
25-39 570,000 532,000 242,000 127,000 196,000<br />
40-54 479,000 467,000 214,000 128,000 184,000<br />
55+ 572,000 565,000 244,000 179,000 212,000<br />
13+ 2,004,000 1,938,000 888,000 534,000 745,000<br />
18+ 1,868,000 1,807,000 820,000 498,000 688,000<br />
16-24 302,000 298,000 148,000 79,000 119,000<br />
25-34 392,000 363,000 163,000 86,000 133,000<br />
35-44 346,000 336,000 154,000 84,000 127,000<br />
45-59 444,000 429,000 198,000 124,000 173,000<br />
60+ 439,000 436,000 185,000 140,000 159,000<br />
<strong>Nielsen</strong> - <strong>2012</strong> <strong>Radio</strong> <strong>Survival</strong> <strong>Kit</strong>.
<strong>2012</strong> Population Potentials by Demographics<br />
SYDNEY<br />
Minimum Sample Size 2,400 2,400 2,000 1,750 1,850<br />
GROCERY BUYERS<br />
All 1,784,000 1,768,000 807,000 514,000 717,000<br />
Working 993,000 971,000 449,000 275,000 402,000<br />
Non-Working 791,000 797,000 358,000 239,000 315,000<br />
With Teens/Children 548,000 509,000 250,000 136,000 229,000<br />
With Children 0-9 384,000 348,000 174,000 92,000 152,000<br />
With Children 10-17 164,000 160,000 76,000 44,000 77,000<br />
Under 40 574,000 590,000 284,000 156,000 230,000<br />
40 Plus 1,210,000 1,178,000 523,000 358,000 487,000<br />
ALL PEOPLE 10+<br />
Area 1 1,047,000 1,019,000 335,000 238,000 679,000<br />
Area 2 713,000 1,148,000 337,000 272,000 253,000<br />
Area 3 579,000 1,006,000 422,000 289,000 166,000<br />
Area 4 724,000 793,000 209,000 283,000 458,000<br />
Area 5 1,035,000 - 517,000 - -<br />
NOTES ON POPULATION POTENTIALS<br />
MELBOURNE<br />
BRISBANE ADELAIDE PERTH<br />
Please refer to Survey Area Maps for each market's area definition.<br />
The “TOTAL POPULATION 10+” is our estimate based on the latest information available from the<br />
Australian Bureau of Statistics.<br />
The “MINIMUM SAMPLE SIZE” represents the minimum number of diaries that will be fed into the computer<br />
for the production of each report in <strong>2012</strong>.<br />
All other figures are “POTENTIALS”. These are our estimates of the number of people in that age group in<br />
the Survey Area.<br />
The “TOTAL POPULATION” and “POTENTIALS” are all estimates at June 30, <strong>2012</strong>. Thus, the figures<br />
shown will be slight over-estimates for the early part of the year and slight under-estimates for the latter part<br />
of the year.<br />
While the number of people in the various components will vary from survey to survey, appropriate raising<br />
factors are used to ensure that each element of the sample is given its correct weight according to the<br />
potential shown.<br />
<strong>Nielsen</strong> - <strong>2012</strong> <strong>Radio</strong> <strong>Survival</strong> <strong>Kit</strong>.
<strong>2012</strong> Population Potentials by Demographics<br />
NEWCASTLE GOLD COAST<br />
/TWEED<br />
CANBERRA<br />
Minimum Sample Size 1,500 1,500 1,100<br />
PEOPLE 10+ 488,000 547,000 PEOPLE 10+ 359,600<br />
10-17 56,000 59,700 10-17 38,800<br />
18-24 57,000 63,100 18-24 49,000<br />
25-39 109,000 131,000 25-39 100,600<br />
40-54 110,000 125,700 40-54 84,500<br />
55-64 68,000 73,000 55-64 43,800<br />
65+ 88,000 94,500 65+ 42,900<br />
13+ 467,000 525,400<br />
18+ 432,000 487,300<br />
16-24 71,000 78,900<br />
25-34 73,000 88,200<br />
35-44 72,000 85,500<br />
45-59 109,000 119,800<br />
60+ 121,000 130,700<br />
MEN 10+ 240,000 269,400 MEN 18+ 159,000<br />
10-17 29,000 30,800 18-39 76,400<br />
18-24 29,000 32,000 25-39 50,800<br />
25-39 55,000 65,700 25-54 92,600<br />
40-54 54,000 61,200 40+ 82,600<br />
55+ 73,000 79,700<br />
13+ 229,000 258,300<br />
18+ 211,000 238,600<br />
16-24 36,000 40,100<br />
25-34 37,000 44,500<br />
35-44 36,000 42,100<br />
45-59 53,000 58,100<br />
60+ 56,000 61,900<br />
WOMEN 10+ 248,000 277,600 WOMEN 18+ 161,800<br />
10-17 27,000 28,900 18-39 73,200<br />
18-24 28,000 31,100 25-39 49,800<br />
25-39 54,000 65,300 25-54 92,500<br />
40-54 56,000 64,500 40+ 88,600<br />
55+ 83,000 87,800<br />
13+ 238,000 267,100<br />
18+ 221,000 248,700<br />
16-24 35,000 38,800<br />
25-34 36,000 43,700<br />
35-44 36,000 43,400<br />
45-59 56,000 61,700<br />
60+ 65,000 68,800<br />
<strong>Nielsen</strong> - <strong>2012</strong> <strong>Radio</strong> <strong>Survival</strong> <strong>Kit</strong>.
<strong>2012</strong> Population Potentials by Demographics<br />
Minimum Sample Size 1,500 1,500 1,100<br />
GROCERY BUYERS GROCERY BUYERS<br />
All 225,000 251,500 All 165,100<br />
Working 109,000 127,000 With Teens/Children 49,600<br />
Non-Working 116,000 124,500 Under 40 42,000<br />
With Teens/Children 71,000 78,500 40 Plus 123,100<br />
With Children 0-9 45,000 45,300<br />
With Children 10-17 40,000 47,700<br />
Under 40 54,000 57,400<br />
40 Plus 171,000 194,100<br />
ALL PEOPLE 10+<br />
Area 1 202,000 408,100<br />
Area 2 106,000 138,900<br />
Area 3 180,000 -<br />
NOTES ON POPULATION POTENTIALS<br />
NEWCASTLE GOLD COAST<br />
/TWEED<br />
CANBERRA<br />
Please refer to Survey Area Maps for each market's area definition.<br />
The “TOTAL POPULATION 10+” is our estimate based on the latest information available from the<br />
Australian Bureau of Statistics.<br />
The “MINIMUM SAMPLE SIZE” represents the minimum number of diaries that will be fed into the computer<br />
for the production of each report in <strong>2012</strong>.<br />
All other figures are “POTENTIALS”. These are our estimates of the number of people in that age group in<br />
the Survey Area.<br />
The “TOTAL POPULATION” and “POTENTIALS” are all estimates at June 30, <strong>2012</strong>. Thus, the figures<br />
shown will be slight over-estimates for the early part of the year and slight under-estimates for the latter part<br />
of the year.<br />
While the number of people in the various components will vary from survey to survey, appropriate raising<br />
factors are used to ensure that each element of the sample is given its correct weight according to the<br />
potential shown.<br />
<strong>Nielsen</strong> - <strong>2012</strong> <strong>Radio</strong> <strong>Survival</strong> <strong>Kit</strong>.
Sydney <strong>Radio</strong> – Map of Survey Area<br />
REGION<br />
1 – North 4 – South West<br />
2 – Central & Inner West 5 – West<br />
3 – South
SYDNEY <strong>2012</strong> - POPULATION SPREAD BY SLA<br />
Statistical Local Area Population 0+ * %<br />
Sample<br />
Interviewing<br />
Areas<br />
Statistical Local Area Population 0+ * %<br />
Sample<br />
Interviewing<br />
Areas<br />
1 North 4 South-West<br />
Gosford (C) - East 70,017 1.5% 6 Bankstown (C) - North-East 63,500 1.4% 6<br />
Gosford (C) - West 98,171 2.1% 9 Bankstown (C) - North-West 69,039 1.5% 6<br />
Hornsby (A) - North 70,187 1.5% 6 Bankstown (C) - South 56,275 1.2% 5<br />
Hornsby (A) - South 93,847 2.1% 8 Camden (A) 56,809 1.2% 5<br />
Hunter's Hill (A) 14,591 0.3% 1 Campbelltown (C) - North 79,577 1.7% 7<br />
Ku-ring-gai (A) 114,142 2.5% 10 Campbelltown (C) - South 73,645 1.6% 7<br />
Lane Cove (A) 33,335 0.7% 3 Fairfield (C) - East 121,954 2.7% 11<br />
Manly (A) 41,925 0.9% 4 Fairfield (C) - West 74,613 1.6% 7<br />
Mosman (A) 29,232 0.6% 3 Liverpool (C) - East 109,164 2.4% 10<br />
North Sydney (A) 64,795 1.4% 6 Liverpool (C) - West 76,317 1.7% 7<br />
Pittwater (A) 59,847 1.3% 5 Wollondilly (A) 44,050 1.0% 4<br />
Ryde (C) 106,289 2.3% 9 824,943 18.0% 75<br />
Warringah (A) 145,865 3.2% 13<br />
Willoughby (C) 70,008 1.5% 6 5 West<br />
Wyong (A) - North-East 78,662 1.7% 7 Auburn (A) 78,597 1.7% 7<br />
Wyong (A) - South and West 72,865 1.6% 6 Baulkham Hills (A) - Central 77,201 1.7% 7<br />
1,163,778 25.4% 102 Baulkham Hills (A) - North 58,000 1.3% 5<br />
2 Central/Inner West Baulkham Hills (A) - South 44,515 1.0% 4<br />
Ashfield (A) 42,787 0.9% 4 Blacktown (C) - North 104,456 2.3% 9<br />
Burwood (A) 33,803 0.7% 3 Blacktown (C) - South-East 98,884 2.2% 9<br />
Canada Bay (A) - Concord 40,320 0.9% 4 Blacktown (C) - South-West 104,476 2.3% 9<br />
Canada Bay (A) - Drummoyne 38,415 0.8% 3 Blue Mountains (C) 77,943 1.7% 7<br />
Leichhardt (A) 55,596 1.2% 5 Hawkesbury (C) 64,030 1.4% 6<br />
Marrickville (A) 79,215 1.7% 7 Holroyd (C) 102,188 2.2% 9<br />
Randwick (C) 133,116 2.9% 12 Parramatta (C) - Inner 49,242 1.1% 4<br />
Strathfield (A) 36,911 0.8% 3 Parramatta (C) - North-East 47,285 1.0% 4<br />
Sydney (C) - East 52,795 1.2% 5 Parramatta (C) - North-West 37,555 0.8% 3<br />
Sydney (C) - Inner 25,677 0.6% 2 Parramatta (C) - South 38,251 0.8% 3<br />
Sydney (C) - South 59,000 1.3% 5 Penrith (C) - East 100,920 2.2% 9<br />
Sydney (C) - West 44,754 1.0% 4 Penrith (C) - West 85,301 1.9% 8<br />
Waverley (A) 69,420 1.5% 6 1,168,844 25.5% 103<br />
Woollahra (A) 56,005 1.2% 5<br />
767,814 16.8% 68<br />
3 South<br />
Botany Bay (C) 40,463 0.9% 4 TOTAL 4,575,532 100.0% 405<br />
Canterbury (C) 145,668 3.2% 13<br />
Hurstville (C) 80,823 1.8% 7<br />
Kogarah (A) 59,200 1.3% 5<br />
Rockdale (C) 103,164 2.3% 9<br />
Sutherland Shire (A) - East 105,549 2.3% 9<br />
Sutherland Shire (A) - West 115,286 2.5% 10<br />
650,153 14.2% 57<br />
* 2010 Estimated Resident Population
Melbourne <strong>Radio</strong> – Map of Survey Area<br />
REGION<br />
1 – North 3 – East<br />
2 – South 4 – West
MELBOURNE <strong>2012</strong> - POPULATION SPREAD BY SLA<br />
Sample<br />
Sample<br />
Statistical Local Area Population 0+* % Interviewing<br />
Statistical Local Area Population 0+* % Interviewing<br />
Areas<br />
Areas<br />
1 North 3 East<br />
Banyule (C) - Heidelberg 67,013 1.5% 6 Boroondara (C) - Camberwell N. 47,030 1.1% 4<br />
Banyule (C) - North 57,236 1.3% 5 Boroondara (C) - Camberwell S. 53,691 1.2% 5<br />
Brimbank (C) - Keilor 92,974 2.1% 9 Boroondara (C) - Hawthorn 37,233 0.9% 3<br />
Darebin (C) - Northcote 51,057 1.2% 5 Boroondara (C) - Kew 31,553 0.7% 3<br />
Darebin (C) - Preston 90,082 2.1% 8 Knox (C) - North-East 66,505 1.5% 6<br />
Hume (C) - Broadmeadows 66,411 1.5% 6 Knox (C) - North-West 47,237 1.1% 4<br />
Hume (C) - Craigieburn 69,268 1.6% 6 Knox (C) - South 43,255 1.0% 4<br />
Hume (C) - Sunbury 36,317 0.8% 3 Manningham (C) - East 16,250 0.4% 1<br />
Macedon Ranges (S) - Romsey 12,048 0.3% 1 Manningham (C) - West 102,940 2.4% 10<br />
Macedon Ranges (S) Bal 21,585 0.5% 2 Maroondah (C) - Croydon 62,380 1.4% 6<br />
Mitchell (S) - South 23,744 0.5% 2 Maroondah (C) - Ringwood 44,552 1.0% 4<br />
Moonee Valley (C) - Essendon 74,176 1.7% 7 Monash (C) - Waverley East 60,663 1.4% 6<br />
Moonee Valley (C) - West 43,844 1.0% 4 Monash (C) - Waverley West 68,730 1.6% 6<br />
Moreland (C) - Brunswick 46,249 1.1% 4 Stonnington (C) - Malvern 49,092 1.1% 5<br />
Moreland (C) - Coburg 52,731 1.2% 5 Stonnington (C) - Prahran 51,259 1.2% 5<br />
Moreland (C) - North 51,858 1.2% 5 Whitehorse (C) - Box Hill 55,790 1.3% 5<br />
Nillumbik (S) - South 28,736 0.7% 3 Whitehorse (C) - Nunawading E. 47,454 1.1% 4<br />
Nillumbik (S) - South-West 25,706 0.6% 2 Whitehorse (C) - Nunawading W. 53,553 1.2% 5<br />
Nillumbik (S) Bal 9,742 0.2% 1 Yarra (C) - Richmond 28,244 0.6% 3<br />
Whittlesea (C) - North 46,800 1.1% 4 Yarra Ranges (S) - Central 15,674 0.4% 1<br />
Whittlesea (C) - South-East 44,846 1.0% 4 Yarra Ranges (S) - Dandenongs 30,802 0.7% 3<br />
Whittlesea (C) - South-West 63,467 1.4% 6 Yarra Ranges (S) - Lilydale 73,175 1.7% 7<br />
Yarra (C) - North 51,296 1.2% 5 Yarra Ranges (S) - North 13,636 0.3% 1<br />
1,127,186 25.7%<br />
103 Yarra Ranges (S) - Seville 16,287 0.4% 2<br />
1,116,985 25.5%<br />
103<br />
2 South 4 West<br />
Bayside (C) - Brighton 39,306 0.9% 4 Bellarine - Inner 25,551 0.6% 2<br />
Bayside (C) - South 57,977 1.3% 5 Brimbank (C) - Sunshine 96,412 2.2% 9<br />
Cardinia (S) - North 25,890 0.6% 2 Corio - Inner 60,234 1.4% 6<br />
Cardinia (S) - Pakenham 41,288 0.9% 4 Geelong 12,190 0.3% 1<br />
Cardinia (S) - South 6,140 0.1% 1 Geelong West 14,857 0.3% 1<br />
Casey (C) - Berwick 100,025 2.3% 9 Greater Geelong (C) - Pt B 38,215 0.9% 4<br />
Casey (C) - Cranbourne 84,059 1.9% 8 Greater Geelong (C) - Pt C 3,203 0.1% 0<br />
Casey (C) - Hallam 54,000 1.2% 5 Hobsons Bay (C) - Altona 55,470 1.3% 5<br />
Casey (C) - South 17,575 0.4% 2 Hobsons Bay (C) - Williamstown 32,583 0.7% 3<br />
Frankston (C) - East 50,795 1.2% 5 Maribyrnong (C) 72,896 1.7% 7<br />
Frankston (C) - West 79,667 1.8% 7 Melbourne (C) - Inner 15,427 0.4% 1<br />
Glen Eira (C) - Caulfield 84,453 1.9% 8 Melbourne (C) - Remainder 57,288 1.3% 5<br />
Glen Eira (C) - South 53,259 1.2% 5 Melbourne (C) - Southbank-Docklands 18,621 0.4% 2<br />
Gr. Dandenong (C) - Dandenong 60,453 1.4% 6 Melton (S) - East 57,670 1.3% 5<br />
Gr. Dandenong (C) Bal 78,105 1.8% 7 Melton (S) Bal 49,480 1.1% 5<br />
Kingston (C) - North 98,419 2.2% 9 Moorabool (S) - Bacchus Marsh 18,222 0.4% 2<br />
Kingston (C) - South 50,411 1.2% 5 Newtown 10,699 0.2% 1<br />
Monash (C) - South-West 48,333 1.1% 4 Queenscliffe (B) 3,314 0.1% 0<br />
Mornington Peninsula (S) - East 40,493 0.9% 4 South Barwon - Inner (part) 52,337 1.2% 5<br />
Mornington Peninsula (S) - South 50,738 1.2% 5 Surf Coast (S) - East (part) 6,286 0.1% 1<br />
Mornington Peninsula (S) - West 59,007 1.3% 5 Wyndham (C) - North 98,224 2.2% 9<br />
Port Phillip (C) - St Kilda 56,046 1.3% 5 Wyndham (C) - South 29,259 0.7% 3<br />
Port Phillip (C) - West 41,383 0.9% 4 Wyndham (C) - West 29,090 0.7% 3<br />
1,277,822 29.2% 119 857,528<br />
19.6%<br />
80<br />
TOTAL<br />
4,379,521 100% 405<br />
* 2010 Estimated Resident Population
Brisbane <strong>Radio</strong> – Map of Survey Area<br />
REGION<br />
1 – East 4 – City & City North<br />
2 – West 5 – North<br />
3 – South
BRISBANE <strong>2012</strong> - POPULATION SPREAD BY SLA<br />
Statistical Local Area Population 0+ * % of Survey Area<br />
Sample<br />
Interviewing<br />
Areas<br />
Statistical Local Area<br />
Population 0+ * % of Survey Area<br />
1a Southern Inner Suburbs 1c Eastern Inner Suburbs<br />
Annerley Balmoral<br />
Fairfield Bulimba<br />
Greenslopes Cannon Hill<br />
Holland Park Carina<br />
Holland Park West Carina Heights<br />
Moorooka Carindale<br />
Tarragindi Coorparoo<br />
Yeerongpilly East Brisbane<br />
Yeronga TOTAL 65,547 3.2% 11 Hawthorne<br />
1b Eastern Outer Suburbs Morningside<br />
Alexandra Hills Norman Park TOTAL 91,176 4.5% 15<br />
Belmont-Mackenzie<br />
Birkdale<br />
TOTAL AREA ONE 375,155 18.4% 61<br />
Burbank 2a Western Outer Suburbs<br />
Capalaba Anstead<br />
Chandler-Capalaba West Bellbowrie<br />
Cleveland Boonah (S) (part)<br />
Gumdale-Ransome Brookfield (incl. Bris Forest Park) (part)<br />
Hemmant-Lytton Chapel Hill<br />
Lota Darra-Sumner<br />
Manly Doolandella-Forest Lake<br />
Manly West Durack<br />
Moreton Island Ellen Grove<br />
Murarrie Esk (S) (part)<br />
Ormiston Fig Tree Pocket<br />
Redland (S) Bal Inala<br />
Redland Bay Indooroopilly<br />
Sheldon-Mt Cotton Ipswich (C) - Central<br />
Thorneside Ipswich (C) - East<br />
Thornlands Ipswich (C) - North<br />
Tingalpa Ipswich (C) - South-West (part)<br />
Victoria Point Jamboree Heights<br />
Wakerley Jindalee<br />
Wellington Point Karana Downs-Lake Manchester<br />
Wynnum Kenmore<br />
Wynnum West TOTAL 218,432 10.7% 35<br />
Kenmore Hills<br />
Middle Park<br />
Moggill<br />
Mount Ommaney<br />
Oxley<br />
Pinjarra Hills<br />
Pullenvale<br />
Page 1 of 3<br />
Sample<br />
Interviewing<br />
Areas<br />
* 2010 Estimated Resident Population
BRISBANE <strong>2012</strong> - POPULATION SPREAD BY SLA<br />
Statistical Local Area Population 0+ * % of Survey Area<br />
Sample<br />
Interviewing<br />
Areas<br />
Statistical Local Area<br />
Population 0+ * % of Survey Area<br />
2a Western Outer Suburbs (cont'd) 3. Southern Outer Suburbs (cont'd)<br />
Richlands Marsden<br />
Riverhills Mount Gravatt<br />
Seventeen Mile Rocks Mount Gravatt East<br />
Wacol Mt Warren Park<br />
Westlake TOTAL 324,605 15.9% 52 Nathan<br />
Pallara-Heathwood-Larapinta<br />
Western Outer Suburbs Parkinson-Drewvale<br />
2b Chelmer Robertson<br />
Corinda Rochedale<br />
Graceville Rochedale South<br />
Sherwood Rocklea<br />
St Lucia Runcorn<br />
Taringa Salisbury<br />
Toowong TOTAL 54,371 2.7% 9 Shailer Park<br />
TOTAL AREA TWO 378,976 18.6% 61 Slacks Creek<br />
Springwood<br />
Southern Outer Suburbs Stretton-Karawatha<br />
3 Acacia Ridge Sunnybank<br />
Algester Sunnybank Hills<br />
Archerfield Tanah Merah<br />
Beaudesert (S) - Pt A (part) Underwood<br />
Beaudesert (S) - Pt C (part) Upper Mount Gravatt<br />
Beenleigh Waterford West<br />
Bethania-Waterford Willawong<br />
Browns Plains Wishart<br />
Calamvale Wolffdene-Bahrs Scrub (part)<br />
Camp Hill Woodridge<br />
Carbrook-Cornubia TOTAL AREA THREE 481,000 23.6% 78<br />
Coopers Plains<br />
Daisy Hill-Priestdale 4a Northern Inner Suburbs<br />
Eagleby Albion<br />
Edens Landing-Holmview Alderley<br />
Eight Mile Plains Ascot<br />
Greenbank-Boronia Heights Ashgrove<br />
Kingston Bardon<br />
Kuraby Clayfield<br />
Logan (C) Bal Enoggera<br />
Loganholme Ferny Grove<br />
Loganlea Grange<br />
MacGregor Hamilton<br />
Mansfield Hendra<br />
Keperra<br />
Page 2 of 3<br />
Sample<br />
Interviewing<br />
Areas<br />
* 2010 Estimated Resident Population
BRISBANE <strong>2012</strong> - POPULATION SPREAD BY SLA<br />
Statistical Local Area Population 0+ * % of Survey Area<br />
Sample<br />
Interviewing<br />
Areas<br />
Statistical Local Area<br />
Population 0+ * % of Survey Area<br />
4a Northern Inner Suburbs (cont'd) 5 Northern Outer Suburbs (cont'd)<br />
Lutwyche Bridgeman Downs<br />
Mitchelton Brighton<br />
Newmarket Burpengary-Narangba<br />
Pinkenba-Eagle Farm Caboolture (S) - Central<br />
The Gap Caboolture (S) - East<br />
Upper Kedron Caboolture (S) - Hinterland<br />
Wilston Caboolture (S) - Midwest<br />
Windsor Carseldine<br />
Wooloowin TOTAL 133,599 6.5% 22 Central Pine West<br />
Chermside<br />
4b City Core Suburbs Chermside West<br />
Bowen Hills Clontarf<br />
Brookfield (incl. Bris Forest Park) (part) Dakabin-Kallangur-M.Downs<br />
City - Inner Deagon<br />
City - Remainder Deception Bay<br />
Dutton Park Everton Park<br />
Fortitude Valley Geebung<br />
Herston Griffin-Mango Hill<br />
Highgate Hill Hills District<br />
Kangaroo Point Kedron<br />
Kelvin Grove Lawnton<br />
Milton Margate-Woody Point<br />
New Farm McDowall<br />
Newstead Morayfield<br />
Paddington Northgate<br />
Red Hill Nudgee<br />
South Brisbane Nundah<br />
Spring Hill Petrie<br />
West End Pine Rivers (S) Bal<br />
Woolloongabba TOTAL 95,916 4.7% 15 Redcliffe-Scarborough<br />
TOTAL AREA FOUR 229,515 11.2% 37 Rothwell-Kippa-Ring<br />
Sandgate<br />
Stafford<br />
5 Northern Outer Suburbs Stafford Heights<br />
Albany Creek Strathpine-Brendale<br />
Aspley Taigum-Fitzgibbon<br />
Bald Hills Virginia<br />
Banyo Wavell Heights<br />
Boondall Zillmere<br />
Bracken Ridge TOTAL AREA FIVE 575,722 28.2% 93<br />
Bray Park<br />
Bribie Island<br />
TOTAL 2,040,368 100% 330<br />
Page 3 of 3<br />
Sample<br />
Interviewing<br />
Areas<br />
* 2010 Estimated Resident Population
Adelaide <strong>Radio</strong> – Map of Survey Area<br />
REGION<br />
1 – Central 3 – East & South<br />
2 – North 4 – West & South West
ADELAIDE <strong>2012</strong> - POPULATION SPREAD BY SLA<br />
Statistical Local Area Population 0+ * %<br />
Sample<br />
Interviewing<br />
Areas<br />
Statistical Local Area Population 0+ * %<br />
Sample<br />
Interviewing<br />
Areas<br />
1 Central 3 East and South<br />
Adelaide (C) 19,876 1.7% 5 Adelaide Hills (DC) - Central 13,177 1.1% 3<br />
Charles Sturt (C) - Coastal (part) 16,956 1.4% 4 Adelaide Hills (DC) - Ranges 10,534 0.9% 3<br />
Charles Sturt (C) - Inner East 22,968 1.9% 6 Burnside (C) - North-East 22,283 1.9% 6<br />
Charles Sturt (C) - Inner West 25,455 2.1% 6 Burnside (C) - South-West 22,166 1.8% 5<br />
Charles Sturt (C) - North-East 27,644 2.3% 7 Campbelltown (C) - East 28,856 2.4% 7<br />
Norw. P'ham St Ptrs (C) - East 17,230 1.4% 4 Campbelltown (C) - West 20,860 1.7% 5<br />
Norw. P'ham St Ptrs (C) - West 19,268 1.6% 5 Mitcham (C) - Hills 25,560 2.1% 6<br />
Port Adel. Enfield (C) - Coast 29,299 2.4% 7 Mitcham (C) - North-East 16,316 1.4% 4<br />
Port Adel. Enfield (C) - Port 10,956 0.9% 3 Mitcham (C) - West 23,816 2.0% 6<br />
Prospect (C) 21,105 1.8% 5 Onkaparinga (C) - Hills (part) 3,041 0.3% 1<br />
Unley (C) - East 20,670 1.7% 5 Onkaparinga (C) - Reservoir 26,225 2.2% 7<br />
Unley (C) - West 18,097 1.5% 4 Onkaparinga (C) - Woodcroft (part) 12,020 1.0% 3<br />
Walkerville (M) 7,408 0.6% 2 Tea Tree Gully (C) - Central 26,569 2.2% 7<br />
256,932 21.4% 63 Tea Tree Gully (C) - Hills 12,694 1.1% 3<br />
Tea Tree Gully (C) - North 27,873 2.3% 7<br />
Tea Tree Gully (C) - South 33,457 2.8% 8<br />
2 Northern 325,447 27.1% 81<br />
Gawler (T) 21,041 1.8% 5<br />
Playford (C) - East Central 22,655 1.9% 6 4 West and South West<br />
Playford (C) - Elizabeth 26,512 2.2% 7 Alexandrina (DC)-Strathalbyn (part) 827 0.1% 0<br />
Playford (C) - Hills 3,687 0.3% 1 Charles Sturt (C) - Coastal (part) 15,309 1.3% 4<br />
Playford (C) - West 12,028 1.0% 3 Holdfast Bay (C) - North 20,611 1.7% 5<br />
Playford (C) - West Central 14,968 1.2% 4 Holdfast Bay (C) - South 15,312 1.3% 4<br />
Port Adel. Enfield (C) - East 34,757 2.9% 9 Marion (C) - Central 36,009 3.0% 9<br />
Port Adel. Enfield (C) - Inner 21,364 1.8% 5 Marion (C) - North 26,765 2.2% 7<br />
Port Adel. Enfield (C) - Park 16,881 1.4% 4 Marion (C) - South 22,624 1.9% 6<br />
Salisbury (C) - Central 29,038 2.4% 7 Onkaparinga (C) - Hackham 14,751 1.2% 4<br />
Salisbury (C) - Inner North 26,166 2.2% 6 Onkaparinga (C) - Hills (part) 8,811 0.7% 2<br />
Salisbury (C) - North-East 22,872 1.9% 6 Onkaparinga (C) - Morphett 23,659 2.0% 6<br />
Salisbury (C) - South-East 37,999 3.2% 9 Onkaparinga (C) - North Coast 18,975 1.6% 5<br />
Salisbury (C) Bal 16,398 1.4% 4 Onkaparinga (C) - South Coast 31,166 2.6% 8<br />
306,366 25.5% 76 Onkaparinga (C) - Woodcroft (part) 22,515 1.9% 6<br />
Unincorp. Western 3 0.0% 0<br />
West Torrens (C) - East 25,962 2.2% 6<br />
West Torrens (C) - West 30,207 2.5% 8<br />
313,506 26.1% 80<br />
TOTAL 1,202,251 100% 300<br />
* 2010 Estimated Resident Population
Perth <strong>Radio</strong> – Map of Survey Area<br />
REGION<br />
1 – North & North East 3 – West<br />
2 – South & South East 4 – South West
PERTH <strong>2012</strong> - POPULATION SPREAD BY SLA<br />
Statistical Local Area Population 0+* %<br />
Sample<br />
Interviewing<br />
Areas<br />
Statistical Local Area Population 0+* %<br />
Sample<br />
Interviewing<br />
Areas<br />
1 North and North East 3 Western<br />
Bassendean (T) 14,790 0.9% 3 Cambridge (T) (part) 26,809 1.6% 5<br />
Bayswater (C) 61,865 3.6% 11 Claremont (T) 9,891 0.6% 2<br />
Cambridge (T) (part) 150 0.0% 0 Cottesloe (T) 8,222 0.5% 2<br />
Joondalup (C) - North 55,588 3.3% 10 Mosman Park (T) 9,440 0.6% 2<br />
Joondalup (C) - South 108,857 6.4% 20 Nedlands (C) 22,508 1.3% 4<br />
Mundaring (S) 38,910 2.3% 7 Peppermint Grove (S) 1,749 0.1% 0<br />
Stirling (C) - Central 114,169 6.7% 21 Perth (C) - Inner 1,834 0.1% 0<br />
Stirling (C) - Coastal 71,148 4.2% 13 Perth (C) - Remainder 16,484 1.0% 3<br />
Stirling (C) - South-Eastern 17,505 1.0% 3 Subiaco (C) 18,862 1.1% 4<br />
Swan (C) 112,960 6.7% 21 Victoria Park (T) 32,958 1.9% 6<br />
Wanneroo (C) - North-East 45,599 2.7% 8 Vincent (T) 30,038 1.8% 6<br />
Wanneroo (C) - North-West 53,687 3.2% 10 178,795 10.5% 34<br />
Wanneroo (C) - South 50,820 3.0% 9<br />
746,048 44.0% 136<br />
4 South West<br />
2 South and South East Canning (C) 88,151 5.2% 16<br />
Armadale (C) 60,983 3.6% 11 Cockburn (C) 91,313 5.4% 17<br />
Belmont (C) 35,082 2.1% 6 East Fremantle (T) 7,534 0.4% 1<br />
Gosnells (C) 106,724 6.3% 20 Fremantle (C) - Inner 965 0.1% 0<br />
Kalamunda (S) 55,814 3.3% 10 Fremantle (C) - Remainder 27,661 1.6% 5<br />
Serpentine-Jarrahdale (S) 17,212 1.0% 3 Kwinana (T) 29,029 1.7% 5<br />
275,815 16.3% 50 Melville (C) 102,716 6.1% 19<br />
Rockingham (C) 104,130 6.1% 19<br />
South Perth (C) 43,908 2.6% 8<br />
495,407 29.2% 90<br />
TOTAL 1,696,065 100% 310<br />
* 2010 Estimated Resident Population
Newcastle <strong>Radio</strong> – Map of Survey Area<br />
REGION<br />
1 – Central and North<br />
2 – West<br />
3 – South
NEWCASTLE <strong>2012</strong> - POPULATION SPREAD BY SLA<br />
Region<br />
Statistical Local Area Population 0+ *<br />
% of Survey Area<br />
Sample<br />
Interviewing<br />
Areas<br />
1 Central and North<br />
Newcastle (C) - Inner City 53,495 9.8% 15<br />
Newcastle (C) - Outer West 46,420 8.5% 13<br />
Newcastle (C) - Throsby 56,197 10.3% 16<br />
Port Stephens (A) 67,825 12.4% 19<br />
223,937<br />
41.0% 63<br />
2 West<br />
Cessnock (C) (part) 50,649 9.3% 14<br />
Maitland (C) 70,296 12.9% 19<br />
120,945 22.2% 33<br />
3 South<br />
Lake Macquarie (C) - East 64,952 11.9% 18<br />
Lake Macquarie (C) - North 79,865 14.6% 22<br />
Lake Macquarie (C) - West 56,032 10.3% 16<br />
200,849 36.8% 56<br />
TOTAL 545,731 100%<br />
152<br />
* 2010 Estimated Resident Population
Gold Coast/Tweed <strong>Radio</strong><br />
Map of Survey Area
GOLD COAST/TWEED <strong>2012</strong><br />
POPULATION SPREAD BY SLA<br />
Total Persons * Total Persons *<br />
Statistical Local Area Population 0+ % of Survey Area Statistical Local Area<br />
Population 0+ % of Survey Area<br />
Ashmore-Benowa 21,384 3.6% Mermaid Waters-Clear Island Waters 17,788 3.0%<br />
Biggera Waters-Labrador 23,622 4.0% Miami 7,072 1.2%<br />
Bilinga-Tugun 7,240 1.2% Molendinar 6,908 1.2%<br />
Broadbeach-Mermaid Beach 11,852 2.0% Mudgeeraba-Reedy Creek 25,440 4.3%<br />
Broadbeach Waters 8,424 1.4% Nerang 27,976 4.7%<br />
Bundall 4,685 0.8% Oxenford-Maudsland 15,021 2.5%<br />
Burleigh Heads 8,834 1.5% Pacific Pines-Gaven 15,487 2.6%<br />
Burleigh Waters 14,374 2.4% Palm Beach 15,446 2.6%<br />
Carrara-Merrimac 18,808 3.1% Paradise Point-Runaway Bay 18,993 3.2%<br />
Coolangatta 5,495 0.9% Parkwood-Arundel 20,210 3.4%<br />
Coombabah 10,599 1.8% Pimpama-Coomera 10,141 1.7%<br />
Currumbin 3,080 0.5% Robina 22,660 3.8%<br />
Currumbin Valley-Tallebudgera 7,803 1.3% Southport 30,030 5.0%<br />
Currumbin Waters 10,739 1.8% Surfers Paradise 20,683 3.5%<br />
Elanora 12,911 2.2% Tweed (A) - Tweed Coast 11,367 1.9%<br />
Guanaba-Springbrook 4,676 0.8% Tweed (A) - Tweed-Heads 56,954 9.5%<br />
Helensvale 17,564 2.9% Tweed (A) - Pt B 21,769 3.6%<br />
Hope Island 8,348 1.4% Varsity Lakes 14,751 2.5%<br />
Kingsholme-Upper Coomera 24,423 4.1% Worongary-Tallai 10,752 1.8%<br />
Main Beach-South Stradbroke 3,596 0.6%<br />
TOTAL 597,905 100%<br />
* 2010 Estimated Resident Population
Canberra <strong>Radio</strong> – Map of Survey Area
<strong>2012</strong> CANBERRA - POPULATION SPREAD BY SLA<br />
Statistical Local Area Population % of Statistical Local Area Population % of Statistical Local Area Population % of<br />
0+ Survey Area 0+ Survey Area 0+ Survey Area<br />
Queanbeyan (C) (part) 39,232 9.9% Garran 3,330 0.8% Monash 5,580 1.4%<br />
Acton 2,001 0.5% Gilmore 2,961 0.7% Narrabundah 5,909 1.5%<br />
Ainslie 5,390 1.4% Giralang 3,356 0.8% Ngunnawal 10,026 2.5%<br />
Amaroo 6,940 1.7% Gordon 7,888 2.0% Nicholls 7,813 2.0%<br />
Aranda 2,544 0.6% Gowrie 3,226 0.8% Oaks Estate 247 0.1%<br />
Banks 5,274 1.3% Greenway 1,359 0.3% O'Connor 5,581 1.4%<br />
Barton 1,170 0.3% Griffith 4,309 1.1% O'Malley 942 0.2%<br />
Belconnen - SSD Bal 799 0.2% Gungahlin 7,112 1.8% Oxley 1,886 0.5%<br />
Belconnen Town Centre 3,821 1.0% Gungahlin-Hall - SSD Bal 2,454 0.6% Page 2,898 0.7%<br />
Bonython 3,778 1.0% Hackett 3,112 0.8% Palmerston 6,201 1.6%<br />
Braddon 4,091 1.0% Hall 384 0.1% Parkes 6 0.0%<br />
Bruce 5,148 1.3% Harman 140 0.0% Pearce 2,646 0.7%<br />
Calwell 5,999 1.5% Harrison 2,573 0.6% Phillip 2,075 0.5%<br />
Campbell 3,416 0.9% Hawker 3,056 0.8% Pialligo 123 0.0%<br />
Chapman 2,847 0.7% Higgins 3,225 0.8% Red Hill 3,391 0.9%<br />
Charnwood 3,253 0.8% Holder 2,781 0.7% Reid 1,681 0.4%<br />
Chifley 2,501 0.6% Holt 5,152 1.3% Richardson 3,260 0.8%<br />
Chisholm 5,408 1.4% Hughes 3,020 0.8% Rivett 3,248 0.8%<br />
City 1,293 0.3% Hume 4 0.0% Russell 0 0.0%<br />
Conder 5,456 1.4% Isaacs 2,538 0.6% Scullin 2,954 0.7%<br />
Cook 3,035 0.8% Isabella Plains 4,310 1.1% Spence 2,782 0.7%<br />
Curtin 5,397 1.4% Jerrabomberra 13 0.0% Stirling 2,147 0.5%<br />
Deakin 2,856 0.7% Kaleen 7,729 1.9% Stromlo 165 0.0%<br />
Dickson 2,278 0.6% Kambah 15,841 4.0% Symonston 517 0.1%<br />
Downer 3,657 0.9% Kingston 2,905 0.7% Theodore 4,072 1.0%<br />
Duffy 3,254 0.8% Kowen 48 0.0% Torrens 2,315 0.6%<br />
Dunlop 7,083 1.8% Latham 3,890 1.0% Tuggeranong - SSD Bal 65 0.0%<br />
Duntroon 1,949 0.5% Lyneham 4,940 1.2% Turner 3,543 0.9%<br />
Evatt 5,500 1.4% Lyons 2,726 0.7% Wanniassa 8,091 2.0%<br />
Fadden 3,205 0.8% Macarthur 1,548 0.4% Waramanga 2,687 0.7%<br />
Farrer 3,530 0.9% Macgregor 3,910 1.0% Watson 4,851 1.2%<br />
Fisher 3,240 0.8% Macquarie 2,653 0.7% Weetangera 2,694 0.7%<br />
Florey 5,524 1.4% Majura 124 0.0% Weston 3,357 0.8%<br />
Flynn 3,763 0.9% Mawson 3,104 0.8% Weston Creek-Stromlo - SSD Bal 21 0.0%<br />
Forrest 1,523 0.4% McKellar 2,998 0.8% Yarralumla 2,942 0.7%<br />
Fraser 2,274 0.6% Melba 3,524 0.9%<br />
Fyshwick 61 0.0% Mitchell 5 0.0%<br />
TOTAL 397,454 100%<br />
*2010 Estimated Resident Population
SYDNEY OFFICE<br />
<strong>Radio</strong> Clients – NSW & QLD<br />
Ann-Maree Nolan<br />
Senior Client Service Manager<br />
(02) 8873 7713<br />
ann-maree.nolan@nielsen.com<br />
Agency Clients – NSW & QLD<br />
Scott Gillham<br />
Client Service Director<br />
(02) 8873 7622<br />
scott.gillham@nielsen.com<br />
PERTH OFFICE<br />
All Clients<br />
Richard Webster<br />
Account Manager<br />
0419 904 197<br />
rwebster@ausplastics.com<br />
<strong>Nielsen</strong> – <strong>2012</strong> <strong>Radio</strong> <strong>Survival</strong> <strong>Kit</strong>.<br />
<strong>2012</strong> Media Client Service<br />
MELBOURNE OFFICE<br />
All Clients – National,VIC, SA & Tas<br />
David Burge<br />
Client Service Director<br />
(03) 9207 3980<br />
david.burge@nielsen.com<br />
TECHNICAL SUPPORT<br />
(<strong>Nielsen</strong> software)<br />
All Clients<br />
Free Call: 1800 244 411<br />
Angelo Calma<br />
Media Technical Support Executive<br />
(02) 8873 7723 or 0414 966 866<br />
angelo.calma@nielsen.com<br />
Software Hotline 1800 244 411
<strong>Nielsen</strong> – <strong>2012</strong> <strong>Radio</strong> <strong>Survival</strong> <strong>Kit</strong>.<br />
<strong>2012</strong> <strong>Radio</strong> Training Courses<br />
These training sessions are free to current subscribers of <strong>Nielsen</strong>’s <strong>Radio</strong> Ratings Data. For dates and<br />
times of training, please refer to the separate <strong>2012</strong> Training Schedule.<br />
Theory and Software courses available this year are:<br />
<strong>Nielsen</strong> <strong>Radio</strong> Ratings Certificate Course<br />
A two part course covering all aspects of <strong>Radio</strong> surveys from the methodology used through to the type of data available<br />
and how to read and use it. To ‘pass’ each module, students will be required to undertake a small quiz. A certificate is<br />
awarded after successful completion of each module. Please note this course does not include software training; please<br />
refer to the following page for software courses.<br />
----------------------------------<br />
Module 1 - Understanding How <strong>Radio</strong> Surveys Are Conducted<br />
Information covered: In this course we discuss <strong>Nielsen</strong>’s <strong>Radio</strong> Audience Measurement. We outline how surveys are<br />
conducted; from the selection of the sample, the areas we use and how to fill out the <strong>Radio</strong> Diary. We explain the<br />
accuracy of the survey data right through to the delivery of the data.<br />
We demonstrate how to read and use the data. We define the four basic <strong>Radio</strong> statistics and Reach & Frequency.<br />
We interpret a <strong>Radio</strong> schedule and how it can be used to demonstrate a stations’ ability to reach a client’s specific<br />
target audience. We explain how Reach & Frequency can be used to monitor music or promo rotation.<br />
By the end of the session you will understand how the <strong>Radio</strong> surveys are conducted and what the four basic statistics<br />
and R&F are. How Share, Cumes and Average Audience differ and what other statistics you need to know when you<br />
first start in <strong>Radio</strong>.<br />
Who for? Sales & Marketing, Programmers, Media Buyers/Planners, Researchers - either as a refresher for current<br />
staff or as the perfect introduction for new staff.<br />
Pre- Requisite: None Length: 2 Hours<br />
----------------------------------<br />
Module 2 - Understanding the Survey Numbers<br />
Information covered: In the course we re-cap the four basic statistics and look at how they are calculated. We define<br />
the relationship between Averages, Cumes, & TSL. We demonstrate what can affect a station’s Share, and why your<br />
station’s Cume and TSL are important. How to interpret the data and analyse your station through trending survey<br />
results.<br />
We introduce other statistics such as Exclusive Audience, Turnover and Profile. We also covers the “Do’s and Don’ts”<br />
of survey numbers as well as what you can and can’t do with the data.<br />
We interpret Ebb & Flow data and see whether or not your listeners are staying with you or going to another <strong>Radio</strong><br />
station. We also interpret Station Loyalty and find out how loyal your station’s listeners are.<br />
By the end of the session you will have a thorough understanding of the Survey Numbers, how the numbers work<br />
together, what influences your Share figures and how to analyse your station’s survey results.<br />
Who for? Sales and Marketing, Programmers, Researchers and anyone interested in gaining extensive knowledge of<br />
survey numbers.<br />
Pre- Requisite: Module 1 “Understanding How <strong>Radio</strong> Surveys are Conducted” Length: 2 Hours<br />
----------------------------------<br />
For more information on these products, please contact your <strong>Nielsen</strong> representative or refer to the<br />
Media Client Service Contact sheet included within the <strong>Survival</strong> <strong>Kit</strong>.
<strong>Radio</strong> Advisor – Basic RA3<br />
<strong>Nielsen</strong> – <strong>2012</strong> <strong>Radio</strong> <strong>Survival</strong> <strong>Kit</strong>.<br />
<strong>2012</strong> <strong>Radio</strong> Training Courses<br />
<strong>Nielsen</strong> Software Courses<br />
Information covered: An introductory course to <strong>Radio</strong> Advisor – <strong>Nielsen</strong>’s <strong>Radio</strong> data software tool. Provides an<br />
overview to the system and explores in depth how to set up and read Session Ranking and Reach & Frequency<br />
analyses. Graphing and exporting are also covered.<br />
Who for? Sales & Marketing, Programmers Media Buyers/Planners, Researchers.<br />
Pre- Requisite: Module 1 “Understanding How <strong>Radio</strong> Surveys are Conducted” Length: 2 Hours<br />
----------------------------------<br />
<strong>Radio</strong> Advisor – Advanced RA3<br />
Information covered: For people who want to be able to obtain more information from <strong>Radio</strong> Advisor outside of the<br />
basic statistics. Great for sales planning and programming and this session can be tailored to suit the group. Covers<br />
Ebb & Flow, Program Ranking and Station Loyalty.<br />
Who for? Sales & Marketing, Pogrammers, Media Buyers/Planners, Researchers.<br />
Pre- Requisite: <strong>Radio</strong> Advisor – Basic (or initial training when installed) Length: 2 Hours<br />
----------------------------------<br />
Other <strong>Nielsen</strong> Software<br />
Training is also available to subscribers of other <strong>Nielsen</strong>’s services such as Consumer & Media View and AdEx.<br />
Consumer & Media View<br />
Consumer & Media View is a national multi-media database consisting of product and media consumption habits,<br />
consumer behaviours and attitudes. Data is collected using <strong>Nielsen</strong> “Your Voice” online panel. Currency data from<br />
<strong>Radio</strong>, Online and TV is then fused into the database providing clients with comprehensive sales & marketing tool.<br />
Using Consumer & Media View’s Clear Decisions software, subscribers can create in-depth profiles of listeners/<br />
consumers; identify potential target audiences or product categories for generating advertising sales; validate<br />
advertising performance and much more. The multi-media R&F available in this system allows clients to ascertain a<br />
total reach & frequency for an advertising campaign utilising different media.<br />
AdEx Online<br />
<strong>Nielsen</strong> provides the currency for advertising expenditure and volume measurement in Australia. AdEx measures over<br />
95% of main media advertising across Australia each year (excluding Classifieds) and provides clients with a means to<br />
track advertising spend and activity by Media, Category, Agency, Advertiser or Product.<br />
Using Adex’s Ad*Views software, subscribers can analyse a specific client or agency’s media expenditure and history;<br />
use it as a sales prospecting tool for current or potential clients; analyse the effectiveness of advertising campaigns<br />
and much more.
<strong>2012</strong> <strong>Nielsen</strong> <strong>Radio</strong> Training Schedule<br />
These training sessions are free to current subscribers of <strong>Nielsen</strong>’s <strong>Radio</strong> Ratings Data. Please note:<br />
Dates, times and courses may change subject to demand. Please see the <strong>2012</strong> <strong>Radio</strong> Training Course<br />
sheet for details on each course.<br />
____________________________________________________________________________________________________________________________<br />
SYDNEY<br />
Held at: <strong>Nielsen</strong>, Level 2, 11 Talavera Rd, Macquarie Park NSW 2113<br />
____________________________________________________________________________________________________________________________<br />
Module 1 & 2<br />
How <strong>Radio</strong> Surveys are Conducted &<br />
Understanding the Survey No’s<br />
<strong>Nielsen</strong> – <strong>2012</strong> <strong>Radio</strong> <strong>Survival</strong> <strong>Kit</strong>.<br />
Consumer & Media View<br />
Introduction to<br />
(This session is theory only).<br />
Consumer & Media View<br />
Software/Clear Decisions*<br />
* Users need to be able to use Excel due to the<br />
complexity of the software.<br />
Jan Wed 18, 10am<br />
Feb Wed 29, 10am Mon 6, 10am (Monday) Mon 6, 11am (Monday)<br />
Apr Wed 18, 10am Wed 11, 10am Wed 11, 11am<br />
May Wed 30, 10am Wed 23, 10am Wed 23, 11am<br />
Jul Wed 11, 10am Wed 4, 10am Wed 4, 11am<br />
Aug Wed 29, 10am Wed 15, 10am Wed 15, 11am<br />
Sep Wed 26, 10am Wed 26, 11am<br />
Oct Wed 3, 10am<br />
Nov Wed 14, 10am Wed 7, 10am Wed 7, 11am<br />
<strong>Radio</strong> Advisor Basic<br />
RA3<br />
<strong>Radio</strong> Advisor Advanced RA3<br />
AdViews Online<br />
Jan Thu 19, 10am Thu 19, 3pm Wed 18, 12 Noon<br />
Feb Wed 29, 12 Noon<br />
Mar Thu 1, 10am Thu 1, 3pm<br />
Apr Thu 19, 10am Thu 19, 3pm Wed 18, 12 Noon<br />
May Thu 31, 10am Thu 31, 3pm Wed 30, 12 Noon<br />
Jul Thu 12, 10am Thu 12, 3pm Wed 11, 12 Noon<br />
Aug Thu 30, 10am Thu 30, 3pm Wed 29, 12 Noon<br />
Oct Thu 4, 10am Thu 4, 3pm Wed 3, 12 Noon<br />
Nov Thu 15, 10am Thu 15, 3pm Wed 14, 12 Noon<br />
____________________________________________________________________________________________________________________________<br />
BRISBANE<br />
Held at <strong>Nielsen</strong>, Level 1, 490 Adelaide Street, Brisbane QLD 4000<br />
____________________________________________________________________________________________________________________________<br />
Module 1 & 2<br />
How <strong>Radio</strong> Surveys are Conducted &<br />
Understanding the Survey No’s.<br />
Consumer & Media View<br />
/Clear Decisions<br />
Mar Tue 6, 10am Tue 6, 1pm<br />
May Tue 15, 10am Tue 15, 1pm<br />
Aug Tue 21, 10am Tue 21, 1pm<br />
Nov Tue 20, 10am Tue 20, 1pm<br />
<strong>Radio</strong> Advisor Advanced RA3 <strong>Radio</strong> Advisor Basic RA3 AdViews Online<br />
Mar Wed 7, 9:30am Wed 7, 11:30am<br />
May Tue 15, 3:30pm Wed 16, 9:30am Wed 16, 11:30am<br />
Aug Wed 22, 9:30am Wed 22, 11:30am<br />
Nov Tue 20, 3:30pm Wed 21, 9:30am Wed 21, 11:30am<br />
Contact Ann-Maree Nolan (02 8873 7713) for Sydney and Brisbane market training<br />
PTO for Melbourne, Adelaide and Perth training information.
<strong>2012</strong> <strong>Nielsen</strong> <strong>Radio</strong> Training Schedule<br />
These training sessions are free to current subscribers of <strong>Nielsen</strong>’s <strong>Radio</strong> Ratings Data. Please note:<br />
Dates, times and courses may change subject to demand. Please see the <strong>2012</strong> <strong>Radio</strong> Training Course<br />
sheet for details on each course.<br />
____________________________________________________________________________________________________________________________<br />
MELBOURNE<br />
Held at <strong>Nielsen</strong>, Level 5, The Gateway, 312 St Kilda Rd, Melbourne VIC 3004<br />
Contact: David Burge, (03) 9207 3980<br />
____________________________________________________________________________________________________________________________<br />
Modules 1 & 2<br />
How <strong>Radio</strong> Surveys are Conducted &<br />
Understanding the Survey No’s<br />
<strong>Radio</strong> Advisor Basic <strong>Radio</strong> Advisor Advanced<br />
Jan Tue 17, 2pm Tue 17, 3pm<br />
Feb Tue 14, 9am Tue 14, 10am<br />
Mar Wed 14, 9am Wed 14, 10am<br />
Apr Tue 10, 9am Tue 10, 10am<br />
May Tue 15, 9am Tue 15, 10am<br />
Jun Tue 12, 9am Tue 12, 10am<br />
On request<br />
Jul Tue 10, 9am Tue 10, 10am<br />
Aug Tue 14, 9am Tue 14, 10am<br />
Sep Wed 12, 9am Wed 12, 10am<br />
Oct Tue 9, 9am Tue 9, 10am<br />
Nov Tue 13, 9am Tue 13, 10am<br />
Consumer & Media View<br />
/Clear Decisions<br />
AdViews Online<br />
Jan<br />
Feb Wed 22, 9am Wed 22, 11am<br />
Mar Thu 22, 9am Thu 22, 11am<br />
Apr Wed 18, 9am Wed 18, 11am<br />
May Wed 23, 9am Wed 23, 11am<br />
Jun Wed 20, 9am Wed 20, 11am<br />
Jul Wed 18, 9am Wed 18, 11am<br />
Aug Wed 22, 9am Wed 22, 11am<br />
Sep Wed 19, 9am Wed 19, 11am<br />
Oct Wed 17, 9am Wed 17, 11am<br />
Nov Wed 21, 9am Wed 21, 11am<br />
Training for Adelaide & Perth are all on an ad hoc basis.<br />
Please see below for contact in each market.<br />
____________________________________________________________________________________________________________________________<br />
ADELAIDE<br />
Contact: David Burge, (03) 9207 3980<br />
____________________________________________________________________________________________________________________________<br />
PERTH<br />
Contact: Richard Webster, 0419 904 197<br />
____________________________________________________________________________________________________________________________<br />
<strong>Nielsen</strong> – <strong>2012</strong> <strong>Radio</strong> <strong>Survival</strong> <strong>Kit</strong>.<br />
NIELSEN TRAINING CONDITIONS<br />
Minimum Class size is 3. Once a place is booked in a course, <strong>Nielsen</strong> must receive notification of cancellations no<br />
later than 48hrs before course commences. Someone else from your organisation can attend in your place if<br />
necessary. Please be considerate to others – if no notification is received and the class falls below 3 on the day, the<br />
course will be cancelled at the last moment, causing great inconvenience to other attendees who have arrived.<br />
Cancellations less than 48hrs will incur a $150 cancellation fee.
Available Analyses…<br />
<strong>Nielsen</strong> – <strong>2012</strong> <strong>Radio</strong> <strong>Survival</strong> <strong>Kit</strong>.<br />
<strong>Radio</strong> Advisor is the <strong>Nielsen</strong> re-analysis software<br />
package specifically designed for quick, easy and<br />
flexible analysis of radio audience surveys.<br />
It allows analysis using a variety of pre-set standard<br />
demographics and sessions, or users can create<br />
and save their own demographics and sessions.<br />
Analysis requirements can also be preset so that all<br />
necessary output can be easily and quickly<br />
generated as soon as new radio audience surveys<br />
are released, thereby allowing "batch" processing of<br />
the selected analyses.<br />
Session Ranking<br />
Session Ranking lets you analyse multiple statistics (such as average audience, share, cume,<br />
exclusive audience, TSL, Profile % and Index %) according to user-specified session times,<br />
which can be viewed as an average of the selected session, or drilled down into ¼ hr, ½ hr or<br />
1 hr segments.<br />
Reach & Frequency (1 week through to 52 weeks)<br />
Program Ranking<br />
Reach & Frequency lets you analyse for any given advertising schedule, the number of<br />
different people reached at least once by that schedule (Reach), the total number of impacts<br />
(Gross Impacts) and the average frequency with which the net audience was exposed to the<br />
commercial message (Average Frequency). Different spot weights and station placements<br />
across multiple weeks are also catered for.<br />
Program Ranking lets you analyse programs by average audience and reach statistics for<br />
different demographics as well as filter by program types i.e.: sport, talk-back, adult<br />
contemporary music etc. Weekly totals or day by day results are available.<br />
Ebb & Flow (1/4hr & Session)<br />
The Ebb & Flow report type allows you to analyse the audience movement between two<br />
nominated time periods, isolating and quantifying station switching. Ebb & Flow analyses can<br />
cross-tabulate entire sessions or specific quarter-hours.<br />
Station Loyalty<br />
The Station Loyalty report type allows you to identify the percentage of time that a station's<br />
cume (reach) spends with that station, and the percentages of time that the same station's<br />
cume (reach) spends with other stations. Another way to identify the overall level of ‘loyalty’ of<br />
a station’s audience.<br />
Continued over…
<strong>Radio</strong> Advisor Features…<br />
Cruise and Power User Modes – Cruise mode is designed for novice or infrequent users, while<br />
Power mode provides full flexibility for the more experienced user.<br />
Multi-Market Analysis - analyse multiple markets within a single job (applicable only to<br />
Sydney/Melbourne/Brisbane/Adelaide/Perth markets).<br />
Market Combinations - combine markets to produce a ‘national’ or ‘eastern seaboard’ report<br />
(applicable only to Sydney/Melbourne/Brisbane/Adelaide/Perth markets).<br />
Multiple Surveys (Trending) - select and process multiple surveys within a single job file.<br />
Multi-Survey Combinations - combine surveys together (from within the same year) to produce<br />
survey average reports.<br />
Station Combinations - combine stations to produce ‘network’ or combo-buy results.<br />
Demographics - a comprehensive and easy-to-navigate selection ‘tree’ makes selecting<br />
demographics quick and easy.<br />
On-screen ‘explanations’ - users can easily have results translated into ‘plain English’ definitions.<br />
Comprehensive Charting - data can be plotted in charts and then formatted for directly dropping<br />
into a proposal or report.<br />
Exporting - is now easier and faster with the option to export multiple tables to .XLS or .PDF file<br />
format direct from the results page… the Batch module also allows you to export survey data for<br />
multiple job files automatically.<br />
Market Totals - market totals are automatically displayed on all reports.<br />
Place of Listening - process multiple Place of Listening filters within a single job.<br />
Spot Importer - import a spot schedule direct from a .XLS spreadsheet.<br />
Automated Database Updating - survey data files are automatically copied into the database via<br />
the ‘uploader’.<br />
System Requirements…<br />
Prerequisite software Microsoft Internet Explorer 6.0 SP1 or later (prerequisite for .NET<br />
Framework)<br />
RAM Minimum: 512 MB<br />
Recommended: 1 GB or higher<br />
Hard Disk space 600 MB for SQL Express<br />
280 MB .Net Framework 2<br />
200 MB for RA database, then 10 MB per survey<br />
50 MB for <strong>Radio</strong> Advisor<br />
Processor Pentium Compatible or higher<br />
Minimum: 1 GHz , recommended: 2 GHz or higher<br />
Operating System Windows XP Professional or Home Edition or Media Edition SP2<br />
Windows 2000 Professional Edition or Server Edition SP4<br />
Windows 2000 Advanced Edition SP4<br />
Windows 2000 Datacenter Server Edition SP4<br />
Windows Vista<br />
Software which will be<br />
installed<br />
<strong>Nielsen</strong> – <strong>2012</strong> <strong>Radio</strong> <strong>Survival</strong> <strong>Kit</strong>.<br />
<strong>Radio</strong> Advisor<br />
.Net Framework Version 2<br />
SQL Express
Standard Demographic Categories<br />
Available in <strong>Radio</strong> Advisor<br />
Age Sex Marital Status<br />
10-12 Male Never married<br />
13-14 Female Married/Defacto<br />
15 Separated<br />
16-17 Divorced<br />
18-19 Widowed<br />
20-24<br />
25-29<br />
30-34<br />
35-39<br />
40-44<br />
45-49<br />
50-54<br />
55-59<br />
60-64<br />
65-69<br />
70+<br />
Car Ownership With children in Occupation<br />
home aged (A)<br />
Owner A-Managers & Administrators<br />
Non owner No children B-Professionals<br />
0-4 only C1-Sales/Clerk &<br />
5-9 only Para-professionals<br />
10-17 only C2-Tradepersons<br />
0-4 & 5-9 D-Plant/Machine operators<br />
0-4 & 10-17 & drivers<br />
5-9 & 10-17 E-Labourers & related workers<br />
Grocery Buyer 0-4,5-9 & 10-17 F-Unemployed/Looking for work<br />
G-Student/under school age<br />
Working H-Not in paid employement/<br />
Not working Retired/Aged pensioner<br />
Not rocery buyer<br />
Language (other than English) With children in Occupation status<br />
spoken at home home aged (B)<br />
Full time<br />
Asian/Pacific No children (5-17) Part time<br />
Mediterranean/Americas 5-12 only Casual/temporary<br />
Other European 13-17 only<br />
Other 5-12 & 13-17<br />
No other language 0-4 & 5-12 Employment status<br />
0-4 & 13-17<br />
0-4,5-12 &13-17 Self employed<br />
Employee<br />
<strong>Nielsen</strong> - <strong>2012</strong> <strong>Radio</strong> <strong>Survival</strong> <strong>Kit</strong>. Page 1 of 2
Standard Demographic Categories<br />
Available in <strong>Radio</strong> Advisor<br />
AREA Household size (persons)<br />
(Sydney) Syd-North 1<br />
Syd-Central/Inner West 2<br />
Syd-South 3<br />
Syd-South West 4<br />
Syd-West 5<br />
(Melbourne) Mel-North 6<br />
Mel-South 7<br />
Mel-East 8+<br />
Mel-West<br />
(Brisbane) Bri-East<br />
Bri-West Type of dwelling<br />
Bri-South<br />
Bri-City & City Nth House<br />
Bri-North Flat/Unit<br />
(Adelaide) Ade-Central Other<br />
Ade-Northern<br />
Ade-East & South Number of children at home<br />
Ade-West & SW<br />
(Perth) Per-North & Nth East None<br />
Per-South & Sth East 1-2<br />
Per-Western 3+<br />
Per-South West<br />
(Newcastle) Newcastle/Pt Stephens<br />
Maitland/Cessnock Number of radio in home<br />
Lake Macquarie<br />
(Wollongong) North-Crown St 1<br />
South-Crown St 2<br />
(Central Coast) Gosford 3<br />
NSW Wyong 4<br />
(Gold Coast/Tweed) North of Burleigh 5<br />
South of Burleigh 6<br />
7<br />
8+<br />
Household income p.a. Education (highest achieved) Live in home which is<br />
<br />
Any combination of the above elements can be used<br />
within <strong>Radio</strong> Advisor to generate a customised<br />
demographic (subject to adequate sample size).<br />
<strong>Nielsen</strong> - <strong>2012</strong> <strong>Radio</strong> <strong>Survival</strong> <strong>Kit</strong>. Page 2 of 2
<strong>Nielsen</strong> – <strong>2012</strong> <strong>Radio</strong> <strong>Survival</strong> <strong>Kit</strong>.<br />
Occupation<br />
Classifications<br />
(Any combination of the following categories is available within <strong>Radio</strong> Advisor)<br />
A - MANAGERS and ADMINISTRATORS<br />
Legislators, Government Appointed Officials, General Managers, Farmers and Farm Managers,<br />
Managing Supervisors.<br />
B - PROFESSIONALS<br />
Natural Scientists, Building Professionals, Engineers, Health Diagnosis and Treatment Practitioners,<br />
School Teachers, Other Teachers & Instructors, Social Professionals, Business Professionals, Artists<br />
and Related Professionals.<br />
C1 - PARA-PROFESSIONALS, CLERKS, SALESPERSONS and<br />
PERSONAL SERVICE WORKERS<br />
People with technical training, e.g. Technicians, Air & Sea Transport Technical Workers, Registered<br />
Nurses, Police and Air Traffic Controllers. Stenographers & Typists, Personal Assistants, Data<br />
Processing and Business Machine Operators, Clerks, Receptionists, Telephonists, and Messengers.<br />
Investment and Real Estate Salespersons, Sales Representatives, Sales Assistants, Tellers,<br />
Cashiers, Ticket Salespersons and Telesales.<br />
C2 - TRADESPERSONS<br />
Metal Fitting and Machining Tradespersons, Electrical and Electronic Tradespersons, Building<br />
Tradespersons, Printing Tradespersons, Vehicle Tradespersons, Food Tradespersons.<br />
D - PLANT and MACHINE OPERATORS and DRIVERS<br />
Road & Rail Transport Drivers, Mobile Plant Operators (except Transport), Stationary Plant<br />
Operators, Machine Operators.<br />
E - LABOURERS and RELATED WORKERS<br />
Trades Assistants and Factory Hands, Agricultural Workers and Related Workers, Cleaners,<br />
Construction and Mining Labourers, Miscellaneous Labourers & Related Workers.<br />
F – UNEMPLOYED/LOOKING FOR WORK<br />
G - STUDENT OR UNDER SCHOOL AGE<br />
H - NOT IN PAID EMPLOYMENT, RETIRED OR AGED PENSIONER<br />
Please Note: The occupation groupings used by The <strong>Nielsen</strong> Company are the Australian Standard<br />
Classification of Occupations (ASCO) published by the Australian Bureau of Statistics.<br />
Specific occupations listed underneath each category are examples only. This is not an exhaustive<br />
list.
BUILDING “WITH CHILDREN” DEMOGRAPHICS<br />
IN RADIO ADVISOR<br />
When building demographics in <strong>Radio</strong> Advisor that include the “With Children” option (eg.<br />
Grocery Buyers With Children….”), you MUST follow the instructions outlined below to obtain<br />
correct results.<br />
It is important to realise that when building “With Children” demographics you are selecting<br />
PEOPLE WHO HAVE CHILDREN IN THE HOME, not the children themselves. It may sometimes<br />
looks as though you are doubling up when making selections but you must remember that a<br />
person who has a 0-4 year old in the house is a DIFFERENT individual from one with a 0-4 year<br />
old AND a 5-9 year old. However, both have a 0-4 year old in the house.<br />
Therefore, if you require “With Children 0-4”, you must have the same elements highlighted as<br />
the example below (in the top left box). Selecting anything less, or more, will produce incorrect<br />
results.<br />
Select the elements indicated with , for each “With Child” demographic listed.<br />
NEVER select elements from both “Children in home aged (A)” AND “Children in home aged (B)”<br />
as your audience figures will be duplicated.<br />
With Children In Home Aged (A)<br />
With Cld 0-4 With Cld 0-9<br />
No children No children<br />
0-4 only 0-4 only<br />
5-9 only 5-9 only<br />
10-17 only 10-17 only<br />
0-4 & 5-9 0-4 & 5-9<br />
0-4 & 10-17 0-4 & 10-17<br />
5-9 & 10-17 5-9 & 10-17<br />
0-4,5-9 & 10-17 0-4,5-9 & 10-17<br />
With Cld 0-17 With Cld 5-9<br />
No children No children<br />
0-4 only 0-4 only<br />
5-9 only 5-9 only<br />
10-17 only 10-17 only<br />
0-4 & 5-9 0-4 & 5-9<br />
0-4 & 10-17 0-4 & 10-17<br />
5-9 & 10-17 5-9 & 10-17<br />
0-4,5-9 & 10-17 0-4,5-9 & 10-17<br />
With Cld 5-17 With Cld 10-17<br />
No children No children<br />
0-4 only 0-4 only<br />
5-9 only 5-9 only<br />
10-17 only 10-17 only<br />
0-4 & 5-9 0-4 & 5-9<br />
0-4 & 10-17 0-4 & 10-17<br />
5-9 & 10-17 5-9 & 10-17<br />
0-4,5-9 & 10-17 0-4,5-9 & 10-17<br />
<strong>Nielsen</strong> – <strong>2012</strong> <strong>Radio</strong> <strong>Survival</strong> <strong>Kit</strong> Page 1 of 2
BUILDING “WITH CHILDREN” DEMOGRAPHICS<br />
IN RADIO ADVISOR<br />
With Children in Home Aged (B)<br />
With Cld 5-12 With Cld 0-12 **<br />
No children (5-17) No children (5-17)<br />
5-12 only 5-12 only<br />
13-17 only 13-17 only<br />
5-12 & 13-17 5-12 & 13-17<br />
0-4 & 5-12 0-4 & 5-12<br />
0-4 & 13-17 0-4 & 13-17<br />
0-4,5-12 &13-17 0-4,5-12 &13-17<br />
AND<br />
With 13-17 Number Of Children At Home<br />
No children (5-17) None<br />
5-12 only 1-2<br />
13-17 only 3+<br />
5-12 & 13-17<br />
0-4 & 5-12<br />
0-4 & 13-17<br />
0-4,5-12 &13-17<br />
** Building “With Children 0-12” is a special situation. “No<br />
children (5-17)” has been selected above, and this is<br />
correct. You must also select two elements from<br />
“Number of Children At Home”. The above example is<br />
the ONLY way to correctly generate a “With Cld 0-12”<br />
demographic. If you require a further explanation of<br />
exactly why the building of this demo differs from<br />
others, please contact <strong>Nielsen</strong>.<br />
<strong>Nielsen</strong> – <strong>2012</strong> <strong>Radio</strong> <strong>Survival</strong> <strong>Kit</strong> Page 2 of 2
Newspaper Readership (NP)<br />
Read a newspaper in the past 7 days<br />
Newspaper X readers/ non readers in the past 7 days - all major newspapers, local, other<br />
Read a newspaper in the past 7 days (paper version)<br />
Read a newspaper in the past 7 days (online)<br />
Newspaper X readers/ non readers in the past 7 days - all major newspapers, local, other (paper version)<br />
Newspaper X readers/ non readers in the past 7 days - all major newspapers, local, other (online)<br />
Local Messenger readership (Adelaide only)<br />
A Community readership (Perth only)<br />
Valid Data Period<br />
i.e Data is only available for years stated<br />
If no end date, still current<br />
1996 - 2009<br />
1998 - 2009<br />
2010 -<br />
2010 -<br />
2010 -<br />
2010 -<br />
1996 - 1996<br />
1996 - 1996<br />
Technology (TE)<br />
Have access to a personal computer in the household<br />
1996 -<br />
Have a mobile phone<br />
2001 -<br />
Intend to purchase/ replace/ keep existing mobile phone in the next 12 months<br />
2001 -<br />
Consider changing mobile phone network carrier in next 12 months 2005 -<br />
Have mobile phone prepaid or plan contract 2005 -<br />
Last access to the internet - past week, 1-4 weeks ago, more than 4 weeks ago<br />
2000 - 2007<br />
How often access the internet - daily / weekly / fortnightly / monthly / less often / never 2008 -<br />
Where internet is accessed from - home / work / school / elsewhere<br />
2000 -<br />
Mobile phone network carrier<br />
2002 -<br />
Internet Surfing frequency<br />
2003 -<br />
Access to Internet in past month<br />
1996 - 1999<br />
Type of Internet connection at home -(Dial-Up/Broadband/No Connection) 2006 -<br />
Have a mobile phone (old definition)<br />
1996 - 2000<br />
Intend to buy/ replace mobile phone in next 12 months<br />
1996 - 2000<br />
CD player at home/ in car<br />
1997 - 1999<br />
Compact discs bought in past six months for self or others, by number - less than 5, 5-10, more than 10, none<br />
1997 - 2001<br />
Play home video games<br />
2000 - 2000<br />
Have a music CD player in the car<br />
2000 - 2000<br />
Have a music CD player at home<br />
2000 - 2000<br />
Whether visited a newspaper website<br />
2001 - 2001<br />
Home phone provider<br />
2002 - 2002<br />
Television (TV)<br />
Commercial TV viewing frequency<br />
ABC TV viewing frequency<br />
PAYTV viewing frequency<br />
Personally viewed a rented video/DVD in the past 7 days<br />
Household currently subscribes to Pay TV<br />
Household intends to subscribe to Pay TV<br />
Household does not intend to subscribe to Pay TV<br />
Purchasing Food (FO)<br />
Dined at a restaurant 1-3 times in the past 4 weeks<br />
Dined at a restaurant 4 or more times in the past 4 weeks<br />
Dined at a restaurant in the past 4 weeks<br />
Takeaway food frequency<br />
Bought or ordered T/Away chicken /pizza / burger/ other in the past 4 weeks<br />
Bought or ordered T/Away Asian in the past 4 weeks<br />
Purchase of food/groceries from a convenience store in past month<br />
Purchase of food/groceries from a service station with convenience store facilities in past month<br />
Bought or ordered T/Away chinese in the past 4 weeks<br />
1996 -<br />
2002 -<br />
2003 -<br />
1996 -<br />
1996 -<br />
1996 -<br />
1996 -<br />
1996 -<br />
1996 -<br />
1996 -<br />
1996 -<br />
1996 -<br />
2004 -<br />
2000 -<br />
1996 -<br />
1996 - 1997<br />
Leisure Activities (LA)<br />
Visited a hotel in the past 7 days<br />
1996 -<br />
Visited a licenced club in the past 7 days (not Perth)<br />
1996 -<br />
Regularly participate in TAB betting<br />
1996 -<br />
Regularly participate in Lotto, Instant Lotteries/ Scratchies, Lottery etc.<br />
1996 -<br />
Regularly visit the casino<br />
1996 -<br />
Regularly participate in Internet Gambling / Betting ('Betting' reference added in <strong>2012</strong>) 2006 -<br />
Been to a cinema in the past month<br />
2001 -<br />
Attended Major Sporting Event in the past 12 months<br />
2003 -<br />
Participant in horse racing<br />
1996 - 1997<br />
Interest in horse racing<br />
1998 - 2002<br />
Beverages (BE)<br />
Regular buyers of alcohol from bottle shops/hotels for home use<br />
Regular buyers of beer / wine /spirits for home use<br />
Regular buyers of pre-mixed spirits/ready to drink for home use<br />
Travel (TR)<br />
Likely to travel interstate by air within the next 12 months<br />
Likely to travel overseas by air within the next 12 months<br />
Holiday travel destination in next 12 months<br />
Holiday within the state (Perth only)<br />
Holiday - whereabouts (Perth only)<br />
Inter-State travel frequency<br />
Overseas air travel (frequency)<br />
Single Source Categories<br />
Available Through <strong>Radio</strong> Advisor<br />
1996 -<br />
1996 -<br />
2003 -<br />
2000 -<br />
2000 -<br />
2002 -<br />
1996 - 1996<br />
1996 - 1996<br />
1996 - 1999<br />
1996 - 1999<br />
Page 1 of 2
Single Source Categories<br />
Available Through <strong>Radio</strong> Advisor<br />
House & Home (HH)<br />
Likely to buy or sell a house or unit in the next 2 years<br />
Intend to undertake major home renovations in the next 12 months<br />
Type of renovations in next 12 months - Painting<br />
Type of renovations in next 12 months - Landscaping / Gardening<br />
Type of renovations in next 12 months - Extensions / Repair work<br />
Type of renovations in next 12 months - <strong>Kit</strong>chen / Bathroom<br />
Type of renovations in next 12 months - General household refurbishment<br />
Type of renovations in next 12 months - Other type<br />
Pet ownership - dog, cat or other<br />
First home buyers<br />
Valid Data Period<br />
i.e Data is only available for years stated<br />
If no end date, still current<br />
1996 -<br />
1996 -<br />
2003 -<br />
2003 -<br />
2003 -<br />
2009 -<br />
2003 -<br />
2003 - 2008<br />
2001 -<br />
1996 - 1996<br />
Purchase Decisions (PD)<br />
Intend to purchase whitegoods within the next 12 months<br />
1996 -<br />
Intend to purchase general furniture within the next 12 months<br />
1996 -<br />
Intend to purchase TV/ HiFi/ VCR/ DVD within the next 12 months<br />
1996 -<br />
Intend to purchase motor vehicle in next 12 months<br />
1996 -<br />
Intend to purchase a personal computer in the next 12 months<br />
1998 - 2006<br />
Intend to purchase computer software in the next 12 months<br />
1998 -<br />
Intend to purchase small electrical goods in the next 12 months<br />
2001 - 2010<br />
Intend to purchase computer/video games in next 12 months<br />
2003 -<br />
Intend to purchase other computer hardware/accessories in next 12 months<br />
2003 - 2006<br />
Intend to purchase a personal computer, hardware or computer accessories in the next 12 months<br />
2007 -<br />
Intend to purchase air conditioning / heater in the next 12 months 2005 -<br />
Intend to purchase computer tablet device in the next 12 months 2011 -<br />
Shopped for fashion clothing or accessories in past month<br />
2001 - 2007<br />
Made purchase from a hardware store in past month<br />
2003 -<br />
Made purchase from a garden nursery in past month<br />
1996 -<br />
Made purchase from a pharmacy/chemist in past month<br />
2002 -<br />
Made purchase from a department store in past month<br />
2003 -<br />
Made purchase from a discount retailer in past month<br />
2003 -<br />
Made purchase from a fashion/clothing store in past month<br />
2008 -<br />
Made purchase from a furniture/appliance store in past month<br />
2003 -<br />
Made purchase from a newsagency in past month<br />
2003 -<br />
Made purchase from a bookstore in past month<br />
2003 -<br />
Made purchase from a music/record store in past month<br />
2003 -<br />
Have bought goods/services over the Internet<br />
2003 - 2004<br />
When last purchased goods or services over the internet (past mth, more than mth never) 2005 -<br />
Intend to purchase a computer/ hardware in the next 12 months<br />
1996 - 1997<br />
Intend to purchase new motor vehicle in the next 12 months<br />
1996 - 2001<br />
Intend to purchase used motor vehicle in the next 12 months<br />
1996 - 2001<br />
Made purchase from hardware store in past 14 days<br />
1996 - 2002<br />
Whether people would shop online with a credit card<br />
2001 - 2002<br />
Purchased a DVD or video in past month<br />
2005 - 2006<br />
Purchased a DVD or video, or purchased and downloaded a movie, TV show or music video in the past month<br />
2007 - 2007<br />
Purchased a DVD or video, TV show or music video from a store in past month<br />
2008 -<br />
Watched or downloaded a movie or TV show from the internet in past month 2008 -<br />
Intend to purchase MP3 player / iPod in next 12 months 2007 -<br />
Digital <strong>Radio</strong> (i.e. receives digital radio broadcast) 2009 -<br />
Finance & Insurance (FI)<br />
Have private health insurance<br />
1996 -<br />
Have comprehensive motor vehicle insurance<br />
1999 -<br />
Credit card holders<br />
2002 -<br />
Amex/ Diners Card holders<br />
2003 -<br />
Visa/ Mastercard/ Bankcard holders (note that 'Bankcard' was removed from the definition in 2009)<br />
2003 -<br />
Have a personal loan<br />
1996 -<br />
Have personal investment (excluding Superannuation) - less than $50,000 / $50,000-$150,000 / more than $150,000<br />
2008 -<br />
Have personal investment - less than $10,000 / $10,000-$50,000 / more than $50,000<br />
2003 - 2007<br />
Intend to purchase financial/investment services in next 12 months<br />
2003 -<br />
No. of people working in the household<br />
1998 -<br />
Have a mortgage with a bank/ credit union<br />
2001 -<br />
Have a mortgage with lender (other than bank/credit union)<br />
2000 -<br />
Have no mortgage<br />
2001 -<br />
Would consider changing mortgage lender<br />
Have personal investment $5000+<br />
Have home contents insurance<br />
Have home and/or contents insurance<br />
Amex/ Diners Card holders<br />
Visa/ Mastercard/ Bankcard holders<br />
Employ up to 50 people nationally at place of work<br />
Employ 50 or more people nationally at place of work<br />
These categories are available with survey data collected for<br />
the five capital cities. Other markets will most likely be the<br />
same, however some categories may change.<br />
It is important to remember that when using these filters with<br />
<strong>Radio</strong> Advisor data, the overall sample size of your<br />
demographic will be reduced in most instances, sometimes<br />
significantly. Users should pay strict attention to the sample<br />
size for each demo/category.<br />
2003 -<br />
1996 - 1997<br />
1996 - 1998<br />
2010 -<br />
1996 - 2000<br />
1996 - 2001<br />
1997 - 2001<br />
1997 - 2001<br />
Have personal investment over $10,000<br />
1998 - 2002<br />
Have personal investment of $5,000 up to $10,000<br />
1998 - 2002<br />
Have a mortgage with a bank<br />
2000 - 2000<br />
Have a mortgage with a credit union<br />
2000 - 2000<br />
How people pay their bills - phone, internet, other<br />
2001 - 2002<br />
Page 2 of 2
METRO LIFESTYLE QUESTIONNAIRE<br />
The following two pages include a number of simple questions which we would like you to answer at any time<br />
during the week. When used with the information on radio listening, these answers will help broadcasters<br />
understand the way in which programmes and stations are chosen by different types of people. Please<br />
remember, the published results only show the total information from groups of people taken together, never<br />
individual information, so all your answers remain confidential.<br />
Thank you again for helping to provide this information which is so greatly<br />
appreciated by the radio industry.<br />
Please answer the following questions by placing a cross in the appropriate boxes <br />
Q1 Which of the following newspapers have you read or<br />
looked into in the past 7 days? (Cross all applicable)<br />
Metro Daily 1<br />
Metro Daily 2<br />
Metro Sunday 1<br />
Metro Sunday 2<br />
Aust. Financial Review<br />
The Australian<br />
Local Community Paper<br />
Other Newspaper<br />
Paper Online No<br />
1<br />
1<br />
1<br />
1<br />
1<br />
1<br />
1<br />
1<br />
2<br />
2<br />
2<br />
2<br />
2<br />
2<br />
2<br />
2<br />
3<br />
3<br />
3<br />
3<br />
3<br />
3<br />
3<br />
3<br />
Q2 On an average day (between Monday and Sunday),<br />
how much time would you spend watching each of the<br />
following types of television? (Do not include time spent<br />
watching videos or DVDs)<br />
(Cross one box only in each column)<br />
Commercial<br />
(7, 9, 10, SBS)<br />
More than 5 hours per day 1<br />
3 to 5 hours per day 2<br />
1 to 3 hours per day 3<br />
Up to 1 hour per day 4<br />
Don’t usually watch 7<br />
ABC Pay TV<br />
1<br />
2<br />
3<br />
4<br />
7<br />
1<br />
2<br />
3<br />
4<br />
7<br />
Q3 Regarding PAY TV, do you (or your household)…?<br />
(Cross one box only) Already subscribe 1<br />
Intend to subscribe 2<br />
Do not intend to subscribe 3<br />
Don’t know whether you will subscribe 4<br />
Q4a Have you personally viewed a rented<br />
DVD or video in the past 7 days?<br />
Q4b Have you purchased a DVD or video,<br />
TV show or music video from a store in<br />
the past month?<br />
Q4c Have you watched or downloaded a<br />
movie/TV show from the internet in the<br />
past month?<br />
Q5 Have you visited a cinema to watch a<br />
movie in the past month?<br />
Q6 In the past 12 months, have you<br />
attended a major sporting event (e.g.<br />
football match, cricket, tennis, golf etc)?<br />
Yes 1<br />
No 2<br />
Yes 1<br />
No 2<br />
Yes 1<br />
No 2<br />
Yes 1<br />
No 2<br />
Yes 1<br />
No 2<br />
Q7 Regarding pets, do you have a? (Cross all applicable)<br />
Dog 1<br />
Other Pet 3<br />
Cat 2<br />
No Pets 4<br />
Q8 Will you purchase any of the following products or<br />
services in the next 12 months? (Cross all applicable)<br />
Whitegoods (e.g. fridge, dryer, microwave)<br />
Air Conditioning / Heater<br />
General furniture (e.g. lounge, bed, table)<br />
Digital <strong>Radio</strong> (i.e. receives digital radio broadcast)<br />
Audio/Visual Equipment (e.g. TV, stereo)<br />
Computer tablet device (e.g. iPad, Kindle)<br />
3<br />
Finance and investment<br />
Motor vehicle<br />
Personal computer / hardware / accessories<br />
Computer or video games<br />
Computer software<br />
MP3 Player / iPod<br />
Q9 Do you have a personal computer (not<br />
just computer games or game consoles) in<br />
your household?<br />
Q10a How often do you access the Internet?<br />
(Cross one box only)<br />
Daily 1<br />
Weekly 2<br />
Fortnightly 3<br />
Monthly 4<br />
Yes No<br />
1<br />
1<br />
1<br />
1<br />
1<br />
1<br />
1<br />
1<br />
1<br />
1<br />
1<br />
1<br />
IF YOU HAVE ACCESSED THE INTERNET -<br />
Q10b From where do you access the Internet?<br />
(Cross all applicable)<br />
Q10c<br />
Home 1<br />
Work 2<br />
2<br />
2<br />
2<br />
2<br />
2<br />
2<br />
2<br />
2<br />
2<br />
2<br />
2<br />
2<br />
Yes 1<br />
No 2<br />
Less often 5<br />
Never 6<br />
School / College / University 3<br />
Elsewhere 4<br />
What type of Internet connection do you have at<br />
home? (Cross one box only)<br />
Dial Up 1 Broadband 2 No Connection 3<br />
Q10d In an average week how long would you spend<br />
‘surfing’ the Internet (do not include time using e-mail)?<br />
(Cross one box only) Up to one hour 1<br />
Q10e<br />
1 to 3 hours 2<br />
3-5 hours 3<br />
More than 5 hours 4<br />
Do not use the Internet for ‘surfing’ 5<br />
When did you last personally purchase goods or<br />
services over the Internet?<br />
Past month 1<br />
More than one month ago 2<br />
Never 3<br />
Q11 In the past month, have you purchased any food or<br />
groceries from a…?<br />
Yes No<br />
Convenience Store<br />
Service station with full<br />
convenience store facilities<br />
1<br />
1<br />
2<br />
2
Q12 In the past month, have you personally made any<br />
purchases from the following store types?<br />
Yes No<br />
Hardware store<br />
Garden nursery<br />
Pharmacy / Chemist<br />
Department store (e.g. Myer)<br />
Discount retailer (e.g. K-mart, Target)<br />
Fashion / Clothing store<br />
Furniture / Appliance store<br />
Newsagency<br />
Book store<br />
Music / Record store<br />
1<br />
1<br />
1<br />
1<br />
1<br />
1<br />
1<br />
1<br />
1<br />
1<br />
Q13a Regarding mobile phones, in the next 12 months do<br />
you intend to…? (Cross one box only)<br />
2<br />
2<br />
2<br />
2<br />
2<br />
2<br />
2<br />
2<br />
2<br />
2<br />
Keep your existing mobile phone 1<br />
Replace your existing mobile phone 2<br />
Purchase a mobile phone (don’t currently have) 3<br />
Don’t have and won’t buy a mobile phone 4<br />
IF YOU HAVE A MOBILE PHONE –<br />
Q13b Who is your current mobile phone network carrier?<br />
(Cross one box only)<br />
Optus 2<br />
3 3<br />
Telstra 4<br />
Vodafone 5<br />
Virgin 6<br />
Other mobile phone carrier 7<br />
Q13c Are you considering changing your mobile phone<br />
network carrier in the next 12 months?<br />
Yes 1 No 2<br />
Q13d Is your mobile phone contract…?(Cross one box only)<br />
Plan 1<br />
Prepaid 2<br />
Q14 How often have you eaten out at a restaurant in the<br />
past month? (Cross one box only)<br />
One to three times 1<br />
Four or more times 2<br />
Not in the past month 3<br />
Q15a In the past month, how often have you bought or<br />
ordered for home delivery, any take-away / fast food?<br />
(Cross one box only) One to three times 1<br />
IF YOU HAVE BOUGHT/ORDERED –<br />
Four or more times 2<br />
Not in the past month 3<br />
Q15b What type of food was that? (Cross all applicable)<br />
Chicken 1<br />
Pizza 2<br />
Burgers 3<br />
Asian 4<br />
(e.g. Chinese, Thai, Japanese, Indian etc)<br />
Other type 5<br />
Q16 Where do you intend to travel for a holiday in the next<br />
12 months? (Cross all applicable)<br />
Overseas 1<br />
To another state 2<br />
Within your own state 3<br />
Do not intend to travel 4<br />
Q17 Are you likely to travel by air in the next 12 months?<br />
(Cross all applicable) Yes, interstate 1<br />
Yes, overseas 2<br />
No, do not intend to travel 3<br />
IF YOU ARE UNDER 18 YEARS OF AGE, THERE IS NO NEED TO<br />
ANSWER THE FOLLOWING QUESTIONS. THANK YOU.<br />
Q18 Are you or a member of your household<br />
likely to purchase or sell a house / unit<br />
within the next two years?<br />
Yes 1<br />
No 2<br />
Q19 What type of major home renovations will you<br />
undertake in the next 12 months?<br />
(Cross all applicable) Painting 1<br />
Landscaping / gardening 2<br />
Extensions / repair work 3<br />
<strong>Kit</strong>chen / Bathroom renovations 7<br />
General household refurbishment 4<br />
None 6<br />
Q20 In the past month, have you visited a…?<br />
Yes No<br />
Hotel (i.e. pub / bar)<br />
Licensed club<br />
1<br />
1<br />
2<br />
2<br />
Q21 Which of the following do you regularly (once a month<br />
or more) purchase to take home or to parties?<br />
(Cross all applicable) Beer 1<br />
Wine 2<br />
Spirits 3<br />
Pre-mixed spirits / ready to drink 4<br />
None 5<br />
Q22 Have you participated in any of the following types of<br />
gambling in the past 2 months? (Cross all applicable)<br />
Yes No<br />
TAB betting<br />
Visited a casino / Licensed Club<br />
Internet Betting / Gambling<br />
Lotto, Instant Lotteries / Scratchies,<br />
Lottery Tickets etc<br />
1<br />
1<br />
1<br />
1<br />
2<br />
2<br />
2<br />
2<br />
Q23a Do you have a mortgage with a …?<br />
(Cross all applicable) Bank or Credit Union 1<br />
Q23b IF YOU HAVE A MORTGAGE -<br />
Would you consider changing lending<br />
provider?<br />
Other lender 2<br />
No mortgage 3<br />
Yes 1<br />
Q24 Do you personally have…?<br />
Comprehensive vehicle insurance<br />
Yes<br />
No 2<br />
No<br />
Home and/or <strong>Contents</strong> Insurance<br />
Private health insurance (exc. Medicare)<br />
Visa / MasterCard<br />
American Express / Diners Club Card<br />
Personal loan<br />
1<br />
1<br />
1<br />
1<br />
1<br />
1<br />
2<br />
2<br />
2<br />
2<br />
2<br />
2<br />
Q25 What level of personal investments (e.g. banks, shares,<br />
etc) do you have (not including superannuation)?<br />
(Cross one box only) More than $150,000 1<br />
$50,000 to $150,000 2<br />
Less than $50,000 3<br />
Have no personal investments 4<br />
THANK YOU ONCE AGAIN FOR YOUR COOPERATION
Some of the more frequently used radio survey terms are outlined below. <strong>Radio</strong> Advisor also<br />
includes a more comprehensive list - just select “Help”, then look under “Terms and<br />
Definitions”. If you have any further questions regarding radio terms and definitions, please<br />
contact your <strong>Nielsen</strong> representative.<br />
Average Audience (or Average Quarter Hour Audience)<br />
used in Session Ranking, Program Ranking, Station Loyalty<br />
The average number of people listening per quarter-hour in any given time-period or session.<br />
e.g. At any given time Mon-Sun 5:30am-12mn there are, on average, 61,000 listeners tuned into<br />
Station A.<br />
Cumulative Audience (or Cumes)<br />
used in Session Ranking, Ebb & Flow; Program Ranking; Station Loyalty<br />
The total number of different people who listen for at least one quarter hour during the<br />
course of a chosen time-period or session.<br />
e.g. 600,000 different people tuned into Station B at some stage during Mon-Sun 5:30am-12mn.<br />
Station Share<br />
used in Session Ranking, Station Loyalty<br />
Share of audience is the percentage of the total radio listening audience in a given time<br />
period tuned to a particular station. Share is a station’s average audience expressed as a<br />
percentage of the total radio audience for the same period of time.<br />
e.g. Between Mon-Sun 5:30am-12mn 9.4% of all radio listening is tuned into Station C.<br />
Time Spent Listening<br />
used in Session Ranking<br />
The average amount of time that those people who listen to radio or a specific station<br />
(cumulative audience), spend listening during a specified time-period. Shown in hours and<br />
minutes (not decimal time) eg. 1:30 is one hour, thirty minutes.<br />
e.g. Station A has 799,000 listeners (cumes) each of these people listen on average for 7 hours & 6<br />
minutes (7:06).<br />
Exclusive Audience<br />
used in Session Ranking; Station Loyalty<br />
The number (000’s) or proportion (%) of listeners who tune in to only one station during a<br />
specified time period. ie. The number of people who listen exclusively to that station.<br />
e.g. Station B has 115,000 listeners who listen exclusively Mon-Sun 5:30am-12mn.<br />
Multi-Station Cume<br />
used in Session Ranking<br />
Terms and Definitions<br />
The total number of different (unduplicated) people who listen to 2 or more stations during<br />
the course of a chosen time-period or session.<br />
Note: Multi-station Cume must be calculated in <strong>Radio</strong> Advisor. Cumes cannot simply be<br />
added together as there will be a number of people who indicate listening to multiple stations<br />
during the specified time period.<br />
<strong>Nielsen</strong> – <strong>2012</strong> <strong>Radio</strong> <strong>Survival</strong> <strong>Kit</strong>. Page 1 of 2
Net Reach (1+ Reach)<br />
used in Reach & Frequency<br />
Terms and Definitions con’t<br />
Refers to the number (000’s) or proportion (%) of different people reached at least once by a<br />
specified number of advertisements. Net reach can be expressed in terms of numbers of<br />
people and/or as a percentage of the population group being targeted. Ie. Net Reach is<br />
similar to Cumulative Audience but is usually quoted in association with the effectiveness of<br />
an advertising campaign, whereas Cumulative Audience is used when analysing timeperiods<br />
or sessions.<br />
Maximum Reach<br />
used in Reach & Frequency<br />
Refers to the total number of people it is possible to reach on the station/s and session/s<br />
selected within a schedule. I.e the total station cume or multiple station cume for the session<br />
chosen.<br />
e.g. If Station B has a total cume 669,0000 it is not possible to reach any more listeners as the station<br />
only has 669,000 listeners. To achieve the maximum reach an advertiser would have to put an<br />
advertisement on every ¼ hour.<br />
Gross Impacts<br />
used in Reach & Frequency<br />
The sum of the quarter-hour audience for all spots in a given advertising schedule. This<br />
figure will most likely include duplication of listeners. It is the total number of times a listening<br />
audience has the opportunity to “hear” an advertisement.<br />
Average Frequency<br />
used in Reach & Frequency<br />
The average number of times that radio listeners “reached” by an advertising campaign are<br />
exposed to an advertisement. Or how many times they have “heard” the advertisement.<br />
e.g. The average frequency for Stations A, B & C is 4.2 times.<br />
Effective Frequency<br />
used in Reach & Frequency<br />
Shows how the reach for a number of advertisements is made up in terms of the numbers<br />
(000’s) and proportion (%) of people who were reached or heard 1 or more, 2 or more, 3 or<br />
more times etc, by a series of advertisements. (e.g 1+,2+, 3+ etc)<br />
Exclusive Frequency<br />
used in Reach & Frequency<br />
Shows how the reach for a number of advertisements is made up in terms of the numbers<br />
(000’s) and proportion (%) of people who were reached or heard exactly once, exactly twice,<br />
exactly 3 times etc, by a series of advertisements. (e.g 1, 2, 3 etc)<br />
Cost Per Thousand (CPM)<br />
used in Reach & Frequency<br />
The cost of each 1000 impacts delivered by an advertising schedule (I.e. the cost of the<br />
schedule divided by the gross impacts gives you a cost per thousand).<br />
<strong>Nielsen</strong> – <strong>2012</strong> <strong>Radio</strong> <strong>Survival</strong> <strong>Kit</strong>. Page 2 of 2
1. SAMPLE DESIGN<br />
<strong>Nielsen</strong> - <strong>2012</strong> <strong>Radio</strong> <strong>Survival</strong> <strong>Kit</strong>.<br />
RADIO SURVEY METHODOLOGY AND OTHER TECHNICAL INFORMATION<br />
The sample on which all radio survey information is based, is a stratified multistage probability sample selected in the following manner:<br />
Page 1 of 5<br />
The total sample requirement of Census Collector's Districts (CDs) is allocated to the regions making up the survey area (see area definitions elsewhere in survival kit) in proportion to<br />
the 2010 Estimated Resident Population. Within each region, the sample of CDs is then allocated to the Statistical Local Areas (SLAs) which make up that region in proportion to the<br />
2010 Estimate of occupied private dwellings. SLAs, which are too small to attract sample, are grouped with SLAs adjacent on a geographically ordered list.<br />
Within each region SLAs (or groups of SLAs) are divided into bands according to the number of CDs required. The CDs are ordered in a geographic serpentine order, and grouped<br />
into bands of adjacent CDs such that the bands have equal numbers of occupied private dwellings according to the 2010 Estimated Resident Population. One CD is selected in each<br />
band in Sydney, Melbourne, Brisbane, Adelaide and Perth. If a selected CD has recently been used in a <strong>Nielsen</strong> Media survey, a further selection is obtained in the same manner. In<br />
some cases CDs are combined to build up the size of the area to a minimum level.<br />
Geographic serpentine ordering of areas is done by starting with the area in the north eastern corner (top right) and proceeding from east to west, and then west to east, gradually<br />
moving southwards, in a winding or serpentine fashion. This method ensures an even spread of the sample across the target area.<br />
Metropolitan Markets<br />
In Sydney, Melbourne, Brisbane, Adelaide and Perth during the first survey wave, a<br />
quarter of the selected CDs, spread throughout the entire survey area, are surveyed each<br />
week. In subsequent survey waves one fifth of the CDs are surveyed each week. Data<br />
from two survey waves are combined in producing a report although only the last two<br />
weeks of data carry over from the first survey into Wave #2 in the markets of Sydney,<br />
Melbourne, Brisbane, Adelaide and Perth.<br />
Selected CDs are mapped, blocks numbered and starting points selected at random. To<br />
achieve the planned sample, a minimum of four diaries is placed in each interviewing area<br />
each week.<br />
Regional Markets<br />
In the majority of regional markets the selected CDs are surveyed across the whole survey<br />
period. In certain larger markets the selected CDs are surveyed across half the survey<br />
period, then re-visited for the other half.<br />
Selected CDs are mapped, blocks numbered and starting points selected at random. To<br />
achieve the planned sample, a minimum number of diaries are placed in each interviewing<br />
area each week. The actual number is depends on the total sample and number of CDs<br />
to be surveyed.<br />
Interviewing follows a prescribed order of blocks within each CD. Sampling is sequential over time with up to three calls being made on every selected household. These calls are<br />
spaced over alternate waves of the survey. Interviewers rotate their calls over different times of the day to give full opportunity for all types of households to participate.<br />
For some regional markets, mainly in some of the more outer lying areas, participants are<br />
recruited by telephone and diaries are mailed to respondents. The sample for these is<br />
designed as a random sample of population with telephones in the defined survey area.<br />
Initially, the survey area is defined in groups of SLAs/CDs as per above. These areas are<br />
then converted into telephone exchange areas as defined by Telstra. Telephone number<br />
ranges available to each exchange are then used to generate telephone numbers at<br />
random. The amount of random telephone numbers generated for each exchange is<br />
selected in proportion to the population within each exchange area.
2. SAMPLE SIZE<br />
Minimum effective target samples for each city per report period as a result of the above sample plan are:<br />
SYDNEY 2,400 individuals of 10 years of age and over.<br />
MELBOURNE 2,400 individuals of 10 years of age and over.<br />
BRISBANE 2,000 individuals of 10 years of age and over.<br />
ADELAIDE 1,750 individuals of 10 years of age and over.<br />
PERTH 1,850 individuals of 10 years of age and over.<br />
NEWCASTLE 1,500 individuals of 10 years of age and over<br />
CANBERRA 1,100 individuals of 10 years of age and over<br />
GOLD COAST/TWEED 1,500 individuals of 10 years of age and over<br />
Other regional samples are determined by each markets individual requirement.<br />
3. DIARY DESIGN<br />
<strong>Nielsen</strong> - <strong>2012</strong> <strong>Radio</strong> <strong>Survival</strong> <strong>Kit</strong>.<br />
Page 2 of 5<br />
A diary is used by each individual in the survey. Each diary contains adequate space for the individual to record all his or her radio listening, both at home and away from home, by<br />
placing crosses in appropriate squares for every quarter-hour of listening (eight minutes or more) 24 hours a day. Stations, quarter-hours, day and place of listening for a period of 9<br />
days commencing on a Friday record the data. The actual days processed are Sunday to Saturday.<br />
Metropolitan Markets<br />
Each diary has the quarter-hours listed along the side for each day. A set of stickers<br />
listing station names are included with each diary. Respondents are to peel of the sticker<br />
for each station listed to and place it in columns in the diary. Up to eight columns are<br />
provided for stickers in each diary. Blank stickers are available for respondents to write in<br />
any station listed to that is not on the pre-printed list. Additional pages are provided in the<br />
diary to record listening if more than 8 stations are listened to.<br />
There is also provision in the diaries to indicate the device used to listen (AM/FM radio,<br />
Internet and Digital radio).<br />
Regional Markets<br />
Stations are pre-listed in the diary across the top and bottom of each page and quarterhours<br />
are listed down the side. Stations are listed in descending order of frequency in half<br />
of the diaries and in ascending order of frequency on the other half. This minimises any<br />
"order of listing" bias. Two additional columns are included in each diary for recording<br />
listening to any other stations (FM & AM) not listed in the diary. Respondents are asked<br />
to write in the call signs of such stations.<br />
In order to improve the recording of all listening, a reminder appears on each diary page to record all listening which takes place away from home as well as in the home.<br />
4. DIARY PLACEMENT<br />
Diary placements are made personally by specially selected and trained interviewers who are supervised by permanent Field Supervisors.<br />
Metropolitan Markets<br />
One diary is left with ONE person only aged 10 years and over in each sampled<br />
household. This person is selected by using the last birthday method (ie. the person in<br />
the home who had the last birthday). In the diary placement, the interviewer personally<br />
demonstrates how the diary should be completed (a demonstration page is included in<br />
each diary). When the diaries are placed, the interviewers explain that they will be calling<br />
personally to collect the completed diary at the end of the survey.<br />
Regional markets<br />
One diary is left for EACH person aged 10 years and over in each sampled household. In<br />
the diary placement, the interviewer personally demonstrates how the diary should be<br />
completed (a demonstration page is included in each diary). A pre-printed demonstration<br />
page is also left with respondents. When the diaries are placed, the interviewers explain<br />
that they will be calling personally to collect the completed diary at the end of the survey.
<strong>Nielsen</strong> - <strong>2012</strong> <strong>Radio</strong> <strong>Survival</strong> <strong>Kit</strong>.<br />
Page 3 of 5<br />
All calls to establish contact are made on Thursday, Friday and Saturday, with the time rotated between day, night and Saturday according to an established procedure. Each<br />
interviewer works through his/her list of areas in a different order to the previous week. In this way the timing of calls on any one home alters from week to week to increase the contact<br />
rate.<br />
People accepting diaries receive a leaflet explaining the purpose of the survey and the importance of accurate recording of listening. In Regional markets, people not at home when<br />
diaries are accepted by their families are reassured through the card that the project is legitimate and worthwhile and that confidentiality is assured.<br />
People temporarily declining also receive a leaflet that explains the importance of the ratings survey. These households are contacted again in the following survey periods in attempts<br />
to obtain participation. Unattended homes are also left the leaflet so that when the interviewer calls again the household members are better prepared to accept diaries.<br />
Homes not contacted on previous calls are called on again to obtain their participation before calls are made on any different new addresses elsewhere in the collector's district. Each<br />
designated dwelling is thus called on up to three different times over several weeks in an attempt to establish contact and obtain participation. Of these three calls at least one of these<br />
calls should be on a Thursday or Friday before 5:00pm, after 5:00pm; or anytime on a Saturday.<br />
Special procedures are used on retirement villages and security flats where access to potential respondents is sometimes difficult.<br />
Relevant classification information for all household members is collected personally at the diary placement interview. Show Cards are shown to respondents to facilitate replies to the<br />
age and occupation questions. The <strong>Nielsen</strong> interview record forms are designed both to assist the interviewer in following the various procedures and to enable thorough supervision<br />
and auditing of fieldwork.<br />
5. MID-WEEK CHECK CALL<br />
In regional markets where some areas are recruited by telephone, relevant classification<br />
information for all respondents is collected over the phone by trained field interviewing<br />
staff and then diaries are mailed to respondents, who then return them in post paid<br />
envelopes at the completion of the diary week.<br />
A mandatory phone call is made on participating households on Tuesday or Wednesday during the week that the diaries are being kept. The purpose of this mid-week call is to ensure<br />
that the respondents in the household are participating in the survey and during this call the interviewer can offer any assistance to the household in regards to the completion of the<br />
diaries.<br />
6. DIARY COLLECTION<br />
Completed diaries are collected on the Sunday following the end of each survey week. Participating households are advised in advance of the intended timing of this call.<br />
Interviewers call personally to collect the diaries from respondent homes. An additional purpose of the collection call is to check the recording in diaries with diary owners to verify any<br />
recordings that may not be clear. Up to two personal calls are made (with a three hour time lapse in between) in an effort to collect all the diaries. State field Supervisors or appointed<br />
trained Media Clerical Support validate many of the completed diaries by telephone and personal calls in accordance with the Industry Quality Assurance Standards.<br />
Interviewers use "calling cards" when they make collection calls when no one is at home, and leave prepaid return envelopes at such addresses if they are not going to make another<br />
personal collection call. A "thank you" card is left at addresses where diaries are collected from meter boxes, under mats etc. if no one is at home. In addition, during the each week of<br />
a survey, when interviewers leave a reply-paid envelope, they will also telephone the homes concerned to impress on them the need for a prompt return of diaries.
Over all cities surveyed, an average of 83% of diaries that are placed are returned useable and entered into the computer to comprise the sample.<br />
<strong>Nielsen</strong> - <strong>2012</strong> <strong>Radio</strong> <strong>Survival</strong> <strong>Kit</strong>.<br />
Page 4 of 5<br />
Whilst the survey method used is loosely called the "diary method", it should more correctly be called the "diary/personal interview method" since diaries are placed and collected<br />
personally in contrast to diary methods used in other parts of the world where diaries are posted to respondents.<br />
7. DATA PREPARATION<br />
After completed diaries are returned to our Sydney office, they are subject to editing by a separate staff of experienced editors, quite independent of field interviewers or data<br />
preparation personnel. In-office editing procedures aim to check the consistency of diary records and to validate the consistency of station identification.<br />
8. COMPUTING<br />
After the in-office editing process, all records are transferred directly into the computer using equipment in our Sydney office. All batch computer runs for reports are conducted on our<br />
in-house computer in Sydney.<br />
9. RAISING FACTORS<br />
Population details for each market are entered into the computer at the start of each year and as each survey is processed, details of the sample composition are also entered into the<br />
computer. By dividing each population figure by its corresponding sample size, the computer calculates raising factors for each age/sex group and for each grocery buyer group. This<br />
means that each person is given a separate "weight" in order to ensure his or her true importance in all projected results as shown in this report. Thus if one particular group is undersampled,<br />
each person in it is given a higher weighting: or if a group is over-sampled, each person is given a lower weighting. All projected results in this report are shown to the<br />
nearest 1,000 persons in Sydney, Melbourne, Brisbane, Adelaide, Perth and Newcastle (nearest 100 persons elsewhere).<br />
10. SPECIFICATIONS<br />
The specifications of this survey meet the requirements of an Industry Committee comprising representatives of Commercial <strong>Radio</strong> Australia Ltd and by invitation, the Australian<br />
Broadcasting Corporation.<br />
<strong>Radio</strong> surveys are audited by an independent auditor (appointed by Commercial <strong>Radio</strong> Australia.) who has free and unrestricted access to all field documents and office procedures.<br />
Details of the Auditor's reports are available upon request to Commercial <strong>Radio</strong> Australia Ltd.<br />
11. ERRORS, OMISSIONS etc.<br />
Each report is issued subject to any errors and omissions. Although every reasonable precaution has been taken to present accurate information, it is possible that there may be some<br />
inaccuracies, such as faulty designation of programmes. In these cases-<br />
As listeners provide the information about the stations to which they listen and the times they listen, and<br />
As the stations provide details of the programmes and their days and times of broadcast, a programme incorrectly listed has no bearing on the validity of the figures in the report.
12. GROCERY BUYERS<br />
<strong>Nielsen</strong> - <strong>2012</strong> <strong>Radio</strong> <strong>Survival</strong> <strong>Kit</strong>.<br />
Page 5 of 5<br />
Grocery Buyers in this report are defined as follows: One person in each home sampled has been classified as the person responsible for most of the grocery shopping. This person<br />
is the household member who has responsibility for deciding what is purchased. A person who is responsible for grocery shopping who is working, for the purpose of the survey, is a<br />
person who has paid or unpaid employment on a full, part-time, or limited basis during the week prior to interview.<br />
13. AUDIENCES BY QUARTER HOURS - IMPORTANT NOTES<br />
As the figures shown in the report are WEEKLY AVERAGES, care must be exercised when considering audience figures for any quarter hours during which a station has been both on<br />
and off the air over all weeks of the survey period. To calculate the actual average station audience for any quarter hour concerned, the figures in the report should be adjusted as<br />
follows:<br />
(a) Suppose "Station A" had broadcast between 6:00-6:15 am for only ONE week of a ten week survey. Because the computer would divide the total ten-week results by ten to<br />
obtain a weekly average, the 6:00-6:15 am audience figure shown for "Station A" will represent approximately one-tenth of the actual audience reached in the one week<br />
concerned. An appropriate adjustment should therefore be made.<br />
(b) Suppose "Station B" had broadcast between 11:30-11:45 pm for only five of the ten weeks of the survey. The 11:30-11:45 pm audience figures shown for "Station B" will<br />
represent approximately 5/10th (one half) of the actual average audience. An appropriate adjustment should therefore be made.<br />
The formula for adjusting any quarter-hour affected is:<br />
Audience as per report multiplied by the number of weeks in survey divided by the number of weeks the station transmitted.
<strong>Nielsen</strong> – <strong>2012</strong> <strong>Radio</strong> <strong>Survival</strong> <strong>Kit</strong>.<br />
PRESS & INTERNET POLICY<br />
As a result of many requests for access to publish the <strong>Radio</strong> Ratings prepared by <strong>Nielsen</strong>, we<br />
would like to outline the current policy to avoid any misunderstanding about the use and<br />
status of that material.<br />
1. The <strong>Radio</strong> Ratings prepared by <strong>Nielsen</strong>:<br />
• is confidential information belonging to Commercial <strong>Radio</strong> Australia Limited and <strong>Nielsen</strong>;<br />
• must only be obtained by subscription from <strong>Nielsen</strong>;<br />
• must not be passed to third parties without written consent from <strong>Nielsen</strong> and<br />
• must be kept confidential.<br />
2. <strong>Nielsen</strong>’s policy is to permit supply by its subscribers to the media of limited amounts of<br />
the <strong>Radio</strong> Ratings data for publicity and news purposes. In this context, ‘limited amount’<br />
means an amount that, if published, would not or would be unlikely to result in any loss of<br />
custom to <strong>Nielsen</strong>.<br />
3. In practice, <strong>Nielsen</strong> accepts the supply or publication of:<br />
• The <strong>Radio</strong> Ratings in narrative form to support statements or conclusions made in the<br />
course of a story, sales brochure or sales pitch;<br />
• The top line radio Share, Average audience and Cumulative audience figures in each<br />
capital city or regional markets for the standard sessions and demographics:-<br />
• Monday - Sunday 5:30am-12mn<br />
• Monday - Friday 5:30am-12mn<br />
• Monday - Friday 5:30am-9am<br />
• Monday - Friday 9am-12md<br />
• Monday - Friday 12md - 4pm<br />
• Monday - Friday 4pm - 7pm<br />
• Monday - Friday 7pm - 12mn<br />
• Saturday & Sunday 5:30am-12mn<br />
• People 10+<br />
• People 10-17<br />
• People 18-24<br />
• People 25-39<br />
• People 40-54<br />
• People 55-64<br />
• People 65+<br />
• <strong>Radio</strong> Ratings information or data pertaining to OTHER AM, OTHER FM and OTHER<br />
DIGITAL is not to be published.<br />
4. Any supply by subscribers or publication by media of the <strong>Radio</strong> Ratings data beyond the<br />
above will breach <strong>Nielsen</strong> and Commercial <strong>Radio</strong> Australia’s rights in respect of its<br />
confidential information.<br />
5. <strong>Nielsen</strong> may discontinue supply to subscribers who provide <strong>Radio</strong> Ratings to third parties<br />
without authorisation and may commence legal proceedings against unauthorised<br />
recipients of the <strong>Radio</strong> Ratings data.<br />
If the <strong>Radio</strong> Ratings are used in line with this Press and Internet policy the source:-<br />
‘<strong>Nielsen</strong> <strong>Radio</strong> Ratings’ or “<strong>Nielsen</strong>’ must be used in conjunction with the data release.
Commercial <strong>Radio</strong> Australia Ltd Information<br />
• Digital <strong>Radio</strong> in Australia– Fast Facts –<br />
http://www.digitalradioplus.com.au/index.cfm?page_id=1010<br />
• CRA Code of Ethics (you need to be a member to access this page).<br />
http://www.commercialradio.com.au/index.cfm?page_id=1224<br />
• Map of Commercial <strong>Radio</strong> Stations<br />
http://www.commercialradio.com.au/files/uploaded/file/<strong>2012</strong>%20Calendar/<strong>2012</strong>%20St<br />
ation%20Map.pdf