Financial Results for the year ended 30 June 2011 - Optimum Coal
Financial Results for the year ended 30 June 2011 - Optimum Coal
Financial Results for the year ended 30 June 2011 - Optimum Coal

You also want an ePaper? Increase the reach of your titles
YUMPU automatically turns print PDFs into web optimized ePapers that Google loves.
14<br />
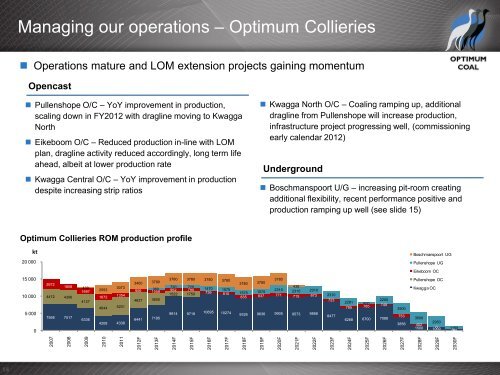
Managing our operations – <strong>Optimum</strong> Collieries<br />
Operations mature and LOM extension projects gaining momentum<br />
Opencast<br />
Pullenshope O/C – YoY improvement in production,<br />
scaling down in FY2012 with dragline moving to Kwagga<br />
North<br />
Eikeboom O/C – Reduced production in-line with LOM<br />
plan, dragline activity reduced accordingly, long term life<br />
ahead, albeit at lower production rate<br />
Kwagga Central O/C – YoY improvement in production<br />
despite increasing strip ratios<br />
<strong>Optimum</strong> Collieries ROM production profile<br />
20 000<br />
15 000<br />
10 000<br />
5 000<br />
0<br />
2672<br />
1808<br />
4472 4<strong>30</strong>6<br />
7568 7517<br />
2007<br />
2008<br />
439<br />
1697<br />
4127<br />
6336<br />
2009<br />
2553<br />
1672<br />
4644<br />
1354<br />
5201<br />
4208 4338<br />
2010<br />
<strong>30</strong>73<br />
<strong>2011</strong><br />
3400<br />
956<br />
360<br />
1058<br />
4637<br />
6441<br />
2012F<br />
3780<br />
3600<br />
7195<br />
2013F<br />
3780 3780 3780 3780<br />
720<br />
952<br />
720<br />
795<br />
1522 1750<br />
9814 9718<br />
2014F<br />
2015F<br />
1470 1575<br />
736 810<br />
10695 10274<br />
2016F<br />
2017F<br />
3780<br />
3780<br />
1575<br />
835<br />
3780<br />
1575<br />
837<br />
2310<br />
771<br />
438<br />
2310<br />
715<br />
2310<br />
673<br />
9326 9636 9905 9573 9868<br />
2018F<br />
2019F<br />
Kwagga North O/C – <strong>Coal</strong>ing ramping up, additional<br />
dragline from Pullenshope will increase production,<br />
infrastructure project progressing well, (commissioning<br />
early calendar 2012)<br />
Underground<br />
Boschmanspoort U/G – increasing pit-room creating<br />
additional flexibility, recent per<strong>for</strong>mance positive and<br />
production ramping up well (see slide 15)<br />
kt Boschmanspoort UG<br />
2020F<br />
2021F<br />
2022F<br />
2310<br />
723<br />
8477<br />
2023F<br />
2200<br />
2281 800<br />
795 785 749<br />
6288 6700 7088<br />
2024F<br />
2025F<br />
2026F<br />
3500<br />
753<br />
3856<br />
2027F<br />
Pullenshope UG<br />
Eikeboom OC<br />
Pullenshope OC<br />
Kwagga OC<br />
3500<br />
402<br />
1500<br />
2950<br />
1000<br />
0 1100<br />
200 0<br />
2028F<br />
2029F<br />
20<strong>30</strong>F