CXCOM Software Instruction Manual - Phocos.com
CXCOM Software Instruction Manual - Phocos.com
CXCOM Software Instruction Manual - Phocos.com

You also want an ePaper? Increase the reach of your titles
YUMPU automatically turns print PDFs into web optimized ePapers that Google loves.
<strong>Phocos</strong> <strong>CXCOM</strong> for CX and CXN <strong>Instruction</strong> <strong>Manual</strong><br />
June, 2007<br />
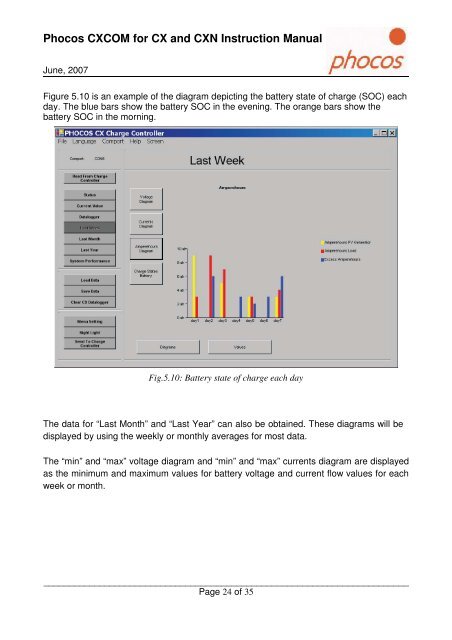
Figure 5.10 is an example of the diagram depicting the battery state of charge (SOC) each<br />
day. The blue bars show the battery SOC in the evening. The orange bars show the<br />
battery SOC in the morning.<br />
Fig.5.10: Battery state of charge each day<br />
The data for “Last Month” and “Last Year” can also be obtained. These diagrams will be<br />
displayed by using the weekly or monthly averages for most data.<br />
The “min” and “max” voltage diagram and “min” and “max” currents diagram are displayed<br />
as the minimum and maximum values for battery voltage and current flow values for each<br />
week or month.<br />
________________________________________________________________________<br />
Page 24 of 35