Sustainability Report - Antofagasta PLC
Sustainability Report - Antofagasta PLC
Sustainability Report - Antofagasta PLC

Create successful ePaper yourself
Turn your PDF publications into a flip-book with our unique Google optimized e-Paper software.
26<br />
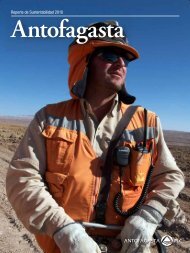
<strong>Antofagasta</strong> plc <strong>Sustainability</strong> <strong>Report</strong> 2011<br />
<strong>Sustainability</strong> at <strong>Antofagasta</strong><br />
Economic contribution<br />
We aim to create value for shareholders and also to add value for a much<br />
wider range of stakeholders. Through our products, services, operations<br />
and investments, <strong>Antofagasta</strong> aims to contribute to sustainable<br />
development and bring lasting benefits to local communities and society.<br />
This includes:<br />
Products and services: Copper and molybdenum are used in a variety of<br />
products and equipment which society and business depend on, including<br />
construction, telecommunications networks and electrical and electronic<br />
products. The mining business in the <strong>Antofagasta</strong> Region depends on the<br />
reliable transportation of their products and supplies by the <strong>Antofagasta</strong><br />
Railway Company. Thousands of people and businesses rely on the<br />
consistent supply of safe water provided by Aguas de <strong>Antofagasta</strong>.<br />
Local socio-economic development: <strong>Antofagasta</strong> Minerals’ Social<br />
Strategy commits its operations to providing training and support to help<br />
local people access employment opportunities. For example, Esperanza<br />
committed to hire at least 30% of its workers from the <strong>Antofagasta</strong><br />
Region and the company developed an ambitious recruitment and<br />
apprenticeship programme to meet this goal.<br />
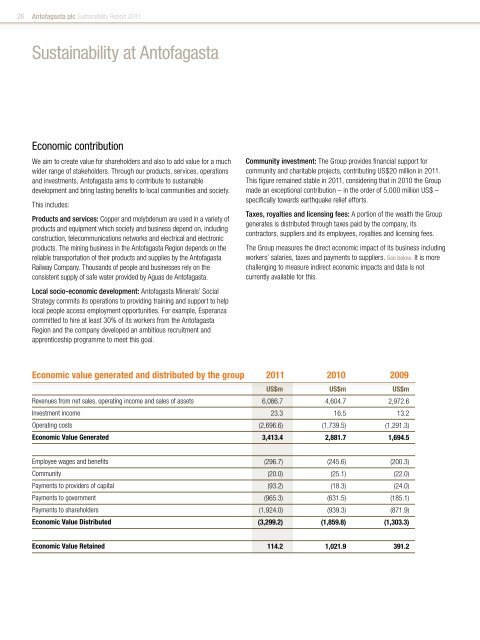
Economic value generated and distributed by the group<br />
Revenues from net sales, operating income and sales of assets<br />
Investment income<br />
Operating costs<br />
Economic Value Generated<br />
Employee wages and benefits<br />
Community<br />
Payments to providers of capital<br />
Payments to government<br />
Payments to shareholders<br />
Economic Value Distributed<br />
Economic Value Retained<br />
Community investment: The Group provides financial support for<br />
community and charitable projects, contributing US$20 million in 2011.<br />
This figure remained stable in 2011, considering that in 2010 the Group<br />
made an exceptional contribution – in the order of 5,000 million US$ –<br />
specifically towards earthquake relief efforts.<br />
Taxes, royalties and licensing fees: A portion of the wealth the Group<br />
generates is distributed through taxes paid by the company, its<br />
contractors, suppliers and its employees, royalties and licensing fees.<br />
The Group measures the direct economic impact of its business including<br />
workers’ salaries, taxes and payments to suppliers. See below. It is more<br />
challenging to measure indirect economic impacts and data is not<br />
currently available for this.<br />
2011 2010 2009<br />
US$m<br />
6,086.7<br />
23.3<br />
(2,696.6)<br />
3,413.4<br />
(296.7)<br />
(20.0)<br />
(93.2)<br />
(965.3)<br />
(1,924.0)<br />
(3,299.2)<br />
114.2<br />
US$m<br />
4,604.7<br />
16.5<br />
(1,739.5)<br />
2,881.7<br />
(245.6)<br />
(25.1)<br />
(18.3)<br />
(631.5)<br />
(939.3)<br />
(1,859.8)<br />
1,021.9<br />
US$m<br />
2,972.6<br />
13.2<br />
(1,291.3)<br />
1,694.5<br />
(200.3)<br />
(22.0)<br />
(24.0)<br />
(185.1)<br />
(871.9)<br />
(1,303.3)<br />
391.2