dimensional numerical simulation of blood flow in mouse ... - CFD
dimensional numerical simulation of blood flow in mouse ... - CFD
dimensional numerical simulation of blood flow in mouse ... - CFD

Create successful ePaper yourself
Turn your PDF publications into a flip-book with our unique Google optimized e-Paper software.
the <strong>in</strong>let and the outlet. No-slip boundary conditions have<br />
been applied along the rigid walls.<br />
RESULTS<br />
The <strong>flow</strong> rates used as boundary conditions were obta<strong>in</strong>ed<br />
from Huo et al. (2008) <strong>in</strong> which the <strong>flow</strong> is measured<br />
experimentally <strong>in</strong> the same wild type mice used for the<br />
present study. In the follow<strong>in</strong>g, steady <strong>flow</strong> is considered<br />
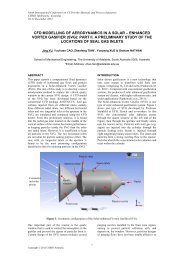
to validate our approach. Figure 5 gives the nomenclature<br />
for each artery branch, table 1 <strong>in</strong>dicates the <strong>flow</strong> rates, the<br />
diameters and Reynolds from Huo et al. (2008) as well as<br />
the measured diameters and calculated Reynolds numbers<br />
for the present study.<br />
AA<br />
BCA<br />
LCC<br />
Figure 5: Lumen distribution <strong>of</strong> a <strong>mouse</strong> aortic arch with<br />
plaques. The <strong>in</strong>let and outlets are labelled accord<strong>in</strong>g to the<br />
notations used <strong>in</strong> table 1.<br />
The Reynolds number is calculated from the equivalent<br />
diameter obta<strong>in</strong>ed from the measurement <strong>of</strong> the surface<br />
area. In table 1, it is observed that the diameters are<br />
smaller than the ones measured by Huo et al. (2008), a<br />
difference which probably comes from the difference <strong>in</strong><br />
the tissue fix<strong>in</strong>g method but also due to the different<br />
perfusion pressure. In current experiments, agarose is used<br />
as an embedd<strong>in</strong>g medium to prevent shr<strong>in</strong>kage effects<br />
caused by paraff<strong>in</strong>.<br />
As mentioned previously, the first step <strong>of</strong> the validation is<br />
to show <strong>in</strong>variance <strong>of</strong> computed parameter magnitudes<br />
which are derived from different types <strong>of</strong> meshes. Figure 5<br />
shows the iso-contours <strong>of</strong> the WSS for tetrahedral (Figure<br />
6a) and hexahedral (Figure 6b) meshes <strong>in</strong> rescaled<br />
geometries. This scal<strong>in</strong>g implies that the equivalent<br />
diameter <strong>of</strong> the ascend<strong>in</strong>g aorta is equal to the one<br />
measured <strong>in</strong> Huo et al. (2008). The maximum <strong>of</strong> WSS <strong>in</strong><br />
both configurations are respectively 18.38 and 18.85 Pa<br />
for the two different meshes. The difference between these<br />
two values is ma<strong>in</strong>ly due to the weak control <strong>of</strong> the<br />
boundary layers <strong>in</strong> the tetrahedral mesh for which the<br />
number <strong>of</strong> elements is 2 times bigger than for the<br />
hexahedral. A mesh study has been done on meshes to<br />
optimize the <strong>numerical</strong> parameters but will not be<br />
presented here. The performance <strong>of</strong> our hexahedral<br />
approach for a complex real geometry is shown here.<br />
Copyright © 2012 CSIRO Australia 4<br />
LS<br />
DA<br />
Experimental<br />
Re<br />
Flow Rate, Q<br />
(mL/m<strong>in</strong>) Huo<br />
et al. (2008)<br />
Diameter, D<br />
(mm) Huo et<br />
al. (2008)<br />
Re, Huo et al.<br />
(2008)<br />
Experimental<br />
Diameter (mm)<br />
Experimental<br />
Re<br />
Scaled<br />
Diameters(mm)<br />
93 AA BCA 22 LCC 26 17 LS DA 60<br />
12.02 1.87 1.35 1.06 7.74<br />
1.3 0.85 0.64 0.64 -<br />
61 14 14 11 -<br />
0.84 0.56 0.33 0.38 0.82<br />
93 22 26 17 60<br />
1.3 0.68 0.31 0.51 1.08<br />
Table 1: Comparison <strong>of</strong> diameter and Reynold’s number<br />
from experimental f<strong>in</strong>d<strong>in</strong>gs and the values stated <strong>in</strong> Huo et<br />
al. (2008). The experimental dimensions <strong>of</strong> the aorta and<br />
its ma<strong>in</strong> branches were measured from the reconstructed<br />
three-<strong>dimensional</strong> geometry. The <strong>flow</strong> rates used as<br />
boundary conditions were obta<strong>in</strong>ed from Huo et al (2008).<br />
For the fifth row, Re=ρQD/(Aµ) where Q is the <strong>flow</strong> rate,<br />
A is the surface area and D is the equivalent diameter. The<br />
discrepancy between the dimensions comes from the<br />
shr<strong>in</strong>kage caused by embedd<strong>in</strong>g <strong>in</strong> paraff<strong>in</strong>. The last row<br />
corresponds to scaled diameters with Huo et al. (2008).<br />
Figure 6: Iso-contours <strong>of</strong> WSS, (a) tetrahedral mesh, (b)<br />
hexahedral mesh.