Mullin, S. K., Taylor, P. J. & Pillay, N. 2004. Skull size and ... - Durban
Mullin, S. K., Taylor, P. J. & Pillay, N. 2004. Skull size and ... - Durban
Mullin, S. K., Taylor, P. J. & Pillay, N. 2004. Skull size and ... - Durban

You also want an ePaper? Increase the reach of your titles
YUMPU automatically turns print PDFs into web optimized ePapers that Google loves.
MULLIN_08 13/08/04 12:45 Page 10<br />
<strong>Mullin</strong> S. K. et al.<br />
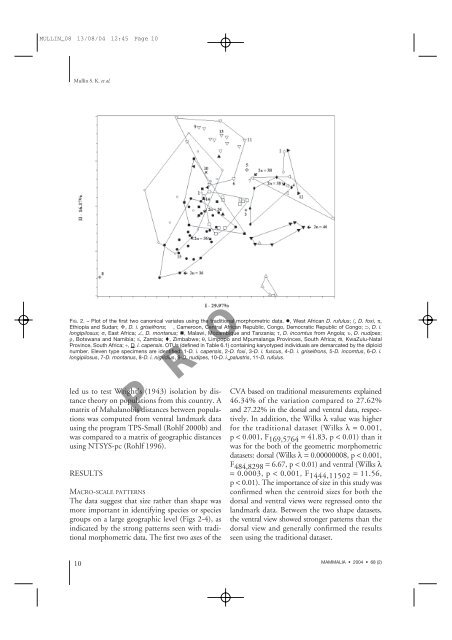
FIG. 2. – Plot of the first two canonical variates using the traditional morphometric data. , West African D. rufulus; 〈, D. foxi, π,<br />
Ethiopia <strong>and</strong> Sudan; , D. i. griseifrons; , Cameroon, Central African Republic, Congo, Democratic Republic of Congo; ⊃, D. i.<br />
longipilosus; σ, East Africa; ∠, D. montanus; , Malawi, Mozambique <strong>and</strong> Tanzania; τ, D. incomtus from Angola; υ, D. nudipes;<br />
ρ, Botswana <strong>and</strong> Namibia; ≤, Zambia; , Zimbabwe; θ, Limpopo <strong>and</strong> Mpumalanga Provinces, South Africa; ϖ, KwaZulu-Natal<br />
Province, South Africa; ÷, D. i. capensis. OTUs (defined in Table 6.1) containing karyotyped individuals are demarcated by the diploid<br />
number. Eleven type specimens are identified: 1-D. i. capensis, 2-D. foxi, 3-D. i. fuscus, 4-D. i. griseifrons, 5-D. incomtus, 6-D. i.<br />
longipilosus, 7-D. montanus, 8-D. i. nigridius, 9-D. nudipes, 10-D. i. palustris, 11-D. rufulus.<br />
led us to test Wright’s (1943) isolation by distance<br />
theory on populations from this country. A<br />
10<br />
P R O O F<br />
matrix of Mahalanobis distances between popula-<br />
tions was computed from ventral l<strong>and</strong>mark data<br />
using the program TPS-Small (Rohlf 2000b) <strong>and</strong><br />
was compared to a matrix of geographic distances<br />
using NTSYS-pc (Rohlf 1996).<br />
RESULTS<br />
MACRO-SCALE PATTERNS<br />
The data suggest that <strong>size</strong> rather than shape was<br />
more important in identifying species or species<br />
groups on a large geographic level (Figs 2-4), as<br />
indicated by the strong patterns seen with traditional<br />
morphometric data. The first two axes of the<br />
CVA based on traditional measurements explained<br />
46.34% of the variation compared to 27.62%<br />
<strong>and</strong> 27.22% in the dorsal <strong>and</strong> ventral data, respectively.<br />
In addition, the Wilks λ value was higher<br />
for the traditional dataset (Wilks λ =0.001,<br />
p < 0.001, F 169,5764 = 41.83, p < 0.01) than it<br />
was for the both of the geometric morphometric<br />
datasets: dorsal (Wilks λ =0.00000008, p < 0.001,<br />
F 484,8298 = 6.67, p < 0.01) <strong>and</strong> ventral (Wilks λ<br />
= 0.0003, p < 0.001, F 1444,11502 = 11.56,<br />
p < 0.01). The importance of <strong>size</strong> in this study was<br />
confirmed when the centroid <strong>size</strong>s for both the<br />
dorsal <strong>and</strong> ventral views were regressed onto the<br />
l<strong>and</strong>mark data. Between the two shape datasets,<br />
the ventral view showed stronger patterns than the<br />
dorsal view <strong>and</strong> generally confirmed the results<br />
seen using the traditional dataset.<br />
MAMMALIA • 2004 • 68 (2)
![INK Environmental Sustainability Booklet [19 MB] - Durban](https://img.yumpu.com/22025104/1/190x136/ink-environmental-sustainability-booklet-19-mb-durban.jpg?quality=85)