Modeling of Wire Electrical Discharge Machining ... - IJETAE
Modeling of Wire Electrical Discharge Machining ... - IJETAE
Modeling of Wire Electrical Discharge Machining ... - IJETAE

Create successful ePaper yourself
Turn your PDF publications into a flip-book with our unique Google optimized e-Paper software.
International Journal <strong>of</strong> Emerging Technology and Advanced Engineering<br />
Website: www.ijetae.com (ISSN 2250-2459, Volume 2, Issue 4, April 2012)<br />
It is evident from figure (3a) that the surface roughness<br />
decreases with increase in dielectric pressure, whereas<br />
figure (3b) reveals that the surface roughness increases<br />
with increase in pulse on time. Figure (3c) gives the<br />
variation <strong>of</strong> surface roughness with voltage corresponding<br />
to minimum and maximum values <strong>of</strong> pulse on time. It can<br />
be noticed from the figure that corresponding to minimum<br />
value <strong>of</strong> pulse on time the surface roughness decreases with<br />
increase in voltage, whereas the surface roughness<br />
increases with increase in voltage corresponding to<br />
maximum value <strong>of</strong> pulse on time.<br />
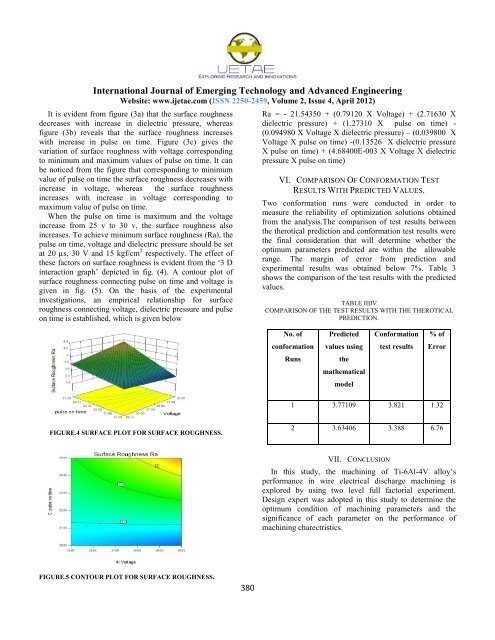
When the pulse on time is maximum and the voltage<br />
increase from 25 v to 30 v, the surface roughness also<br />
increases. To achieve minimum surface roughness (Ra), the<br />
pulse on time, voltage and dielectric pressure should be set<br />
at 20 µs, 30 V and 15 kgf/cm 2 respectively. The effect <strong>of</strong><br />
these factors on surface roughness is evident from the ‗3 D<br />
interaction graph‘ depicted in fig. (4). A contour plot <strong>of</strong><br />
surface roughness connecting pulse on time and voltage is<br />
given in fig. (5). On the basis <strong>of</strong> the experimental<br />
investigations, an empirical relationship for surface<br />
roughness connecting voltage, dielectric pressure and pulse<br />
on time is established, which is given below<br />
FIGURE.4 SURFACE PLOT FOR SURFACE ROUGHNESS.<br />
FIGURE.5 CONTOUR PLOT FOR SURFACE ROUGHNESS.<br />
380<br />
Ra = - 21.54350 + (0.79120 X Voltage) + (2.71630 X<br />
dielectric pressure) + (1.27310 X pulse on time) -<br />
(0.094980 X Voltage X dielectric pressure) – (0.039800 X<br />
Voltage X pulse on time) -(0.13526 X dielectric pressure<br />
X pulse on time) + (4.68400E-003 X Voltage X dielectric<br />
pressure X pulse on time)<br />
VI. COMPARISON OF CONFORMATION TEST<br />
RESULTS WITH PREDICTED VALUES.<br />
Two conformation runs were conducted in order to<br />
measure the reliability <strong>of</strong> optimization solutions obtained<br />
from the analysis.The comparison <strong>of</strong> test results between<br />
the therotical prediction and conformation test results were<br />
the final consideration that will determine whether the<br />
optimum parameters predicted are within the allowable<br />
range. The margin <strong>of</strong> error from prediction and<br />
experimental results was obtained below 7%. Table 3<br />
shows the comparison <strong>of</strong> the test results with the predicted<br />
values.<br />
TABLE IIIIV<br />
COMPARISON OF THE TEST RESULTS WITH THE THEROTICAL<br />
PREDICTION.<br />
No. <strong>of</strong><br />
conformation<br />
Runs<br />
Predicted<br />
values using<br />
the<br />
mathematical<br />
model<br />
Conformation<br />
test results<br />
% <strong>of</strong><br />
Error<br />
1 3.77109 3.821 1.32<br />
2 3.63406 3.388 6.76<br />
VII. CONCLUSION<br />
In this study, the machining <strong>of</strong> Ti-6Al-4V alloy‘s<br />
performance in wire electrical discharge machining is<br />
explored by using two level full factorial experiment.<br />
Design expert was adopted in this study to determine the<br />
optimum condition <strong>of</strong> machining parameters and the<br />
significance <strong>of</strong> each parameter on the performance <strong>of</strong><br />
machining charectristics.