Modeling of Wire Electrical Discharge Machining ... - IJETAE
Modeling of Wire Electrical Discharge Machining ... - IJETAE
Modeling of Wire Electrical Discharge Machining ... - IJETAE

You also want an ePaper? Increase the reach of your titles
YUMPU automatically turns print PDFs into web optimized ePapers that Google loves.
International Journal <strong>of</strong> Emerging Technology and Advanced Engineering<br />
Website: www.ijetae.com (ISSN 2250-2459, Volume 2, Issue 4, April 2012)<br />
<strong>Modeling</strong> <strong>of</strong> <strong>Wire</strong> <strong>Electrical</strong> <strong>Discharge</strong> <strong>Machining</strong> Parameters<br />
Using Titanium Alloy (Ti-6AL-4V)<br />
Basil Kuriachen 1 , Dr. Josephkunju Paul 2 , Dr.Jose Mathew 3<br />
1 Research Scholar, Department <strong>of</strong> Mechanical Engineering, National Institute <strong>of</strong> Technology Calicut<br />
Kozhikode-673601, India<br />
2 Pr<strong>of</strong>essor and HOD, Department <strong>of</strong> mechanical Engineering, MA College <strong>of</strong> Engineering Kothamangalam, India<br />
3 Pr<strong>of</strong>essor, Department <strong>of</strong> Mechanical Engineering, National Institute <strong>of</strong> Technology Calicut<br />
Abstract— <strong>Wire</strong> electro discharge machining (WEDM) is a<br />
modification <strong>of</strong> electro discharge machining (EDM) which has<br />
been widely used for long time for cutting punches and dies,<br />
shaped pockets and other machine parts <strong>of</strong> electrically<br />
conducting work materials. Technology <strong>of</strong> the WEDM process<br />
is based on the conventional EDM sparking phenomenon,<br />
utilizing the widely accepted non contact technique <strong>of</strong><br />
material removal with a difference that spark is generated at<br />
the wire and work piece gap. Evolution <strong>of</strong> WEDM made<br />
drastic changes in the area <strong>of</strong> precision machining with<br />
highest degree <strong>of</strong> dimensional accuracy and surface finish. In<br />
this paper, two level full factorial techniques were used for<br />
modelling and predicting the surface roughness in WEDM <strong>of</strong><br />
titanium (Ti-6Al-4V) alloy. Surface roughness was taken as a<br />
response variable measured after machining and pulse ON<br />
time, pulse OFF time, voltage and dielectric flushing pressure<br />
were taken as input parameters. The level <strong>of</strong> importance <strong>of</strong><br />
the WEDM cutting parameters on the surface roughness was<br />
determined by using the analysis <strong>of</strong> variance method<br />
(ANOVA). A mathematical relation between the workpiece<br />
surface roughness and WEDM cutting parameters was<br />
established. This mathematical model may be used for<br />
evaluating the surface roughness without performing any<br />
experiments. The predicted values <strong>of</strong> surface roughness by the<br />
mathematical model were compared with the experimental<br />
values. It is observed that the predicted results agree with the<br />
experimental values within an error <strong>of</strong> 7 %.<br />
Keywords— Surface roughness, factorial design, WEDM,<br />
Titanium (Grade 5), DOE<br />
Kozhikode-673601, India<br />
1 basilkuriachen@gmail.com<br />
2 josephkunju.paul@gmail.com<br />
3 josmat@nitc.ac.in<br />
377<br />
I. INTRODUCTION<br />
WEDM is one <strong>of</strong> the non-traditional processes which is<br />
accepted globally to machine high strength to weight ratio<br />
materials mainly employed for nuclear and aerospace<br />
industries. This (WEDM) is one <strong>of</strong> the main applications <strong>of</strong><br />
the traditional electrical discharge machining (EDM). EDM<br />
machining was first discovered by the English scientist<br />
Joseph Priestly in 1770, but its advantages were utilized<br />
completely only in the year 1943 by the Russian scientists<br />
and it was commercially developed in the year 1970. In the<br />
mid <strong>of</strong> 1980s this technique was used in machine tools to<br />
machine electrically conducting materials. WEDM utilizes<br />
a continuously travelling wire electrode made <strong>of</strong> thin<br />
copper, brass or tungsten or coated wire <strong>of</strong> diameter 0.05 –<br />
0.3 mm [1]. A dielectric fluid is forced into the machining<br />
zone to improve the effectiveness as well as to carry away<br />
the debris so that it reduces the chances <strong>of</strong> short circuit<br />
between wire electrode and the work piece. Nowadays, in<br />
order to achieve better performance, the work piece and the<br />
tool are submerged in the dielectric fluid. Most commonly<br />
used dielectric fluids are kerosene and de ionized water [2].<br />
The data base to select the correct parameter setting for<br />
newly developed materials is not readily available. The<br />
machine manufacturers provide the information only for<br />
the commonly used materials. So the databases provided by<br />
the manufacturers are not enough to meet the present needs<br />
<strong>of</strong> modern industries [3].<br />
This study aims to examine the influence <strong>of</strong> four<br />
important parameters viz. ‗pulse on time‘, ‗pulse <strong>of</strong>f time‘,<br />
‗voltage‘ and ‗dielectric pressure‘ on surface roughness in
International Journal <strong>of</strong> Emerging Technology and Advanced Engineering<br />
Website: www.ijetae.com (ISSN 2250-2459, Volume 2, Issue 4, April 2012)<br />
WEDM <strong>of</strong> Ti-6Al-4V. The various parameters were<br />
selected using design <strong>of</strong> experiments method.<br />
II. LITERATURE REVIEW<br />
There are a number <strong>of</strong> published works that reveal the<br />
influence <strong>of</strong> WEDM parameters on the surface roughness<br />
<strong>of</strong> different materials. Y.S. Liao found that surface<br />
roughness is most affected by the pulse on time [5]. The<br />
WEDM parameters are generally classified into two groups<br />
namely electrical and non electrical. [6]. S.S. Mahapatra<br />
and Amar Patnaik have investigated the effect <strong>of</strong> various<br />
parameters and found that current, pulse duration and<br />
dielectric pressure play most significant role in surface<br />
finish [7]. U.Esme et.al observed that increase in pulse<br />
duration, voltage and wire speed increase the surface<br />
roughness whereas increase in flushing pressure <strong>of</strong><br />
dielectric fluid decrease the surface roughness [8]. The<br />
investigations made by J.T Hung et.al revealed that pulse<br />
on time is one <strong>of</strong> the significant factors that influence<br />
surface roughness [9]. The previous researchers established<br />
that pulse duration, voltage, and dielectric pressure are the<br />
desired combination to control the surface finish [1].<br />
Ramakrishnan et al. described the multi objective<br />
optimization <strong>of</strong> the WEDM process using parametric<br />
design <strong>of</strong> Taguchi methodology [11]. Fuzhu Han et.al<br />
found that surface roughness can be improved by<br />
decreasing both pulse duration and discharge current [10].<br />
Although lot <strong>of</strong> investigations were done on the influence<br />
<strong>of</strong> various WEDM parameters on surface roughness, till<br />
date no investigation was conducted on the influence <strong>of</strong><br />
pulse on time, pulse <strong>of</strong>f time, voltage and dielectric<br />
pressure on WEDM <strong>of</strong> Ti-6Al-4V using DOE. This<br />
experimental study reveals the influence <strong>of</strong> pulse on time,<br />
pulse <strong>of</strong>f time, voltage and dielectric pressure and its<br />
interactions on the surface roughness in WEDM <strong>of</strong> Ti-6Al-<br />
4V alloy.<br />
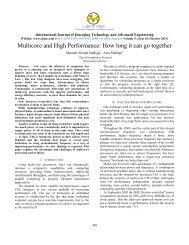
FIGURE .1 DETAILS OF WEDM SETUP.<br />
378<br />
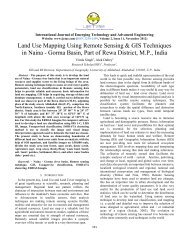
III. EXPERIMENTAL SET UP<br />
The experimental set up adopted for present study is<br />
given in figure 2. The WEDM experiments were conducted<br />
in Electronica ultra cut s1 machine using 0.25 mm brass<br />
wire as the tool electrode. ‗Pulse on time‘, ‗pulse <strong>of</strong>f time‘,<br />
‗voltage‘ and ‗dielectric pressure‘ are the four WEDM<br />
parameters that were selected for investigations. In this<br />
experimental study two level full factorial experiment is<br />
adopted because this gives all possible combinations <strong>of</strong><br />
machine parameters. All other machine parameters were<br />
kept constant during the time <strong>of</strong> experiment.<br />
IV. EXPERIMENTAL DESIGN BASED ON DOE<br />
A full factorial design with all factors at two levels<br />
provides the estimation <strong>of</strong> all the required parameter<br />
combinations. Altogether sixteen experiments and two<br />
conformation tests were conducted. For the analysis <strong>of</strong> the<br />
experiments 10% confidence level is used.<br />
FIGURE.2 ELECTRONICA ULTRACUT S1 WEDM 5-AXES<br />
ANNOVA table helped to find out the significant factors<br />
and to establish the mathematical relationship between the<br />
surface roughness and machining parameters.<br />
TABLE I<br />
MACHINING PARAMETERS AND LEVELS<br />
Factor Parameters Level 1 Level 2<br />
A Pulse on time (μS) 20 25<br />
B Pluse <strong>of</strong>f time (μS) 44 50<br />
C Voltage (V) 25 30<br />
D<br />
Dielectric pressure<br />
(kgf/cm 2 )<br />
10 15
International Journal <strong>of</strong> Emerging Technology and Advanced Engineering<br />
Website: www.ijetae.com (ISSN 2250-2459, Volume 2, Issue 4, April 2012)<br />
V. RESULTS AND DISCUSSIONS<br />
This section discusses the influence <strong>of</strong> the process<br />
parameters on the surface roughness. The main objective <strong>of</strong><br />
this discussion is to assess the variation <strong>of</strong> surface<br />
roughness with respect to the change in the process<br />
parameters. The various machining parameters in two<br />
levels and corresponding results <strong>of</strong> surface roughness<br />
(average <strong>of</strong> three readings) are tabulated in Table 2.<br />
No<br />
TABLE II<br />
EXPERIMENTAL DESIGN AND RESULTS<br />
Voltage<br />
(V)<br />
Dielectric<br />
pressure<br />
(kgf/cm 2 )<br />
Pulse<br />
on<br />
time<br />
(μS)<br />
Pulse<br />
<strong>of</strong>f<br />
time<br />
(μS)<br />
Ra<br />
(μm)<br />
1 25 10 20 44 3.534<br />
2 30 10 20 44 3.544<br />
3 25 15 20 44 3.331<br />
4 30 15 20 44 3.348<br />
5 25 10 25 44 4.227<br />
6 30 10 25 44 4.285<br />
7 25 15 25 44 3.628<br />
8 30 15 25 44 4.009<br />
9 25 10 20 50 3.635<br />
10 30 10 20 50 3.447<br />
11 25 15 20 50 3.624<br />
12 30 15 20 50 3.364<br />
13 25 10 25 50 3.907<br />
14 30 10 25 50 4.023<br />
15 25 15 25 50 3.384<br />
16 30 15 25 50 4.283<br />
17 28 13 23 47 3.821<br />
18 26 11 21 45 3.388<br />
379<br />
The ANNOVA table <strong>of</strong> surface roughness (Ra) showed<br />
that two individual factors and one interaction affect the<br />
surface roughness. The probability values (Prob>F) are less<br />
than 0.05 for pulse on time, dielectric pressure(WP) and the<br />
interaction between the voltage and pulse on time. The<br />
most important factor which affects the surface roughness<br />
is pulse on time. The relation between the various<br />
parameters and surface roughness are given in the main<br />
effect plot viz. figure (3a), figure (3b) and figure (3c).<br />
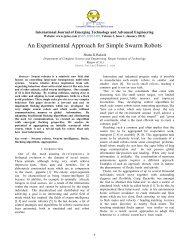
FIGURE 3A<br />
FIGURE 3B<br />
FIGURE 3C<br />
FIGURE. 3 INTERACTIONS OF VARIOUS FACTORS WITH<br />
SURFACE ROUGHNESS
International Journal <strong>of</strong> Emerging Technology and Advanced Engineering<br />
Website: www.ijetae.com (ISSN 2250-2459, Volume 2, Issue 4, April 2012)<br />
It is evident from figure (3a) that the surface roughness<br />
decreases with increase in dielectric pressure, whereas<br />
figure (3b) reveals that the surface roughness increases<br />
with increase in pulse on time. Figure (3c) gives the<br />
variation <strong>of</strong> surface roughness with voltage corresponding<br />
to minimum and maximum values <strong>of</strong> pulse on time. It can<br />
be noticed from the figure that corresponding to minimum<br />
value <strong>of</strong> pulse on time the surface roughness decreases with<br />
increase in voltage, whereas the surface roughness<br />
increases with increase in voltage corresponding to<br />
maximum value <strong>of</strong> pulse on time.<br />
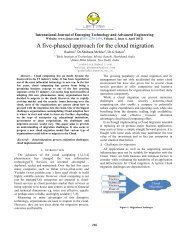
When the pulse on time is maximum and the voltage<br />
increase from 25 v to 30 v, the surface roughness also<br />
increases. To achieve minimum surface roughness (Ra), the<br />
pulse on time, voltage and dielectric pressure should be set<br />
at 20 µs, 30 V and 15 kgf/cm 2 respectively. The effect <strong>of</strong><br />
these factors on surface roughness is evident from the ‗3 D<br />
interaction graph‘ depicted in fig. (4). A contour plot <strong>of</strong><br />
surface roughness connecting pulse on time and voltage is<br />
given in fig. (5). On the basis <strong>of</strong> the experimental<br />
investigations, an empirical relationship for surface<br />
roughness connecting voltage, dielectric pressure and pulse<br />
on time is established, which is given below<br />
FIGURE.4 SURFACE PLOT FOR SURFACE ROUGHNESS.<br />
FIGURE.5 CONTOUR PLOT FOR SURFACE ROUGHNESS.<br />
380<br />
Ra = - 21.54350 + (0.79120 X Voltage) + (2.71630 X<br />
dielectric pressure) + (1.27310 X pulse on time) -<br />
(0.094980 X Voltage X dielectric pressure) – (0.039800 X<br />
Voltage X pulse on time) -(0.13526 X dielectric pressure<br />
X pulse on time) + (4.68400E-003 X Voltage X dielectric<br />
pressure X pulse on time)<br />
VI. COMPARISON OF CONFORMATION TEST<br />
RESULTS WITH PREDICTED VALUES.<br />
Two conformation runs were conducted in order to<br />
measure the reliability <strong>of</strong> optimization solutions obtained<br />
from the analysis.The comparison <strong>of</strong> test results between<br />
the therotical prediction and conformation test results were<br />
the final consideration that will determine whether the<br />
optimum parameters predicted are within the allowable<br />
range. The margin <strong>of</strong> error from prediction and<br />
experimental results was obtained below 7%. Table 3<br />
shows the comparison <strong>of</strong> the test results with the predicted<br />
values.<br />
TABLE IIIIV<br />
COMPARISON OF THE TEST RESULTS WITH THE THEROTICAL<br />
PREDICTION.<br />
No. <strong>of</strong><br />
conformation<br />
Runs<br />
Predicted<br />
values using<br />
the<br />
mathematical<br />
model<br />
Conformation<br />
test results<br />
% <strong>of</strong><br />
Error<br />
1 3.77109 3.821 1.32<br />
2 3.63406 3.388 6.76<br />
VII. CONCLUSION<br />
In this study, the machining <strong>of</strong> Ti-6Al-4V alloy‘s<br />
performance in wire electrical discharge machining is<br />
explored by using two level full factorial experiment.<br />
Design expert was adopted in this study to determine the<br />
optimum condition <strong>of</strong> machining parameters and the<br />
significance <strong>of</strong> each parameter on the performance <strong>of</strong><br />
machining charectristics.
International Journal <strong>of</strong> Emerging Technology and Advanced Engineering<br />
Website: www.ijetae.com (ISSN 2250-2459, Volume 2, Issue 4, April 2012)<br />
The following conclusions are drawn based on the<br />
investigations.<br />
1. The pulse on time , dielectric pressure, the interaction <strong>of</strong><br />
voltage and pulse on time are significant parameters which<br />
affect the surface roughness.<br />
2. Minimum surface roughness can be obtained by adopting<br />
a low value <strong>of</strong> pulse on time (20 µs) and a high value <strong>of</strong><br />
dielectric pressure (15 kgf/cm 2 ).<br />
3. Improper setting <strong>of</strong> pulse on time and pulse <strong>of</strong>f time can<br />
lead to wire breakage which in turn lead to increase in<br />
machining time.<br />
4. A mathematical model is established to predict the value<br />
<strong>of</strong> surface roughness.<br />
5. The marginal error obtained by the comparision <strong>of</strong> the<br />
predicted results with the conformation test was less than<br />
7%.<br />
REFERENCES<br />
[1] K.H. Ho, S.T. Newman, S. Rahimifard, R.D. Allen, ―State<br />
<strong>of</strong> the art in wire electrical discharge machining (WEDM)‖<br />
International Journal <strong>of</strong> Machine Tools & Manufacture 44<br />
(2004) 1247–1259.<br />
[2] Manufacuring science second edition by Amitabha Ghosh<br />
and Asok Kumar Mallik, Second Edition.<br />
[3] Scott F. Miller, Chen-C. Kao, Albert J. Shih, Jun Qu,<br />
―Investigation <strong>of</strong> wire electrical discharge machining <strong>of</strong> thin<br />
cross-sections and compliant mechanisms‖, International<br />
Journal <strong>of</strong> Machine Tools & Manufacture 45 (2005) 1717–<br />
1725.<br />
381<br />
[4] Fuzhu Han, Jun Jiang, Dingwen Yu, ―Influence <strong>of</strong> discharge<br />
current on machined surfaces by thermo-analysis in finish<br />
cut <strong>of</strong> WEDM‖, International Journal <strong>of</strong> Machine Tools &<br />
Manufacture 47 (2007) 1187–1196.<br />
[5] Y.S. Liao, J.T. Huang, Y.H. Chen, ―A study to achieve a<br />
fine surface finish in wire-EDM‖, Journal <strong>of</strong> Materials<br />
Processing Technology 149 (2004) 165–171.<br />
[6] Y.S. Liao, J.T. Huang, Y.H. Chen, ―A study to achieve a<br />
fine surface finish in <strong>Wire</strong>-EDM‖, Journal <strong>of</strong> Materials<br />
Processing Technology 149 (2004) 165–171.<br />
[7] Yan, B. H., Wang, C. C., Liu, W. D. and Huang F. Y.<br />
(2002). ―<strong>Machining</strong> Characteristics <strong>of</strong> Al2O3 / 6061 Al<br />
Composite Using Rotary EDM with a Dislike Electrode.‖<br />
The International Journal <strong>of</strong> Advances Manufacturing<br />
Technology, 16: pp. 322-333.<br />
[8] S. S.Mahapatra, Amar Patnaik, ―Parametric Optimization <strong>of</strong><br />
<strong>Wire</strong> <strong>Electrical</strong> <strong>Discharge</strong> <strong>Machining</strong> (WEDM) Process<br />
using Taguchi Method‖, / Vol. XXVIII, No. 4, October-422<br />
December 2006.<br />
[9] U.Ese,Sagbas,F Kahraman, ―Prediction <strong>of</strong> Surface<br />
Roughness in <strong>Wire</strong> <strong>Electrical</strong> <strong>Discharge</strong> machining using<br />
design <strong>of</strong> Experiments and Neural Networks‖, Iranian<br />
Journal <strong>of</strong> Science & Technology, Transaction B,<br />
Engineering, Vol. 33, No. B3, pp 231-240<br />
[10] J.T. Huang, Y.S. Liao, W.J. Hsue, ―Determination <strong>of</strong> finishcutting<br />
operation number and machining-parameters setting<br />
in wire electrical discharge machining‖, Journal <strong>of</strong> Materials<br />
Processing Technology 87 (1999) 69–81.<br />
[11] Fuzhu Han & Jun Jiang & Dingwen Yu, ―Influence <strong>of</strong><br />
machining parameters on surface roughness in finish cut <strong>of</strong><br />
WEDM‖, Int J Adv Manuf Technol (2007) 34:538–546<br />
[12] R. Ramakrishnan · L. Karunamoorthy, ―Multi response<br />
optimization <strong>of</strong> wire EDM operations using robust design <strong>of</strong><br />
experiments‖, Int J Adv Manuf Technol (2006) 29: 105–112