Wind Measurements and Annual Energy Production Certification ...
Wind Measurements and Annual Energy Production Certification ...
Wind Measurements and Annual Energy Production Certification ...

You also want an ePaper? Increase the reach of your titles
YUMPU automatically turns print PDFs into web optimized ePapers that Google loves.
<strong>Wind</strong> <strong>Measurements</strong> <strong>and</strong><br />
<strong>Annual</strong> <strong>Energy</strong> <strong>Production</strong><br />
<strong>Certification</strong><br />
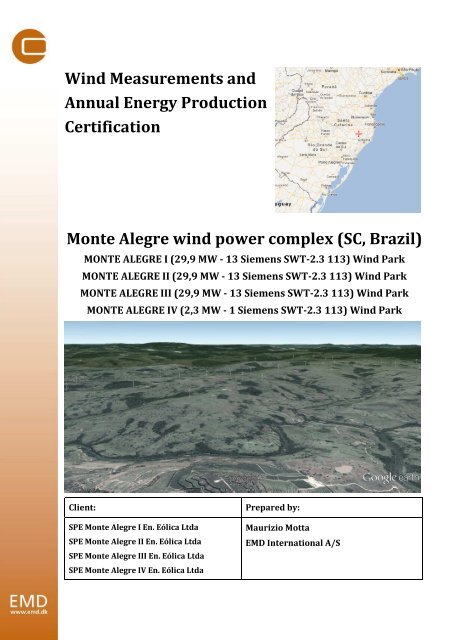
Monte Alegre wind power complex (SC, Brazil)<br />
MONTE ALEGRE I (29,9 MW - 13 Siemens SWT-2.3 113) <strong>Wind</strong> Park<br />
MONTE ALEGRE II (29,9 MW - 13 Siemens SWT-2.3 113) <strong>Wind</strong> Park<br />
MONTE ALEGRE III (29,9 MW - 13 Siemens SWT-2.3 113) <strong>Wind</strong> Park<br />
MONTE ALEGRE IV (2,3 MW - 1 Siemens SWT-2.3 113) <strong>Wind</strong> Park<br />
Client: Prepared by:<br />
SPE Monte Alegre I En. Eólica Ltda<br />
SPE Monte Alegre II En. Eólica Ltda<br />
SPE Monte Alegre III En. Eólica Ltda<br />
SPE Monte Alegre IV En. Eólica Ltda<br />
1<br />
Maurizio Motta<br />
EMD International A/S
1 EXECUTIVE SUMMARY<br />
The Monte Alegre wind power complex consists of four wind farms: Monte Alegre I,<br />
II, III <strong>and</strong> IV. The energy yield of each was calculated using measurements from a mast (100<br />
m) on site. The measurements were long-term corrected using data from the CFSR<br />
reanalysis model. A wind model was created taking into account topographic <strong>and</strong> roughness<br />
effects.<br />
VILCO provided the preliminary layout that was optimized by EMD, <strong>and</strong> for which the<br />
production was calculated, for each of the four wind farms of complex, using 40 Siemens<br />
SWT 2,3-113 (HH=99,5 m).<br />
The results are shown below. Losses are deducted to obtain the expected production<br />
output. Uncertainties are evaluated <strong>and</strong> presented as probability percentiles (P50, P75, P84<br />
<strong>and</strong> P90 values). The general recommendation from EMD is to use the P90-value based on<br />
20 years of operation.<br />
Table 1 - Mast measurements main results.<br />
Data Recovery<br />
(%)<br />
2<br />
October/2011-October/2012<br />
Mean<br />
Weibull<br />
k A<br />
<strong>Wind</strong> Speed - 100m [m/s] 96,2 6,24 2,00 7,04<br />
<strong>Wind</strong> Speed - 80 m [m/s] 96,2 6,06 2,00 6,84<br />
<strong>Wind</strong> Speed - 60 m [m/s] 96,2 5,84 6,61 2,02<br />
<strong>Wind</strong> Direction - 100 m - 93,7 N - -<br />
<strong>Wind</strong> Direction - 80 m - 93,7 N - -
Figure 1 - Long-term corrected (31 years) <strong>Wind</strong> Resource Map with final layouts of the four wind farms,<br />
shown in different colors.<br />
Table 2 – AEP <strong>and</strong> capacity factors estimates at different confidence levels for the 20-year horizon.<br />
Monte Alegre I Monte Alegre II Monte Alegre III Monte Alegre IV<br />
AEP<br />
(MWh/y)<br />
Capacity<br />
Factor<br />
AEP<br />
(MWh/y)<br />
Capacity<br />
Factor<br />
3<br />
AEP<br />
(MWh/y)<br />
Capacity<br />
Factor<br />
AEP<br />
(MWh/y)<br />
Capacity<br />
Factor<br />
P50 84.018 32% 79.772 30% 79.374 30% 6.227 31%<br />
P75 75.204 29% 72.664 28% 72.080 28% 5.620 28%<br />
P84 71.023 27% 69.292 26% 68.619 26% 5.332 26%<br />
P90 67.271 26% 66.267 25% 65.514 25% 5.074 25%<br />
P95 62.523 24% 62.439 24% 61.585 24% 4.747 24%
INDEX<br />
1 Executive Summary....................................................................................................................................... 2<br />
2 SIte <strong>and</strong> Purpose Description.................................................................................................................... 6<br />
3 Available Data.................................................................................................................................................. 8<br />
3.1 Analysis <strong>and</strong> Evaluation of Data ...................................................................................................... 8<br />
3.1.1 Height Contours ............................................................................................................................ 9<br />
3.1.2 Roughness Classification .........................................................................................................10<br />
3.1.3 Exclusion Zones...........................................................................................................................10<br />
3.1.4 <strong>Wind</strong> Turbine Type....................................................................................................................11<br />
3.1.5 <strong>Wind</strong> Turbine Layout ................................................................................................................12<br />
4 <strong>Wind</strong> <strong>and</strong> Meteorological Data ...............................................................................................................13<br />
4.1 Metering Mast Description ..............................................................................................................13<br />
4.1.1 Mast Maintenance ......................................................................................................................17<br />
4.1.2 Mast Compliance with International <strong>and</strong> National St<strong>and</strong>ards..................................18<br />
4.1.3 Mast Data Evaluation ................................................................................................................19<br />
4.1.3.1 <strong>Wind</strong> Speed Analysis ........................................................................................................21<br />
4.1.3.2 <strong>Wind</strong> Direction Analysis..................................................................................................23<br />
4.1.3.3 <strong>Wind</strong> Profile Analysis .......................................................................................................25<br />
4.1.3.4 Turbulence Category Estimation .................................................................................26<br />
4.1.3.5 Extreme <strong>Wind</strong> Conditions <strong>and</strong> IEC Class Estimation ...........................................26<br />
4.2 Comparisons <strong>and</strong> cross-predictions ............................................................................................27<br />
5 Long Term Correction ................................................................................................................................29<br />
5.1 Selection of long-term Data.............................................................................................................29<br />
5.2 Long-term Consistency .....................................................................................................................30<br />
5.3 Correlation of <strong>Wind</strong> Direction........................................................................................................32<br />
5.4 Correlation of <strong>Wind</strong> <strong>Energy</strong>.............................................................................................................33<br />
5.5 Long Term Correction Methodology............................................................................................33<br />
5.6 Long-term variability.........................................................................................................................35<br />
5.7 <strong>Wind</strong> resource map <strong>and</strong> micro-siting of the wind farm .......................................................36<br />
6 Calculation of <strong>Annual</strong> <strong>Energy</strong> <strong>Production</strong> ..........................................................................................37<br />
6.1 <strong>Wind</strong>PRO-WA S P calculation ............................................................................................................37<br />
6.2 Losses.......................................................................................................................................................40<br />
6.2.1 Array losses...................................................................................................................................41<br />
4
6.2.2 Availability ....................................................................................................................................41<br />
6.2.3 Electrical losses ...........................................................................................................................41<br />
6.2.4 Environmental losses................................................................................................................41<br />
6.3 Uncertainties.........................................................................................................................................42<br />
6.3.1 <strong>Wind</strong> measurements .................................................................................................................43<br />
6.3.2 Long-term correction (MCP)..................................................................................................43<br />
6.3.3 Year-to-year variability............................................................................................................44<br />
6.3.4 Model extrapolation of wind data ........................................................................................44<br />
6.3.5 Power curve..................................................................................................................................44<br />
6.3.6 Uncertainty on losses (availability, grid/substation, wakes)....................................44<br />
6.4 Long Term <strong>Wind</strong> Variations............................................................................................................44<br />
6.5 Monthly Variations .............................................................................................................................48<br />
7 References.......................................................................................................................................................50<br />
8 Annex ................................................................................................................................................................51<br />
5
2 SITE AND PURPOSE DESCRIPTION<br />
The purpose of this report is to assess the annual energy production of the project,<br />
based on site measurements long-term corrected with available data. A preliminary layout,<br />
provided by the client, is reviewed <strong>and</strong> modified. In addition the uncertainty is evaluated<br />
<strong>and</strong> the production at different probability percentiles is calculated.<br />
The site, composed by two l<strong>and</strong> lots, is located in the state of Santa Catarina, Brazil,<br />
between the villages of São Joaquim <strong>and</strong> Urubici. It is characterized by hilly terrain, partly<br />
covered by scattered patches of forests of araucaria. Particularly to the North-East, expected<br />
to be the prevailing wind direction, the forest becomes almost continuous. A meteorological<br />
mast is installed within the project development area. Two more masts, belonging to the<br />
contiguous project of Urupema, are installed north of the Monte Alegre site. The general<br />
description, project areas <strong>and</strong> site location are shown in Figures 2, 3 <strong>and</strong> Table 3.<br />
The site has been visited by EMD, on January 19 th , 2011, during the mast installation.<br />
Figure 2 - Project Area, in yellow<br />
6<br />
Table 3 - Site description <strong>and</strong> general information<br />
Location: Bonsucesso (SC), Brazil<br />
Area: 29,8 km 2<br />
Altitude (m): 1100 to 1445<br />
Site Inspection: 19/01/2011<br />
Mast Coordinates<br />
(UTM WGS 84 S<br />
Zone 22):<br />
618993 W, 6893678 S
Figure 3 - Site Location.<br />
Figure 4 – The l<strong>and</strong>scape around the mast<br />
Figure 5 – The l<strong>and</strong>scape around the mast<br />
7
3 AVAILABLE DATA<br />
The following information has been supplied for the site project:<br />
Table 4 - Input Data of the Project<br />
Topography<br />
Data<br />
<strong>Wind</strong> Data<br />
Type of Data Source Details<br />
Project Area VILCO<br />
Height Contours VILCO/EMD 1 m within project area, 10 m outside<br />
Dwelling, Protection<br />
Areas <strong>and</strong> Forests<br />
8<br />
VILCO<br />
Maps VILCO/EMD<br />
Roughness Description EMD<br />
Exclusion Zones VILCO/EMD<br />
Made by a specialized environmental<br />
company<br />
Cartographic map 1:50000, <strong>and</strong><br />
satellite images. Other satellite images<br />
provided by EMD<br />
Background roughness classified as<br />
class 2,0<br />
Mast <strong>Measurements</strong> VILCO 1 Metering Mast. 12 months of data<br />
Long-Term Data EMD<br />
MERRA, 30 years<br />
ERA, 31 years<br />
NNRPD, 31 years<br />
CFSR, 31 years<br />
Electrical Grid VILCO Only internal losses considered<br />
<strong>Wind</strong> Turbine<br />
Type VILCO Siemens SWT-2.3 113<br />
Power curve EMD/Manufacturer -<br />
Positions VILCO/EMD<br />
3.1 Analysis <strong>and</strong> Evaluation of Data<br />
Layout proposed by VILCO <strong>and</strong><br />
optimized by EMD<br />
The provided maps <strong>and</strong> satellite images were apparently affected by non-negligible<br />
misalignments, likely related to an incorrect choice of the UTM Datum. EMD has therefore<br />
made use of its own sources of maps.<br />
<strong>Wind</strong> Data will be analyzed in a separated chapter; all other input data described in<br />
Table 4 are evaluated here.
3.1.1 Height Contours<br />
The Digital Elevation Model (DEM) used within the development area, provided by<br />
VILCO, has a vertical equidistance of 1 m. Further away 10 m curves are used, obtained by<br />
interpolation of the SRTM grid database.<br />
The l<strong>and</strong>scape is quite hilly, with a number of steep slopes, whose steepness required<br />
further investigations.<br />
Figure 6 – DEM used for the project: the finer vertical resolution used within the development areas are<br />
clearly visible. Most of the northern part belongs to the nearby Urupema project.<br />
Especially to the North-East of the site, a few slopes exhibit steepness above the limit<br />
of applicability of the model WAsP (21,8°, corresponding to 40%): within the development<br />
areas, however, only a few cliffs appear critical from this point of view, while the main<br />
concern is represented by hills too steep for the turbines to be installed (typically 10°). A<br />
RIX (Ruggedness IndeX) calculation has been run to verify that the terrain variations in the<br />
region do not represent an issue for WA S P.<br />
9
Figure 7. Steepness map of the region within <strong>and</strong> surrounding the wind park.<br />
3.1.2 Roughness Classification<br />
The roughness of the l<strong>and</strong>scape determines how much the surrounding terrain drags<br />
the wind profile, thereby slowing the wind down. This territory is characterized by large<br />
areas of forest, scattered around a relatively open l<strong>and</strong>scape. Use of satellite imagery <strong>and</strong><br />
local photos, together with the site visit <strong>and</strong> evaluation of the measured mast profile, has<br />
helped in defining a background roughness of class 2,0. The l<strong>and</strong> use data provided by<br />
VILCO for the development areas have been used as the best available description of the<br />
perimeter of the forests. Outside the project area, data from the MODIS vegetation database<br />
have been used. A few further roughness lines have been digitized within <strong>and</strong> around the<br />
development area, for the sake of accuracy.<br />
3.1.3 Exclusion Zones<br />
Permanent protection areas, such as rivers, lakes <strong>and</strong> environmental reserves<br />
characterized in the environmental study in compliance with Brazilian laws were provided<br />
by VILCO together with buffer distances from each of them. The following features have<br />
been identified by VILCO, <strong>and</strong> marked as exclusion zones with the indicated buffer distance:<br />
Rivers <strong>and</strong> streams: 30 m<br />
Springs: 50 m<br />
Lakes: 100 m<br />
Swamps: no buffer required<br />
Forest: 100 m<br />
10
Main roads: N/A<br />
Secondary roads/trails: 54 m<br />
Electric grid: N/A<br />
Dwellings: 500 m<br />
Moreover, a buffer of 60 m (corresponding to about 1 rotor radius) has been considered<br />
from the perimeter of the available l<strong>and</strong>. Areas steeper than 10° have also been excluded,<br />
without adding any buffer.<br />
3.1.4 <strong>Wind</strong> Turbine Type<br />
Figure 8 - Exclusion zones within the project.<br />
The turbine type used here is a Siemens SWT-2.3 113, with a hub height of 99,5 m.<br />
The power curve is usually compared to a st<strong>and</strong>ard model called HP curve, <strong>and</strong> a HP<br />
power test is performed. The HP-values are calculated using a st<strong>and</strong>ard procedure<br />
developed by Helge Petersen (HP) at Risø National Laboratory, assuming that a power curve<br />
can be generated from information about nominal power, rotor diameter <strong>and</strong> type of power<br />
control.<br />
The HP-curve check value of the power curve of the Siemens SWT-2.3 113 (Level 0,<br />
st<strong>and</strong>ard air density) appears to be within the acceptable range of ±5% at the wind speeds<br />
expected at hub height. Details of the HP test are shown in the Annex.<br />
11
Figure 9 - HP check of the st<strong>and</strong>ard power curve of Siemens SWT-2.3 113.<br />
3.1.5 <strong>Wind</strong> Turbine Layout<br />
A preliminary park layout was proposed by VILCO <strong>and</strong> optimized by EMD, respecting<br />
the power range previously established for each wind farm of the complex. Only small<br />
modifications have been introduced, mainly due to a different definition of exclusion zones<br />
<strong>and</strong> their buffers.<br />
Figure 10 - Siemens SWT 2.3-113 layout optimized by EMD.<br />
12
4 WIND AND METEOROLOGICAL DATA<br />
The wind measurements come from a mast (BSO), located within the planned wind<br />
farm. Two more masts (URA-N <strong>and</strong> URA-S), belonging to the contiguous project of Urupema,<br />
are installed north of the Monte Alegre site. As long-term reference, different model data<br />
have been considered.<br />
4.1 Metering Mast Description<br />
This information is largely provided by VILCO ([1] to [5]). The site was visited by EMD<br />
while the mast was being installed, therefore the validation of the proper mounting of the<br />
instruments was done by VILCO, <strong>and</strong> the resulting documentation sent to EMD.<br />
<strong>Measurements</strong> have been made at this mast, with first records from July 2011.<br />
However, the mast at the time hardly complied with the quality st<strong>and</strong>ards required for wind<br />
energy assessment, <strong>and</strong> was then re-configured <strong>and</strong> re-equipped in October 2011. First valid<br />
records therefore start on October 21 st , 2011, <strong>and</strong> reach one full year in October 2012.<br />
The mast is equipped with the following metering sensors: three Thies First Class<br />
Advanced cup anemometers in order to measure wind speed; two Thies Clima wind vanes<br />
for wind direction data; a weather station recording temperature, relative humidity, air<br />
pressure, <strong>and</strong> wind data via a sonic gauge; wind speeds from a second sonic instrument have<br />
been provided, too.<br />
The following figures <strong>and</strong> tables present general information of the mast <strong>and</strong> the list of<br />
the equipment installed.<br />
13
Figure 11 – The mast at Monte Alegre.<br />
14
Figure 12 – Detail of the installation at Monte Alegre.<br />
15
Table 5 - General information about the mast<br />
Type: Lattice, Triangular, Tubular<br />
16<br />
Coordinates<br />
(UTM WGS 84):<br />
Altitude: 1401 m a.s.l. Height: 100 m<br />
618993 West<br />
6893678 South<br />
Mast leg: 385 mm Tube diameter: 33,7 mm<br />
Figure 13 – Sketch of the mast<br />
with the whole equipment<br />
Table 6 - Description of mast equipments<br />
Nº Equipment Height [m]<br />
1.a<br />
1.b<br />
1.c<br />
2.a<br />
2.b<br />
3.a<br />
3.b<br />
4.<br />
Cup anemometer<br />
THIES Clima First Class Advanced<br />
Cup anemometer<br />
THIES Clima First Class Advanced<br />
Cup anemometer<br />
THIES Clima First Class Advanced<br />
<strong>Wind</strong> Vane<br />
THIES Clima Compact<br />
<strong>Wind</strong> Vane<br />
THIES Clima Compact<br />
Weather station<br />
All-in-one WS500 LUFT<br />
Weather station<br />
All-in-one WS200 LUFT<br />
Data Logger<br />
Campbell Scientific CR1000<br />
100<br />
80<br />
60<br />
100<br />
80<br />
90<br />
60<br />
11<br />
5. Solar panel <strong>and</strong> battery 14<br />
6. Lightning rod 102<br />
7. Aviation light 100<br />
8. Solar panel <strong>and</strong> battery of av. light 10<br />
Boom length/Mast Leg: ≈ 6,5
The serial number of the installed anemometers, as well as the calibration slope <strong>and</strong><br />
offset can be found in Table 7.<br />
Table 7 - Main information on installed cup anemometers<br />
Anemometer Calibration Serial Number Slope Offset<br />
THIES First Class - 100 m* <strong>Wind</strong>Guard 04114072 0,04588 0,233<br />
THIES First Class - 80 m <strong>Wind</strong>Guard 04114059 0,04581 0,257<br />
THIES First Class - 60 m <strong>Wind</strong>Guard 04114029 0,04584 0,254<br />
THIES First Class - 100 m* <strong>Wind</strong>Guard 08115287 0,04586 0,021<br />
*The instrument nr. 08115287 replaced nr. 04114072 on September 10 th, 2012.<br />
Orientation of mast <strong>and</strong> wind instruments are shown in the table below, as well as<br />
the correction applied to the wind vanes to consider the magnetic deviation. In order to<br />
decrease adjustment uncertainties, the North mark of the wind vanes was oriented along the<br />
boom, towards the mast, <strong>and</strong> a correction to the True North was then applied in the data<br />
logger setup. Although the mast orientation does not comply with the recommendations<br />
given by EMD [6], these were based on an expected prevailing wind direction (45°) which is<br />
now not confirmed. As a result, if the main wind direction seen by the mast (0°) is correct,<br />
the choice of its orientation is actually good.<br />
Table 8 - Orientation of mast instruments, <strong>and</strong> correction applied to wind vane direction measurements<br />
(Reference: True North)<br />
4.1.1 Mast Maintenance<br />
Prevailing <strong>Wind</strong> Direction North<br />
Mast Face Orientation South-West<br />
Anemometer Orientations 328°<br />
<strong>Wind</strong> Vane Orientations 148°<br />
Offset – <strong>Wind</strong> Vane (100 m) -32°<br />
Offset – <strong>Wind</strong> Vane (80 m) -32°<br />
During the official measurement period (Oct 2011-Oct 2012), the main maintenance<br />
activities were:<br />
Modification of the programming routine of mean wind direction registered by<br />
the wind vanes on 31/05/2012. At first, mean values of direction were being<br />
17
ecorded as arithmetic averages, <strong>and</strong> not as vector averages, which leads to<br />
critical errors when the wind vane is measuring within the North sector.<br />
100 m anemometer replaced by a new device on September 10 th , 2012. Data loss<br />
from July 21 st .<br />
4.1.2 Mast Compliance with International <strong>and</strong> National St<strong>and</strong>ards<br />
The International Electrotechnical Commission, International <strong>Energy</strong> Agency<br />
Progamme, Network of European Measuring Institutes <strong>and</strong> Empresa de Pesquisa Energética<br />
([7] to [125]) have several recommendations regarding the mast configuration to reduce at<br />
minimum the uncertainty in measurements due to mast effects. Table 9 presents the mast<br />
compliance with International <strong>and</strong> National St<strong>and</strong>ards recommendations.<br />
Table 9 - Mast compliance with Reference St<strong>and</strong>ards<br />
Anemometers<br />
<strong>Wind</strong> Vanes<br />
Data<br />
Logger<br />
Mast<br />
18<br />
Brazilian<br />
St<strong>and</strong>ard<br />
International<br />
St<strong>and</strong>ards<br />
Minimum Minimum Recommended<br />
Number: 3 3 2 >2<br />
Height (m):<br />
Calibration:<br />
100, 80, 60 Hub height ± 2,5 % of hub<br />
height<br />
MEASNET<br />
member<br />
MEASNET<br />
member<br />
MEASNET<br />
member<br />
Hub height<br />
MEASNET<br />
member<br />
Lh: 6,5 x mast leg 3,7 x mast leg 3,7 x mast leg 5,7 x mast leg<br />
Lv: 21.2 x dh 15 x dh 15 x dh 25 x dh<br />
Number: 2 2 2<br />
Height (m):<br />
Meteorological Data:<br />
100, 80 2/3 hub height 90% of hub<br />
height<br />
Measures of<br />
temperature,<br />
pressure <strong>and</strong><br />
humidity<br />
Measures of<br />
temperature,<br />
pressure <strong>and</strong><br />
humidity<br />
Measures of<br />
temperature,<br />
pressure <strong>and</strong><br />
humidity<br />
Sampling rate: 1 Hz 1Hz 1Hz<br />
Average Period: 10 min 10 min 10 min<br />
Hub Height<br />
Lh = Horizontal Boom Length Lv= Vertical boom Length dh= Horizontal boom diameter
4.1.3 Mast Data Evaluation<br />
<strong>Measurements</strong> have been carried out from October 21 st , 2011 to October 21 st , 2012<br />
(12 months). Table 10 summarizes the main findings.<br />
Table 10 - <strong>Wind</strong> <strong>and</strong> Meteorological Main Results (provided by VILCO)<br />
High Parameters Oct Nov Dec Jan Feb Mar Apr May Jun Jul Ago Sep Oct<br />
100m<br />
80m<br />
60m<br />
2011<br />
Vmean [m/s] 7,29 5,84 5,90 5,73 5,68 5,36 5,94 5,62 5,26 7,28 7,90 7,15 6,66 6,20<br />
Dirmean [°]<br />
N N N N N N N N N SO-O N N N N<br />
Imean [%]* 10,33 12,36 11,50 12,19 11,65 11,15 11,11 11,18 10,21 10,11 10,25 11,89 11,21 11,17<br />
I(15 m/s) [%]** 7,42 8,47 8,12 8,91 10,93 19,15 7,99 15,56 10,41 10,01 8,15 11,46 6,25 8,71<br />
k 2,66 1,90 2,24 2,34 2,22 2,36 2,24 2,45 2,21 1,94 2,20 2,14 1,87 2,01<br />
Weibull<br />
a 8,39 6,51 6,67 6,46 6,42 6,07 6,69 6,29 6,50 8,15 8,95 8,08 7,23 6,99<br />
Vmean [m/s] 7,06 5,71 5,75 5,58 5,53 5,24 5,80 5,45 5,05 6,97 7,63 7,20 6,50 6,06<br />
Dirmean [°]<br />
N N N N N N N N N N-NO N N N N<br />
Imean [%]* 10,80 12,70 11,92 12,59 11,99 11,47 11,38 11,50 10,57 10,56 10,72 11,69 11,44 11,51<br />
I(15 m/s) [%]** 9,23 9,68 6,65 8,76 - - 9,42 14,29 10,56 10,40 9,30 10,04 6,60 9,43<br />
k 2,52 1,93 2,29 2,34 2,24 2,36 2,27 2,45 2,21 1,95 2,20 2,00 1,94 2,00<br />
Weibull<br />
a 8,11 5,71 6,55 6,30 6,26 5,93 6,54 6,09 6,33 7,82 8,65 8,02 7,15 6,84<br />
Vmean [m/s] 6,78 5,55 5,57 5,39 5,35 5,08 5,61 5,26 4,85 6,61 7,31 6,94 6,30 5,84<br />
Dirmean [°]<br />
11,34 13,15 12,54 13,15 12,45 12,03 11,83 11,84 11,08 11,14 11,26 12,27 11,87 12,03<br />
I(15 m/s) [%]** 11,34 13,14 12,57 13,16 12,45 12,03 11,83 16,81 12,89 10,21 8,64 10,32 7,93 10,07<br />
k 2,49 1,96 2,37 2,36 2,43 2,43 2,23 2,45 2,24 1,95 2,19 2,01 2,02 2,02<br />
Weibull<br />
<strong>Wind</strong> shear (a)<br />
Relative humidity [%]<br />
Temperature [º C]<br />
Pressure [hPa]<br />
Ar Densitity [kg/m³]<br />
BONSUCESSO Mast<br />
a 7,75 6,22 6,40 6,10 6,16 5,78 6,30 5,86 6,13 7,45 8,30 7,75 7,01 6,61<br />
*Mean turbulence, considering only speed values above or equal to<br />
4m/s.<br />
- 0,10 0,11 0,19 0,10 0,11 0,10 0,14 0,16 0,17 0,15 0,14 0,06 0,12<br />
78,52 81,25 83,56 87,01 82,17 80,11 87,27 86,50 77,70 83,47 82,78 76,01 83,86 82,48<br />
12,38 13,56 13,94 15,90 18,59 15,86 13,55 11,55 10,97 9,30 12,52 12,42 13,99 13,31<br />
850,87 851,86 849,37 851,39 852,46 853,12 852,31 855,25 853,57 853,39 857,46 854,23 852,83 853,17<br />
1,04 1,04 1,03 1,03 1,02 1,03 1,04 1,05 1,05 1,05 1,05 1,04 1,03 1,04<br />
VILCO reported that, due to wrong setup of the logger by Messtechnik, during the<br />
period from 28/10/2011 to 30/05/2012 both available wind vanes have recorded direction<br />
data using arithmetic mean values. This leads to a critical error when the direction is near<br />
the north azimuth (0°), resulting in wrong average values, awkward direction variations <strong>and</strong><br />
huge associated st<strong>and</strong>ard deviations. The data logger was reconfigured to record using<br />
vector mean values on 30/05/2012.<br />
Since the data erroneously recorded do not contain the information to reconvert to<br />
vector values, they cannot be used as such for the present purposes. VILCO has therefore<br />
used correlations with direction data recorded by the sonic system to recreate the missing<br />
period using a linear regression.<br />
Briefly, the methodology used is the following: first select data that fit a few criteria<br />
indicating erroneous data at the vane; then, the assumed wrong data were corrected using<br />
the resulting equations of a linear regression made with the matching values from the wind<br />
vanes <strong>and</strong> the concurrent data from WS500. Further details of this are given in [4].<br />
Although this approach can be considered acceptable from the procedural point of<br />
view, the following doubts must be raised: i) the majority of the original time series is<br />
affected by this problem, thus significantly reducing its reliability; ii) although sonic records<br />
of wind directions appear more robust than speeds, the sonic instrument does not appear<br />
reliable enough to be used as the only source of comparison, let alone substitution; iii) the<br />
expected large number of events from the Southern sector, typical signature of arithmetic<br />
19<br />
2012<br />
**Mean turbulence in the mean speed bin of 14,5m/s - 15,5 m/s.<br />
Average<br />
***Extreme wind speed value( 10 minutes mean), in a<br />
period of 50 years. Calculated using Gumbel method.
averages of directions, do not appear in the original, incorrect wind rose; iv) the final,<br />
corrected wind rose does not match with any of the references, or with the ones from<br />
Urupema. Further comparisons <strong>and</strong> investigations on the matter can be found in § 4.2.<br />
The final time series appears of good quality, with only few flaws. The raw data have<br />
been cleaned of erroneous values <strong>and</strong> the remaining data were analysed. The following has<br />
been found:<br />
a total loss of data is recorded in the period 19/12-28/12/2011, likely due to<br />
logger failure<br />
as reported by VILCO, the top anemometer was replaced in September 2012<br />
due to malfunction; the resulting eleven days of data lost have been replaced<br />
by EMD making use of data from 80 m, scaled using simply a scale factor<br />
(1,02) based on the ratio between the two recorded 1-year mean wind speeds<br />
a few events of icing, at least partly affecting the instruments, have been<br />
recorded.<br />
Finally, wind speeds from the sonic instrument appear hardly reliable in terms of absolute<br />
values, but do represent an important source of validation.<br />
A few other very short periods of data gaps have been found, affecting all instruments<br />
<strong>and</strong> therefore likely related to a logger or transmission fault.<br />
Figure 14 - Availability of the couple wind speed-direction at 100 m, after patching the missing period of<br />
September 2012. Red <strong>and</strong> yellow cells are days lacking or with disabled data. The availability is the same<br />
at all other heights.<br />
20
4.1.3.1 <strong>Wind</strong> Speed Analysis<br />
The wind speeds measured at the different heights correlate very well during the<br />
whole measurement campaign.<br />
Figure 15 -<strong>Wind</strong> speed measurements at the mast correlate very well.<br />
Figure 16 –Radar graph showing the directional distribution of wind speeds.<br />
21
The radar plot of the directional distribution of the differences between the wind<br />
speeds measured at different heights show only small evidence of shadowing effects on the<br />
instruments, but a weird over- <strong>and</strong> underestimation is shown within the N sector, which is<br />
the prevailing wind direction. The effect is particularly evident when comparing the 100 <strong>and</strong><br />
60 m anemometers, <strong>and</strong> cannot be corrected, in the absence of side instruments mounted at<br />
the same heights. The reason of this is not clear, but it could be simply related to real profile<br />
inversion situations, seen sporadically throughout the whole time series, <strong>and</strong> simply<br />
exacerbated within the prevailing sector.<br />
Figure 17-Directional scatter plot of the differences of wind speeds measured at 100 <strong>and</strong> 60 m, binned by<br />
degree. In the prevailing N sector, contradicting records are shown, with both instruments<br />
underestimating the other at times.<br />
The measured <strong>and</strong> Weibull-fitted frequency distributions of the wind speeds are<br />
shown below.<br />
22
Figure 18-Measured <strong>and</strong> Weibull-fitted frequency distributions of wind speeds at Monte Alegre.<br />
Black: 100 m; purple: 80 m; blue: 60 m.<br />
4.1.3.2 <strong>Wind</strong> Direction Analysis<br />
The wind roses from the two available vanes are shown below. Here, a unique<br />
prevalence of northerly winds is recorded, in contrast with the concurrent measurements of<br />
the nearby Urupema masts, showing a prevalence of NNE <strong>and</strong> ENE.<br />
23
Figure 19 – Distributions of the wind directions recorded at Monte Alegre.<br />
The diurnal variability of wind speed is shown in the following figure, <strong>and</strong> exhibits<br />
evidence of different stability conditions during day <strong>and</strong> night.<br />
Figure 20 -Diurnal variability of the wind speed. A quite different profile is seen between day <strong>and</strong> night,<br />
evidence of different atmospheric stability conditions.<br />
24
4.1.3.3 <strong>Wind</strong> Profile Analysis<br />
In order to evaluate the ability of the model WA S P to properly reproduce local<br />
conditions <strong>and</strong> to extrapolate a wind profile to upper levels, self-predictions using data from<br />
the different measurement heights have been carried out. This has been done making use of<br />
the concurrent time series available (about 12 months), to generate with WA S P a wind<br />
statistics valid within the area. With the same model, a mean wind speed profile has been<br />
extrapolated with WA s P at different heights, including the ones of the measurements, <strong>and</strong><br />
compared to them. The initial attempts showed a not very good agreement with the<br />
measured data. From these, it appears that unstable atmospheric conditions are more<br />
dominant than stable ones, <strong>and</strong> the model in its default setup is unable to catch such a<br />
feature. This issue appeared systematically throughout the region, <strong>and</strong> has been verified at<br />
the other two available masts (URA-N <strong>and</strong> -S). For this reason, a small correction towards<br />
unstable conditions has been applied, with the outcome shown below.<br />
Figure 21 - Estimated wind profile (from 80 m) <strong>and</strong> measured wind speeds. After slightly modifying<br />
towards unstable conditions, WA s P appears to perform quite well.<br />
The result is generally good, but suspicion that at least one of the measurements is slightly<br />
off remains.<br />
25
4.1.3.4 Turbulence Category Estimation<br />
Based on the available measured data, an estimation of the turbulence on site has<br />
been carried out, with the outcome shown in the next plot. An ambient turbulence calling for<br />
a class B turbine is seen.<br />
Figure 22 - Comparison of measured turbulence at different heights with IEC (ed. 3) Categories.<br />
4.1.3.5 Extreme <strong>Wind</strong> Conditions<br />
The table below shows the extreme wind conditions for the site as estimated from<br />
records at BSO, <strong>and</strong> the IEC Class of the turbine selected.<br />
Table 11 - Extreme wind conditions of the site<br />
Height 100 m<br />
U50 (3 sec) 35 m/s<br />
U50 (10 min) 28 m/s<br />
Mean Turbulence Intensity (≥ 4 m/s) 11%<br />
Turbulence Intensity (15 m/s bin) 9%<br />
Turbulence Intensity (90% quantile) 19%<br />
IEC Class of the selected WTG IIB<br />
26
4.2 Comparisons <strong>and</strong> cross-predictions<br />
As already mentioned above, the final wind rose seen at Monte Alegre shows a quite<br />
different pattern when compared with data from the other two masts in the region. Since it<br />
is obtained from significant manipulation of the original, incorrectly recorded roses, this<br />
matter is further investigated here.<br />
The wind roses for the concurrent (10,6 months) period at the three masts are shown<br />
below, <strong>and</strong> exhibit marked differences, only explainable by local effects, or data problems.<br />
Figure 23 – Final wind roses from the three masts in the region. Significant differences are seen between<br />
Monte Alegre <strong>and</strong> Urupema, but also within the Urupema region.<br />
As an attempt to evaluate whether the procedure of correcting the original roses may have<br />
added unwanted biases, the roses of the concurrent period after all mast loggers had been<br />
adjusted (4,6 months) were investigated, <strong>and</strong> are shown below. Each of them looks very<br />
similar to its own full-period counterpart, meaning that the correction applied by VILCO has<br />
not introduced any significant veering.<br />
27
Figure 24 - <strong>Wind</strong> roses from the three masts in the region, after the logger correction. Each of them looks<br />
very similar to its full-period counterpart seen above.<br />
Cross-predictions based on strictly concurrent (about 10 months) time series<br />
between all masts been performed, in order to quantitatively evaluate the ability of WA S P to<br />
perform in this specific environment: the wind statistics obtained at each site/height has<br />
been used to estimate a wind profile at the other site/heights. The results are shown below,<br />
<strong>and</strong> are not very promising.<br />
Table 12 - Error (%) on the cross-predicted wind speeds between the masts, in the concurrent<br />
measurement period. In blue, the self- <strong>and</strong> cross-predictions at Urupema, in pink at Monte Alegre, <strong>and</strong> in<br />
white the cross-predictions between the two sites.<br />
Predicted at Name<br />
Meas. wind speed<br />
Height [m]<br />
[m/s] A [%] B [%] C [%] D [%]<br />
Predictor<br />
E [%] F [%] G [%] H [%] I [%]<br />
A URA-N 80 6,02 0,1 -1,2 -0,6 -6,5 -5,5 -7,2 -13,9 -13,5 -14,2<br />
B URA-N 60 5,62 1,5 0,1 0,8 -5,1 -4,0 -5,8 -13,1 -12,7 -13,4<br />
C URA-N 100 6,25 0,9 -0,4 0,1 -5,9 -4,9 -6,6 -13,0 -12,6 -13,3<br />
D BSO 80 6,08 7,5 6,2 6,8 0,2 1,3 -0,6 -7,1 -6,6 -7,4<br />
E BSO 60 5,87 6,5 5,2 5,8 -1,0 0,2 -1,8 -8,2 -7,7 -8,5<br />
F BSO 100 6,26 8,2 6,9 7,4 1,0 2,1 0,2 -6,3 -5,8 -6,7<br />
G URA-S 80 5,55 15,7 14,3 14,6 4,3 5,5 3,5 0,2 0,7 -0,2<br />
H URA-S 60 5,31 15,3 14,0 14,2 3,5 4,7 2,7 -0,4 0,1 -0,7<br />
I URA-S 100 5,76 15,7 14,4 14,6 4,7 6,0 4,0 0,5 1,0 0,1<br />
At Urupema, self-predictions at the southern mast show much better performance<br />
than at the other mast. Cross-predictions between the two masts, however, show extremely<br />
large, unacceptable errors. There are two explanations for this: a) WA S P is simply unable to<br />
cope with this environment; b) one or both the time series are affected by some kind of<br />
28
systematic error. Results from Monte Alegre show a lower capacity of self-prediction, but a<br />
striking improvement when predicting at Urupema: the errors are still very large, yet halved<br />
in comparison to the intra-site results of Urupema. It is also worth noting that using BSO as a<br />
predictor gives much better results at URA-S than at URA-N: use of the 100 m measurements<br />
at BSO results in 4,0% error at URA-S, <strong>and</strong> -6,6% at URA-N.<br />
5 LONG TERM CORRECTION<br />
5.1 Selection of long-term Data<br />
The following long-term databases have been evaluated as sources of long-term<br />
reference data for this project.<br />
The 3TIER-ERA database derives from the ECMWF ERA-Interim reanalysis project, as<br />
interpolated by 3TIER. The result is a high-resolution grid, whose nodes can be interpolated<br />
to any specific location. <strong>Wind</strong> direction data from 1/5 to 31/8/1994 appeared corrupted,<br />
<strong>and</strong> have been therefore excluded.<br />
The 3TIER-NRRPD database derives from the NCEP/NCAR reanalysis project, as<br />
rescaled by 3TIER making use of a mesoscale model. The result is a high-resolution grid,<br />
whose nodes can be interpolated to any specific location.<br />
The CFSR database is a third-generation high-resolution reanalysis product. Data<br />
from 10 m <strong>and</strong> 1.500 m are available. Databases from the two nearest grid nodes have been<br />
considered here.<br />
The MERRA database derives from the homonymous NASA reanalysis project. The<br />
model grid resolution is 0.67° x 0.5°.<br />
29
Figure 25 - Position of the selected reference database grid nodes. The MERRA point almost coincides with<br />
the western CFSR node. NNRPD points are interpolated at URA N <strong>and</strong> BSO mast positions.<br />
5.2 Long-term Consistency<br />
In order to detect unwanted long-term trends in the reference data, yearly averages of<br />
the wind speeds are presented below for the nine initially chosen series. All CFSR series<br />
exhibit a marked drop after 1998, but in the case of the 1,500 m databases this results in a<br />
significant descending trend of those time series, making them hardly usable. All other<br />
series do exhibit to some degree a decreasing trend, which is minimal for the ERA data,<br />
whereas the NNRPD shows actually an increasing behavior.<br />
30
Figure 26 - Yearly averages of the wind speeds for the nine reference datasets available. Also shown are<br />
the relevant linear trend lines. The worst-case trend, exhibited by CFSR-E 1,500 m, is also shown.<br />
In the figure below, the wind roses of the concurrent (30 years) reference time series<br />
are compared. Significant differences are seen, with no model showing the same marked<br />
prevalence of northerlies seen on site.<br />
31
Figure 27 - Comparison between concurrent long-term reference wind roses. Only one of the ERA points is<br />
shown, the other exhibiting exactly the same behavior.<br />
5.3 Correlation of <strong>Wind</strong> Direction<br />
The directional distribution of selected reference databases (the best matching ones<br />
mentioned above) is now investigated within the period of the measurement campaign at<br />
Monte Alegre. Although it cannot be ruled out that local topographic effects determine such<br />
a peculiar wind rose, suspicions remain about its correctness.<br />
Figure 28 - Comparing directional distribution of local readings (black) with that of concurrent reference<br />
data (6,5 months).<br />
32
5.4 Correlation of <strong>Wind</strong> <strong>Energy</strong><br />
The wind energy of a measurement is calculated by applying the wind speed to the<br />
power curve of the wind turbine in question. The wind speeds measured on site <strong>and</strong> from<br />
the reference datasets are therefore taken from or extrapolated to a given same height (here<br />
100 m) using a shear factor (actually: to the expected mean wind speed at this height, 6,7<br />
m/s). Thus a time series of what the planned wind turbine would have produced at 100 m is<br />
obtained. A monthly wind index can then be found averaging the available wind energy over<br />
each month.<br />
Monthly wind indices are shown here for the period of availability of the local<br />
measurements, <strong>and</strong> including those. The agreement with the reference datasets is generally<br />
quite low, with only a few isolated instances matching (e.g. MERRA in June <strong>and</strong> July 2012, or<br />
ERA in January <strong>and</strong> May).<br />
Figure 29 – Concurrent monthly energy indexes at Monte Alegre.<br />
5.5 Long Term Correction Methodology<br />
A range of methods for long-term correction is usually available. Here, all reference<br />
datasets are model outputs, <strong>and</strong> from past experience this tends to limit the choice to<br />
methods working only on large-scale (monthly) variations of the energy content of the time<br />
series, e.g. the <strong>Wind</strong> Index. This method, however, does not consider nor modify the local<br />
wind rose, simply assuming that it is long-term representative. Unfortunately, as seen above,<br />
33
the matching between local <strong>and</strong> most reference wind roses is very poor, thus calling into<br />
question the long-term representativeness of the local rose.<br />
This said, a number of attempts have been done using all reasonably-looking<br />
reference datasets, <strong>and</strong> different MCP techniques. All methods making use of small-scale<br />
variations (regressions) failed to reproduce the trend seen on site, while better results are<br />
seen applying the <strong>Wind</strong> Index approach. The results are shown below.<br />
The degree of correlation varies significantly, depending on the reference used,<br />
whereas the energy content of the resulting wind statistics shows an acceptable level of<br />
variability, with the exception of CFSR E, which seems significantly off (the same is seen<br />
when comparing with URA local data). Its counterpart, CFSR W, exhibits instead the best<br />
correlation with BSO (<strong>and</strong> the same happens at URA), <strong>and</strong> results of this will modify by 9%<br />
the energy content of the local wind statistics: a relatively large, but still acceptable value.<br />
In the further investigations, therefore, the local data from 100 m long-term<br />
corrected with the CFSR W point will be used.<br />
Figure 30 -Comparison of the MCP results. The WTG energy indicates the relative energy content.<br />
Correlations (r) <strong>and</strong> st<strong>and</strong>ard errors (s) are for the concurrent measured <strong>and</strong> corresponding predicted<br />
data, based on no averaging.<br />
34
5.6 Long-term variability<br />
As an example of the long-term variability in the region, monthly mean wind speed<br />
values, as obtained from the CFSR W (10 m) dataset, are presented in the table below: the<br />
original 10 m monthly values have been scaled to 100 m by a simple multiplying factor<br />
obtained by comparison with the long-term mean wind speed expected for the entire park<br />
(6,6 m/s).<br />
The variability of mean wind speed in the relevant 31 years is shown in the following<br />
figure.<br />
Table 13 - Monthly mean wind speed values obtained from the CFSR W dataset (31-year averages; 10 m<br />
values scaled to 100 m).<br />
Height Parameter Jan Feb Mar Apr May Jun Jul Aug Sep Oct Nov Dez Mean<br />
100m Vm [m/s] 6,0 5,7 5,6 6,0 6,3 6,6 7,2 7,1 7,5 7,3 7,2 6,6 6,6<br />
10,0%<br />
8,0%<br />
6,0%<br />
4,0%<br />
2,0%<br />
0,0%<br />
-2,0%<br />
-4,0%<br />
-6,0%<br />
-8,0%<br />
-10,0%<br />
1982<br />
1983<br />
1984<br />
1985<br />
1986<br />
1987<br />
1988<br />
1989<br />
1990<br />
1991<br />
1992<br />
1993<br />
1994<br />
1995<br />
1996<br />
1997<br />
1998<br />
1999<br />
2000<br />
2001<br />
2002<br />
2003<br />
2004<br />
2005<br />
2006<br />
2007<br />
2008<br />
2009<br />
2010<br />
2011<br />
2012<br />
Figure 31 - Variability of the wind speed around its average, obtained from the CFSR W dataset.<br />
35
5.7 <strong>Wind</strong> resource map <strong>and</strong> micro-siting of the wind farm<br />
A key element in the site evaluation is an estimation of the distribution of the wind<br />
resource over the site. This is done with a wind resource map, displayed below. The map has<br />
been obtained running a WA S P calculation at each node of the 50 m grid created in<br />
correspondence with the development area.<br />
Input for this calculation is represented by the long-term corrected wind statistics<br />
from BSO <strong>and</strong> URA-S. In other words, both statistics are used to estimate the resource at<br />
each grid node, but a different weight is applied to each of them, depending on the distance<br />
between the originating mast <strong>and</strong> the grid node itself.<br />
The result is shown below.<br />
Figure 32 - <strong>Wind</strong> resource map based on long-term corrected local data. The resource of the nearby<br />
Urupema project is also visible, but the available l<strong>and</strong> at Monte Alegre is highlighted with a black line.<br />
VILCO provided a preliminary layout based on 40 Siemens SWT-2.3 113, amounting to<br />
92 MW. Although the final number will have to be a multiple of 30 MW, the same maximum<br />
number of turbines has been used by EMD when optimizing the layout, on the basis of the<br />
resource map above. Given the vicinity of the other project, Urupema, the micro-siting of the<br />
turbines of both projects have been done within the same run, in order to take reciprocal<br />
wakes into account, therefore optimizing the efficiency of both parks.<br />
Given the many constraints, of environmental <strong>and</strong> logistic nature, holding in this region,<br />
the effectively available area is quite limited. However, the quite subjective <strong>and</strong> conservative<br />
approach used in selecting buffer distances, e.g. from forests <strong>and</strong> dwellings, leaves room for<br />
repositioning some of the turbines, or even include a few more.<br />
36
A distance ellipse of 5 x 3 rotor diameters (565 x 339 m) has been used for separating<br />
the turbines during the optimization, with the major semi-axis pointing at 0°, according to<br />
the wind rose recorded at the local mast. However, such a directional distribution, as seen<br />
above, does not match with any of the reference <strong>and</strong> local time series available.<br />
The optimized layout is shown below.<br />
Figure 33 - The final layout as optimized by EMD, in red. In black the original layout as proposed by VILCO<br />
6 CALCULATION OF ANNUAL ENERGY PRODUCTION<br />
6.1 <strong>Wind</strong>PRO-WA SP calculation<br />
The WA S P calculation model is commonly used to calculate the transformation of<br />
wind data from the point of metering to the each individual turbine. The model is described<br />
in detail by Troen <strong>and</strong> Petersen [13]. First step is to generate from the metering data <strong>and</strong> the<br />
terrain around the mast a description of the regional wind climate (wind statistics),<br />
secondly to apply this wind statistics on each individual turbine at hub height, reintroducing<br />
the local terrain description.<br />
The wind statistics representing the regional wind climate has been calculated by<br />
WA S P based on long-term corrected data from the mast <strong>and</strong> terrain data as described<br />
previously.<br />
<strong>Energy</strong> production calculations have been performed with <strong>Wind</strong>PRO using the WA S P<br />
calculation engine with wind statistics <strong>and</strong> the terrain description as input. The air density is<br />
37
calculated individually for each turbine, based on height <strong>and</strong> long term corrected<br />
temperature at the site. The air density is calculated individually for each turbine, based on<br />
height <strong>and</strong> long-term temperature data from the weather station of Curitiba, which showed<br />
the same average values recorded on site. The production estimate is adjusted to this air<br />
density by modifying the st<strong>and</strong>ard power curve given for an air density of 1.225 kg/m 3 .<br />
Figure 34 - Air density of the PARK calculation for the entire complex (40 turbines).<br />
The calculation has been done for each section of the 40 Siemens SWT 2.3-113 layout<br />
(HH 99,5 m), considering every time the remaining sections <strong>and</strong> the nearby park of<br />
Urupema as wake sources. Consistently with the way the wind resource map was calculated,<br />
the distance-weighted average of the long-term corrected wind statistics from BSO <strong>and</strong><br />
URA-S has been used as input.<br />
Based on the layout chosen, <strong>and</strong> the data described in the report so far, the following<br />
results appear in a PARK calculation, where roughness <strong>and</strong> height contour lines are taken<br />
into consideration for each WTG position. The array losses are calculated as well using the<br />
N.O. Jensen model. Below the calculated annual gross energy yield from each wind farm of<br />
the Urupema wind complex is shown.<br />
Table 14 –Calculated gross production before assumed additional losses<br />
Section WTG Model Qty<br />
Power<br />
[MW]<br />
AEP<br />
[GWh/yr]<br />
38<br />
AEP/WTG<br />
[GWh/yr]<br />
CF [%] Vm<br />
[m/s]<br />
BSO I Siemens SWT-2.3 113 13 29,9 98,8 7,6 38 6,6<br />
BSO II Siemens SWT-2.3 113 13 29,9 96,6 7,4 37 6,5<br />
BSO III Siemens SWT-2.3 113 13 29,9 92,7 7,1 35 6,4<br />
BSO IV Siemens SWT-2.3 113 1 2,3 7,1 7,1 35 6,3<br />
TOT Siemens SWT-2.3 113 40 92 295,2 7,4 37 6,5<br />
WTG: <strong>Wind</strong> Turbine Generator<br />
AEP: <strong>Annual</strong> <strong>Energy</strong> <strong>Production</strong><br />
CF: Capacity Factor
Figure 35 - The four wind farms of the wind complex Monte Alegre, with the turbines shown in different<br />
colors. In blue, those belonging to Monte Alegre II <strong>and</strong> IV (single WTG in the North); the reds in the South<br />
represent Monte Alegre I, whereas the red northern WTGs belong to Monte Alegre III.<br />
39
6.2 Losses<br />
Table 15 – Summary of losses, together with relevant uncertainties. Loss=Perda, Method=Método, Std<br />
dev=Desvio padrão, Comment=Comentário, Calculation=Calculado, Estimate=Estimado, No input=Não<br />
disponível. From the top: Monte Alegre I, II, III <strong>and</strong> IV.<br />
40
6.2.1 Array losses<br />
The array losses due to the turbines sheltering effect on each other are included in<br />
the calculations above <strong>and</strong> were made using N.O Jensen model. The calculation of this item<br />
includes the reciprocal effect of the four wind farms of the complex, <strong>and</strong> the (non-negligible)<br />
wakes due to the nearby park of Urupema.<br />
6.2.2 Availability<br />
Losses due to general availability for a l<strong>and</strong> site with a good service agreement is<br />
typically extremely low (
6.3 Uncertainties<br />
Table 16 - Summary of Uncertainties. Method=Método, Std dev=Desvio padrão, wind speed=velocidade do<br />
vento, AEP= produção anual de energia, Comment=Comentário, Calculation=Calculado,<br />
Estimate=Estimado, Uncertainty=Incerteza, Average=Média. From the top: Monte Alegre I, II <strong>and</strong> III.<br />
42
Table 16 (cont’d) - Summary of Uncertainties. Method=Método, Std dev=Desvio padrão, wind<br />
speed=velocidade do vento, AEP= produção anual de energia, Comment=Comentário,<br />
Calculation=Calculado, Estimate=Estimado, Uncertainty=Incerteza, Average=Média. Monte Alegre IV.<br />
6.3.1 <strong>Wind</strong> measurements<br />
The uncertainty on the wind measurements is set to 5%, which is a quite high value.<br />
The main reason is the unfortunate, long record of arithmetic averages of the wind direction,<br />
which had to be corrected a posteriori by VILCO, leaving doubts about the final wind roses,<br />
<strong>and</strong> the remaining large differences (in absolute values, rather than in shape) between the<br />
two local masts.<br />
Also, information on the measurement campaign, such as mast setup, equipment <strong>and</strong><br />
orientation, was sent in separate times through a number of separate documents, which<br />
sometimes appeared conflicting. This made it further difficult to properly evaluate the<br />
quality of the installation, hence the large uncertainty mentioned above.<br />
6.3.2 Long-term correction (MCP)<br />
The length of the long-term series, the quality <strong>and</strong> length of concurrent data <strong>and</strong> the<br />
correlation decides this uncertainty. Only one MCP method appeared successful here, <strong>and</strong><br />
this is quite common when only model outputs are used as reference. The results are not<br />
particularly consistent in terms of correlation factor with the different references used <strong>and</strong><br />
energy content of the long-term corrected wind statistics (if the outsider CFSR E is excluded,<br />
the max. discrepancy is 4,4%, but including that point it reaches 11%). A typical value of 7%<br />
has been used here to describe this uncertainty.<br />
Uncertainty about the future climate has been applied as a st<strong>and</strong>ard value of 5% on<br />
production. This parameter is included to take into account the difficulty of predicting the<br />
wind climate in the future.<br />
43
6.3.3 Year-to-year variability<br />
This parameter is evaluated based on the inter-annual variability of the wind speed<br />
exhibited by the chosen long-term reference data, i.e. the CFSR W dataset. This amounts to<br />
3.7% on wind speed, which is a relatively low value if compared to the european experience,<br />
but is quite consistent throughout most of the reference datasets considered here.<br />
6.3.4 Model extrapolation of wind data<br />
A RIX calculation has shown that a negligible bias is associated with the steep slopes<br />
found in the region. The performance of WA S P appears to be quite good only in selfpredictions,<br />
<strong>and</strong> thanks to the measurements available at hub height the vertical error<br />
extrapolation is reduced to a minimum value. Horizontal extrapolations between the local<br />
mast <strong>and</strong> URA-S however show quite large but not uncommon errors.<br />
The final uncertainties on the vertical <strong>and</strong> horizontal extrapolations have been<br />
estimated for each wind farm of the complex, <strong>and</strong> for each turbine, according to which wind<br />
statistics it refers to. The fact that some turbines lay quite far away from the mast<br />
contributes to the quite large uncertainty affecting the wind farms of Monte Alegre I <strong>and</strong> IV.<br />
6.3.5 Power curve<br />
The uncertainty on the power curve is st<strong>and</strong>ard: 2%.<br />
6.3.6 Uncertainty on losses (availability, grid/substation, wakes)<br />
The st<strong>and</strong>ard deviation on the array loss calculation is estimated to 20% of the<br />
calculated losses. In general there is a good agreement between calculated <strong>and</strong> measured<br />
array losses from the several cases we have tested this. For especially large wind farms with<br />
many arrays (>4), it is seen that the model gets problems <strong>and</strong> underestimates losses, but<br />
this is not the case here.<br />
Turbine availability is a very uncertain parameter for more reasons:<br />
It is difficult to predict what kind of failures occur <strong>and</strong> how long it will take to repair<br />
them;<br />
It is impossible to predict when these failures will occur.<br />
Especially for the WTG availability, a minimum availability can be agreed upon,<br />
depending on the type of service agreement (see also loss evaluation). Given the fact that<br />
Brazil is still a new market for wind energy, <strong>and</strong> a very large country, 50% is used as<br />
uncertainty on WTG availability.<br />
A st<strong>and</strong>ard value of the uncertainty on the electrical losses has been applied. Current<br />
EMD st<strong>and</strong>ard is 20% of the estimated loss of 2%.<br />
6.4 Long Term <strong>Wind</strong> Variations<br />
The expected net AEP is also named the P50 value, which is the expected outcome of the<br />
project. There is a probability of 50% that the outcome will be more than P50 <strong>and</strong> a<br />
probability of 50% that the outcome will be less. This can also be named the “central<br />
estimate”. Similarly, the P84 is the value where 84 out of 100 realizations will result in an<br />
44
outcome better than P84. For P95, there is only 5% probability to get an outcome poorer<br />
than this confidence level.<br />
Table 17 - Net AEP <strong>and</strong> mean capacity factor for different projection periods <strong>and</strong> confidence levels.<br />
From the top: Monte Alegre I, II, III.<br />
PXX [%]<br />
<strong>Annual</strong> <strong>Energy</strong> <strong>Production</strong> [MWh/y] Mean Capacity Factor<br />
1y 5y 10y 20y 1y 5y 10y 20y<br />
50 84.018 84.018 84.018 84.018 32% 32% 32% 32%<br />
75 74.610 75.107 75.172 75.204 28% 29% 29% 29%<br />
84 70.147 70.880 70.975 71.023 27% 27% 27% 27%<br />
90 66.142 67.088 67.210 67.271 25% 26% 26% 26%<br />
95 61.075 62.288 62.445 62.523 23% 24% 24% 24%<br />
PXX [%]<br />
<strong>Annual</strong> <strong>Energy</strong> <strong>Production</strong> [MWh/y] Mean Capacity Factor<br />
1y 5y 10y 20y 1y 5y 10y 20y<br />
50 79.772 79.772 79.772 79.772 30% 30% 30% 30%<br />
75 71.947 72.546 72.625 72.664 27% 28% 28% 28%<br />
84 68.236 69.119 69.234 69.292 26% 26% 26% 26%<br />
90 64.905 66.043 66.192 66.267 25% 25% 25% 25%<br />
95 60.691 62.151 62.342 62.439 23% 24% 24% 24%<br />
PXX [%]<br />
<strong>Annual</strong> <strong>Energy</strong> <strong>Production</strong> [MWh/y] Mean Capacity Factor<br />
1y 5y 10y 20y 1y 5y 10y 20y<br />
50 79.374 79.374 79.374 79.374 30% 30% 30% 30%<br />
75 71.349 71.959 72.039 72.080 27% 27% 28% 28%<br />
84 67.542 68.442 68.560 68.619 26% 26% 26% 26%<br />
90 64.126 65.286 65.438 65.514 24% 25% 25% 25%<br />
95 59.803 61.292 61.487 61.585 23% 23% 23% 24%<br />
45
Table 17 (cont’d) - Net AEP <strong>and</strong> mean capacity factor for different projection periods <strong>and</strong> confidence<br />
levels. Monte Alegre IV.<br />
PXX [%]<br />
<strong>Annual</strong> <strong>Energy</strong> <strong>Production</strong> [MWh/y] Mean Capacity Factor<br />
1y 5y 10y 20y 1y 5y 10y 20y<br />
50 6.227 6.227 6.227 6.227 31% 31% 31% 31%<br />
75 5.563 5.611 5.617 5.620 28% 28% 28% 28%<br />
84 5.248 5.318 5.328 5.332 26% 26% 26% 26%<br />
90 4.965 5.056 5.068 5.074 25% 25% 25% 25%<br />
95 4.607 4.724 4.739 4.747 23% 23% 24% 24%<br />
Figure 36 - Exceedance curve for the net AEP (loss deducted). From the left: Monte Alegre I, II.<br />
46
Figure 36 (cont’d) - Exceedance curve for the net AEP (loss deducted). From the left: Monte Alegre III, IV.<br />
47
6.5 Monthly Variations<br />
The monthly expected energy production <strong>and</strong> capacity factor are shown below, <strong>and</strong><br />
are obtained from the energy production calculations seen above, as scaled by long-term (31<br />
years) average monthly energy indices of the reference database (CFSR W).<br />
Table 18 – P50 monthly gross energy production <strong>and</strong> capacity factor.<br />
Month <strong>Production</strong><br />
[GWh]<br />
Monte Alegre I Monte Alegre II Monte Alegre III Monte Alegre IV<br />
Capacity<br />
Factor<br />
<strong>Production</strong><br />
[GWh]<br />
Capacity<br />
Factor<br />
48<br />
<strong>Production</strong><br />
[GWh]<br />
Capacity<br />
Factor<br />
<strong>Production</strong><br />
[GWh]<br />
Capacity<br />
Factor<br />
January 7,0 31% 6,8 31% 6,6 30% 0,5 29%<br />
February 6,2 31% 6,1 30% 5,8 29% 0,4 29%<br />
March 5,9 27% 5,8 27% 5,6 26% 0,4 26%<br />
April 6,8 31% 6,6 31% 6,4 30% 0,5 29%<br />
May 7,5 34% 7,3 33% 7,0 32% 0,5 31%<br />
June 7,9 37% 7,8 36% 7,5 35% 0,6 34%<br />
July 9,5 43% 9,3 42% 8,9 40% 0,7 40%<br />
August 9,3 42% 9,1 41% 8,8 39% 0,7 39%<br />
September 10,5 49% 10,3 48% 9,9 46% 0,8 45%<br />
October 10,1 46% 9,9 45% 9,5 43% 0,7 42%<br />
November 9,8 45% 9,6 44% 9,2 43% 0,7 42%<br />
December 8,4 38% 8,2 37% 7,9 35% 0,6 35%<br />
Total 98,9 38% 96,7 37% 92,8 35% 7,1 35%
Table 19 – P50 monthly net energy production <strong>and</strong> capacity factor.<br />
Month <strong>Production</strong><br />
[GWh]<br />
Monte Alegre I Monte Alegre II Monte Alegre III Monte Alegre IV<br />
Capacity<br />
Factor<br />
<strong>Production</strong><br />
[GWh]<br />
Capacity<br />
Factor<br />
Maurizio Motta, M. Sc. (Physics), <strong>Wind</strong> <strong>Energy</strong> Consultant ____________________________________<br />
EMD Responsible for the Project (name, formation, function)<br />
Per Nielsen, M.Sc. Eng, Manager _________________________________<br />
49<br />
<strong>Production</strong><br />
[GWh]<br />
Capacity<br />
Factor<br />
<strong>Production</strong><br />
[GWh]<br />
Capacity<br />
Factor<br />
January 5,9 27% 5,6 25% 5,6 25% 0,4 26%<br />
February 5,3 26% 5,0 25% 5,0 25% 0,4 25%<br />
March 5,0 23% 4,8 22% 4,8 22% 0,4 23%<br />
April 5,8 27% 5,5 25% 5,4 25% 0,4 26%<br />
May 6,4 29% 6,1 27% 6,0 27% 0,5 28%<br />
June 6,8 31% 6,4 30% 6,4 30% 0,5 30%<br />
July 8,0 36% 7,6 34% 7,6 34% 0,6 35%<br />
August 7,9 36% 7,5 34% 7,5 34% 0,6 34%<br />
September 8,9 42% 8,5 39% 8,4 39% 0,7 40%<br />
October 8,6 39% 8,2 37% 8,1 37% 0,6 37%<br />
November 8,3 39% 7,9 37% 7,9 36% 0,6 37%<br />
December 7,1 32% 6,8 30% 6,7 30% 0,5 31%<br />
Total 84,1 32% 79,9 31% 79,5 30% 6,2 31%
7 REFERENCES<br />
[1] Costa, S. A., Urupema wind farm, Measurement South mast, VILCO Engenharia e<br />
Consultoria<br />
[2] Costa, S. A., Mast report, Bonsucesso wind farm, VILCO Engenharia e Consultoria<br />
[3] Telöcken, J. A., Documentação de Entrega de Obra - Bonsucesso, Messtechnik<br />
[4] Chaves, P., Bonsucesso <strong>and</strong> Urupema wind power projects – Main Information, VILCO<br />
Engenharia e Consultoria<br />
[5] Costa S. A., Relatório de fiscalização: instrumentação de torre anemométrica – Parque<br />
eólico Bonsucesso, VILCO Engenharia e Consultoria<br />
[6] Lindholm, D., Pre-evaluation of site <strong>and</strong> recommendations, EMD, 2010<br />
[7] International Electrotechnical Commission - IEC 6-1400 Part 12-1 Ed.1: Power<br />
performance measurements of electricity producing wind turbines, 2005<br />
[8] International <strong>Energy</strong> Agengy Programme - IEA – Recommended practices for wind turbine<br />
testing <strong>and</strong> evaluation: 11. <strong>Wind</strong> Speed Measurement <strong>and</strong> use of cup anemometry, 1999<br />
[9] Network of European Measuring Institutes - MEASNET - Evaluation of Site specific wind<br />
condition, 2009<br />
[10] Empresa de Pesquisa Energética - EPE – Nota Técnica 04/12 – Instrução para as<br />
medições anemométricas e climatológicas – Leilão de Energia de Reserva, 2012<br />
[11] Empresa de Pesquisa Energética - EPE – Instruções para Solicitação de Cadastramento e<br />
Habilitação Técnica com vistas a participação nos leilões de Energia Elétrica, 20011<br />
[12] Agência Nacional de Energia Elétrica - ANEEL – Resolução Normativa nº 391, 2009<br />
[13] Troen, I. <strong>and</strong> Petersen, E.L. - European <strong>Wind</strong> Atlas, Risø National Laboratory, 1989.<br />
50
8 ANNEX<br />
8.1 EMD Company Description <strong>and</strong> <strong>Certification</strong> References<br />
EMD is a software <strong>and</strong> consultancy company supplying countries worldwide with<br />
software <strong>and</strong> consultancy services within the field of project design, planning <strong>and</strong><br />
documentation of environmental friendly energy projects, particularly wind energy projects.<br />
EMD has its main office located in Aalborg, Denmark <strong>and</strong> regional sales offices in<br />
Germany, France, Spain, United Kingdom, USA, Turkey <strong>and</strong> China. The company has a total<br />
staff of 20 - 25 employees.<br />
EMD participates in various ongoing research <strong>and</strong> development activities within the<br />
renewable energy sector <strong>and</strong> this ensures that the EMD software is continuously upgraded<br />
with the latest knowledge <strong>and</strong> experience available within the area. The result is userfriendly,<br />
flexible <strong>and</strong> reliable software developed based on the latest knowledge <strong>and</strong><br />
experience within the area <strong>and</strong> according to the dem<strong>and</strong>s of our many users worldwide.<br />
The consultancy team at EMD is internationally recognized for its independent<br />
expertise within wind energy as well as within development of co/tri-generation projects.<br />
As wind consultants, EMD has a long worldwide experience. Consultancy jobs have been<br />
performed from Canada to Australia <strong>and</strong> from Japan to USA. EMD performs over 200<br />
consultancy jobs each year within wind energy for private companies <strong>and</strong> banks as well as<br />
longer-term project assignments for DANIDA, the World Bank <strong>and</strong> other international<br />
institutions.<br />
Since 1998, the wind consultancy team at EMD has conducted wind resource<br />
assessment, micro-siting <strong>and</strong> bankable annual energy production assessments on over 700<br />
wind farm projects worldwide with a planned capacity of more than 35,000 MW.<br />
51
8.2 <strong>Wind</strong> Turbine: technical specifications <strong>and</strong> power curve<br />
52
8.3 <strong>Wind</strong>PRO results<br />
53
8.4 Anemometers – Calibration Certificates<br />
54
27-03-2012 Page 1 of 15<br />
<strong>Wind</strong> Farm <strong>Energy</strong> Assessments performed by EMD 1998-2011<br />
Country Site Year MW Sites<br />
Bahamas More sites 2010 50<br />
Bahamas Total 50<br />
Brazil Aracati 2003 50<br />
Campos_de_Palmas 2011 -<br />
Ceará 2011 -<br />
Minas Gerais 2011 -<br />
Rota das Araucárias 2011 -<br />
São José (New Aparados da Serra) 2011 -<br />
Xanadu_Anil 2011 -<br />
Brazil Total 50<br />
Bulgaria Dabrava_Vidno_Gurkovo 2009 54<br />
Hrabrovo 2009 40<br />
Kaliakra 2006 35<br />
Kavarna 2006 1<br />
Long Man M1 2006 6<br />
LongMan 2010 8<br />
Novakovo 2009 8<br />
Rakovski 2008 2<br />
Sliven 2007 2<br />
Sokol 2010 2<br />
Vidno 2008 18<br />
Bulgaria Total 176<br />
Canada Naikun 2008 320<br />
Canada Total 320<br />
China 6 <strong>Wind</strong>farms 2008 213<br />
Baicheng 2008 69<br />
Datang Zhuozi 2006 38<br />
Guazhou 2010 150<br />
Xilinhot 2007 49<br />
Xiwu 2008 50<br />
China Total 568<br />
Croatia Ljupina 2007 8<br />
Croatia Total 8<br />
Cyprus Larnaka 2006 120<br />
Paphos 2006 120<br />
Cyprus Total 240<br />
Denmark 10 DK sites 2010 90<br />
20 sites 2009 117<br />
5 near offshore DK 2011 300<br />
Allerød 2009 2<br />
Andi 2009 10<br />
Anholt 2009 400<br />
Assing 2011 9<br />
Auras 2010 8<br />
Ausumgaard 2009 9<br />
Bedsted 2010 4<br />
Bella Center 2008 1<br />
BellaCenter 2009 1<br />
Blaksmark 2010 7<br />
Bornholm 2003 6<br />
Borre, Oksbøl 2004 3<br />
Bovnum 2008 3<br />
Brorstrup 2007 7<br />
Brorstrup Mose 2010 18<br />
Bützov 2008 7<br />
Båstrup 2010 15<br />
EMD International A/S, Niels Jernesvej 10, DK-9220 Aalborg, tel.+45 9635 4444, fax. +45 9635 4446, www.emd.dk<br />
1<br />
7<br />
11<br />
1<br />
6<br />
1<br />
2
27-03-2012 Page 2 of 15<br />
<strong>Wind</strong> Farm <strong>Energy</strong> Assessments performed by EMD 1998-2011<br />
Country Site Year MW Sites<br />
Central Jutl<strong>and</strong> (4 sites) 2002 84<br />
Djursl<strong>and</strong> 2008 400<br />
Drøstrup 2006 12<br />
Døstrup 2011 15<br />
Egebaks<strong>and</strong>e 2009 14<br />
Eghøj 2010 5<br />
Egvad, 6 projects 2009 60<br />
Ellesø 2008 5<br />
Eskildstrup 2010 7<br />
Farsø 2002 -<br />
Filskov 2002 8<br />
Fjelsborg 2003 1<br />
Flade 2008 14<br />
Flade, Mors 2004 8<br />
Fly, Bajlum, Gråhede & Kragerupgård 2011 54<br />
Frederikshavn 2001 18<br />
Fristrup 2009 16<br />
Furresø 2011 -<br />
Fårup 2007 -<br />
Gammelstrup 2007 3<br />
Gamst 2008 3<br />
Gedmosen 2002 10<br />
Gettrup 2009 12<br />
Gettrup Mark 1999 4<br />
Ginderup 2005 4<br />
Gingsholm 2010 9<br />
Gjørup 2007 4<br />
GlorupGods 2010 9<br />
Grenå harbour 2002 7<br />
Grindsted 2011 30<br />
Haderslev 2010 9<br />
Hagesholm 2010 16<br />
Hald 2009 15<br />
Hampen 2006 1<br />
Hanstholm 2005 54<br />
Harboøre 2007 102<br />
Harring 2002 3<br />
Hemmet 2006 8<br />
Hestkær 2007 7<br />
Hjardemål 2002 10<br />
Hjerning 2011 15<br />
Hokkerup 2002 1<br />
Holl<strong>and</strong>sbjerg 2001 17<br />
Holstebro 2008 5<br />
Horns Rev-2 2004 202<br />
Hvide S<strong>and</strong>e 2009 12<br />
Hørning 2009 8<br />
Hørsted 2002 1<br />
Høvsøre 1999 42<br />
Ilshøj 2011 14<br />
Jelling 2000 2<br />
Jutl<strong>and</strong> (4 projects) 2002 107<br />
Kallerup 2007 9<br />
Katrineholm 2008 9<br />
Katrineholms Piber 2008 9<br />
Kirke Hyllinge 2003 10<br />
EMD International A/S, Niels Jernesvej 10, DK-9220 Aalborg, tel.+45 9635 4444, fax. +45 9635 4446, www.emd.dk
27-03-2012 Page 3 of 15<br />
<strong>Wind</strong> Farm <strong>Energy</strong> Assessments performed by EMD 1998-2011<br />
Country Site Year MW Sites<br />
Kjeldberg 2010 9<br />
Korup 2011 12<br />
Kragelund 2011 4<br />
Kragerupgård 2010 18<br />
Krashave 2011 3<br />
Krogstrup 2010 12<br />
Kærende 2010 9<br />
Københavnerheden 2001 5<br />
Københoved 2008 3<br />
Lejbølle 2008 11<br />
Lem Kær 2008 20<br />
Lerchenborg 2009 18<br />
Lindknud 2003 5<br />
Lindø 2011 5<br />
Lyngdrup 2007 16<br />
Løgtved 2011 12<br />
Løvegaard 2002 3<br />
Marienburg 2009 15<br />
Mejl Flak (Havvind Århus Bugt) 2011 140<br />
Middelgrunden 1999 40<br />
Mors 2008 11<br />
Mors 2004 8<br />
Møldrup 2005 4<br />
Mølhave 2008 8<br />
Møllebjerg 1999 2<br />
Måde/Nordjyl<strong>and</strong>sværk 2010 29<br />
Nissum Bredning 2011 84<br />
Nordjyll<strong>and</strong>sværket 2003 12<br />
Nysted-2 2005 400<br />
Næsbjerg 2002 8<br />
Nørre Bork 2002 22<br />
Nørrekær Enge 2002 25<br />
Odder 2008 12<br />
Odense Havn 2011 7<br />
Overgård 1999 80<br />
Ovnbøl 2011 12<br />
Ovnsbøl 2010 12<br />
Pogemose 2011 9<br />
Påkærvej 2007 1<br />
Rakkeby 2005 -<br />
Ravnkilde 2011 11<br />
Rens 2008 18<br />
Rigtrup 2009 16<br />
Rise, Ærø 2002 6<br />
Roager 2010 12<br />
Rosvang 2011 29<br />
Rudmose 2008 7<br />
Rødkærsbro 2008 11<br />
Røds<strong>and</strong> 2001 166<br />
Rønbjerg 2002 3<br />
Samsø Offshore 2000 46<br />
Sdr Balling 2005 6<br />
Sdr Omme 2011 36<br />
Sdr. Herred plantage 2009 18<br />
Sdr. Omme 2010 30<br />
Sindbjerg 2011 18<br />
EMD International A/S, Niels Jernesvej 10, DK-9220 Aalborg, tel.+45 9635 4444, fax. +45 9635 4446, www.emd.dk
27-03-2012 Page 4 of 15<br />
<strong>Wind</strong> Farm <strong>Energy</strong> Assessments performed by EMD 1998-2011<br />
Country Site Year MW Sites<br />
Sjørring Sø 2008 18<br />
Skafeøgård gods 2010 9<br />
Skallerup 2008 9<br />
Sk<strong>and</strong>erborg 2008 11<br />
Skansen 2008 4<br />
Skarp-salling 2006 3<br />
Skattebølle 2003 1<br />
Skibsted 2004 5<br />
Skiffard 2010 9<br />
Sprogø 2008 21<br />
St. Arden 2011 10<br />
Stensgård 2007 12<br />
Sundsøre 2005 43<br />
Svenstrup 2011 12<br />
Svoldrup 2009 18<br />
Syddjurs 2009 13<br />
Søllested 2011 9<br />
Sønder Omme 2010 27<br />
Søndergård 2008 1<br />
Testrupvej 2010 9<br />
Timring 2001 5<br />
Tjæreborg 2001 2<br />
Tjørnved 2010 5<br />
Todbølvej 2005 11<br />
Trehøje 2001 7<br />
Trevillac 2002 8<br />
Trolshede 2008 9<br />
Trøllund 2011 6<br />
Turebylille 2011 12<br />
Tæbring 2003 5<br />
Tåsinge 2008 5<br />
Urup 2003 12<br />
V<strong>and</strong>el 2011 81<br />
Vedersø Kær 1999 6<br />
Vejerslev 2002 3<br />
Vejle, 9 sites 1999 47<br />
Vejrup 2009 30<br />
Vester Barde 2009 6<br />
Vognkær 2006 15<br />
Ærø 1999 8<br />
Østerild 2011 -<br />
Aalborg 2008 16<br />
Aalborg Østhavn 1999 24<br />
Ålestrup 2010 8<br />
Denmark Total 4.623<br />
Egypt ElZayt 2006 120<br />
ElZayt_Italgen 2010 100<br />
ElZayt_NREA project 2009 200<br />
Marsa alam 2006 20<br />
Zafarana 2004 140<br />
Zafarana-1 1999 30<br />
Zafarana-2 1999 30<br />
Zafarana-3 1999 33<br />
Egypt Total 673<br />
Estonia Aseri 2008 24<br />
Kunda 2007 6<br />
EMD International A/S, Niels Jernesvej 10, DK-9220 Aalborg, tel.+45 9635 4444, fax. +45 9635 4446, www.emd.dk<br />
176<br />
8
27-03-2012 Page 5 of 15<br />
<strong>Wind</strong> Farm <strong>Energy</strong> Assessments performed by EMD 1998-2011<br />
Country Site Year MW Sites<br />
Pakri 2002 75<br />
Pakri 2 2011 54<br />
Pakri II 2007 48<br />
Paldiski 2004 20<br />
Paldiski 2 2003 69<br />
Rõuste 2004 16<br />
Türisalo 2004 21<br />
Vaivina 2011 44<br />
Vanakula 2011 9<br />
Virtsu 2008 10<br />
Viru-Nigula 2007 -<br />
Estonia Total 397<br />
Faroe Isl<strong>and</strong>s Hvalbas 2010 3<br />
Faroe Isl<strong>and</strong>s Total 3<br />
Finl<strong>and</strong> Forssa 2011 99<br />
Siipyy <strong>and</strong> Inkoo 2010 519<br />
Finl<strong>and</strong> Total 618<br />
France Bel Air 2009 7<br />
Bouin, Frankrig 2002 22<br />
Cormainville 2006 60<br />
Echanvilliers 2007 12<br />
Edern 1999 7<br />
Gravieres 2007 11<br />
Korsika 1998 2<br />
Longue Epine 2004 20<br />
Merdelou 1998 4<br />
Moulin d'Autrementcourt 2008 15<br />
Narbonne 2003 20<br />
pargues, Bourguignons 2007 24<br />
Pleyber-Christ 2006 6<br />
Plouray 2007 -<br />
Seglien 2005 9<br />
Silfiac 2005 3<br />
Trevillac 2002 5<br />
France Total 226<br />
Germany 14 sites in Germany 2010 175<br />
4 offshore Germany 2008 1.500<br />
Achim 2009 5<br />
Aerzen 2004 8<br />
Alpen 2008 10<br />
Assendorph 2006 4<br />
Atzendorf 2005 8<br />
Bad Essen 2005 8<br />
Bad G<strong>and</strong>ersheim 2008 8<br />
Bad Iburg 2005 7<br />
Badeleben II 2005 10<br />
Badingen 2000 14<br />
Bageritz 2003 4<br />
Barslund 2006 6<br />
Bennigsen 2006 2<br />
Benz 2005 3<br />
Berg 2003 11<br />
Berge-Kleeste 2005 17<br />
Beserits 2004 8<br />
Bippen 2005 28<br />
Blaufelden 2004 22<br />
EMD International A/S, Niels Jernesvej 10, DK-9220 Aalborg, tel.+45 9635 4444, fax. +45 9635 4446, www.emd.dk<br />
13<br />
1<br />
2<br />
17
27-03-2012 Page 6 of 15<br />
<strong>Wind</strong> Farm <strong>Energy</strong> Assessments performed by EMD 1998-2011<br />
Country Site Year MW Sites<br />
Bliesdorf 2004 8<br />
Borne 2005 5<br />
Breeze 2007 350<br />
Buchbrunn 2009 13<br />
Bulack 2007 6<br />
Burbach 2007 -<br />
Burg-Gemunden 2004 8<br />
Burg-Gemünden 2007 -<br />
Bützow 2007 -<br />
Charlottenhof 2011 -<br />
Coesfeld 2006 8<br />
Crussow 2004 16<br />
Cunnersdorf, Lederhose og Wesenberg 2002 14<br />
Dammfledt 2008 9<br />
Dammfleth-Hochfeld 2006 8<br />
Dretzen 2004 15<br />
Dörenhagen 2006 8<br />
Eckstever 2005 5<br />
Eichede 2003 5<br />
Elblang 2004 8<br />
Elsterheide 2006 4<br />
Elsterwerda 2005 8<br />
Erlangen 2003 10<br />
Extertal 2004 8<br />
Freudenberg 2008 2<br />
Freyenstein 2006 16<br />
Gamlen 2009 6<br />
Ganzer 2005 12<br />
Gerdshagen 2010 13<br />
Glasin 2006 4<br />
Gottberg 2007 3<br />
Grosskorbetha 2006 28<br />
Grossvargula 2005 10<br />
Güntersdorf 2005 26<br />
Hagnelberg 2003 22<br />
Haldesleben 2005 4<br />
Halenbeck 2006 18<br />
Heerde 2004 4<br />
Heidenau 2005 6<br />
Helberge 2006 48<br />
Herbsleben 2011 3<br />
Herzogenrath 2006 4<br />
Hesselbach 2008 10<br />
Hilgermissen 2005 2<br />
Hude 2009 10<br />
Hüffler 2006 4<br />
Höfer 2004 8<br />
Hörningen 2006 2<br />
Illerich 2009 4<br />
Jülich 2011 2<br />
Kall 2008 21<br />
Kirchdorf 2007 2<br />
Kirchheilingen 2004 2<br />
Krevese 2006 6<br />
Krevesse 2004 8<br />
Kruge-Gersdorf 2006 8<br />
EMD International A/S, Niels Jernesvej 10, DK-9220 Aalborg, tel.+45 9635 4444, fax. +45 9635 4446, www.emd.dk
27-03-2012 Page 7 of 15<br />
<strong>Wind</strong> Farm <strong>Energy</strong> Assessments performed by EMD 1998-2011<br />
Country Site Year MW Sites<br />
Kylburgweiler 2004 8<br />
Lahstedt 2005 10<br />
L<strong>and</strong>in 2004 2<br />
Langeneichstedt 2004 4<br />
Langengrassau 2006 4<br />
Laubersreuth 2005 4<br />
Lehrte 2007 9<br />
Litzendorf 2006 3<br />
Luckau 2007 20<br />
Marienburg 2007 -<br />
Martinskirchen 2005 14<br />
Meineweh 2007 5<br />
Meschede 2005 9<br />
Moorhusen 2006 3<br />
Muhstedt 2006 2<br />
Munchenberg 2004 9<br />
Mutzschen 2007 10<br />
Mühlanger 2007 -<br />
Müncheberg 2005 8<br />
Möglens 2005 10<br />
Mönchengladbach 2006 4<br />
Nettetal 2005 6<br />
Neuferchau 2003 10<br />
Niedere Börde 2006 2<br />
Niederzier 2004 8<br />
Ochtrup 2010 4<br />
Oelerse 2004 14<br />
Oster Cappelen 2004 24<br />
Pattensen 2007 4<br />
Pegau 2006 6<br />
Pirkach 2003 2<br />
Pirow 2007 -<br />
Pretxier 2003 3<br />
Repower 2005 101<br />
Rheinstedt 2001 2<br />
Riesenbech 2007 -<br />
RoterBerg 2005 6<br />
Saerbeck 2005 8<br />
Salzgitter 2007 -<br />
Samersbach 2004 9<br />
Scheibe 2004 8<br />
Scheibe-Trattendorf 2006 16<br />
Schkortleben 2006 28<br />
Schwarzer Berg II 2009 4<br />
Schönhagen 2004 20<br />
Sebbenhausen 2004 16<br />
Sierschleben 2004 8<br />
Siestedt 2006 26<br />
Sillerup 2005 30<br />
Soltau 2005 29<br />
South Germany 2008 16<br />
Stockdorf 2006 18<br />
Stüdenitz 2006 8<br />
Timpberg 2003 16<br />
Trattendorf 2005 10<br />
Trebitz 2007 18<br />
EMD International A/S, Niels Jernesvej 10, DK-9220 Aalborg, tel.+45 9635 4444, fax. +45 9635 4446, www.emd.dk
27-03-2012 Page 8 of 15<br />
<strong>Wind</strong> Farm <strong>Energy</strong> Assessments performed by EMD 1998-2011<br />
Country Site Year MW Sites<br />
Ucermark 2001 2<br />
Ukendt 2006 3<br />
Urbshat 2007 -<br />
Vierschau 2010 5<br />
Vlotho 2006 3<br />
Voltlage 2005 11<br />
Wadersloh 2005 5<br />
Wallenhorst 2004 8<br />
Wehrendorf 2005 2<br />
Wellen 2006 10<br />
Welzow 2005 40<br />
Wernitz 2004 22<br />
Wester Kappeln 2005 2<br />
Westerberg 2007 14<br />
Westerhausen 2005 2<br />
Wettendorf 2006 20<br />
Wismar 2007 -<br />
Wittighausen 2010 6<br />
Wormlage 2005 8<br />
Wulfsen 2005 7<br />
Wundersleben 2006 6<br />
Wüllersleben 2005 6<br />
Zabeldorf 2003 9<br />
Zehlensdorf 2007 -<br />
Zwickau 2005 4<br />
Germany Total 3.498 158<br />
Greece Chelona 1998 7<br />
Keveros 2002 31<br />
Kilkis 2002 248<br />
Logotheti 2000 4<br />
Malavria 2002 30<br />
Panachaikos 2007 48<br />
Servourni 2006 21<br />
Vlachokerassia 1999 34<br />
Greece Total 424 8<br />
Honduras Cero de Hula 2008 101<br />
Honduras Total 101 1<br />
Indonesia Martinroda 2007 -<br />
Indonesia Total #N/A 1<br />
Irel<strong>and</strong> Altahullion 2003 26<br />
Armitage 2002 7<br />
Ballybeagh 2004 7<br />
Ballyragget 2011 4<br />
Barranafaddock 2009 44<br />
Beal Hill 2002 3<br />
Beallough 2003 2<br />
Bearna Gaoithe Teoranta phase 2 2008 2<br />
Bellacorich 2001 356<br />
Clogheravaddy/Ballyduff 2011 5<br />
Drimoleague 2004 4<br />
Dunmanven 2003 5<br />
Dunmore 2003 3<br />
Garraneagh 2010 16<br />
Garranereagh 2008 8<br />
Keelderry 2001 25<br />
Killybegs 2005 10<br />
EMD International A/S, Niels Jernesvej 10, DK-9220 Aalborg, tel.+45 9635 4444, fax. +45 9635 4446, www.emd.dk
27-03-2012 Page 9 of 15<br />
<strong>Wind</strong> Farm <strong>Energy</strong> Assessments performed by EMD 1998-2011<br />
Country Site Year MW Sites<br />
Kilvinana Phase 2 2010 6<br />
Lahanaught 2005 4<br />
Meenailta 2004 5<br />
Monsey 2002 7<br />
Shillelagh 2003 3<br />
Sonnagh 2003 8<br />
Toomyvara 2003 3<br />
Irel<strong>and</strong> Total 559<br />
Israel Mei-Golan 2007 372<br />
Israel Total 372<br />
Italy Agostino 2007 259<br />
Avetrana 2005 5<br />
Bivona 2006 24<br />
Bratello & Fillattiera 2001 25<br />
Brattello 2008 16<br />
Castellenata 2008 90<br />
Cellino S. Marco 2008 45<br />
Contessa 2006 31<br />
Corleone 2006 22<br />
Deliceto 2009 30<br />
Delicetto 2008 88<br />
Fosso del Lupo 2006 84<br />
Laterza 2008 108<br />
Messina 2006 42<br />
Monte Cavallo 2003 101<br />
Monterenzio 2006 14<br />
Mottola 2011 28<br />
Pianopoli 2011 80<br />
Podermuovo 2009 9<br />
Puglia 5 sites 2009 20<br />
San Bernado 2004 23<br />
San Bernado-follow up 2010 13<br />
Sefro & Fiuminata 2001 39<br />
Sicily 2002 180<br />
Tortorici 2006 24<br />
Varese Ligure 2001 5<br />
Vizzini 2006 27<br />
Italy Total 1.431<br />
Japan Kagamiyama 2004 17<br />
Japan Total 17<br />
Kenya 7 KenGen sites 2011 600<br />
Kinangop 2011 63<br />
Lake Turkana 2010 300<br />
Kenya Total 963<br />
Korea Korea Offshore Jeju & Busan 2009 165<br />
Taean 2009 648<br />
Korea Total 813<br />
Latvia Atvari2 2008 46<br />
Grobina 2002 20<br />
Mezde & Vecia Forti 2000 20<br />
Offshore 2011 444<br />
Uzava 2008 100<br />
Uzavas 2009 200<br />
Vainode 2011 41<br />
Vides 2010 7<br />
Latvia Total 878<br />
EMD International A/S, Niels Jernesvej 10, DK-9220 Aalborg, tel.+45 9635 4444, fax. +45 9635 4446, www.emd.dk<br />
24<br />
1<br />
27<br />
1<br />
3<br />
2<br />
8
27-03-2012 Page 10 of 15<br />
<strong>Wind</strong> Farm <strong>Energy</strong> Assessments performed by EMD 1998-2011<br />
Country Site Year MW Sites<br />
Lithuania Ciuteliai 2007 40<br />
Ciuteliai, Lankupiai, Grumbliai 2009 40<br />
Dundaga 2008 20<br />
Juknaiciai 2008 30<br />
Kretinge <strong>and</strong> Anyksciai 2009 200<br />
Mazeikiai 2010 150<br />
Mockiai 2008 20<br />
Palanga 2003 6<br />
Shilale 2006 20<br />
Silale 2008 24<br />
Silate 2010 14<br />
Silute 2011 110<br />
Sudenai 2007 38<br />
Unkown 2009 6<br />
Vezaicia 2007 16<br />
Vezaiciai 2003 38<br />
Vidmantai 2005 27<br />
Zidikai 2003 0<br />
Zvirgzdaiciai 2011 48<br />
Lithuania Total 846<br />
Mexico La Venta 2002 33<br />
Mexico Total 33<br />
Morocco Boujmil 2009 300<br />
Laayoune 2006 20<br />
Morocco Total 320<br />
Nicaragua Las Sierras 2006 41<br />
Ometepe 2005 1<br />
Pacaya 2005 18<br />
Rivas 2006 41<br />
Nicaragua Total 102<br />
Norway Andamyran 2009 135<br />
Andmyran 2006 160<br />
Aure 2007 113<br />
Berg 2004 5<br />
Bjerkreim 2011 480<br />
Bremanger 2000 1<br />
Eike-&Steinsl<strong>and</strong> 2006 216<br />
Eikel<strong>and</strong> 2007 -<br />
Havgul 2005 1.499<br />
Havøygavlen 2000 53<br />
Hestholmen 1998 2<br />
Kamøya 2007 600<br />
Markee 2007 -<br />
Mehuken 2001 4<br />
Midtfjellet 2008 138<br />
More sites 2008 345<br />
Narvik 2003 23<br />
Northsea 2008 1.000<br />
Norway 2009 300<br />
Several Norwegian projects 2010 500<br />
Siragrunnen 2008 200<br />
Skreifjellat 2010 126<br />
Smøla 2002 80<br />
Tonstad 2010 300<br />
Norway Total 6.279<br />
Pakistan Jhimpir 2009 1<br />
EMD International A/S, Niels Jernesvej 10, DK-9220 Aalborg, tel.+45 9635 4444, fax. +45 9635 4446, www.emd.dk<br />
19<br />
1<br />
2<br />
4<br />
24
27-03-2012 Page 11 of 15<br />
<strong>Wind</strong> Farm <strong>Energy</strong> Assessments performed by EMD 1998-2011<br />
Country Site Year MW Sites<br />
Tenaga 2011 50<br />
Pakistan Total 51<br />
Phillipines Saolit 2000 42<br />
Phillipines Total 42<br />
Pol<strong>and</strong> Barzowice 2003 20<br />
Barzowice-2 2002 18<br />
Bels 2008 40<br />
Charnowo 2003 14<br />
Chasno 2008 70<br />
Dabrowice 2008 40<br />
Drzezewo 2004 30<br />
Duninowo 2002 180<br />
Duszniki 2007 -<br />
Duszniki, Kozlovski <strong>and</strong> Lebcz, 2006 147<br />
<strong>Energy</strong> Park 44 2006 44<br />
Gluchow 2010 40<br />
Grzegorzew 2008 100<br />
Grzegozew 2007 125<br />
Hajnowka 2008 70<br />
Ilza3 2011 84<br />
Karcino 2005 90<br />
Karcino-2 2006 17<br />
Karolin 2005 30<br />
Keblowo 2011 4<br />
Kiesielice 2005 41<br />
Kluczbork 2009 40<br />
Kowalewo 2009 48<br />
Krzyzanow 2008 14<br />
Kukinia 2007 36<br />
Lasin 2011 3<br />
Leki Dukielski 2002 8<br />
Lezcyca 2008 8<br />
Linowo 2010 50<br />
Lisewo 2007 12<br />
Lodz 2007 4<br />
Lubawa 2008 60<br />
Lukaszow 2009 73<br />
Lutol - Kluczbork 2011 50<br />
Modlikowice <strong>and</strong> Łukaszów 2008 58<br />
More sites 2008 150<br />
Nacmierz 2007 -<br />
Niewolno 2011 6<br />
Northern Pol<strong>and</strong>, more sites 2000 200<br />
Pepsa 2008 138<br />
Polczyno 2005 2<br />
Puck 2004 8<br />
Rebielice 2009 48<br />
Rewal & Samlino 2001 20<br />
Roby 2006 4<br />
Ronica 2006 20<br />
Rypin 2008 3<br />
Sanniki 2008 8<br />
Sniatowo 2004 30<br />
Stramnica 2001 6<br />
Szczawin & Sanniki 2008 98<br />
Tychowo 2005 49<br />
EMD International A/S, Niels Jernesvej 10, DK-9220 Aalborg, tel.+45 9635 4444, fax. +45 9635 4446, www.emd.dk<br />
2<br />
1
27-03-2012 Page 12 of 15<br />
<strong>Wind</strong> Farm <strong>Energy</strong> Assessments performed by EMD 1998-2011<br />
Country Site Year MW Sites<br />
Tymien 2003 50<br />
Utska & Dobieszewo 2007 -<br />
Walcz 2005 5<br />
Wartkowo 2009 30<br />
Weltzin 2001 1<br />
Wicko 2005 40<br />
Witkowo 2010 4<br />
Wojcieszyn 2010 28<br />
Zagorze 2000 30<br />
Zajaczkowo 2004 90<br />
Zakrzewo 2002 11<br />
Zakrzewo & Barzowice II 2006 14<br />
Zaleskie, Ustka 2006 38<br />
Zelazno 2010 38<br />
Zensko 2009 8<br />
Zlotow 2011 8<br />
Pol<strong>and</strong> Total 2.846<br />
Romania Adjud 2009 1.456<br />
Albesti 2009 10<br />
Apollo 2011 -<br />
Constanza 2004 -<br />
Cusa Voda, Bordei Verde <strong>and</strong> Insurate 2010 20<br />
Mahmudia 2010 4<br />
Saligny + Baia 2008 165<br />
Schela 2011 8<br />
Smulti, Virlezi <strong>and</strong> Pechea 2010 14<br />
Smulti_Virlezi_Pechea 2010 16<br />
Romania Total 1.693<br />
Russia Kaliningrad 1999 5<br />
Russia Total 5<br />
Slovakia Bratislava 2007 100<br />
Slovakia Total 100<br />
South Africa Nobelsfontein 2011 74<br />
South Africa Total 74<br />
SriLanka More sites evaluated 2010 500<br />
SriLanka Total 500<br />
Sweden Albrunna 1999 11<br />
Betåsberget 2011 -<br />
Bjärsgård 2008 24<br />
Bondöen expansion 2010 25<br />
Bondön 2002 107<br />
Brahehus 2009 18<br />
Brattön 2009 15<br />
Brännåsen 2011 -<br />
Bydalen 2002 1<br />
Bösjövarden 2010 21<br />
Bösjåovarden 2011 27<br />
Dalbygda 2011 30<br />
Degerhamn 2003 1<br />
Digeberget 2004 1<br />
Dingle skogen 2010 28<br />
Erikstad 2009 3<br />
Eslöv 2003 9<br />
Falkenberg 2001 156<br />
Fallåsberget 2011 33<br />
Falskog 2011 14<br />
EMD International A/S, Niels Jernesvej 10, DK-9220 Aalborg, tel.+45 9635 4444, fax. +45 9635 4446, www.emd.dk<br />
68<br />
10<br />
1<br />
1<br />
1<br />
1
27-03-2012 Page 13 of 15<br />
<strong>Wind</strong> Farm <strong>Energy</strong> Assessments performed by EMD 1998-2011<br />
Country Site Year MW Sites<br />
Fanbun 1999 5<br />
Femstenaberg 2009 38<br />
Fröslida 2010 18<br />
Gotl<strong>and</strong> 1998 22<br />
Gotl<strong>and</strong>, Väskinde 2001 1<br />
Gråtanliden 2011 -<br />
Hakarp 2011 24<br />
Hall<strong>and</strong> 2009 13<br />
Hallsberg 2011 6<br />
Hanöbukten 2006 315<br />
Havsnäs 2006 96<br />
Hedbodberget 2007 72<br />
Hjuleberg 2010 41<br />
Hornberget 2005 12<br />
Hunnflen 2004 11<br />
Husum 2001 5<br />
Häcksta 2007 -<br />
Hällevadsholm 2010 7<br />
Håcksta 2004 10<br />
Håscksta 2011 10<br />
Karlskrona 2000 2<br />
Kil 2009 8<br />
Kiruna 2001 5<br />
Klasgården 2001 20<br />
Klimpfläll 1999 3<br />
Korpflället 2010 35<br />
Kulltorp 2008 13<br />
Kyrkberget 2009 40<br />
Källs Nöbbelöv 2003 2<br />
Kåphult 2010 23<br />
L<strong>and</strong>skrona 2006 72<br />
Laxeby 2002 1<br />
Lille Stalofjellet 2000 10<br />
Lillgrund 2005 144<br />
Linderödsåsen 2009 66<br />
Lingbo 2011 27<br />
Lunakullen 2006 89<br />
Lunnekullen 2006 110<br />
Löberöd 2003 10<br />
Lökaryd 2008 20<br />
Lövstaviken 2002 12<br />
Långåvålen 1999 11<br />
More sites 2008 158<br />
Mullberget 2011 -<br />
Mässingberget 2010 24<br />
Mörnarpa 2002 4<br />
Norrvåge 2000 2<br />
Nyvallsåsen 2011 -<br />
Näsudden 2010 66<br />
Odarlöv 1999 9<br />
Pahtohavare 2003 11<br />
Piteå 2001 1<br />
Ratan 2001 1<br />
Riseröd 2002 9<br />
Rätan 2011 56<br />
Röbergskullen 2007 16<br />
EMD International A/S, Niels Jernesvej 10, DK-9220 Aalborg, tel.+45 9635 4444, fax. +45 9635 4446, www.emd.dk
27-03-2012 Page 14 of 15<br />
<strong>Wind</strong> Farm <strong>Energy</strong> Assessments performed by EMD 1998-2011<br />
Country Site Year MW Sites<br />
Råshön 2003 15<br />
Saxberget 2006 30<br />
Sjisjka 2011 90<br />
Sjungkalotten 2007 -<br />
Sjöbo 2000 5<br />
Skarhults Nygård 2004 8<br />
Snäckebjär 2007 30<br />
Stora Pølsan 2009 601<br />
Store Middelgrund 2010 400<br />
Store Middelgrunden 2009 400<br />
Stor-Rotlinen 2008 40<br />
Storrun 2007 30<br />
Storungs 2000 9<br />
Strömsbruk 2002 3<br />
Sundwall 2000 50<br />
Svalöv 2001 5<br />
Sweden, 8 off shore 2001 688<br />
Sölve 2011 4<br />
Tjärnskogen/SCANraff 2002 22<br />
Tolvmanstegen 2011 109<br />
Töftedalsfjellet 2009 63<br />
Töftedalsfjället 2010 48<br />
Uddared 2007 -<br />
Uddarp 2007 6<br />
Uljabuouda 2008 30<br />
Umeä 1999 60<br />
Vestre Götal<strong>and</strong> 2002 53<br />
Veteberget 2011 -<br />
Väktaran (Vänern) 2004 2<br />
Västreby 2003 3<br />
Aapua 2003 15<br />
Årjäng 2011 21<br />
ÅrjängSW 2011 -<br />
Årröd 2001 6<br />
Ås 2010 14<br />
Sweden Total 5.161<br />
Thail<strong>and</strong> Lam Takhong 2009 50<br />
Thail<strong>and</strong> Total 50<br />
Turkey 8-sites Turkey 2007 200<br />
Akhisar 1999 57<br />
Akres 2006 40<br />
Alacati 1998 7<br />
Antifer 2001 10<br />
Ardicli 2010 38<br />
Ayyildiz 2006 16<br />
B<strong>and</strong>irma III 2008 25<br />
Barbaros 2000 18<br />
Belen-II 2006 20<br />
Bodrum 1999 20<br />
Boreas 2007 12<br />
Bozyaka 2009 18<br />
Canakkale 2006 30<br />
CerMetal 2007 -<br />
Dacha 1998 15<br />
Ekinli 2006 54<br />
Garet-Turkey 2007 100<br />
EMD International A/S, Niels Jernesvej 10, DK-9220 Aalborg, tel.+45 9635 4444, fax. +45 9635 4446, www.emd.dk<br />
111<br />
1
27-03-2012 Page 15 of 15<br />
<strong>Wind</strong> Farm <strong>Energy</strong> Assessments performed by EMD 1998-2011<br />
Country Site Year MW Sites<br />
Geycek 2009 113<br />
Guzelyer 2000 48<br />
Kadiovacik 1998 12<br />
Kangal 2011 -<br />
Kapidaga 2010 34<br />
Karabiga 1998 48<br />
Karacabey 2006 26<br />
Karadagres 2008 10<br />
Karakurt 2005 11<br />
Kranseki 2006 12<br />
Mersin 2008 33<br />
Metristepe 2010 45<br />
Mireasa, Silistea, Dorobantu 2009 125<br />
Pianopoli 2007 -<br />
Samli 2010 114<br />
Sebenoba 2005 30<br />
Sertavul 2006 46<br />
Servatul 2007 -<br />
Süleymanli 1998 40<br />
Turkey, 3 sites 2001 11<br />
Yaylaköy 2008 15<br />
Yellice Bellin 2000 30<br />
Turkey Total 1.483<br />
UK Barrow 2004 90<br />
Fleetwood 2003 824<br />
Hare Hill 2001 5<br />
Harlock Hill 2000 2<br />
High Volts 2001 5<br />
Holmside 2000 2<br />
Kentish Flat 2002 83<br />
Kirkheaton 1999 2<br />
Mickfield 2006 12<br />
Saltfleet 2003 603<br />
West Cumbria 1999 5<br />
UK Total 1.632<br />
Ukraine Kalanchak & Novorossijsk'e 2011 309<br />
Krasnoperekopsk 2010 100<br />
Presnovodnick & Tarhankutskaya 2006 600<br />
Tarkhankutskaya 2009 306<br />
Ukraine Total 1.315<br />
USA Brazos <strong>Wind</strong> Ranch 2002 83<br />
Delaware 2007 300<br />
E Colorado 2006 102<br />
Geary Cty Kansas 2006 165<br />
Hays Kansas 2006 200<br />
Kulm 2002 119<br />
Laramie Cty, WY 2006 200<br />
Michigan lake 2010 1.000<br />
NE New Mexico 2006 50<br />
New Jersey 2007 348<br />
North Dakota-South Dakota 2006 50<br />
SE Colorado 2006 50<br />
SW Nebraska 2006 101<br />
W Kansas 2006 101<br />
USA Total 2.865<br />
Gr<strong>and</strong> Total 69.532<br />
EMD International A/S, Niels Jernesvej 10, DK-9220 Aalborg, tel.+45 9635 4444, fax. +45 9635 4446, www.emd.dk<br />
40<br />
11<br />
4<br />
14<br />
796
8.2 <strong>Wind</strong> Turbine: technical specifications <strong>and</strong> power curve
Siemens SWT-2.3-113 2300 113.0 !O!<br />
File C:\Users\Maurizio.EMD\Documents\<strong>Wind</strong>PRO Data\WTG Data\Siemens SWT-2.3-113 2300 113.0 !O!.wtg<br />
Company Siemens<br />
Type/Version SWT-2.3-113<br />
Rated power 2.300,0 kW<br />
Secondary generator 0,0 kW<br />
Rotor diameter 113,0 m<br />
Tower Tubular<br />
Grid connection 50/60 Hz<br />
Origin country DK<br />
Blade type<br />
Generator type Variable<br />
Rpm, rated power 0,0 rpm<br />
Rpm, initial 0,0 rpm<br />
Hub height(s) 93,0; 0,0 m<br />
Maximum blade width 3,40 m<br />
Blade width for 90% radius 0,60 m<br />
Valid Yes<br />
Creator USER<br />
Created 16-06-2011 14:33<br />
Edited 16-06-2011 14:33<br />
Power curve: Level 0 - - St<strong>and</strong>ard setting 0dB -<br />
Source Manufacturer<br />
<strong>Wind</strong>PRO is developed by EMD International A/S, Niels Jernesvej 10, DK-9220 Aalborg Ø, Tel. +45 96 35 44 44, Fax +45 96 35 44 46, e-mail: windpro@emd.dk<br />
<strong>Wind</strong>PRO version 2.8.572 Nov 2012<br />
Printed/Page<br />
30-11-2012 11:16 / 1<br />
Licensed user:<br />
Noise reduced edition available. Please contact Siemens<br />
<strong>Wind</strong> Power for details<br />
Calculated:<br />
30-11-2012 11:16<br />
Source date Creator Created Edited Default Stop windSpeed Air density Tip angle Power control CT curve type<br />
[m/s] [kg/m3] [°]<br />
00-00-0000 00:00 EMD 04-05-2009 09:19 16-06-2011 14:43 Yes 25,0 1,225 6,0 Pitch User defined<br />
Power curve<br />
<strong>Wind</strong> speed [m/s] 2,00 3,00 4,00 5,00 6,00 7,00 8,00 9,00 10,00 11,00 12,00 13,00 14,00 15,00 16,00<br />
Power [kW] 0,00 66,00 171,00 352,00 623,00 1.002,00 1.497,00 2.005,00 2.246,00 2.296,00 2.300,00 2.300,00 2.300,00 2.300,00 2.300,00<br />
Ce 0,000 0,398 0,435 0,458 0,470 0,476 0,476 0,448 0,366 0,281 0,217 0,170 0,136 0,111 0,091<br />
<strong>Wind</strong> speed [m/s] 17,00 18,00 19,00 20,00 21,00 22,00 23,00 24,00 25,00<br />
Power [kW] 2.300,00 2.300,00 2.300,00 2.300,00 2.300,00 2.300,00 2.300,00 2.300,00 2.300,00<br />
Ce 0,076 0,064 0,055 0,047 0,040 0,035 0,031 0,027 0,024<br />
Ct curve<br />
<strong>Wind</strong> speed [m/s] 2,00 3,00 4,00 5,00 6,00 7,00 8,00 9,00 10,00 11,00 12,00 13,00 14,00 15,00 16,00 17,00 18,00 19,00 20,00 21,00 22,00 23,00 24,00 25,00<br />
Ct 0,000 0,878 0,885 0,881 0,881 0,882 0,850 0,761 0,553 0,383 0,286 0,222 0,177 0,144 0,120 0,101 0,086 0,074 0,065 0,057 0,050 0,045 0,040 0,036<br />
HP curve comparison<br />
Vmean [m/s] 5 6 7 8 9 10<br />
HP value [MWh] 4.796 6.995 8.998 10.704 12.095 13.175<br />
Level 0 - - St<strong>and</strong>ard setting 0dB - [MWh] 5.110 7.323 9.316 10.997 12.352 13.387<br />
Check value [%] -6 -4 -3 -3 -2 -2<br />
The table shows comparison between annual energy production calculated on basis of simplified "HP-curves" which<br />
assume that all WTGs performs quite similar - only specific power loading (kW/m^2) <strong>and</strong> single/dual speed or<br />
stall/pitch decides the calculated values. <strong>Production</strong>s are without wake losses.<br />
For further details, ask at the Danish <strong>Energy</strong> Agency for project report J.nr. 51171/00-0016 or see <strong>Wind</strong>PRO manual<br />
chapter 3.5.2.<br />
The method is refined in EMD report "20 Detailed Case Studies comparing Project Design Calculations <strong>and</strong> actual<br />
<strong>Energy</strong> <strong>Production</strong>s for <strong>Wind</strong> <strong>Energy</strong> Projects worldwide", jan 2003.<br />
Use the table to evaluate if the given power curve is reasonable - if the check value are lower than -5%, the power<br />
curve probably is too optimistic due to uncertainty in power curve measurement.<br />
Updated in <strong>Wind</strong>PRO 2.8, Feb. 2012, see details in manual!
8.3 <strong>Wind</strong>PRO results
Projeto:<br />
BSO+URA<br />
PARK - Resultado Principal<br />
Cálculo: BSO I<br />
Modelo de Esteira N.O. Jensen (RISØ/EMD)<br />
Configurações de Cálculo<br />
Modo de cálculo da densidade do ar Individual por aerogerador<br />
Resultado do aerogerador na altitude do cubo 1,030 kg/m³ para 1,059 kg/m³<br />
Densidade do ar em relação ao padrão 84,1 % para 86,5 %<br />
Altitude do cubo acima do nível do mar (asl) 1.301,5 m para 1.586,4 m<br />
Temperatura média anual na altitude do cubo 12,2 °C para 14,0 °C<br />
Pressão nos Aerogeradores 843,8 hPa para 873,0 hPa<br />
Parâmetros do Modelo de Esteira<br />
Do ângulo Para o ângulo Tipo de terreno Constante de Decaimento de Esteira<br />
[°] [°]<br />
-180,0 180,0 Open farml<strong>and</strong> 0,075<br />
Configurações de cálculo de esteira<br />
Ângulo [°] Velocidade do vento [m/s]<br />
início fim passo início fim passo<br />
0,5 360,0 1,0 0,5 30,5 1,0<br />
Versão do WAsP WAsP 6-9 RVEA0011.dll 1, 0, 0, 13<br />
Parâmetros do WAsP Parâmetros WASP fora do padrão - informações detalhadas<br />
no final de Resultados principais<br />
<strong>Wind</strong>PRO é desenvolvido pela EMD International A / S, Niels Jernesvej 10, DK-9220 Aalborg Ø, Tel. +45 96 35 44 44, Fax +45 96 35 44 46, E-mail: windpro@emd.dk<br />
<strong>Wind</strong>PRO version 2.8.572 Nov 2012<br />
Impresso/Página<br />
02-12-2012 10:25 / 1<br />
Usuário licenciado:<br />
EMD International A/S<br />
Niels Jernes Vej 10<br />
DK-9220 Aalborg Ø<br />
+45 9635 4444<br />
Maurizio Motta / mm@emd.dk<br />
Calculado:<br />
30-11-2012 14:19/2.8.572<br />
Escala 1:225.000<br />
Novo Aerogerador Dados do terreno<br />
Resultados chave para altura de 100,0 m acima do nível do terreno<br />
Terreno UTM WGS84 S Zona: 22<br />
Leste Norte Nome da distribuição de Tipo Energia eólica Velocidade Rugosidade<br />
vento média do equivalente<br />
vento<br />
[kWh/m²] [m/s]<br />
A 614.109 6.900.652 For WAsP - URA N WAsP (WAsP 6-9 RVEA0011.dll 1, 0, 0, 13) 2.853 6,7 2,1<br />
B 618.993 6.893.678 For WAsP - URA S+BSO WAsP (WAsP 6-9 RVEA0011.dll 1, 0, 0, 13) 2.418 6,5 1,2<br />
C 615.567 6.896.612 For WAsP - URA S+BSO WAsP (WAsP 6-9 RVEA0011.dll 1, 0, 0, 13) 2.091 6,2 1,7<br />
Energia Anual Calculada para Complexo Eólico<br />
Resultados específicos¤)<br />
Arranjo de Aerogeradores Resultado BRUTO (sem perda) Eficiência Fator de Resultado médio Horas de carga Velocidade média do vento<br />
PARK Aerogeradores livres do parque capacidade por Aerogerador plena @altura do cubo<br />
[MWh/ano] [MWh/ano] [%] [%] [MWh/ano] [Horas/ano] [m/s]<br />
Complexo eólico 90.632,2 98.780,2 91,8 34,6 6.971,7 3.031 6,6<br />
¤) Baseado em resultados reduzidos por efeito esteira, porém nenhuma outra perda incluída<br />
Energia Anual Calculada para cada um de 13 novos Aerogeradores com potência nominal total de 29,9 MW<br />
Tipo de Aerogerador Curva de potência Energia Anual Parque<br />
Terreno Válido Fabric. Tipo de gerador Potência, Diâmetro do Altura Criador Nome Resultado Eficiência Fator de Velocidade<br />
nominal rotor do capacidade média do<br />
cubo vento<br />
[kW] [m] [m] [MWh] [%] [%] [m/s]<br />
1 B Sim Siemens SWT-2.3-113-2.300 2.300 113,0 99,5 EMD Level 0 - - St<strong>and</strong>ard setting 0dB - 8.032,6 94,20 39,8 7,14<br />
2 C Sim Siemens SWT-2.3-113-2.300 2.300 113,0 99,5 EMD Level 0 - - St<strong>and</strong>ard setting 0dB - 7.607,0 95,14 37,7 6,80<br />
3 B Sim Siemens SWT-2.3-113-2.300 2.300 113,0 99,5 EMD Level 0 - - St<strong>and</strong>ard setting 0dB - 7.567,9 91,54 37,5 6,99<br />
4 B Sim Siemens SWT-2.3-113-2.300 2.300 113,0 99,5 EMD Level 0 - - St<strong>and</strong>ard setting 0dB - 7.033,5 90,32 34,9 6,71<br />
5 B Sim Siemens SWT-2.3-113-2.300 2.300 113,0 99,5 EMD Level 0 - - St<strong>and</strong>ard setting 0dB - 7.202,0 93,03 35,7 6,67<br />
6 B Sim Siemens SWT-2.3-113-2.300 2.300 113,0 99,5 EMD Level 0 - - St<strong>and</strong>ard setting 0dB - 6.760,7 91,35 33,5 6,41<br />
7 B Sim Siemens SWT-2.3-113-2.300 2.300 113,0 99,5 EMD Level 0 - - St<strong>and</strong>ard setting 0dB - 6.817,3 89,75 33,8 6,58<br />
8 B Sim Siemens SWT-2.3-113-2.300 2.300 113,0 99,5 EMD Level 0 - - St<strong>and</strong>ard setting 0dB - 6.985,4 91,61 34,6 6,61<br />
9 B Sim Siemens SWT-2.3-113-2.300 2.300 113,0 99,5 EMD Level 0 - - St<strong>and</strong>ard setting 0dB - 6.798,6 91,88 33,7 6,42<br />
10 B Sim Siemens SWT-2.3-113-2.300 2.300 113,0 99,5 EMD Level 0 - - St<strong>and</strong>ard setting 0dB - 6.691,8 89,58 33,2 6,54<br />
11 B Sim Siemens SWT-2.3-113-2.300 2.300 113,0 99,5 EMD Level 0 - - St<strong>and</strong>ard setting 0dB - 6.369,4 88,43 31,6 6,39<br />
12 C Sim Siemens SWT-2.3-113-2.300 2.300 113,0 99,5 EMD Level 0 - - St<strong>and</strong>ard setting 0dB - 6.403,6 96,01 31,8 6,06<br />
13 B Sim Siemens SWT-2.3-113-2.300 2.300 113,0 99,5 EMD Level 0 - - St<strong>and</strong>ard setting 0dB - 6.362,4 89,64 31,6 6,33<br />
Resultados Anuais de Energia não incluem nenhuma perda além das perdas por efeito esteira. Para PAE líquida esperada (produção esperada<br />
garantida), verificar relatório de Perdas & Incertezas.<br />
*) Nas perdas por conjunto está incluída influência de 61 Aerogerador(es) na vizinhança, que recebe(m) o status de Aerogeradores de Referência, veja relatório a parte para identificá-los.
Projeto:<br />
BSO+URA<br />
PARK - Resultado Principal<br />
Cálculo: BSO I<br />
<strong>Wind</strong>PRO é desenvolvido pela EMD International A / S, Niels Jernesvej 10, DK-9220 Aalborg Ø, Tel. +45 96 35 44 44, Fax +45 96 35 44 46, E-mail: windpro@emd.dk<br />
<strong>Wind</strong>PRO version 2.8.572 Nov 2012<br />
Impresso/Página<br />
02-12-2012 10:25 / 2<br />
Usuário licenciado:<br />
EMD International A/S<br />
Niels Jernes Vej 10<br />
DK-9220 Aalborg Ø<br />
+45 9635 4444<br />
Maurizio Motta / mm@emd.dk<br />
Calculado:<br />
30-11-2012 14:19/2.8.572<br />
Localização do Aerogerador<br />
UTM WGS84 S Zona: 22<br />
Leste Norte Z Dados de linha/Descrição<br />
[m]<br />
1 Novo 614.656 6.890.912 1.303,2 Siemens SWT-2.3-113 2300 113.0 !O! hub: 99,5 m (TOT: 156,0 m) (1086)<br />
2 Novo 614.581 6.892.062 1.270,2 Siemens SWT-2.3-113 2300 113.0 !O! hub: 99,5 m (TOT: 156,0 m) (1087)<br />
3 Novo 615.006 6.891.012 1.305,0 Siemens SWT-2.3-113 2300 113.0 !O! hub: 99,5 m (TOT: 156,0 m) (1088)<br />
4 Novo 616.256 6.892.287 1.338,1 Siemens SWT-2.3-113 2300 113.0 !O! hub: 99,5 m (TOT: 156,0 m) (1089)<br />
5 Novo 615.356 6.892.162 1.308,2 Siemens SWT-2.3-113 2300 113.0 !O! hub: 99,5 m (TOT: 156,0 m) (1090)<br />
6 Novo 617.006 6.890.312 1.275,1 Siemens SWT-2.3-113 2300 113.0 !O! hub: 99,5 m (TOT: 156,0 m) (1091)<br />
7 Novo 615.806 6.891.262 1.302,6 Siemens SWT-2.3-113 2300 113.0 !O! hub: 99,5 m (TOT: 156,0 m) (1092)<br />
8 Novo 615.906 6.892.337 1.318,6 Siemens SWT-2.3-113 2300 113.0 !O! hub: 99,5 m (TOT: 156,0 m) (1093)<br />
9 Novo 616.706 6.890.587 1.291,5 Siemens SWT-2.3-113 2300 113.0 !O! hub: 99,5 m (TOT: 156,0 m) (1094)<br />
10 Novo 616.731 6.892.262 1.338,5 Siemens SWT-2.3-113 2300 113.0 !O! hub: 99,5 m (TOT: 156,0 m) (1095)<br />
11 Novo 617.131 6.892.512 1.334,3 Siemens SWT-2.3-113 2300 113.0 !O! hub: 99,5 m (TOT: 156,0 m) (1096)<br />
12 Novo 614.206 6.892.337 1.202,0 Siemens SWT-2.3-113 2300 113.0 !O! hub: 99,5 m (TOT: 156,0 m) (1097)<br />
13 Novo 615.356 6.891.037 1.261,9 Siemens SWT-2.3-113 2300 113.0 !O! hub: 99,5 m (TOT: 156,0 m) (1098)<br />
Parâmetros WAsP fora do padrão<br />
Parâmetro do WAsP Mínimo Máximo Padrão Valor atual<br />
St<strong>and</strong>ard height #3 [m] 5,0000 200,0000 50,0000 60,0000<br />
St<strong>and</strong>ard height #4 [m] 5,0000 200,0000 100,0000 80,0000<br />
St<strong>and</strong>ard height #5 [m] 5,0000 200,0000 200,0000 100,0000<br />
Offset heat flux over l<strong>and</strong> -200,0000 200,0000 -40,0000 -20,0000
Projeto:<br />
BSO+URA<br />
PARK - Análise da produção<br />
<strong>Wind</strong>PRO é desenvolvido pela EMD International A / S, Niels Jernesvej 10, DK-9220 Aalborg Ø, Tel. +45 96 35 44 44, Fax +45 96 35 44 46, E-mail: windpro@emd.dk<br />
<strong>Wind</strong>PRO version 2.8.572 Nov 2012<br />
Impresso/Página<br />
02-12-2012 10:25 / 3<br />
Usuário licenciado:<br />
EMD International A/S<br />
Niels Jernes Vej 10<br />
DK-9220 Aalborg Ø<br />
+45 9635 4444<br />
Maurizio Motta / mm@emd.dk<br />
Calculado:<br />
30-11-2012 14:19/2.8.572<br />
Cálculo: BSO IAerogerador: Todos os novos Aerogeradores, Densidade do ar varia com a posição dos aerogeradores 1,030 kg/m³ - 1,059 kg/m³<br />
Análise Direcional<br />
Setor 0 N 1 NNE 2 ENE 3 L 4 ESE 5 SSE 6 S 7 SSO 8 OSO 9 O 10 ONO 11 NNO Total<br />
Energia baseada em rugosidade [MWh] 30.318,3 11.173,7 4.107,3 2.141,7 1.951,2 696,8 660,6 2.466,6 7.247,3 5.924,9 5.021,7 8.952,8 80.662,9<br />
+Aumento devido às colinas [MWh] 6.203,6 1.908,4 615,0 437,1 651,8 527,6 526,3 1.019,6 904,1 724,5 1.086,0 3.513,3 18.117,3<br />
-Decréscimo devido às perdas de conjunto [MWh] 2.109,1 1.036,3 915,3 644,2 290,8 113,6 68,8 159,0 736,0 950,6 361,7 762,5 8.148,0<br />
Energia resultante [MWh] 34.412,8 12.045,9 3.807,0 1.934,5 2.312,1 1.110,8 1.118,1 3.327,1 7.415,4 5.698,8 5.746,0 11.703,6 90.632,2<br />
Energia específica [kWh/m²] 695<br />
Energia específica [kWh/kW] 3.031<br />
Aumento devido às colinas [%] 20,5 17,1 15,0 20,4 33,4 75,7 79,7 41,3 12,5 12,2 21,6 39,2 22,46<br />
Decréscimo devido às perdas de conjunto [%] 5,8 7,9 19,4 25,0 11,2 9,3 5,8 4,6 9,0 14,3 5,9 6,1 8,25<br />
Utilização [%] 21,5 25,5 33,6 33,6 37,3 40,4 42,4 41,3 35,3 31,3 28,7 27,9 26,2<br />
Operacional [Horas/ano] 1.998 907 509 371 360 247 257 461 835 625 544 958 8.072<br />
Equivalente à carga plena [Horas/ano] 1.151 403 127 65 77 37 37 111 248 191 192 391 3.031
Projeto:<br />
BSO+URA<br />
PARK - Curva de potência do parque<br />
Cálculo: BSO I<br />
<strong>Wind</strong>PRO é desenvolvido pela EMD International A / S, Niels Jernesvej 10, DK-9220 Aalborg Ø, Tel. +45 96 35 44 44, Fax +45 96 35 44 46, E-mail: windpro@emd.dk<br />
<strong>Wind</strong>PRO version 2.8.572 Nov 2012<br />
Impresso/Página<br />
02-12-2012 10:25 / 4<br />
Usuário licenciado:<br />
EMD International A/S<br />
Niels Jernes Vej 10<br />
DK-9220 Aalborg Ø<br />
+45 9635 4444<br />
Maurizio Motta / mm@emd.dk<br />
Calculado:<br />
30-11-2012 14:19/2.8.572<br />
Potência<br />
Velocidade do Aerogeradores Aerogeradores do N NNE ENE L ESE SSE S SSO OSO O ONO NNO<br />
vento livres parque<br />
[m/s] [kW] [kW] [kW] [kW] [kW] [kW] [kW] [kW] [kW] [kW] [kW] [kW] [kW] [kW]<br />
0,5 0 0 0 0 0 0 0 0 0 0 0 0 0 0<br />
1,5 0 0 0 0 0 0 0 0 0 0 0 0 0 0<br />
2,5 1.785 1.576 1.606 1.605 1.590 1.507 1.494 1.572 1.606 1.608 1.591 1.505 1.494 1.571<br />
3,5 7.306 6.165 6.291 6.297 6.241 5.865 5.783 6.112 6.286 6.307 6.257 5.855 5.793 6.113<br />
4,5 16.109 13.751 14.006 14.026 13.916 13.126 12.960 13.650 14.003 14.057 13.955 13.110 12.963 13.641<br />
5,5 30.143 25.963 26.436 26.484 26.242 24.789 24.504 25.798 26.442 26.554 26.303 24.764 24.511 25.789<br />
6,5 50.320 43.583 44.369 44.467 44.009 41.642 41.160 43.341 44.401 44.590 44.104 41.581 41.167 43.307<br />
7,5 77.670 67.691 68.923 69.058 68.279 64.728 63.962 67.391 68.976 69.225 68.409 64.639 63.977 67.292<br />
8,5 112.142 99.377 101.198 101.293 100.005 95.291 94.194 99.078 101.169 101.437 100.120 95.121 94.209 99.014<br />
9,5 146.151 134.487 136.486 136.626 134.845 130.152 128.859 134.362 136.467 136.710 134.990 130.047 128.930 134.350<br />
10,5 162.578 158.309 159.348 159.410 158.368 156.076 155.271 158.538 159.325 159.397 158.458 156.112 155.352 158.559<br />
11,5 168.463 167.793 168.002 168.006 167.803 167.356 167.162 167.859 167.990 167.989 167.823 167.372 167.198 167.874<br />
12,5 170.025 169.957 169.989 169.988 169.957 169.891 169.869 169.969 169.987 169.983 169.958 169.894 169.872 169.971<br />
13,5 170.200 170.194 170.197 170.197 170.194 170.187 170.186 170.195 170.197 170.197 170.193 170.187 170.185 170.196<br />
14,5 170.200 170.200 170.200 170.200 170.200 170.200 170.200 170.200 170.200 170.200 170.200 170.200 170.200 170.200<br />
15,5 170.200 170.200 170.200 170.200 170.200 170.200 170.200 170.200 170.200 170.200 170.200 170.200 170.200 170.200<br />
16,5 170.200 170.200 170.200 170.200 170.200 170.200 170.200 170.200 170.200 170.200 170.200 170.200 170.200 170.200<br />
17,5 170.200 170.200 170.200 170.200 170.200 170.200 170.200 170.200 170.200 170.200 170.200 170.200 170.200 170.200<br />
18,5 170.200 170.200 170.200 170.200 170.200 170.200 170.200 170.200 170.200 170.200 170.200 170.200 170.200 170.200<br />
19,5 170.200 170.200 170.200 170.200 170.200 170.200 170.200 170.200 170.200 170.200 170.200 170.200 170.200 170.200<br />
20,5 170.200 170.200 170.200 170.200 170.200 170.200 170.200 170.200 170.200 170.200 170.200 170.200 170.200 170.200<br />
21,5 170.200 170.200 170.200 170.200 170.200 170.200 170.200 170.200 170.200 170.200 170.200 170.200 170.200 170.200<br />
22,5 170.200 170.200 170.200 170.200 170.200 170.200 170.200 170.200 170.200 170.200 170.200 170.200 170.200 170.200<br />
23,5 170.200 170.200 170.200 170.200 170.200 170.200 170.200 170.200 170.200 170.200 170.200 170.200 170.200 170.200<br />
24,5 170.200 170.200 170.200 170.200 170.200 170.200 170.200 170.200 170.200 170.200 170.200 170.200 170.200 170.200<br />
25,5 0 0 0 0 0 0 0 0 0 0 0 0 0 0<br />
26,5 0 0 0 0 0 0 0 0 0 0 0 0 0 0<br />
27,5 0 0 0 0 0 0 0 0 0 0 0 0 0 0<br />
28,5 0 0 0 0 0 0 0 0 0 0 0 0 0 0<br />
29,5 0 0 0 0 0 0 0 0 0 0 0 0 0 0<br />
Descrição:<br />
A curva de potência do parque é semelhante a uma curva de potência de Aerogerador, signific<strong>and</strong>o que qu<strong>and</strong>o uma dada velocidade de vento aparece em frente ao parque com a<br />
mesma velocidade em toda a área do parque (antes da influência do parque), o resultado do parque pode ser encontrada na curva de potência do parque. Outra forma de se dizer<br />
isto: A curva de potência do parque inclui perdas de conjunto, mas NÃO inclui variações do terreno na velocidade do vento pela área do parque.<br />
A medição de uma curva de potência do parque não é tão simples como a medição de uma curva de potência de Aerogerador devido ao fato de que a curva de potência do parque<br />
depende da direção do vento e de que a mesma velocidade do vento normamente não aparecerá para toda a área do parque ao mesmo tempo (apenas em terrenos não complexos<br />
extremamente lisos). A idéia com esta versão de curva de potência do parque não é utilizá-la para validações baseadas em medições. Isto exigiria pelo menos 2 torres de medição<br />
em dois lados do parque, caso contrário apenas poucos setores de direção poderiam ser testados, E terrenos não complexos (normalmente apenas utilizável em alto mar). Outra<br />
versão de curva de potência do parque está disponível no <strong>Wind</strong>PRO.<br />
A curva de potência do parque pode ser utilizada para:<br />
1. Sistemas de previsão, baseados em dados do vento mais brutos (aproximados), a curva de potência do parque seria uma maneira eficiente de fazer a conexão da<br />
velocidade do vento (e direção) para a potência.<br />
2. Construção de curvas de duração, cont<strong>and</strong>o quantas vezes uma determinada potência irá aparecer, a curva de potência do parque pode ser utilizada em conjunto com a<br />
distribuição média do vento para a área do complexo Eólico na altura do cubo. A distribuição média do vento pode ser eventualmente obtida com base nos parâmetros de<br />
Weibull para cada posição do Aerogerador. Estes são encontrados no menu de impressão: > Result to file< no > Park resultResult to file< dados de ><strong>Wind</strong> Speeds Inside <strong>Wind</strong> farm< também estão disponíveis. Estes podem (por exemplo, através do Excel) ser utilizados para extrair as<br />
reduções causadas pela esteira na velocidade do vento medida.
Projeto:<br />
BSO+URA<br />
PARK - Map<br />
Cálculo: BSO I<br />
<strong>Wind</strong>PRO é desenvolvido pela EMD International A / S, Niels Jernesvej 10, DK-9220 Aalborg Ø, Tel. +45 96 35 44 44, Fax +45 96 35 44 46, E-mail: windpro@emd.dk<br />
<strong>Wind</strong>PRO version 2.8.572 Nov 2012<br />
Impresso/Página<br />
02-12-2012 10:25 / 5<br />
Usuário licenciado:<br />
EMD International A/S<br />
Niels Jernes Vej 10<br />
DK-9220 Aalborg Ø<br />
+45 9635 4444<br />
Maurizio Motta / mm@emd.dk<br />
Calculado:<br />
30-11-2012 14:19/2.8.572<br />
0 2,5 5 7,5 10 km<br />
Mapa: Topographic , Escala de impressão 1:125.000, Centro do mapa UTM WGS84 S Zone: 22 Leste: 614.972 Norte: 6.898.846<br />
Novo Aerogerador Aerogerador existente
Projeto:<br />
BSO+URA<br />
Loss&Uncertainty - Park result<br />
Cálculo: BSO I<br />
Main data for PARK<br />
PARK calculation 2.8.572: BSO I<br />
Count 13<br />
Rated power 29,9 MW<br />
Mean wind speed 6,6 m/s at hub height<br />
Sensitivity 1,6 %AEP / %Mean <strong>Wind</strong> Speed<br />
Expected lifetime 20 Years<br />
RESULTS<br />
P50 P84 P90<br />
NET AEP [GWh/y] 84,0 71,0 67,3<br />
Capacity factor [%] 32,1 27,1 25,7<br />
Full load hours [h/y] 2.810 2.375 2.250<br />
Result details<br />
P50 Uncertainty<br />
GROSS AEP *) 98,8 GWh/y 15,4 %<br />
Bias correction 0,0 GWh/y 0,0 % 0,0 %<br />
Loss correction -14,8 GWh/y -14,9 % 2,4 %<br />
Wake loss -8,2 %<br />
Other losses -7,3 %<br />
NET AEP 84,0 GWh/y 15,6 %<br />
*) Calculated <strong>Annual</strong> <strong>Energy</strong> <strong>Production</strong> before any bias or loss corrections<br />
Assumptions: Uncertainty <strong>and</strong> percentiles (PXX values) are calculated for the expected lifetime<br />
<strong>Wind</strong>PRO é desenvolvido pela EMD International A / S, Niels Jernesvej 10, DK-9220 Aalborg Ø, tel. +45 96 35 44 44, Fax +45 96 35 44 46, E-mail: windpro@emd.dk<br />
<strong>Wind</strong>PRO version 2.8.576 Dec 2012<br />
Impresso / Página<br />
11-12-2012 15:05 / 1<br />
Usuário licenciado:<br />
EMD International A/S<br />
Niels Jernes Vej 10<br />
DK-9220 Aalborg Ø<br />
+45 9635 4444<br />
Maurizio Motta / mm@emd.dk<br />
Calculado:<br />
11-12-2012 15:05/2.8.576<br />
Scale: 40.000
Projeto:<br />
BSO+URA<br />
Loss&Uncertainty - Assumptions <strong>and</strong> results<br />
Cálculo: BSO I<br />
ASSUMPTIONS<br />
<strong>Wind</strong>PRO é desenvolvido pela EMD International A / S, Niels Jernesvej 10, DK-9220 Aalborg Ø, tel. +45 96 35 44 44, Fax +45 96 35 44 46, E-mail: windpro@emd.dk<br />
<strong>Wind</strong>PRO version 2.8.576 Dec 2012<br />
Impresso / Página<br />
11-12-2012 15:05 / 2<br />
Usuário licenciado:<br />
EMD International A/S<br />
Niels Jernes Vej 10<br />
DK-9220 Aalborg Ø<br />
+45 9635 4444<br />
Maurizio Motta / mm@emd.dk<br />
Calculado:<br />
11-12-2012 15:05/2.8.576<br />
LOSS<br />
Method *) Loss Loss Std dev**) Comment<br />
[%] [GWh/y] [%]<br />
1. Efeitos esteira<br />
Efeitos esteira, todos Aerogeradores Calculation 8,2 8,1 20,0<br />
2. Disponibilidade<br />
Disponibilidade da turbina Estimate 3,0 3,0 50,0<br />
Disponibilidade da rede Estimate 0,5 0,5 20,0<br />
3. Desempenho da turbina No input<br />
4. Elétrica<br />
Perdas elétricas Estimate 2,0 2,0 20,0 Calculado pela VILCO<br />
5. Ambiental<br />
Degradação de desempenho não devido à formação de gelo Estimate 1,0 1,0 50,0<br />
Desligamento devido à formação de gelo, granizo, relâmpago, etc. Estimate 1,0 1,0 50,0<br />
Alta e baixa temperatura Calculation 0,0 0,0 0,0<br />
6. Corte No input<br />
7. Outras No input<br />
LOSS, total 14,9 14,8 2,4<br />
UNCERTAINTY<br />
Method *) Std dev, Std dev, Comment<br />
wind speed AEP<br />
[%] [%]<br />
A. Dados de vento<br />
Medição de vento/Dados de vento Estimate 5,0 8,0<br />
Correção de longo termo Estimate 7,0<br />
Variação de ano para ano Estimate 3,7 6,0<br />
Clima futuro<br />
Outra relacionada ao vento<br />
Estimate 5,0<br />
B. Modelo de vento<br />
Extrapolação vertical Calculation 1,3 2,1<br />
Extrapolação horizontal<br />
Outra relacionada ao modelo de vento<br />
C. Conversão de potência<br />
Calculation 5,8 9,3<br />
Incerteza na curva de potência<br />
Medição de incertezas<br />
Outras incertezas relacionadas à PAE<br />
Calculation 2,0<br />
D. BIAS, total uncertainty 0,0<br />
E. Perdas, total uncertainty 2,4<br />
UNCERTAINTY, total (1y average) 16,6<br />
UNCERTAINTY, total (20y average) 15,6<br />
VARIABILITY<br />
Years Variability Total<br />
(std dev) std dev<br />
[%] [%]<br />
1 5,96 16,6<br />
5 2,66 15,7<br />
10 1,88 15,6<br />
20 1,33 15,6
Projeto:<br />
BSO+URA<br />
Loss&Uncertainty - Assumptions <strong>and</strong> results<br />
Cálculo: BSO I<br />
RESULTS<br />
AEP versus exceedance level / time horizon<br />
PXX 1 y 5 y 10 y 20 y<br />
[%] [MWh/y] [MWh/y] [MWh/y] [MWh/y]<br />
50 84.018 84.018 84.018 84.018<br />
75 74.610 75.107 75.172 75.204<br />
84 70.147 70.880 70.975 71.023<br />
90 66.142 67.088 67.210 67.271<br />
95 61.075 62.288 62.445 62.523<br />
<strong>Wind</strong>PRO é desenvolvido pela EMD International A / S, Niels Jernesvej 10, DK-9220 Aalborg Ø, tel. +45 96 35 44 44, Fax +45 96 35 44 46, E-mail: windpro@emd.dk<br />
<strong>Wind</strong>PRO version 2.8.576 Dec 2012<br />
Impresso / Página<br />
11-12-2012 15:05 / 3<br />
Usuário licenciado:<br />
EMD International A/S<br />
Niels Jernes Vej 10<br />
DK-9220 Aalborg Ø<br />
+45 9635 4444<br />
Maurizio Motta / mm@emd.dk<br />
Calculado:<br />
11-12-2012 15:05/2.8.576<br />
*) Calculation means that a calculation method available in the <strong>Wind</strong>PRO software is used. This still typically involve a user judgement <strong>and</strong> user data where the quality of those decides the accuracy. If<br />
calculation method is used, the values will often be different from turbine to turbine, here the average is shown, but at page "WTG results" the individual turbine results are shown.<br />
**) For totals the std dev refers to the full AEP, otherwise std dev refers to the bias or loss component which is a fraction of the total AEP.
Projeto:<br />
BSO+URA<br />
Loss&Uncertainty - WTG results<br />
Cálculo: BSO I<br />
Main data for PARK<br />
PARK calculation 2.8.572: BSO I<br />
Count 13<br />
Rated power 29,9 MW<br />
Mean wind speed 6,6 m/s at hub height<br />
Sensitivity 1,6 %AEP / %Mean <strong>Wind</strong> Speed<br />
Expected lifetime 20 Years<br />
<strong>Wind</strong>PRO é desenvolvido pela EMD International A / S, Niels Jernesvej 10, DK-9220 Aalborg Ø, tel. +45 96 35 44 44, Fax +45 96 35 44 46, E-mail: windpro@emd.dk<br />
<strong>Wind</strong>PRO version 2.8.576 Dec 2012<br />
Impresso / Página<br />
11-12-2012 15:05 / 4<br />
Usuário licenciado:<br />
EMD International A/S<br />
Niels Jernes Vej 10<br />
DK-9220 Aalborg Ø<br />
+45 9635 4444<br />
Maurizio Motta / mm@emd.dk<br />
Calculado:<br />
11-12-2012 15:05/2.8.576<br />
Scale: 40.000<br />
Expected AEP per WTG including bias, loss <strong>and</strong> uncertainty evaluation<br />
20 years averaging<br />
Description Calculated GROSS*) Bias Loss Unc. P50 P84 P90<br />
[MWh/y] [%] [%] [%] [MWh/y] [MWh/y] [MWh/y]<br />
1 Siemens SWT-2.3-113 2300 113.0 !O! hub: 99,5 m (TOT: 156,0 m) (1086) 8.526,8 0,0 12,7 15,9 7.446,4 6.269,8 5.930,2<br />
2 Siemens SWT-2.3-113 2300 113.0 !O! hub: 99,5 m (TOT: 156,0 m) (1087) 7.995,3 0,0 11,8 15,9 7.051,8 5.938,7 5.617,4<br />
3 Siemens SWT-2.3-113 2300 113.0 !O! hub: 99,5 m (TOT: 156,0 m) (1088) 8.267,2 0,0 15,1 15,8 7.015,6 5.915,3 5.597,7<br />
4 Siemens SWT-2.3-113 2300 113.0 !O! hub: 99,5 m (TOT: 156,0 m) (1089) 7.787,3 0,0 16,3 14,2 6.520,2 5.601,2 5.335,9<br />
5 Siemens SWT-2.3-113 2300 113.0 !O! hub: 99,5 m (TOT: 156,0 m) (1090) 7.741,6 0,0 13,8 15,4 6.676,4 5.654,3 5.359,3<br />
6 Siemens SWT-2.3-113 2300 113.0 !O! hub: 99,5 m (TOT: 156,0 m) (1091) 7.400,6 0,0 15,3 16,7 6.267,3 5.229,4 4.929,8<br />
7 Siemens SWT-2.3-113 2300 113.0 !O! hub: 99,5 m (TOT: 156,0 m) (1092) 7.596,2 0,0 16,8 15,9 6.319,7 5.321,8 5.033,7<br />
8 Siemens SWT-2.3-113 2300 113.0 !O! hub: 99,5 m (TOT: 156,0 m) (1093) 7.625,0 0,0 15,1 14,7 6.475,6 5.527,9 5.254,3<br />
9 Siemens SWT-2.3-113 2300 113.0 !O! hub: 99,5 m (TOT: 156,0 m) (1094) 7.399,3 0,0 14,8 16,4 6.302,5 5.274,6 4.977,9<br />
10 Siemens SWT-2.3-113 2300 113.0 !O! hub: 99,5 m (TOT: 156,0 m) (1095) 7.470,4 0,0 17,0 14,0 6.203,5 5.338,9 5.089,3<br />
11 Siemens SWT-2.3-113 2300 113.0 !O! hub: 99,5 m (TOT: 156,0 m) (1096) 7.202,5 0,0 18,0 13,9 5.904,6 5.090,6 4.855,6<br />
12 Siemens SWT-2.3-113 2300 113.0 !O! hub: 99,5 m (TOT: 156,0 m) (1097) 6.669,9 0,0 11,0 17,7 5.936,3 4.892,0 4.590,5<br />
13 Siemens SWT-2.3-113 2300 113.0 !O! hub: 99,5 m (TOT: 156,0 m) (1098) 7.097,9 0,0 16,9 17,2 5.898,0 4.889,6 4.598,5<br />
PARK 98.780,1 0,0 14,9 15,6 84.017,7 71.022,6 67.271,0
Projeto:<br />
BSO+URA<br />
PARK - Resultado Principal<br />
Cálculo: BSO II<br />
Modelo de Esteira N.O. Jensen (RISØ/EMD)<br />
Configurações de Cálculo<br />
Modo de cálculo da densidade do ar Individual por aerogerador<br />
Resultado do aerogerador na altitude do cubo 1,030 kg/m³ para 1,059 kg/m³<br />
Densidade do ar em relação ao padrão 84,1 % para 86,5 %<br />
Altitude do cubo acima do nível do mar (asl) 1.301,5 m para 1.586,4 m<br />
Temperatura média anual na altitude do cubo 12,2 °C para 14,0 °C<br />
Pressão nos Aerogeradores 843,8 hPa para 873,0 hPa<br />
Parâmetros do Modelo de Esteira<br />
Do ângulo Para o ângulo Tipo de terreno Constante de Decaimento de Esteira<br />
[°] [°]<br />
-180,0 180,0 Open farml<strong>and</strong> 0,075<br />
Configurações de cálculo de esteira<br />
Ângulo [°] Velocidade do vento [m/s]<br />
início fim passo início fim passo<br />
0,5 360,0 1,0 0,5 30,5 1,0<br />
Versão do WAsP WAsP 6-9 RVEA0011.dll 1, 0, 0, 13<br />
Parâmetros do WAsP Parâmetros WASP fora do padrão - informações detalhadas<br />
no final de Resultados principais<br />
<strong>Wind</strong>PRO é desenvolvido pela EMD International A / S, Niels Jernesvej 10, DK-9220 Aalborg Ø, Tel. +45 96 35 44 44, Fax +45 96 35 44 46, E-mail: windpro@emd.dk<br />
<strong>Wind</strong>PRO version 2.8.572 Nov 2012<br />
Impresso/Página<br />
02-12-2012 10:31 / 1<br />
Usuário licenciado:<br />
EMD International A/S<br />
Niels Jernes Vej 10<br />
DK-9220 Aalborg Ø<br />
+45 9635 4444<br />
Maurizio Motta / mm@emd.dk<br />
Calculado:<br />
30-11-2012 14:30/2.8.572<br />
Escala 1:200.000<br />
Novo Aerogerador Dados do terreno<br />
Resultados chave para altura de 100,0 m acima do nível do terreno<br />
Terreno UTM WGS84 S Zona: 22<br />
Leste Norte Nome da distribuição de Tipo Energia eólica Velocidade Rugosidade<br />
vento média do equivalente<br />
vento<br />
[kWh/m²] [m/s]<br />
A 614.109 6.900.652 For WAsP - URA N WAsP (WAsP 6-9 RVEA0011.dll 1, 0, 0, 13) 2.853 6,7 2,1<br />
B 618.993 6.893.678 For WAsP - URA S+BSO WAsP (WAsP 6-9 RVEA0011.dll 1, 0, 0, 13) 2.418 6,5 1,2<br />
C 615.567 6.896.612 For WAsP - URA S+BSO WAsP (WAsP 6-9 RVEA0011.dll 1, 0, 0, 13) 2.091 6,2 1,7<br />
Energia Anual Calculada para Complexo Eólico<br />
Resultados específicos¤)<br />
Arranjo de Aerogeradores Resultado BRUTO (sem perda) Eficiência Fator de Resultado médio Horas de carga Velocidade média do vento<br />
PARK Aerogeradores livres do parque capacidade por Aerogerador plena @altura do cubo<br />
[MWh/ano] [MWh/ano] [%] [%] [MWh/ano] [Horas/ano] [m/s]<br />
Complexo eólico 86.052,1 96.610,6 89,1 32,8 6.619,4 2.878 6,5<br />
¤) Baseado em resultados reduzidos por efeito esteira, porém nenhuma outra perda incluída<br />
Energia Anual Calculada para cada um de 13 novos Aerogeradores com potência nominal total de 29,9 MW<br />
Tipo de Aerogerador Curva de potência Energia Anual Parque<br />
Terreno Válido Fabric. Tipo de gerador Potência, Diâmetro do Altura Criador Nome Resultado Eficiência Fator de Velocidade<br />
nominal rotor do capacidade média do<br />
cubo vento<br />
[kW] [m] [m] [MWh] [%] [%] [m/s]<br />
1 B Sim Siemens SWT-2.3-113-2.300 2.300 113,0 99,5 EMD Level 0 - - St<strong>and</strong>ard setting 0dB - 7.360,2 93,71 36,5 6,72<br />
2 B Sim Siemens SWT-2.3-113-2.300 2.300 113,0 99,5 EMD Level 0 - - St<strong>and</strong>ard setting 0dB - 7.137,1 91,87 35,4 6,62<br />
3 B Sim Siemens SWT-2.3-113-2.300 2.300 113,0 99,5 EMD Level 0 - - St<strong>and</strong>ard setting 0dB - 6.949,9 88,62 34,5 6,71<br />
4 B Sim Siemens SWT-2.3-113-2.300 2.300 113,0 99,5 EMD Level 0 - - St<strong>and</strong>ard setting 0dB - 6.629,4 88,05 32,9 6,56<br />
5 B Sim Siemens SWT-2.3-113-2.300 2.300 113,0 99,5 EMD Level 0 - - St<strong>and</strong>ard setting 0dB - 6.558,2 88,56 32,5 6,44<br />
6 B Sim Siemens SWT-2.3-113-2.300 2.300 113,0 99,5 EMD Level 0 - - St<strong>and</strong>ard setting 0dB - 6.545,2 87,51 32,5 6,52<br />
7 B Sim Siemens SWT-2.3-113-2.300 2.300 113,0 99,5 EMD Level 0 - - St<strong>and</strong>ard setting 0dB - 6.506,5 86,94 32,3 6,51<br />
8 B Sim Siemens SWT-2.3-113-2.300 2.300 113,0 99,5 EMD Level 0 - - St<strong>and</strong>ard setting 0dB - 6.717,9 89,58 33,3 6,55<br />
9 B Sim Siemens SWT-2.3-113-2.300 2.300 113,0 99,5 EMD Level 0 - - St<strong>and</strong>ard setting 0dB - 6.270,5 88,52 31,1 6,30<br />
10 B Sim Siemens SWT-2.3-113-2.300 2.300 113,0 99,5 EMD Level 0 - - St<strong>and</strong>ard setting 0dB - 6.472,2 91,84 32,1 6,25<br />
11 B Sim Siemens SWT-2.3-113-2.300 2.300 113,0 99,5 EMD Level 0 - - St<strong>and</strong>ard setting 0dB - 6.481,2 89,86 32,1 6,39<br />
12 B Sim Siemens SWT-2.3-113-2.300 2.300 113,0 99,5 EMD Level 0 - - St<strong>and</strong>ard setting 0dB - 6.271,5 87,11 31,1 6,40<br />
13 B Sim Siemens SWT-2.3-113-2.300 2.300 113,0 99,5 EMD Level 0 - - St<strong>and</strong>ard setting 0dB - 6.152,3 85,39 30,5 6,36<br />
Resultados Anuais de Energia não incluem nenhuma perda além das perdas por efeito esteira. Para PAE líquida esperada (produção esperada<br />
garantida), verificar relatório de Perdas & Incertezas.<br />
*) Nas perdas por conjunto está incluída influência de 61 Aerogerador(es) na vizinhança, que recebe(m) o status de Aerogeradores de Referência, veja relatório a parte para identificá-los.
Projeto:<br />
BSO+URA<br />
PARK - Resultado Principal<br />
Cálculo: BSO II<br />
<strong>Wind</strong>PRO é desenvolvido pela EMD International A / S, Niels Jernesvej 10, DK-9220 Aalborg Ø, Tel. +45 96 35 44 44, Fax +45 96 35 44 46, E-mail: windpro@emd.dk<br />
<strong>Wind</strong>PRO version 2.8.572 Nov 2012<br />
Impresso/Página<br />
02-12-2012 10:31 / 2<br />
Usuário licenciado:<br />
EMD International A/S<br />
Niels Jernes Vej 10<br />
DK-9220 Aalborg Ø<br />
+45 9635 4444<br />
Maurizio Motta / mm@emd.dk<br />
Calculado:<br />
30-11-2012 14:30/2.8.572<br />
Localização do Aerogerador<br />
UTM WGS84 S Zona: 22<br />
Leste Norte Z Dados de linha/Descrição<br />
[m]<br />
1 Novo 619.906 6.891.212 1.339,5 Siemens SWT-2.3-113 2300 113.0 !O! hub: 99,5 m (TOT: 156,0 m) (1099)<br />
2 Novo 620.556 6.892.487 1.391,8 Siemens SWT-2.3-113 2300 113.0 !O! hub: 99,5 m (TOT: 156,0 m) (1100)<br />
3 Novo 617.506 6.892.562 1.369,1 Siemens SWT-2.3-113 2300 113.0 !O! hub: 99,5 m (TOT: 156,0 m) (1101)<br />
4 Novo 618.731 6.893.612 1.398,0 Siemens SWT-2.3-113 2300 113.0 !O! hub: 99,5 m (TOT: 156,0 m) (1102)<br />
5 Novo 618.956 6.892.487 1.349,1 Siemens SWT-2.3-113 2300 113.0 !O! hub: 99,5 m (TOT: 156,0 m) (1103)<br />
6 Novo 619.056 6.893.412 1.397,1 Siemens SWT-2.3-113 2300 113.0 !O! hub: 99,5 m (TOT: 156,0 m) (1104)<br />
7 Novo 617.656 6.891.762 1.327,4 Siemens SWT-2.3-113 2300 113.0 !O! hub: 99,5 m (TOT: 156,0 m) (1105)<br />
8 Novo 618.106 6.893.312 1.374,3 Siemens SWT-2.3-113 2300 113.0 !O! hub: 99,5 m (TOT: 156,0 m) (1106)<br />
9 Novo 618.006 6.891.712 1.293,1 Siemens SWT-2.3-113 2300 113.0 !O! hub: 99,5 m (TOT: 156,0 m) (1107)<br />
10 Novo 620.556 6.891.437 1.337,4 Siemens SWT-2.3-113 2300 113.0 !O! hub: 99,5 m (TOT: 156,0 m) (1108)<br />
11 Novo 618.381 6.893.737 1.374,9 Siemens SWT-2.3-113 2300 113.0 !O! hub: 99,5 m (TOT: 156,0 m) (1109)<br />
12 Novo 619.381 6.893.687 1.397,3 Siemens SWT-2.3-113 2300 113.0 !O! hub: 99,5 m (TOT: 156,0 m) (1110)<br />
13 Novo 617.356 6.892.037 1.330,4 Siemens SWT-2.3-113 2300 113.0 !O! hub: 99,5 m (TOT: 156,0 m) (1111)<br />
Parâmetros WAsP fora do padrão<br />
Parâmetro do WAsP Mínimo Máximo Padrão Valor atual<br />
St<strong>and</strong>ard height #3 [m] 5,0000 200,0000 50,0000 60,0000<br />
St<strong>and</strong>ard height #4 [m] 5,0000 200,0000 100,0000 80,0000<br />
St<strong>and</strong>ard height #5 [m] 5,0000 200,0000 200,0000 100,0000<br />
Offset heat flux over l<strong>and</strong> -200,0000 200,0000 -40,0000 -20,0000
Projeto:<br />
BSO+URA<br />
PARK - Análise da produção<br />
<strong>Wind</strong>PRO é desenvolvido pela EMD International A / S, Niels Jernesvej 10, DK-9220 Aalborg Ø, Tel. +45 96 35 44 44, Fax +45 96 35 44 46, E-mail: windpro@emd.dk<br />
<strong>Wind</strong>PRO version 2.8.572 Nov 2012<br />
Impresso/Página<br />
02-12-2012 10:31 / 3<br />
Usuário licenciado:<br />
EMD International A/S<br />
Niels Jernes Vej 10<br />
DK-9220 Aalborg Ø<br />
+45 9635 4444<br />
Maurizio Motta / mm@emd.dk<br />
Calculado:<br />
30-11-2012 14:30/2.8.572<br />
Cálculo: BSO IIAerogerador: Todos os novos Aerogeradores, Densidade do ar varia com a posição dos aerogeradores 1,030 kg/m³ - 1,059 kg/m³<br />
Análise Direcional<br />
Setor 0 N 1 NNE 2 ENE 3 L 4 ESE 5 SSE 6 S 7 SSO 8 OSO 9 O 10 ONO 11 NNO Total<br />
Energia baseada em rugosidade [MWh] 28.726,0 10.659,3 4.124,5 2.166,5 1.941,0 633,5 599,0 2.097,1 7.467,7 6.410,6 5.243,2 8.697,2 78.765,8<br />
+Aumento devido às colinas [MWh] 4.372,3 1.516,6 1.097,1 921,3 849,4 349,4 303,4 583,1 1.478,9 1.645,4 1.482,9 3.245,0 17.844,8<br />
-Decréscimo devido às perdas de conjunto [MWh] 2.666,4 1.254,1 659,7 420,5 360,4 80,9 75,2 365,5 1.197,6 1.111,8 971,9 1.394,6 10.558,5<br />
Energia resultante [MWh] 30.431,9 10.921,9 4.561,8 2.667,3 2.430,0 902,1 827,2 2.314,7 7.749,0 6.944,2 5.754,2 10.547,7 86.052,1<br />
Energia específica [kWh/m²] 660<br />
Energia específica [kWh/kW] 2.878<br />
Aumento devido às colinas [%] 15,2 14,2 26,6 42,5 43,8 55,2 50,6 27,8 19,8 25,7 28,3 37,3 22,66<br />
Decréscimo devido às perdas de conjunto [%] 8,1 10,3 12,6 13,6 12,9 8,2 8,3 13,6 13,4 13,8 14,4 11,7 10,93<br />
Utilização [%] 23,4 26,6 35,6 38,3 36,7 41,5 41,6 38,6 32,8 29,8 25,4 27,9 27,3<br />
Operacional [Horas/ano] 1.923 895 546 409 377 229 232 408 870 687 573 960 8.107<br />
Equivalente à carga plena [Horas/ano] 1.018 365 153 89 81 30 28 77 259 232 192 353 2.878
Projeto:<br />
BSO+URA<br />
PARK - Curva de potência do parque<br />
Cálculo: BSO II<br />
<strong>Wind</strong>PRO é desenvolvido pela EMD International A / S, Niels Jernesvej 10, DK-9220 Aalborg Ø, Tel. +45 96 35 44 44, Fax +45 96 35 44 46, E-mail: windpro@emd.dk<br />
<strong>Wind</strong>PRO version 2.8.572 Nov 2012<br />
Impresso/Página<br />
02-12-2012 10:31 / 4<br />
Usuário licenciado:<br />
EMD International A/S<br />
Niels Jernes Vej 10<br />
DK-9220 Aalborg Ø<br />
+45 9635 4444<br />
Maurizio Motta / mm@emd.dk<br />
Calculado:<br />
30-11-2012 14:30/2.8.572<br />
Potência<br />
Velocidade do Aerogeradores Aerogeradores do N NNE ENE L ESE SSE S SSO OSO O ONO NNO<br />
vento livres parque<br />
[m/s] [kW] [kW] [kW] [kW] [kW] [kW] [kW] [kW] [kW] [kW] [kW] [kW] [kW] [kW]<br />
0,5 0 0 0 0 0 0 0 0 0 0 0 0 0 0<br />
1,5 0 0 0 0 0 0 0 0 0 0 0 0 0 0<br />
2,5 1.785 1.576 1.606 1.605 1.590 1.507 1.494 1.572 1.606 1.608 1.591 1.505 1.494 1.571<br />
3,5 7.306 6.165 6.291 6.297 6.241 5.865 5.783 6.112 6.286 6.307 6.257 5.855 5.793 6.113<br />
4,5 16.109 13.751 14.006 14.026 13.916 13.126 12.960 13.650 14.003 14.057 13.955 13.110 12.963 13.641<br />
5,5 30.143 25.963 26.436 26.484 26.242 24.789 24.504 25.798 26.442 26.554 26.303 24.764 24.511 25.789<br />
6,5 50.320 43.583 44.369 44.467 44.009 41.642 41.160 43.341 44.401 44.590 44.104 41.581 41.167 43.307<br />
7,5 77.670 67.691 68.923 69.058 68.279 64.728 63.962 67.391 68.976 69.225 68.409 64.639 63.977 67.292<br />
8,5 112.142 99.377 101.198 101.293 100.005 95.291 94.194 99.078 101.169 101.437 100.120 95.121 94.209 99.014<br />
9,5 146.151 134.487 136.486 136.626 134.845 130.152 128.859 134.362 136.467 136.710 134.990 130.047 128.930 134.350<br />
10,5 162.578 158.309 159.348 159.410 158.368 156.076 155.271 158.538 159.325 159.397 158.458 156.112 155.352 158.559<br />
11,5 168.463 167.793 168.002 168.006 167.803 167.356 167.162 167.859 167.990 167.989 167.823 167.372 167.198 167.873<br />
12,5 170.025 169.957 169.989 169.988 169.957 169.891 169.869 169.969 169.987 169.983 169.958 169.894 169.872 169.971<br />
13,5 170.200 170.194 170.197 170.197 170.194 170.187 170.186 170.195 170.197 170.197 170.193 170.187 170.185 170.196<br />
14,5 170.200 170.200 170.200 170.200 170.200 170.200 170.200 170.200 170.200 170.200 170.200 170.200 170.200 170.200<br />
15,5 170.200 170.200 170.200 170.200 170.200 170.200 170.200 170.200 170.200 170.200 170.200 170.200 170.200 170.200<br />
16,5 170.200 170.200 170.200 170.200 170.200 170.200 170.200 170.200 170.200 170.200 170.200 170.200 170.200 170.200<br />
17,5 170.200 170.200 170.200 170.200 170.200 170.200 170.200 170.200 170.200 170.200 170.200 170.200 170.200 170.200<br />
18,5 170.200 170.200 170.200 170.200 170.200 170.200 170.200 170.200 170.200 170.200 170.200 170.200 170.200 170.200<br />
19,5 170.200 170.200 170.200 170.200 170.200 170.200 170.200 170.200 170.200 170.200 170.200 170.200 170.200 170.200<br />
20,5 170.200 170.200 170.200 170.200 170.200 170.200 170.200 170.200 170.200 170.200 170.200 170.200 170.200 170.200<br />
21,5 170.200 170.200 170.200 170.200 170.200 170.200 170.200 170.200 170.200 170.200 170.200 170.200 170.200 170.200<br />
22,5 170.200 170.200 170.200 170.200 170.200 170.200 170.200 170.200 170.200 170.200 170.200 170.200 170.200 170.200<br />
23,5 170.200 170.200 170.200 170.200 170.200 170.200 170.200 170.200 170.200 170.200 170.200 170.200 170.200 170.200<br />
24,5 170.200 170.200 170.200 170.200 170.200 170.200 170.200 170.200 170.200 170.200 170.200 170.200 170.200 170.200<br />
25,5 0 0 0 0 0 0 0 0 0 0 0 0 0 0<br />
26,5 0 0 0 0 0 0 0 0 0 0 0 0 0 0<br />
27,5 0 0 0 0 0 0 0 0 0 0 0 0 0 0<br />
28,5 0 0 0 0 0 0 0 0 0 0 0 0 0 0<br />
29,5 0 0 0 0 0 0 0 0 0 0 0 0 0 0<br />
Descrição:<br />
A curva de potência do parque é semelhante a uma curva de potência de Aerogerador, signific<strong>and</strong>o que qu<strong>and</strong>o uma dada velocidade de vento aparece em frente ao parque com a<br />
mesma velocidade em toda a área do parque (antes da influência do parque), o resultado do parque pode ser encontrada na curva de potência do parque. Outra forma de se dizer<br />
isto: A curva de potência do parque inclui perdas de conjunto, mas NÃO inclui variações do terreno na velocidade do vento pela área do parque.<br />
A medição de uma curva de potência do parque não é tão simples como a medição de uma curva de potência de Aerogerador devido ao fato de que a curva de potência do parque<br />
depende da direção do vento e de que a mesma velocidade do vento normamente não aparecerá para toda a área do parque ao mesmo tempo (apenas em terrenos não complexos<br />
extremamente lisos). A idéia com esta versão de curva de potência do parque não é utilizá-la para validações baseadas em medições. Isto exigiria pelo menos 2 torres de medição<br />
em dois lados do parque, caso contrário apenas poucos setores de direção poderiam ser testados, E terrenos não complexos (normalmente apenas utilizável em alto mar). Outra<br />
versão de curva de potência do parque está disponível no <strong>Wind</strong>PRO.<br />
A curva de potência do parque pode ser utilizada para:<br />
1. Sistemas de previsão, baseados em dados do vento mais brutos (aproximados), a curva de potência do parque seria uma maneira eficiente de fazer a conexão da<br />
velocidade do vento (e direção) para a potência.<br />
2. Construção de curvas de duração, cont<strong>and</strong>o quantas vezes uma determinada potência irá aparecer, a curva de potência do parque pode ser utilizada em conjunto com a<br />
distribuição média do vento para a área do complexo Eólico na altura do cubo. A distribuição média do vento pode ser eventualmente obtida com base nos parâmetros de<br />
Weibull para cada posição do Aerogerador. Estes são encontrados no menu de impressão: > Result to file< no > Park resultResult to file< dados de ><strong>Wind</strong> Speeds Inside <strong>Wind</strong> farm< também estão disponíveis. Estes podem (por exemplo, através do Excel) ser utilizados para extrair as<br />
reduções causadas pela esteira na velocidade do vento medida.
Projeto:<br />
BSO+URA<br />
PARK - Map<br />
Cálculo: BSO II<br />
<strong>Wind</strong>PRO é desenvolvido pela EMD International A / S, Niels Jernesvej 10, DK-9220 Aalborg Ø, Tel. +45 96 35 44 44, Fax +45 96 35 44 46, E-mail: windpro@emd.dk<br />
<strong>Wind</strong>PRO version 2.8.572 Nov 2012<br />
Impresso/Página<br />
02-12-2012 10:31 / 5<br />
Usuário licenciado:<br />
EMD International A/S<br />
Niels Jernes Vej 10<br />
DK-9220 Aalborg Ø<br />
+45 9635 4444<br />
Maurizio Motta / mm@emd.dk<br />
Calculado:<br />
30-11-2012 14:30/2.8.572<br />
0 2,5 5 7,5 10 km<br />
Mapa: Topographic , Escala de impressão 1:125.000, Centro do mapa UTM WGS84 S Zone: 22 Leste: 614.972 Norte: 6.898.846<br />
Novo Aerogerador Aerogerador existente
Projeto:<br />
BSO+URA<br />
Loss&Uncertainty - Park result<br />
Cálculo: BSO II<br />
Main data for PARK<br />
PARK calculation 2.8.572: BSO II<br />
Count 13<br />
Rated power 29,9 MW<br />
Mean wind speed 6,5 m/s at hub height<br />
Sensitivity 1,7 %AEP / %Mean <strong>Wind</strong> Speed<br />
Expected lifetime 20 Years<br />
RESULTS<br />
P50 P84 P90<br />
NET AEP [GWh/y] 79,8 69,3 66,3<br />
Capacity factor [%] 30,5 26,5 25,3<br />
Full load hours [h/y] 2.668 2.317 2.216<br />
Result details<br />
P50 Uncertainty<br />
GROSS AEP *) 96,6 GWh/y 12,9 %<br />
Bias correction 0,0 GWh/y 0,0 % 0,0 %<br />
Loss correction -16,8 GWh/y -17,4 % 2,8 %<br />
Wake loss -10,9 %<br />
Other losses -7,3 %<br />
NET AEP 79,8 GWh/y 13,2 %<br />
*) Calculated <strong>Annual</strong> <strong>Energy</strong> <strong>Production</strong> before any bias or loss corrections<br />
Assumptions: Uncertainty <strong>and</strong> percentiles (PXX values) are calculated for the expected lifetime<br />
<strong>Wind</strong>PRO é desenvolvido pela EMD International A / S, Niels Jernesvej 10, DK-9220 Aalborg Ø, tel. +45 96 35 44 44, Fax +45 96 35 44 46, E-mail: windpro@emd.dk<br />
<strong>Wind</strong>PRO version 2.8.576 Dec 2012<br />
Impresso / Página<br />
11-12-2012 15:05 / 1<br />
Usuário licenciado:<br />
EMD International A/S<br />
Niels Jernes Vej 10<br />
DK-9220 Aalborg Ø<br />
+45 9635 4444<br />
Maurizio Motta / mm@emd.dk<br />
Calculado:<br />
11-12-2012 15:05/2.8.576<br />
Scale: 50.000
Projeto:<br />
BSO+URA<br />
Loss&Uncertainty - Assumptions <strong>and</strong> results<br />
Cálculo: BSO II<br />
ASSUMPTIONS<br />
<strong>Wind</strong>PRO é desenvolvido pela EMD International A / S, Niels Jernesvej 10, DK-9220 Aalborg Ø, tel. +45 96 35 44 44, Fax +45 96 35 44 46, E-mail: windpro@emd.dk<br />
<strong>Wind</strong>PRO version 2.8.576 Dec 2012<br />
Impresso / Página<br />
11-12-2012 15:05 / 2<br />
Usuário licenciado:<br />
EMD International A/S<br />
Niels Jernes Vej 10<br />
DK-9220 Aalborg Ø<br />
+45 9635 4444<br />
Maurizio Motta / mm@emd.dk<br />
Calculado:<br />
11-12-2012 15:05/2.8.576<br />
LOSS<br />
Method *) Loss Loss Std dev**) Comment<br />
[%] [GWh/y] [%]<br />
1. Efeitos esteira<br />
Efeitos esteira, todos Aerogeradores Calculation 10,9 10,6 20,0<br />
2. Disponibilidade<br />
Disponibilidade da turbina Estimate 3,0 2,9 50,0<br />
Disponibilidade da rede Estimate 0,5 0,5 20,0<br />
3. Desempenho da turbina No input<br />
4. Elétrica<br />
Perdas elétricas Estimate 2,0 1,9 20,0 Calculado pela VILCO<br />
5. Ambiental<br />
Degradação de desempenho não devido à formação de gelo Estimate 1,0 1,0 50,0<br />
Desligamento devido à formação de gelo, granizo, relâmpago, etc. Estimate 1,0 1,0 50,0<br />
Alta e baixa temperatura Calculation 0,0 0,0 0,0<br />
6. Corte No input<br />
7. Outras No input<br />
LOSS, total 17,4 16,8 2,8<br />
UNCERTAINTY<br />
Method *) Std dev, Std dev, Comment<br />
wind speed AEP<br />
[%] [%]<br />
A. Dados de vento<br />
Medição de vento/Dados de vento Estimate 5,0 8,4<br />
Correção de longo termo Estimate 7,0<br />
Variação de ano para ano Estimate 3,7 6,2<br />
Clima futuro<br />
Outra relacionada ao vento<br />
Estimate 5,0<br />
B. Modelo de vento<br />
Extrapolação vertical Calculation 0,6 1,0<br />
Extrapolação horizontal<br />
Outra relacionada ao modelo de vento<br />
C. Conversão de potência<br />
Calculation 2,3 3,9<br />
Incerteza na curva de potência<br />
Medição de incertezas<br />
Outras incertezas relacionadas à PAE<br />
Calculation 2,0<br />
D. BIAS, total uncertainty 0,0<br />
E. Perdas, total uncertainty 2,8<br />
UNCERTAINTY, total (1y average) 14,5<br />
UNCERTAINTY, total (20y average) 13,2<br />
VARIABILITY<br />
Years Variability Total<br />
(std dev) std dev<br />
[%] [%]<br />
1 6,24 14,5<br />
5 2,79 13,4<br />
10 1,97 13,3<br />
20 1,39 13,2
Projeto:<br />
BSO+URA<br />
Loss&Uncertainty - Assumptions <strong>and</strong> results<br />
Cálculo: BSO II<br />
RESULTS<br />
AEP versus exceedance level / time horizon<br />
PXX 1 y 5 y 10 y 20 y<br />
[%] [MWh/y] [MWh/y] [MWh/y] [MWh/y]<br />
50 79.772 79.772 79.772 79.772<br />
75 71.947 72.546 72.625 72.664<br />
84 68.236 69.119 69.234 69.292<br />
90 64.905 66.043 66.192 66.267<br />
95 60.691 62.151 62.342 62.439<br />
<strong>Wind</strong>PRO é desenvolvido pela EMD International A / S, Niels Jernesvej 10, DK-9220 Aalborg Ø, tel. +45 96 35 44 44, Fax +45 96 35 44 46, E-mail: windpro@emd.dk<br />
<strong>Wind</strong>PRO version 2.8.576 Dec 2012<br />
Impresso / Página<br />
11-12-2012 15:05 / 3<br />
Usuário licenciado:<br />
EMD International A/S<br />
Niels Jernes Vej 10<br />
DK-9220 Aalborg Ø<br />
+45 9635 4444<br />
Maurizio Motta / mm@emd.dk<br />
Calculado:<br />
11-12-2012 15:05/2.8.576<br />
*) Calculation means that a calculation method available in the <strong>Wind</strong>PRO software is used. This still typically involve a user judgement <strong>and</strong> user data where the quality of those decides the accuracy. If<br />
calculation method is used, the values will often be different from turbine to turbine, here the average is shown, but at page "WTG results" the individual turbine results are shown.<br />
**) For totals the std dev refers to the full AEP, otherwise std dev refers to the bias or loss component which is a fraction of the total AEP.
Projeto:<br />
BSO+URA<br />
Loss&Uncertainty - WTG results<br />
Cálculo: BSO II<br />
Main data for PARK<br />
PARK calculation 2.8.572: BSO II<br />
Count 13<br />
Rated power 29,9 MW<br />
Mean wind speed 6,5 m/s at hub height<br />
Sensitivity 1,7 %AEP / %Mean <strong>Wind</strong> Speed<br />
Expected lifetime 20 Years<br />
<strong>Wind</strong>PRO é desenvolvido pela EMD International A / S, Niels Jernesvej 10, DK-9220 Aalborg Ø, tel. +45 96 35 44 44, Fax +45 96 35 44 46, E-mail: windpro@emd.dk<br />
<strong>Wind</strong>PRO version 2.8.576 Dec 2012<br />
Impresso / Página<br />
11-12-2012 15:05 / 4<br />
Usuário licenciado:<br />
EMD International A/S<br />
Niels Jernes Vej 10<br />
DK-9220 Aalborg Ø<br />
+45 9635 4444<br />
Maurizio Motta / mm@emd.dk<br />
Calculado:<br />
11-12-2012 15:05/2.8.576<br />
Scale: 50.000<br />
Expected AEP per WTG including bias, loss <strong>and</strong> uncertainty evaluation<br />
20 years averaging<br />
Description Calculated GROSS*) Bias Loss Unc. P50 P84 P90<br />
[MWh/y] [%] [%] [%] [MWh/y] [MWh/y] [MWh/y]<br />
1 Siemens SWT-2.3-113 2300 113.0 !O! hub: 99,5 m (TOT: 156,0 m) (1099) 7.854,3 0,0 13,1 13,7 6.823,0 5.893,8 5.625,5<br />
2 Siemens SWT-2.3-113 2300 113.0 !O! hub: 99,5 m (TOT: 156,0 m) (1100) 7.769,0 0,0 14,8 13,5 6.616,3 5.730,3 5.474,5<br />
3 Siemens SWT-2.3-113 2300 113.0 !O! hub: 99,5 m (TOT: 156,0 m) (1101) 7.842,2 0,0 17,8 13,1 6.442,7 5.603,0 5.360,6<br />
4 Siemens SWT-2.3-113 2300 113.0 !O! hub: 99,5 m (TOT: 156,0 m) (1102) 7.529,1 0,0 18,4 12,5 6.145,5 5.380,7 5.159,9<br />
5 Siemens SWT-2.3-113 2300 113.0 !O! hub: 99,5 m (TOT: 156,0 m) (1103) 7.405,0 0,0 17,9 13,2 6.079,5 5.280,1 5.049,3<br />
6 Siemens SWT-2.3-113 2300 113.0 !O! hub: 99,5 m (TOT: 156,0 m) (1104) 7.479,3 0,0 18,9 12,6 6.067,5 5.304,3 5.083,9<br />
7 Siemens SWT-2.3-113 2300 113.0 !O! hub: 99,5 m (TOT: 156,0 m) (1105) 7.484,2 0,0 19,4 14,0 6.031,7 5.190,7 4.947,9<br />
8 Siemens SWT-2.3-113 2300 113.0 !O! hub: 99,5 m (TOT: 156,0 m) (1106) 7.499,1 0,0 17,0 12,7 6.227,6 5.443,2 5.216,7<br />
9 Siemens SWT-2.3-113 2300 113.0 !O! hub: 99,5 m (TOT: 156,0 m) (1107) 7.083,9 0,0 17,9 14,2 5.812,9 4.991,1 4.753,8<br />
10 Siemens SWT-2.3-113 2300 113.0 !O! hub: 99,5 m (TOT: 156,0 m) (1108) 7.047,6 0,0 14,9 15,0 5.999,9 5.102,7 4.843,6<br />
11 Siemens SWT-2.3-113 2300 113.0 !O! hub: 99,5 m (TOT: 156,0 m) (1109) 7.212,3 0,0 16,7 12,8 6.008,2 5.244,1 5.023,5<br />
12 Siemens SWT-2.3-113 2300 113.0 !O! hub: 99,5 m (TOT: 156,0 m) (1110) 7.199,5 0,0 19,2 12,7 5.813,8 5.077,0 4.864,2<br />
13 Siemens SWT-2.3-113 2300 113.0 !O! hub: 99,5 m (TOT: 156,0 m) (1111) 7.205,2 0,0 20,8 14,3 5.703,3 4.890,0 4.655,2<br />
PARK 96.610,6 0,0 17,4 13,2 79.771,9 69.292,4 66.267,0
Projeto:<br />
BSO+URA<br />
PARK - Resultado Principal<br />
Cálculo: BSO III<br />
Modelo de Esteira N.O. Jensen (RISØ/EMD)<br />
Configurações de Cálculo<br />
Modo de cálculo da densidade do ar Individual por aerogerador<br />
Resultado do aerogerador na altitude do cubo 1,030 kg/m³ para 1,059 kg/m³<br />
Densidade do ar em relação ao padrão 84,1 % para 86,5 %<br />
Altitude do cubo acima do nível do mar (asl) 1.301,5 m para 1.586,4 m<br />
Temperatura média anual na altitude do cubo 12,2 °C para 14,0 °C<br />
Pressão nos Aerogeradores 843,8 hPa para 873,0 hPa<br />
Parâmetros do Modelo de Esteira<br />
Do ângulo Para o ângulo Tipo de terreno Constante de Decaimento de Esteira<br />
[°] [°]<br />
-180,0 180,0 Open farml<strong>and</strong> 0,075<br />
Configurações de cálculo de esteira<br />
Ângulo [°] Velocidade do vento [m/s]<br />
início fim passo início fim passo<br />
0,5 360,0 1,0 0,5 30,5 1,0<br />
Versão do WAsP WAsP 6-9 RVEA0011.dll 1, 0, 0, 13<br />
Parâmetros do WAsP Parâmetros WASP fora do padrão - informações detalhadas<br />
no final de Resultados principais<br />
<strong>Wind</strong>PRO é desenvolvido pela EMD International A / S, Niels Jernesvej 10, DK-9220 Aalborg Ø, Tel. +45 96 35 44 44, Fax +45 96 35 44 46, E-mail: windpro@emd.dk<br />
<strong>Wind</strong>PRO version 2.8.572 Nov 2012<br />
Impresso/Página<br />
02-12-2012 10:32 / 1<br />
Usuário licenciado:<br />
EMD International A/S<br />
Niels Jernes Vej 10<br />
DK-9220 Aalborg Ø<br />
+45 9635 4444<br />
Maurizio Motta / mm@emd.dk<br />
Calculado:<br />
30-11-2012 14:39/2.8.572<br />
Escala 1:160.000<br />
Novo Aerogerador Dados do terreno<br />
Resultados chave para altura de 100,0 m acima do nível do terreno<br />
Terreno UTM WGS84 S Zona: 22<br />
Leste Norte Nome da distribuição de Tipo Energia eólica Velocidade Rugosidade<br />
vento média do equivalente<br />
vento<br />
[kWh/m²] [m/s]<br />
A 614.109 6.900.652 For WAsP - URA N WAsP (WAsP 6-9 RVEA0011.dll 1, 0, 0, 13) 2.853 6,7 2,1<br />
B 618.993 6.893.678 For WAsP - URA S+BSO WAsP (WAsP 6-9 RVEA0011.dll 1, 0, 0, 13) 2.418 6,5 1,2<br />
C 615.567 6.896.612 For WAsP - URA S+BSO WAsP (WAsP 6-9 RVEA0011.dll 1, 0, 0, 13) 2.091 6,2 1,7<br />
Energia Anual Calculada para Complexo Eólico<br />
Resultados específicos¤)<br />
Arranjo de Aerogeradores Resultado BRUTO (sem perda) Eficiência Fator de Resultado médio Horas de carga Velocidade média do vento<br />
PARK Aerogeradores livres do parque capacidade por Aerogerador plena @altura do cubo<br />
[MWh/ano] [MWh/ano] [%] [%] [MWh/ano] [Horas/ano] [m/s]<br />
Complexo eólico 85.623,3 92.712,4 92,4 32,7 6.586,4 2.864 6,4<br />
¤) Baseado em resultados reduzidos por efeito esteira, porém nenhuma outra perda incluída<br />
Energia Anual Calculada para cada um de 13 novos Aerogeradores com potência nominal total de 29,9 MW<br />
Tipo de Aerogerador Curva de potência Energia Anual Parque<br />
Terreno Válido Fabric. Tipo de gerador Potência, Diâmetro do Altura Criador Nome Resultado Eficiência Fator de Velocidade<br />
nominal rotor do capacidade média do<br />
cubo vento<br />
[kW] [m] [m] [MWh] [%] [%] [m/s]<br />
1 B Sim Siemens SWT-2.3-113-2.300 2.300 113,0 99,5 EMD Level 0 - - St<strong>and</strong>ard setting 0dB - 6.743,1 93,50 33,4 6,40<br />
2 B Sim Siemens SWT-2.3-113-2.300 2.300 113,0 99,5 EMD Level 0 - - St<strong>and</strong>ard setting 0dB - 6.559,3 92,74 32,5 6,33<br />
3 B Sim Siemens SWT-2.3-113-2.300 2.300 113,0 99,5 EMD Level 0 - - St<strong>and</strong>ard setting 0dB - 6.693,8 92,75 33,2 6,40<br />
4 B Sim Siemens SWT-2.3-113-2.300 2.300 113,0 99,5 EMD Level 0 - - St<strong>and</strong>ard setting 0dB - 6.337,4 88,53 31,4 6,34<br />
5 B Sim Siemens SWT-2.3-113-2.300 2.300 113,0 99,5 EMD Level 0 - - St<strong>and</strong>ard setting 0dB - 6.635,0 94,03 32,9 6,32<br />
6 B Sim Siemens SWT-2.3-113-2.300 2.300 113,0 99,5 EMD Level 0 - - St<strong>and</strong>ard setting 0dB - 6.633,4 91,08 32,9 6,43<br />
7 B Sim Siemens SWT-2.3-113-2.300 2.300 113,0 99,5 EMD Level 0 - - St<strong>and</strong>ard setting 0dB - 6.193,8 91,98 30,7 6,12<br />
8 B Sim Siemens SWT-2.3-113-2.300 2.300 113,0 99,5 EMD Level 0 - - St<strong>and</strong>ard setting 0dB - 6.430,7 95,05 31,9 6,18<br />
9 B Sim Siemens SWT-2.3-113-2.300 2.300 113,0 99,5 EMD Level 0 - - St<strong>and</strong>ard setting 0dB - 6.267,0 94,79 31,1 6,08<br />
10 B Sim Siemens SWT-2.3-113-2.300 2.300 113,0 99,5 EMD Level 0 - - St<strong>and</strong>ard setting 0dB - 6.075,5 90,30 30,1 6,13<br />
11 B Sim Siemens SWT-2.3-113-2.300 2.300 113,0 99,5 EMD Level 0 - - St<strong>and</strong>ard setting 0dB - 7.371,2 94,66 36,6 6,67<br />
12 B Sim Siemens SWT-2.3-113-2.300 2.300 113,0 99,5 EMD Level 0 - - St<strong>and</strong>ard setting 0dB - 7.011,6 91,56 34,8 6,66<br />
13 B Sim Siemens SWT-2.3-113-2.300 2.300 113,0 99,5 EMD Level 0 - - St<strong>and</strong>ard setting 0dB - 6.671,7 89,81 33,1 6,50<br />
Resultados Anuais de Energia não incluem nenhuma perda além das perdas por efeito esteira. Para PAE líquida esperada (produção esperada<br />
garantida), verificar relatório de Perdas & Incertezas.<br />
*) Nas perdas por conjunto está incluída influência de 61 Aerogerador(es) na vizinhança, que recebe(m) o status de Aerogeradores de Referência, veja relatório a parte para identificá-los.
Projeto:<br />
BSO+URA<br />
PARK - Resultado Principal<br />
Cálculo: BSO III<br />
<strong>Wind</strong>PRO é desenvolvido pela EMD International A / S, Niels Jernesvej 10, DK-9220 Aalborg Ø, Tel. +45 96 35 44 44, Fax +45 96 35 44 46, E-mail: windpro@emd.dk<br />
<strong>Wind</strong>PRO version 2.8.572 Nov 2012<br />
Impresso/Página<br />
02-12-2012 10:32 / 2<br />
Usuário licenciado:<br />
EMD International A/S<br />
Niels Jernes Vej 10<br />
DK-9220 Aalborg Ø<br />
+45 9635 4444<br />
Maurizio Motta / mm@emd.dk<br />
Calculado:<br />
30-11-2012 14:39/2.8.572<br />
Localização do Aerogerador<br />
UTM WGS84 S Zona: 22<br />
Leste Norte Z Dados de linha/Descrição<br />
[m]<br />
1 Novo 620.656 6.894.812 1.445,8 Siemens SWT-2.3-113 2300 113.0 !O! hub: 99,5 m (TOT: 156,0 m) (1114)<br />
2 Novo 619.381 6.895.662 1.418,2 Siemens SWT-2.3-113 2300 113.0 !O! hub: 99,5 m (TOT: 156,0 m) (1115)<br />
3 Novo 618.856 6.895.862 1.415,2 Siemens SWT-2.3-113 2300 113.0 !O! hub: 99,5 m (TOT: 156,0 m) (1116)<br />
4 Novo 620.556 6.893.362 1.400,6 Siemens SWT-2.3-113 2300 113.0 !O! hub: 99,5 m (TOT: 156,0 m) (1117)<br />
5 Novo 619.868 6.895.493 1.425,9 Siemens SWT-2.3-113 2300 113.0 !O! hub: 99,5 m (TOT: 156,0 m) (1118)<br />
6 Novo 619.406 6.894.512 1.426,9 Siemens SWT-2.3-113 2300 113.0 !O! hub: 99,5 m (TOT: 156,0 m) (1119)<br />
7 Novo 621.306 6.893.162 1.369,2 Siemens SWT-2.3-113 2300 113.0 !O! hub: 99,5 m (TOT: 156,0 m) (1122)<br />
8 Novo 620.406 6.895.312 1.424,8 Siemens SWT-2.3-113 2300 113.0 !O! hub: 99,5 m (TOT: 156,0 m) (1123)<br />
9 Novo 621.406 6.894.062 1.406,4 Siemens SWT-2.3-113 2300 113.0 !O! hub: 99,5 m (TOT: 156,0 m) (1124)<br />
10 Novo 620.531 6.893.937 1.404,0 Siemens SWT-2.3-113 2300 113.0 !O! hub: 99,5 m (TOT: 156,0 m) (1125)<br />
11 Novo 617.456 6.895.312 1.381,7 Siemens SWT-2.3-113 2300 113.0 !O! hub: 99,5 m (TOT: 156,0 m) (1153)<br />
12 Novo 618.056 6.895.062 1.399,7 Siemens SWT-2.3-113 2300 113.0 !O! hub: 99,5 m (TOT: 156,0 m) (1154)<br />
13 Novo 617.709 6.894.923 1.387,5 Siemens SWT-2.3-113 2300 113.0 !O! hub: 99,5 m (TOT: 156,0 m) (1155)<br />
Parâmetros WAsP fora do padrão<br />
Parâmetro do WAsP Mínimo Máximo Padrão Valor atual<br />
St<strong>and</strong>ard height #3 [m] 5,0000 200,0000 50,0000 60,0000<br />
St<strong>and</strong>ard height #4 [m] 5,0000 200,0000 100,0000 80,0000<br />
St<strong>and</strong>ard height #5 [m] 5,0000 200,0000 200,0000 100,0000<br />
Offset heat flux over l<strong>and</strong> -200,0000 200,0000 -40,0000 -20,0000
Projeto:<br />
BSO+URA<br />
PARK - Análise da produção<br />
<strong>Wind</strong>PRO é desenvolvido pela EMD International A / S, Niels Jernesvej 10, DK-9220 Aalborg Ø, Tel. +45 96 35 44 44, Fax +45 96 35 44 46, E-mail: windpro@emd.dk<br />
<strong>Wind</strong>PRO version 2.8.572 Nov 2012<br />
Impresso/Página<br />
02-12-2012 10:32 / 3<br />
Usuário licenciado:<br />
EMD International A/S<br />
Niels Jernes Vej 10<br />
DK-9220 Aalborg Ø<br />
+45 9635 4444<br />
Maurizio Motta / mm@emd.dk<br />
Calculado:<br />
30-11-2012 14:39/2.8.572<br />
Cálculo: BSO IIIAerogerador: Todos os novos Aerogeradores, Densidade do ar varia com a posição dos aerogeradores 1,030 kg/m³ - 1,059 kg/m³<br />
Análise Direcional<br />
Setor 0 N 1 NNE 2 ENE 3 L 4 ESE 5 SSE 6 S 7 SSO 8 OSO 9 O 10 ONO 11 NNO Total<br />
Energia baseada em rugosidade [MWh] 28.881,7 11.061,7 3.890,4 1.959,8 1.705,8 606,1 620,9 2.314,7 7.631,6 5.964,5 4.700,6 7.725,4 77.063,3<br />
+Aumento devido às colinas [MWh] 5.069,2 2.165,1 901,8 447,9 429,4 265,4 316,3 912,2 1.489,4 893,9 769,8 1.988,6 15.649,1<br />
-Decréscimo devido às perdas de conjunto [MWh] 1.186,5 266,2 366,7 219,5 316,0 147,1 172,0 463,4 1.347,6 917,8 711,3 975,1 7.089,1<br />
Energia resultante [MWh] 32.764,4 12.960,6 4.425,4 2.188,2 1.819,2 724,5 765,1 2.763,6 7.773,5 5.940,6 4.759,2 8.739,0 85.623,4<br />
Energia específica [kWh/m²] 657<br />
Energia específica [kWh/kW] 2.864<br />
Aumento devido às colinas [%] 17,6 19,6 23,2 22,9 25,2 43,8 50,9 39,4 19,5 15,0 16,4 25,7 20,31<br />
Decréscimo devido às perdas de conjunto [%] 3,5 2,0 7,7 9,1 14,8 16,9 18,4 14,4 14,8 13,4 13,0 10,0 7,65<br />
Utilização [%] 25,0 28,7 39,1 41,2 37,3 37,7 37,0 37,6 32,6 31,9 28,0 30,9 28,8<br />
Operacional [Horas/ano] 1.992 961 543 382 354 226 237 448 890 642 521 874 8.070<br />
Equivalente à carga plena [Horas/ano] 1.096 433 148 73 61 24 26 92 260 199 159 292 2.864
Projeto:<br />
BSO+URA<br />
PARK - Curva de potência do parque<br />
Cálculo: BSO III<br />
<strong>Wind</strong>PRO é desenvolvido pela EMD International A / S, Niels Jernesvej 10, DK-9220 Aalborg Ø, Tel. +45 96 35 44 44, Fax +45 96 35 44 46, E-mail: windpro@emd.dk<br />
<strong>Wind</strong>PRO version 2.8.572 Nov 2012<br />
Impresso/Página<br />
02-12-2012 10:32 / 4<br />
Usuário licenciado:<br />
EMD International A/S<br />
Niels Jernes Vej 10<br />
DK-9220 Aalborg Ø<br />
+45 9635 4444<br />
Maurizio Motta / mm@emd.dk<br />
Calculado:<br />
30-11-2012 14:39/2.8.572<br />
Potência<br />
Velocidade do Aerogeradores Aerogeradores do N NNE ENE L ESE SSE S SSO OSO O ONO NNO<br />
vento livres parque<br />
[m/s] [kW] [kW] [kW] [kW] [kW] [kW] [kW] [kW] [kW] [kW] [kW] [kW] [kW] [kW]<br />
0,5 0 0 0 0 0 0 0 0 0 0 0 0 0 0<br />
1,5 0 0 0 0 0 0 0 0 0 0 0 0 0 0<br />
2,5 1.785 1.576 1.606 1.605 1.590 1.507 1.494 1.572 1.606 1.608 1.591 1.505 1.494 1.571<br />
3,5 7.306 6.165 6.291 6.297 6.241 5.865 5.783 6.112 6.286 6.307 6.257 5.855 5.793 6.113<br />
4,5 16.109 13.751 14.006 14.026 13.916 13.126 12.960 13.650 14.003 14.057 13.955 13.110 12.963 13.641<br />
5,5 30.143 25.963 26.436 26.484 26.242 24.789 24.504 25.798 26.442 26.554 26.303 24.764 24.511 25.789<br />
6,5 50.320 43.583 44.369 44.467 44.009 41.642 41.160 43.341 44.401 44.590 44.104 41.581 41.167 43.307<br />
7,5 77.670 67.691 68.923 69.058 68.279 64.728 63.962 67.391 68.976 69.225 68.409 64.639 63.977 67.292<br />
8,5 112.142 99.377 101.198 101.294 100.005 95.291 94.194 99.078 101.169 101.437 100.120 95.121 94.209 99.014<br />
9,5 146.151 134.487 136.486 136.626 134.845 130.152 128.859 134.362 136.467 136.710 134.990 130.047 128.930 134.350<br />
10,5 162.578 158.309 159.348 159.410 158.368 156.076 155.271 158.538 159.325 159.397 158.458 156.112 155.352 158.559<br />
11,5 168.463 167.793 168.002 168.006 167.803 167.356 167.162 167.859 167.990 167.989 167.823 167.372 167.198 167.874<br />
12,5 170.025 169.957 169.989 169.988 169.957 169.891 169.869 169.969 169.987 169.983 169.958 169.894 169.872 169.971<br />
13,5 170.200 170.194 170.197 170.197 170.194 170.187 170.186 170.195 170.197 170.197 170.193 170.187 170.185 170.196<br />
14,5 170.200 170.200 170.200 170.200 170.200 170.200 170.200 170.200 170.200 170.200 170.200 170.200 170.200 170.200<br />
15,5 170.200 170.200 170.200 170.200 170.200 170.200 170.200 170.200 170.200 170.200 170.200 170.200 170.200 170.200<br />
16,5 170.200 170.200 170.200 170.200 170.200 170.200 170.200 170.200 170.200 170.200 170.200 170.200 170.200 170.200<br />
17,5 170.200 170.200 170.200 170.200 170.200 170.200 170.200 170.200 170.200 170.200 170.200 170.200 170.200 170.200<br />
18,5 170.200 170.200 170.200 170.200 170.200 170.200 170.200 170.200 170.200 170.200 170.200 170.200 170.200 170.200<br />
19,5 170.200 170.200 170.200 170.200 170.200 170.200 170.200 170.200 170.200 170.200 170.200 170.200 170.200 170.200<br />
20,5 170.200 170.200 170.200 170.200 170.200 170.200 170.200 170.200 170.200 170.200 170.200 170.200 170.200 170.200<br />
21,5 170.200 170.200 170.200 170.200 170.200 170.200 170.200 170.200 170.200 170.200 170.200 170.200 170.200 170.200<br />
22,5 170.200 170.200 170.200 170.200 170.200 170.200 170.200 170.200 170.200 170.200 170.200 170.200 170.200 170.200<br />
23,5 170.200 170.200 170.200 170.200 170.200 170.200 170.200 170.200 170.200 170.200 170.200 170.200 170.200 170.200<br />
24,5 170.200 170.200 170.200 170.200 170.200 170.200 170.200 170.200 170.200 170.200 170.200 170.200 170.200 170.200<br />
25,5 0 0 0 0 0 0 0 0 0 0 0 0 0 0<br />
26,5 0 0 0 0 0 0 0 0 0 0 0 0 0 0<br />
27,5 0 0 0 0 0 0 0 0 0 0 0 0 0 0<br />
28,5 0 0 0 0 0 0 0 0 0 0 0 0 0 0<br />
29,5 0 0 0 0 0 0 0 0 0 0 0 0 0 0<br />
Descrição:<br />
A curva de potência do parque é semelhante a uma curva de potência de Aerogerador, signific<strong>and</strong>o que qu<strong>and</strong>o uma dada velocidade de vento aparece em frente ao parque com a<br />
mesma velocidade em toda a área do parque (antes da influência do parque), o resultado do parque pode ser encontrada na curva de potência do parque. Outra forma de se dizer<br />
isto: A curva de potência do parque inclui perdas de conjunto, mas NÃO inclui variações do terreno na velocidade do vento pela área do parque.<br />
A medição de uma curva de potência do parque não é tão simples como a medição de uma curva de potência de Aerogerador devido ao fato de que a curva de potência do parque<br />
depende da direção do vento e de que a mesma velocidade do vento normamente não aparecerá para toda a área do parque ao mesmo tempo (apenas em terrenos não complexos<br />
extremamente lisos). A idéia com esta versão de curva de potência do parque não é utilizá-la para validações baseadas em medições. Isto exigiria pelo menos 2 torres de medição<br />
em dois lados do parque, caso contrário apenas poucos setores de direção poderiam ser testados, E terrenos não complexos (normalmente apenas utilizável em alto mar). Outra<br />
versão de curva de potência do parque está disponível no <strong>Wind</strong>PRO.<br />
A curva de potência do parque pode ser utilizada para:<br />
1. Sistemas de previsão, baseados em dados do vento mais brutos (aproximados), a curva de potência do parque seria uma maneira eficiente de fazer a conexão da<br />
velocidade do vento (e direção) para a potência.<br />
2. Construção de curvas de duração, cont<strong>and</strong>o quantas vezes uma determinada potência irá aparecer, a curva de potência do parque pode ser utilizada em conjunto com a<br />
distribuição média do vento para a área do complexo Eólico na altura do cubo. A distribuição média do vento pode ser eventualmente obtida com base nos parâmetros de<br />
Weibull para cada posição do Aerogerador. Estes são encontrados no menu de impressão: > Result to file< no > Park resultResult to file< dados de ><strong>Wind</strong> Speeds Inside <strong>Wind</strong> farm< também estão disponíveis. Estes podem (por exemplo, através do Excel) ser utilizados para extrair as<br />
reduções causadas pela esteira na velocidade do vento medida.
Projeto:<br />
BSO+URA<br />
PARK - Map<br />
Cálculo: BSO III<br />
<strong>Wind</strong>PRO é desenvolvido pela EMD International A / S, Niels Jernesvej 10, DK-9220 Aalborg Ø, Tel. +45 96 35 44 44, Fax +45 96 35 44 46, E-mail: windpro@emd.dk<br />
<strong>Wind</strong>PRO version 2.8.572 Nov 2012<br />
Impresso/Página<br />
02-12-2012 10:32 / 5<br />
Usuário licenciado:<br />
EMD International A/S<br />
Niels Jernes Vej 10<br />
DK-9220 Aalborg Ø<br />
+45 9635 4444<br />
Maurizio Motta / mm@emd.dk<br />
Calculado:<br />
30-11-2012 14:39/2.8.572<br />
0 2,5 5 7,5 10 km<br />
Mapa: Topographic , Escala de impressão 1:125.000, Centro do mapa UTM WGS84 S Zone: 22 Leste: 614.972 Norte: 6.898.846<br />
Novo Aerogerador Aerogerador existente
Projeto:<br />
BSO+URA<br />
Loss&Uncertainty - Park result<br />
Cálculo: BSO III<br />
Main data for PARK<br />
PARK calculation 2.8.572: BSO III<br />
Count 13<br />
Rated power 29,9 MW<br />
Mean wind speed 6,4 m/s at hub height<br />
Sensitivity 1,7 %AEP / %Mean <strong>Wind</strong> Speed<br />
Expected lifetime 20 Years<br />
RESULTS<br />
P50 P84 P90<br />
NET AEP [GWh/y] 79,4 68,6 65,5<br />
Capacity factor [%] 30,3 26,2 25,0<br />
Full load hours [h/y] 2.655 2.295 2.191<br />
Result details<br />
P50 Uncertainty<br />
GROSS AEP *) 92,7 GWh/y 13,4 %<br />
Bias correction 0,0 GWh/y 0,0 % 0,0 %<br />
Loss correction -13,3 GWh/y -14,4 % 2,3 %<br />
Wake loss -7,6 %<br />
Other losses -7,3 %<br />
NET AEP 79,4 GWh/y 13,6 %<br />
*) Calculated <strong>Annual</strong> <strong>Energy</strong> <strong>Production</strong> before any bias or loss corrections<br />
Assumptions: Uncertainty <strong>and</strong> percentiles (PXX values) are calculated for the expected lifetime<br />
<strong>Wind</strong>PRO é desenvolvido pela EMD International A / S, Niels Jernesvej 10, DK-9220 Aalborg Ø, tel. +45 96 35 44 44, Fax +45 96 35 44 46, E-mail: windpro@emd.dk<br />
<strong>Wind</strong>PRO version 2.8.576 Dec 2012<br />
Impresso / Página<br />
11-12-2012 15:06 / 1<br />
Usuário licenciado:<br />
EMD International A/S<br />
Niels Jernes Vej 10<br />
DK-9220 Aalborg Ø<br />
+45 9635 4444<br />
Maurizio Motta / mm@emd.dk<br />
Calculado:<br />
11-12-2012 15:06/2.8.576<br />
Scale: 50.000
Projeto:<br />
BSO+URA<br />
Loss&Uncertainty - Assumptions <strong>and</strong> results<br />
Cálculo: BSO III<br />
ASSUMPTIONS<br />
<strong>Wind</strong>PRO é desenvolvido pela EMD International A / S, Niels Jernesvej 10, DK-9220 Aalborg Ø, tel. +45 96 35 44 44, Fax +45 96 35 44 46, E-mail: windpro@emd.dk<br />
<strong>Wind</strong>PRO version 2.8.576 Dec 2012<br />
Impresso / Página<br />
11-12-2012 15:06 / 2<br />
Usuário licenciado:<br />
EMD International A/S<br />
Niels Jernes Vej 10<br />
DK-9220 Aalborg Ø<br />
+45 9635 4444<br />
Maurizio Motta / mm@emd.dk<br />
Calculado:<br />
11-12-2012 15:06/2.8.576<br />
LOSS<br />
Method *) Loss Loss Std dev**) Comment<br />
[%] [GWh/y] [%]<br />
1. Efeitos esteira<br />
Efeitos esteira, todos Aerogeradores Calculation 7,6 7,1 20,0<br />
2. Disponibilidade<br />
Disponibilidade da turbina Estimate 3,0 2,8 50,0<br />
Disponibilidade da rede Estimate 0,5 0,5 20,0<br />
3. Desempenho da turbina No input<br />
4. Elétrica<br />
Perdas elétricas Estimate 2,0 1,9 20,0 Calculado pela VILCO<br />
5. Ambiental<br />
Degradação de desempenho não devido à formação de gelo Estimate 1,0 0,9 50,0<br />
Desligamento devido à formação de gelo, granizo, relâmpago, etc. Estimate 1,0 0,9 50,0<br />
Alta e baixa temperatura Calculation 0,0 0,0 0,0<br />
6. Corte No input<br />
7. Outras No input<br />
LOSS, total 14,4 13,3 2,3<br />
UNCERTAINTY<br />
Method *) Std dev, Std dev, Comment<br />
wind speed AEP<br />
[%] [%]<br />
A. Dados de vento<br />
Medição de vento/Dados de vento Estimate 5,0 8,7<br />
Correção de longo termo Estimate 7,0<br />
Variação de ano para ano Estimate 3,7 6,4<br />
Clima futuro<br />
Outra relacionada ao vento<br />
Estimate 5,0<br />
B. Modelo de vento<br />
Extrapolação vertical Calculation 0,2 0,4<br />
Extrapolação horizontal<br />
Outra relacionada ao modelo de vento<br />
C. Conversão de potência<br />
Calculation 2,9 5,0<br />
Incerteza na curva de potência<br />
Medição de incertezas<br />
Outras incertezas relacionadas à PAE<br />
Calculation 2,0<br />
D. BIAS, total uncertainty 0,0<br />
E. Perdas, total uncertainty 2,3<br />
UNCERTAINTY, total (1y average) 15,0<br />
UNCERTAINTY, total (20y average) 13,6<br />
VARIABILITY<br />
Years Variability Total<br />
(std dev) std dev<br />
[%] [%]<br />
1 6,41 15,0<br />
5 2,87 13,9<br />
10 2,03 13,7<br />
20 1,43 13,6
Projeto:<br />
BSO+URA<br />
Loss&Uncertainty - Assumptions <strong>and</strong> results<br />
Cálculo: BSO III<br />
RESULTS<br />
AEP versus exceedance level / time horizon<br />
PXX 1 y 5 y 10 y 20 y<br />
[%] [MWh/y] [MWh/y] [MWh/y] [MWh/y]<br />
50 79.374 79.374 79.374 79.374<br />
75 71.349 71.959 72.039 72.080<br />
84 67.542 68.442 68.560 68.619<br />
90 64.126 65.286 65.438 65.514<br />
95 59.803 61.292 61.487 61.585<br />
<strong>Wind</strong>PRO é desenvolvido pela EMD International A / S, Niels Jernesvej 10, DK-9220 Aalborg Ø, tel. +45 96 35 44 44, Fax +45 96 35 44 46, E-mail: windpro@emd.dk<br />
<strong>Wind</strong>PRO version 2.8.576 Dec 2012<br />
Impresso / Página<br />
11-12-2012 15:06 / 3<br />
Usuário licenciado:<br />
EMD International A/S<br />
Niels Jernes Vej 10<br />
DK-9220 Aalborg Ø<br />
+45 9635 4444<br />
Maurizio Motta / mm@emd.dk<br />
Calculado:<br />
11-12-2012 15:06/2.8.576<br />
*) Calculation means that a calculation method available in the <strong>Wind</strong>PRO software is used. This still typically involve a user judgement <strong>and</strong> user data where the quality of those decides the accuracy. If<br />
calculation method is used, the values will often be different from turbine to turbine, here the average is shown, but at page "WTG results" the individual turbine results are shown.<br />
**) For totals the std dev refers to the full AEP, otherwise std dev refers to the bias or loss component which is a fraction of the total AEP.
Projeto:<br />
BSO+URA<br />
Loss&Uncertainty - WTG results<br />
Cálculo: BSO III<br />
Main data for PARK<br />
PARK calculation 2.8.572: BSO III<br />
Count 13<br />
Rated power 29,9 MW<br />
Mean wind speed 6,4 m/s at hub height<br />
Sensitivity 1,7 %AEP / %Mean <strong>Wind</strong> Speed<br />
Expected lifetime 20 Years<br />
<strong>Wind</strong>PRO é desenvolvido pela EMD International A / S, Niels Jernesvej 10, DK-9220 Aalborg Ø, tel. +45 96 35 44 44, Fax +45 96 35 44 46, E-mail: windpro@emd.dk<br />
<strong>Wind</strong>PRO version 2.8.576 Dec 2012<br />
Impresso / Página<br />
11-12-2012 15:06 / 4<br />
Usuário licenciado:<br />
EMD International A/S<br />
Niels Jernes Vej 10<br />
DK-9220 Aalborg Ø<br />
+45 9635 4444<br />
Maurizio Motta / mm@emd.dk<br />
Calculado:<br />
11-12-2012 15:06/2.8.576<br />
Scale: 50.000<br />
Expected AEP per WTG including bias, loss <strong>and</strong> uncertainty evaluation<br />
20 years averaging<br />
Description Calculated GROSS*) Bias Loss Unc. P50 P84 P90<br />
[MWh/y] [%] [%] [%] [MWh/y] [MWh/y] [MWh/y]<br />
1 Siemens SWT-2.3-113 2300 113.0 !O! hub: 99,5 m (TOT: 156,0 m) (1114) 7.211,7 0,0 13,3 13,7 6.251,0 5.400,2 5.154,5<br />
2 Siemens SWT-2.3-113 2300 113.0 !O! hub: 99,5 m (TOT: 156,0 m) (1115) 7.072,5 0,0 14,0 13,6 6.080,6 5.256,5 5.018,6<br />
3 Siemens SWT-2.3-113 2300 113.0 !O! hub: 99,5 m (TOT: 156,0 m) (1116) 7.217,4 0,0 14,0 13,8 6.205,3 5.354,8 5.109,2<br />
4 Siemens SWT-2.3-113 2300 113.0 !O! hub: 99,5 m (TOT: 156,0 m) (1117) 7.158,2 0,0 17,9 13,6 5.874,9 5.080,6 4.851,3<br />
5 Siemens SWT-2.3-113 2300 113.0 !O! hub: 99,5 m (TOT: 156,0 m) (1118) 7.056,5 0,0 12,8 13,7 6.150,7 5.315,6 5.074,5<br />
6 Siemens SWT-2.3-113 2300 113.0 !O! hub: 99,5 m (TOT: 156,0 m) (1119) 7.282,7 0,0 15,6 12,9 6.149,3 5.361,2 5.133,7<br />
7 Siemens SWT-2.3-113 2300 113.0 !O! hub: 99,5 m (TOT: 156,0 m) (1122) 6.734,1 0,0 14,7 14,6 5.741,8 4.906,5 4.665,4<br />
8 Siemens SWT-2.3-113 2300 113.0 !O! hub: 99,5 m (TOT: 156,0 m) (1123) 6.765,7 0,0 11,9 14,0 5.961,4 5.133,9 4.895,0<br />
9 Siemens SWT-2.3-113 2300 113.0 !O! hub: 99,5 m (TOT: 156,0 m) (1124) 6.611,3 0,0 12,1 14,7 5.809,6 4.958,1 4.712,2<br />
10 Siemens SWT-2.3-113 2300 113.0 !O! hub: 99,5 m (TOT: 156,0 m) (1125) 6.728,3 0,0 16,3 13,8 5.632,1 4.859,5 4.636,4<br />
11 Siemens SWT-2.3-113 2300 113.0 !O! hub: 99,5 m (TOT: 156,0 m) (1153) 7.787,3 0,0 12,3 13,4 6.833,2 5.922,9 5.660,1<br />
12 Siemens SWT-2.3-113 2300 113.0 !O! hub: 99,5 m (TOT: 156,0 m) (1154) 7.658,3 0,0 15,1 12,7 6.499,8 5.676,1 5.438,3<br />
13 Siemens SWT-2.3-113 2300 113.0 !O! hub: 99,5 m (TOT: 156,0 m) (1155) 7.428,4 0,0 16,7 13,3 6.184,8 5.367,4 5.131,5<br />
PARK 92.712,4 0,0 14,4 13,6 79.374,5 68.619,1 65.514,0
Projeto:<br />
BSO+URA<br />
PARK - Resultado Principal<br />
Cálculo: BSO IV<br />
Modelo de Esteira N.O. Jensen (RISØ/EMD)<br />
Configurações de Cálculo<br />
Modo de cálculo da densidade do ar Individual por aerogerador<br />
Resultado do aerogerador na altitude do cubo 1,030 kg/m³ para 1,059 kg/m³<br />
Densidade do ar em relação ao padrão 84,1 % para 86,5 %<br />
Altitude do cubo acima do nível do mar (asl) 1.301,5 m para 1.586,4 m<br />
Temperatura média anual na altitude do cubo 12,2 °C para 14,0 °C<br />
Pressão nos Aerogeradores 843,8 hPa para 873,0 hPa<br />
Parâmetros do Modelo de Esteira<br />
Do ângulo Para o ângulo Tipo de terreno Constante de Decaimento de Esteira<br />
[°] [°]<br />
-180,0 180,0 Open farml<strong>and</strong> 0,075<br />
Configurações de cálculo de esteira<br />
Ângulo [°] Velocidade do vento [m/s]<br />
início fim passo início fim passo<br />
0,5 360,0 1,0 0,5 30,5 1,0<br />
Versão do WAsP WAsP 6-9 RVEA0011.dll 1, 0, 0, 13<br />
Parâmetros do WAsP Parâmetros WASP fora do padrão - informações detalhadas<br />
no final de Resultados principais<br />
<strong>Wind</strong>PRO é desenvolvido pela EMD International A / S, Niels Jernesvej 10, DK-9220 Aalborg Ø, Tel. +45 96 35 44 44, Fax +45 96 35 44 46, E-mail: windpro@emd.dk<br />
<strong>Wind</strong>PRO version 2.8.572 Nov 2012<br />
Impresso/Página<br />
02-12-2012 10:32 / 1<br />
Usuário licenciado:<br />
EMD International A/S<br />
Niels Jernes Vej 10<br />
DK-9220 Aalborg Ø<br />
+45 9635 4444<br />
Maurizio Motta / mm@emd.dk<br />
Calculado:<br />
30-11-2012 14:45/2.8.572<br />
Escala 1:150.000<br />
Novo Aerogerador Dados do terreno<br />
Resultados chave para altura de 100,0 m acima do nível do terreno<br />
Terreno UTM WGS84 S Zona: 22<br />
Leste Norte Nome da distribuição de Tipo Energia eólica Velocidade Rugosidade<br />
vento média do equivalente<br />
vento<br />
[kWh/m²] [m/s]<br />
A 614.109 6.900.652 For WAsP - URA N WAsP (WAsP 6-9 RVEA0011.dll 1, 0, 0, 13) 2.853 6,7 2,1<br />
B 618.993 6.893.678 For WAsP - URA S+BSO WAsP (WAsP 6-9 RVEA0011.dll 1, 0, 0, 13) 2.418 6,5 1,2<br />
C 615.567 6.896.612 For WAsP - URA S+BSO WAsP (WAsP 6-9 RVEA0011.dll 1, 0, 0, 13) 2.091 6,2 1,7<br />
Energia Anual Calculada para Complexo Eólico<br />
Resultados específicos¤)<br />
Arranjo de Aerogeradores Resultado BRUTO (sem perda) Eficiência Fator de Resultado médio Horas de carga Velocidade média do vento<br />
PARK Aerogeradores livres do parque capacidade por Aerogerador plena @altura do cubo<br />
[MWh/ano] [MWh/ano] [%] [%] [MWh/ano] [Horas/ano] [m/s]<br />
Complexo eólico 6.717,1 7.074,7 94,9 33,3 6.717,1 2.920 6,3<br />
¤) Baseado em resultados reduzidos por efeito esteira, porém nenhuma outra perda incluída<br />
Energia Anual Calculada para cada um de 1 novos Aerogeradores com potência nominal total de 2,3 MW<br />
Tipo de Aerogerador Curva de potência Energia Anual Parque<br />
Terreno Válido Fabric. Tipo de gerador Potência, Diâmetro do Altura Criador Nome Resultado Eficiência Fator de Velocidade<br />
nominal rotor do capacidade média do<br />
cubo vento<br />
[kW] [m] [m] [MWh] [%] [%] [m/s]<br />
1 B Sim Siemens SWT-2.3-113-2.300 2.300 113,0 99,5 EMD Level 0 - - St<strong>and</strong>ard setting 0dB - 6.717,1 94,95 33,3 6,30<br />
Resultados Anuais de Energia não incluem nenhuma perda além das perdas por efeito esteira. Para PAE líquida esperada (produção esperada<br />
garantida), verificar relatório de Perdas & Incertezas.<br />
Localização do Aerogerador<br />
UTM WGS84 S Zona: 22<br />
Leste Norte Z Dados de linha/Descrição<br />
[m]<br />
1 Novo 619.156 6.896.187 1.411,1 Siemens SWT-2.3-113 2300 113.0 !O! hub: 99,5 m (TOT: 156,0 m) (1120)<br />
*) Nas perdas por conjunto está incluída influência de 73 Aerogerador(es) na vizinhança, que recebe(m) o status de Aerogeradores de Referência, veja relatório a parte para identificá-los.
Projeto:<br />
BSO+URA<br />
PARK - Resultado Principal<br />
Cálculo: BSO IV<br />
Parâmetros WAsP fora do padrão<br />
Parâmetro do WAsP Mínimo Máximo Padrão Valor atual<br />
St<strong>and</strong>ard height #3 [m] 5,0000 200,0000 50,0000 60,0000<br />
St<strong>and</strong>ard height #4 [m] 5,0000 200,0000 100,0000 80,0000<br />
St<strong>and</strong>ard height #5 [m] 5,0000 200,0000 200,0000 100,0000<br />
Offset heat flux over l<strong>and</strong> -200,0000 200,0000 -40,0000 -20,0000<br />
<strong>Wind</strong>PRO é desenvolvido pela EMD International A / S, Niels Jernesvej 10, DK-9220 Aalborg Ø, Tel. +45 96 35 44 44, Fax +45 96 35 44 46, E-mail: windpro@emd.dk<br />
<strong>Wind</strong>PRO version 2.8.572 Nov 2012<br />
Impresso/Página<br />
02-12-2012 10:32 / 2<br />
Usuário licenciado:<br />
EMD International A/S<br />
Niels Jernes Vej 10<br />
DK-9220 Aalborg Ø<br />
+45 9635 4444<br />
Maurizio Motta / mm@emd.dk<br />
Calculado:<br />
30-11-2012 14:45/2.8.572
Projeto:<br />
BSO+URA<br />
PARK - Análise da produção<br />
<strong>Wind</strong>PRO é desenvolvido pela EMD International A / S, Niels Jernesvej 10, DK-9220 Aalborg Ø, Tel. +45 96 35 44 44, Fax +45 96 35 44 46, E-mail: windpro@emd.dk<br />
<strong>Wind</strong>PRO version 2.8.572 Nov 2012<br />
Impresso/Página<br />
02-12-2012 10:32 / 3<br />
Usuário licenciado:<br />
EMD International A/S<br />
Niels Jernes Vej 10<br />
DK-9220 Aalborg Ø<br />
+45 9635 4444<br />
Maurizio Motta / mm@emd.dk<br />
Calculado:<br />
30-11-2012 14:45/2.8.572<br />
Cálculo: BSO IVAerogerador: Todos os novos Aerogeradores, Densidade do ar varia com a posição dos aerogeradores 1,030 kg/m³ - 1,059 kg/m³<br />
Análise Direcional<br />
Setor 0 N 1 NNE 2 ENE 3 L 4 ESE 5 SSE 6 S 7 SSO 8 OSO 9 O 10 ONO 11 NNO Total<br />
Energia baseada em rugosidade [MWh] 2.124,0 832,1 318,0 158,4 140,6 43,8 43,2 159,3 603,8 496,1 379,7 580,1 5.879,1<br />
+Aumento devido às colinas [MWh] 241,6 130,3 112,6 70,6 48,3 13,7 10,4 39,3 151,4 141,5 91,0 144,9 1.195,6<br />
-Decréscimo devido às perdas de conjunto [MWh] 1,8 0,0 0,0 0,0 25,2 22,8 11,2 67,0 154,7 39,3 11,8 23,8 357,6<br />
Energia resultante [MWh] 2.363,8 962,4 430,6 229,0 163,7 34,7 42,5 131,6 600,5 598,3 458,9 701,2 6.717,1<br />
Energia específica [kWh/m²] 670<br />
Energia específica [kWh/kW] 2.920<br />
Aumento devido às colinas [%] 11,4 15,7 35,4 44,6 34,4 31,2 24,1 24,6 25,1 28,5 24,0 25,0 20,34<br />
Decréscimo devido às perdas de conjunto [%] 0,1 0,0 0,0 0,0 13,3 39,6 20,8 33,7 20,5 6,2 2,5 3,3 5,05<br />
Utilização [%] 28,1 30,2 41,1 45,0 37,3 27,5 36,0 29,9 29,8 32,9 30,5 34,1 31,0<br />
Operacional [Horas/ano] 1.910 931 586 421 367 212 213 405 915 708 558 875 8.102<br />
Equivalente à carga plena [Horas/ano] 1.028 418 187 100 71 15 18 57 261 260 200 305 2.920
Projeto:<br />
BSO+URA<br />
PARK - Curva de potência do parque<br />
Cálculo: BSO IV<br />
<strong>Wind</strong>PRO é desenvolvido pela EMD International A / S, Niels Jernesvej 10, DK-9220 Aalborg Ø, Tel. +45 96 35 44 44, Fax +45 96 35 44 46, E-mail: windpro@emd.dk<br />
<strong>Wind</strong>PRO version 2.8.572 Nov 2012<br />
Impresso/Página<br />
02-12-2012 10:32 / 4<br />
Usuário licenciado:<br />
EMD International A/S<br />
Niels Jernes Vej 10<br />
DK-9220 Aalborg Ø<br />
+45 9635 4444<br />
Maurizio Motta / mm@emd.dk<br />
Calculado:<br />
30-11-2012 14:45/2.8.572<br />
Potência<br />
Velocidade do Aerogeradores Aerogeradores do N NNE ENE L ESE SSE S SSO OSO O ONO NNO<br />
vento livres parque<br />
[m/s] [kW] [kW] [kW] [kW] [kW] [kW] [kW] [kW] [kW] [kW] [kW] [kW] [kW] [kW]<br />
0,5 0 0 0 0 0 0 0 0 0 0 0 0 0 0<br />
1,5 0 0 0 0 0 0 0 0 0 0 0 0 0 0<br />
2,5 1.785 1.576 1.606 1.605 1.590 1.507 1.494 1.572 1.606 1.608 1.591 1.505 1.494 1.571<br />
3,5 7.306 6.165 6.291 6.297 6.241 5.865 5.783 6.112 6.286 6.307 6.257 5.855 5.793 6.113<br />
4,5 16.109 13.751 14.006 14.026 13.916 13.126 12.960 13.650 14.003 14.057 13.955 13.110 12.963 13.641<br />
5,5 30.143 25.963 26.436 26.484 26.242 24.789 24.504 25.798 26.442 26.554 26.303 24.764 24.511 25.789<br />
6,5 50.320 43.583 44.369 44.467 44.009 41.642 41.160 43.341 44.401 44.590 44.104 41.581 41.167 43.307<br />
7,5 77.670 67.691 68.923 69.058 68.279 64.728 63.962 67.391 68.976 69.225 68.409 64.639 63.977 67.292<br />
8,5 112.142 99.377 101.198 101.294 100.005 95.291 94.194 99.078 101.169 101.437 100.120 95.121 94.209 99.014<br />
9,5 146.151 134.487 136.486 136.626 134.845 130.152 128.859 134.362 136.467 136.710 134.990 130.047 128.930 134.350<br />
10,5 162.578 158.309 159.348 159.410 158.368 156.076 155.271 158.538 159.325 159.397 158.458 156.112 155.352 158.559<br />
11,5 168.463 167.793 168.002 168.006 167.803 167.356 167.162 167.859 167.990 167.989 167.823 167.372 167.198 167.873<br />
12,5 170.025 169.957 169.989 169.988 169.957 169.891 169.869 169.969 169.987 169.983 169.958 169.894 169.872 169.971<br />
13,5 170.200 170.194 170.197 170.197 170.194 170.187 170.186 170.195 170.197 170.197 170.193 170.187 170.185 170.196<br />
14,5 170.200 170.200 170.200 170.200 170.200 170.200 170.200 170.200 170.200 170.200 170.200 170.200 170.200 170.200<br />
15,5 170.200 170.200 170.200 170.200 170.200 170.200 170.200 170.200 170.200 170.200 170.200 170.200 170.200 170.200<br />
16,5 170.200 170.200 170.200 170.200 170.200 170.200 170.200 170.200 170.200 170.200 170.200 170.200 170.200 170.200<br />
17,5 170.200 170.200 170.200 170.200 170.200 170.200 170.200 170.200 170.200 170.200 170.200 170.200 170.200 170.200<br />
18,5 170.200 170.200 170.200 170.200 170.200 170.200 170.200 170.200 170.200 170.200 170.200 170.200 170.200 170.200<br />
19,5 170.200 170.200 170.200 170.200 170.200 170.200 170.200 170.200 170.200 170.200 170.200 170.200 170.200 170.200<br />
20,5 170.200 170.200 170.200 170.200 170.200 170.200 170.200 170.200 170.200 170.200 170.200 170.200 170.200 170.200<br />
21,5 170.200 170.200 170.200 170.200 170.200 170.200 170.200 170.200 170.200 170.200 170.200 170.200 170.200 170.200<br />
22,5 170.200 170.200 170.200 170.200 170.200 170.200 170.200 170.200 170.200 170.200 170.200 170.200 170.200 170.200<br />
23,5 170.200 170.200 170.200 170.200 170.200 170.200 170.200 170.200 170.200 170.200 170.200 170.200 170.200 170.200<br />
24,5 170.200 170.200 170.200 170.200 170.200 170.200 170.200 170.200 170.200 170.200 170.200 170.200 170.200 170.200<br />
25,5 0 0 0 0 0 0 0 0 0 0 0 0 0 0<br />
26,5 0 0 0 0 0 0 0 0 0 0 0 0 0 0<br />
27,5 0 0 0 0 0 0 0 0 0 0 0 0 0 0<br />
28,5 0 0 0 0 0 0 0 0 0 0 0 0 0 0<br />
29,5 0 0 0 0 0 0 0 0 0 0 0 0 0 0<br />
Descrição:<br />
A curva de potência do parque é semelhante a uma curva de potência de Aerogerador, signific<strong>and</strong>o que qu<strong>and</strong>o uma dada velocidade de vento aparece em frente ao parque com a<br />
mesma velocidade em toda a área do parque (antes da influência do parque), o resultado do parque pode ser encontrada na curva de potência do parque. Outra forma de se dizer<br />
isto: A curva de potência do parque inclui perdas de conjunto, mas NÃO inclui variações do terreno na velocidade do vento pela área do parque.<br />
A medição de uma curva de potência do parque não é tão simples como a medição de uma curva de potência de Aerogerador devido ao fato de que a curva de potência do parque<br />
depende da direção do vento e de que a mesma velocidade do vento normamente não aparecerá para toda a área do parque ao mesmo tempo (apenas em terrenos não complexos<br />
extremamente lisos). A idéia com esta versão de curva de potência do parque não é utilizá-la para validações baseadas em medições. Isto exigiria pelo menos 2 torres de medição<br />
em dois lados do parque, caso contrário apenas poucos setores de direção poderiam ser testados, E terrenos não complexos (normalmente apenas utilizável em alto mar). Outra<br />
versão de curva de potência do parque está disponível no <strong>Wind</strong>PRO.<br />
A curva de potência do parque pode ser utilizada para:<br />
1. Sistemas de previsão, baseados em dados do vento mais brutos (aproximados), a curva de potência do parque seria uma maneira eficiente de fazer a conexão da<br />
velocidade do vento (e direção) para a potência.<br />
2. Construção de curvas de duração, cont<strong>and</strong>o quantas vezes uma determinada potência irá aparecer, a curva de potência do parque pode ser utilizada em conjunto com a<br />
distribuição média do vento para a área do complexo Eólico na altura do cubo. A distribuição média do vento pode ser eventualmente obtida com base nos parâmetros de<br />
Weibull para cada posição do Aerogerador. Estes são encontrados no menu de impressão: > Result to file< no > Park resultResult to file< dados de ><strong>Wind</strong> Speeds Inside <strong>Wind</strong> farm< também estão disponíveis. Estes podem (por exemplo, através do Excel) ser utilizados para extrair as<br />
reduções causadas pela esteira na velocidade do vento medida.
Projeto:<br />
BSO+URA<br />
PARK - Map<br />
Cálculo: BSO IV<br />
<strong>Wind</strong>PRO é desenvolvido pela EMD International A / S, Niels Jernesvej 10, DK-9220 Aalborg Ø, Tel. +45 96 35 44 44, Fax +45 96 35 44 46, E-mail: windpro@emd.dk<br />
<strong>Wind</strong>PRO version 2.8.572 Nov 2012<br />
Impresso/Página<br />
02-12-2012 10:32 / 5<br />
Usuário licenciado:<br />
EMD International A/S<br />
Niels Jernes Vej 10<br />
DK-9220 Aalborg Ø<br />
+45 9635 4444<br />
Maurizio Motta / mm@emd.dk<br />
Calculado:<br />
30-11-2012 14:45/2.8.572<br />
0 2,5 5 7,5 10 km<br />
Mapa: Topographic , Escala de impressão 1:125.000, Centro do mapa UTM WGS84 S Zone: 22 Leste: 614.972 Norte: 6.898.846<br />
Novo Aerogerador Aerogerador existente
Projeto:<br />
BSO+URA<br />
Loss&Uncertainty - Park result<br />
Cálculo: BSO IV<br />
Main data for PARK<br />
PARK calculation 2.8.572: BSO IV<br />
Count 1<br />
Rated power 2,3 MW<br />
Mean wind speed 6,3 m/s at hub height<br />
Sensitivity 1,8 %AEP / %Mean <strong>Wind</strong> Speed<br />
Expected lifetime 20 Years<br />
RESULTS<br />
P50 P84 P90<br />
NET AEP [MWh/y] 6.227 5.332 5.074<br />
Capacity factor [%] 30,9 26,5 25,2<br />
Full load hours [h/y] 2.707 2.318 2.206<br />
Result details<br />
P50 Uncertainty<br />
GROSS AEP *) 7.075 MWh/y 14,3 %<br />
Bias correction 0 MWh/y 0,0 % 0,0 %<br />
Loss correction -848 MWh/y -12,0 % 2,0 %<br />
Wake loss -5,1 %<br />
Other losses -7,3 %<br />
NET AEP 6.227 MWh/y 14,4 %<br />
*) Calculated <strong>Annual</strong> <strong>Energy</strong> <strong>Production</strong> before any bias or loss corrections<br />
Assumptions: Uncertainty <strong>and</strong> percentiles (PXX values) are calculated for the expected lifetime<br />
<strong>Wind</strong>PRO é desenvolvido pela EMD International A / S, Niels Jernesvej 10, DK-9220 Aalborg Ø, tel. +45 96 35 44 44, Fax +45 96 35 44 46, E-mail: windpro@emd.dk<br />
<strong>Wind</strong>PRO version 2.8.576 Dec 2012<br />
Impresso / Página<br />
11-12-2012 15:06 / 1<br />
Usuário licenciado:<br />
EMD International A/S<br />
Niels Jernes Vej 10<br />
DK-9220 Aalborg Ø<br />
+45 9635 4444<br />
Maurizio Motta / mm@emd.dk<br />
Calculado:<br />
11-12-2012 15:06/2.8.576<br />
Scale: 25.000
Projeto:<br />
BSO+URA<br />
Loss&Uncertainty - Assumptions <strong>and</strong> results<br />
Cálculo: BSO IV<br />
ASSUMPTIONS<br />
<strong>Wind</strong>PRO é desenvolvido pela EMD International A / S, Niels Jernesvej 10, DK-9220 Aalborg Ø, tel. +45 96 35 44 44, Fax +45 96 35 44 46, E-mail: windpro@emd.dk<br />
<strong>Wind</strong>PRO version 2.8.576 Dec 2012<br />
Impresso / Página<br />
11-12-2012 15:06 / 2<br />
Usuário licenciado:<br />
EMD International A/S<br />
Niels Jernes Vej 10<br />
DK-9220 Aalborg Ø<br />
+45 9635 4444<br />
Maurizio Motta / mm@emd.dk<br />
Calculado:<br />
11-12-2012 15:06/2.8.576<br />
LOSS<br />
Method *) Loss Loss Std dev**) Comment<br />
[%] [MWh/y] [%]<br />
1. Efeitos esteira<br />
Efeitos esteira, todos Aerogeradores Calculation 5,1 358 20,0<br />
2. Disponibilidade<br />
Disponibilidade da turbina Estimate 3,0 212 50,0<br />
Disponibilidade da rede Estimate 0,5 35 20,0<br />
3. Desempenho da turbina No input<br />
4. Elétrica<br />
Perdas elétricas Estimate 2,0 141 20,0 Calculado pela VILCO<br />
5. Ambiental<br />
Degradação de desempenho não devido à formação de gelo Estimate 1,0 71 50,0<br />
Desligamento devido à formação de gelo, granizo, relâmpago, etc. Estimate 1,0 71 50,0<br />
Alta e baixa temperatura Calculation 0,0 0 0,0<br />
6. Corte No input<br />
7. Outras No input<br />
LOSS, total 12,0 848 2,0<br />
UNCERTAINTY<br />
Method *) Std dev, Std dev, Comment<br />
wind speed AEP<br />
[%] [%]<br />
A. Dados de vento<br />
Medição de vento/Dados de vento Estimate 5,0 8,9<br />
Correção de longo termo Estimate 7,0<br />
Variação de ano para ano Estimate 3,7 6,6<br />
Clima futuro<br />
Outra relacionada ao vento<br />
Estimate 5,0<br />
B. Modelo de vento<br />
Extrapolação vertical Calculation 0,1 0,3<br />
Extrapolação horizontal<br />
Outra relacionada ao modelo de vento<br />
C. Conversão de potência<br />
Calculation 3,8 6,7<br />
Incerteza na curva de potência<br />
Medição de incertezas<br />
Outras incertezas relacionadas à PAE<br />
Calculation 2,0<br />
D. BIAS, total uncertainty 0,0<br />
E. Perdas, total uncertainty 2,0<br />
UNCERTAINTY, total (1y average) 15,8<br />
UNCERTAINTY, total (20y average) 14,4<br />
VARIABILITY<br />
Years Variability Total<br />
(std dev) std dev<br />
[%] [%]<br />
1 6,59 15,8<br />
5 2,95 14,7<br />
10 2,09 14,5<br />
20 1,47 14,4
Projeto:<br />
BSO+URA<br />
Loss&Uncertainty - Assumptions <strong>and</strong> results<br />
Cálculo: BSO IV<br />
RESULTS<br />
AEP versus exceedance level / time horizon<br />
PXX 1 y 5 y 10 y 20 y<br />
[%] [MWh/y] [MWh/y] [MWh/y] [MWh/y]<br />
50 6.227 6.227 6.227 6.227<br />
75 5.563 5.611 5.617 5.620<br />
84 5.248 5.318 5.328 5.332<br />
90 4.965 5.056 5.068 5.074<br />
95 4.607 4.724 4.739 4.747<br />
<strong>Wind</strong>PRO é desenvolvido pela EMD International A / S, Niels Jernesvej 10, DK-9220 Aalborg Ø, tel. +45 96 35 44 44, Fax +45 96 35 44 46, E-mail: windpro@emd.dk<br />
<strong>Wind</strong>PRO version 2.8.576 Dec 2012<br />
Impresso / Página<br />
11-12-2012 15:06 / 3<br />
Usuário licenciado:<br />
EMD International A/S<br />
Niels Jernes Vej 10<br />
DK-9220 Aalborg Ø<br />
+45 9635 4444<br />
Maurizio Motta / mm@emd.dk<br />
Calculado:<br />
11-12-2012 15:06/2.8.576<br />
*) Calculation means that a calculation method available in the <strong>Wind</strong>PRO software is used. This still typically involve a user judgement <strong>and</strong> user data where the quality of those decides the accuracy. If<br />
calculation method is used, the values will often be different from turbine to turbine, here the average is shown, but at page "WTG results" the individual turbine results are shown.<br />
**) For totals the std dev refers to the full AEP, otherwise std dev refers to the bias or loss component which is a fraction of the total AEP.
Projeto:<br />
BSO+URA<br />
Loss&Uncertainty - WTG results<br />
Cálculo: BSO IV<br />
Main data for PARK<br />
PARK calculation 2.8.572: BSO IV<br />
Count 1<br />
Rated power 2,3 MW<br />
Mean wind speed 6,3 m/s at hub height<br />
Sensitivity 1,8 %AEP / %Mean <strong>Wind</strong> Speed<br />
Expected lifetime 20 Years<br />
<strong>Wind</strong>PRO é desenvolvido pela EMD International A / S, Niels Jernesvej 10, DK-9220 Aalborg Ø, tel. +45 96 35 44 44, Fax +45 96 35 44 46, E-mail: windpro@emd.dk<br />
<strong>Wind</strong>PRO version 2.8.576 Dec 2012<br />
Impresso / Página<br />
11-12-2012 15:06 / 4<br />
Usuário licenciado:<br />
EMD International A/S<br />
Niels Jernes Vej 10<br />
DK-9220 Aalborg Ø<br />
+45 9635 4444<br />
Maurizio Motta / mm@emd.dk<br />
Calculado:<br />
11-12-2012 15:06/2.8.576<br />
Scale: 25.000<br />
Expected AEP per WTG including bias, loss <strong>and</strong> uncertainty evaluation<br />
20 years averaging<br />
Description Calculated GROSS*) Bias Loss Unc. P50 P84 P90<br />
[MWh/y] [%] [%] [%] [MWh/y] [MWh/y] [MWh/y]<br />
1 Siemens SWT-2.3-113 2300 113.0 !O! hub: 99,5 m (TOT: 156,0 m) (1120) 7.074,7 0,0 12,0 14,4 6.226,9 5.332,2 5.073,9<br />
PARK 7.074,7 0,0 12,0 14,4 6.226,9 5.332,2 5.073,9
8.4 Anemometers – Calibration Certificates