Generating Model Based Subgroup Analysis Using ... - PharmaSUG
Generating Model Based Subgroup Analysis Using ... - PharmaSUG
Generating Model Based Subgroup Analysis Using ... - PharmaSUG

Create successful ePaper yourself
Turn your PDF publications into a flip-book with our unique Google optimized e-Paper software.
Paper PO08<br />
<strong>Generating</strong> <strong>Model</strong> <strong>Based</strong> <strong>Subgroup</strong> <strong>Analysis</strong> <strong>Using</strong> SAS ® Procedures<br />
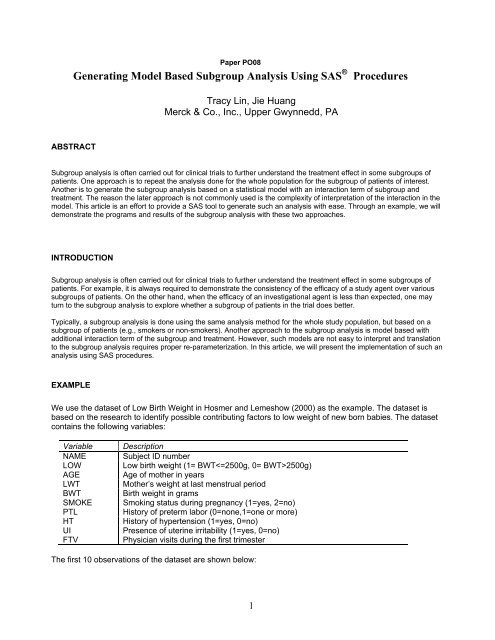
ABSTRACT<br />
Tracy Lin, Jie Huang<br />
Merck & Co., Inc., Upper Gwynnedd, PA<br />
<strong>Subgroup</strong> analysis is often carried out for clinical trials to further understand the treatment effect in some subgroups of<br />
patients. One approach is to repeat the analysis done for the whole population for the subgroup of patients of interest.<br />
Another is to generate the subgroup analysis based on a statistical model with an interaction term of subgroup and<br />
treatment. The reason the later approach is not commonly used is the complexity of interpretation of the interaction in the<br />
model. This article is an effort to provide a SAS tool to generate such an analysis with ease. Through an example, we will<br />
demonstrate the programs and results of the subgroup analysis with these two approaches.<br />
INTRODUCTION<br />
<strong>Subgroup</strong> analysis is often carried out for clinical trials to further understand the treatment effect in some subgroups of<br />
patients. For example, it is always required to demonstrate the consistency of the efficacy of a study agent over various<br />
subgroups of patients. On the other hand, when the efficacy of an investigational agent is less than expected, one may<br />
turn to the subgroup analysis to explore whether a subgroup of patients in the trial does better.<br />
Typically, a subgroup analysis is done using the same analysis method for the whole study population, but based on a<br />
subgroup of patients (e.g., smokers or non-smokers). Another approach to the subgroup analysis is model based with<br />
additional interaction term of the subgroup and treatment. However, such models are not easy to interpret and translation<br />
to the subgroup analysis requires proper re-parameterization. In this article, we will present the implementation of such an<br />
analysis using SAS procedures.<br />
EXAMPLE<br />
We use the dataset of Low Birth Weight in Hosmer and Lemeshow (2000) as the example. The dataset is<br />
based on the research to identify possible contributing factors to low weight of new born babies. The dataset<br />
contains the following variables:<br />
Variable Description<br />
NAME Subject ID number<br />
LOW Low birth weight (1= BWT2500g)<br />
AGE Age of mother in years<br />
LWT Mother’s weight at last menstrual period<br />
BWT Birth weight in grams<br />
SMOKE Smoking status during pregnancy (1=yes, 2=no)<br />
PTL History of preterm labor (0=none,1=one or more)<br />
HT History of hypertension (1=yes, 0=no)<br />
UI Presence of uterine irritability (1=yes, 0=no)<br />
FTV Physician visits during the first trimester<br />
The first 10 observations of the dataset are shown below:<br />
1
name low age lwt race smoke ptl ht ui ftv bwt phy_vis<br />
4 1 28 120 3 1 1 0 1 0 709 0<br />
10 1 29 130 1 0 0 0 1 2 1021 1<br />
11 1 34 187 2 1 0 1 0 0 1135 0<br />
13 1 25 105 3 0 1 1 0 0 1330 0<br />
15 1 25 85 3 0 0 0 1 0 1474 0<br />
16 1 27 150 3 0 0 0 0 0 1588 0<br />
17 1 23 97 3 0 0 0 1 1 1588 1<br />
18 1 24 128 2 0 1 0 0 1 1701 1<br />
19 1 24 132 3 0 0 1 0 0 1729 0<br />
20 1 21 165 1 1 0 1 0 1 1790 1<br />
Consider that the main question of interest is whether smoking during pregnancy is associated with babies with low birth<br />
weight. For the demonstration purposes, we only consider univariate analysis, and the subgroups of interest are history of<br />
hypertension and physician visits during the first trimester. In the following analysis, we calculate the odds ratio as the<br />
measure of difference between smoker mothers and non-smoker mothers using logistic regression. The odds ratio and its<br />
95% confidence intervals are generated using SAS PROC LOGISTIC.<br />
ANALYSIS BASED ON SUBGROUPS OF SUBJECTS<br />
To perform the subgroup analysis using subgroups of patients, we need analyze the data separately for each subgroup of the<br />
subjects. The following codes were used to carry out the subgroup analysis for history of hypertension and any physician visit<br />
during first trimester. We define a new variable phy_vis as 1= at least one physician visits during the first trimester, 0= none.<br />
proc sort data=lowbwt; by ht;<br />
proc logistic data=lowbwt;<br />
class smoke(param=ref ref='0');<br />
model low(event='1')=smoke ;<br />
by ht;<br />
title "subgroup analysis by hypertension (subset)";<br />
run;<br />
proc sort data=lowbwt; by phy_vis;<br />
proc logistic data=lowbwt;<br />
class smoke(param=ref ref='0');<br />
model low(event='1')=smoke ;<br />
by phy_vis;<br />
title "subgroup analysis by phyisician visits (subset)";<br />
run;<br />
MODEL BASED SUBGROUP ANALYSIS<br />
To implement a subgroup analysis through the statistical model, we first fit the data with the logistic regression model with<br />
the variable for the treatment difference (e.g., smoke) and the variable for the subgroup of interest (e.g., ht) and the<br />
interaction term of these two variables. Then a contrast statement is constructed for the analysis of each subgroup.<br />
Below is the SAS programs to generate the subgroup analysis for history of hypertension and physician visits during the<br />
first trimester.<br />
proc logistic data=lowbwt;<br />
class smoke(param=ref ref='0') ht(param=ref ref='0');<br />
model low(event='1')=smoke ht smoke*ht;<br />
contrast 'ht=No' smoke 1 smoke*ht 0 /estimate=exp;<br />
contrast 'ht=Yes' smoke 1 smoke*ht 1 /estimate=exp;<br />
title "model based hypertension subgroup analysis";<br />
run;<br />
2
proc logistic data=lowbwt;<br />
class smoke(param=ref ref='0') phy_vis(param=ref ref='0');<br />
model low(event='1')=smoke phy_vis smoke*phy_vis;<br />
contrast 'phy=No' smoke 1 smoke*phy_vis 0/estimate=exp;<br />
contrast 'phy=Yes' smoke 1 smoke*phy_vis 1/estimate=exp;<br />
title "model based physician visit subgroup analysis";<br />
run;<br />
Table 1 presents the results of the analysis. Though the results from the programs in the Section III were not presented,<br />
both approaches arrived the same results because they represent the same statistical models. In the case of univariate<br />
analysis above, the likelihood function of the statistical model with the interaction term can be easily shown to be<br />
partitioned into two distinct parts with each representing a likelihood function for each subgroup of interest.<br />
Table 1: Results of subgroup analysis<br />
Smokers Non-smokers Odds ratio 95% CI<br />
All 30/74 (41%) 29/115 (25%) 2.02 1.08, 3.78<br />
History of<br />
hypertension<br />
Yes 3/5 (60%) 4/7 (57%) 1.13 0.11, 11.60<br />
No 27/69 (39%) 25/108 (23%) 2.13 1.10, 4.12<br />
Physician visits<br />
Yes 10/29 (34%) 13/60 (22%) 1.90 0.71, 5.08<br />
No 20/45 (44%) 16/55 (29%) 1.95 0.85, 4.46<br />
CONCLUSION AND DISCUSSION<br />
This article intends to provide an alternative approach to the subgroup analysis. <strong>Using</strong> the same statistical model, both<br />
approaches came up with the same results for the subgroup analysis. Though both approaches can be implemented with<br />
relative ease, the analysis using subset of subjects requires additional step (e.g., a sort procedure or a dataset for a<br />
subgroup) prior to calling the PROC LOGISTIC. On the other hand, the model based approach fit the model with all<br />
subjects included and no additional data manipulation is necessary. Because of only one model fitting is needed in the<br />
model based approach, it may also have the advantage of less resource requirement in computer time. In addition, the<br />
use of contrast statements make the output of statistics of all subgroup of interest together and therefore, to be easily<br />
output to a dataset and be manipulated for table generation.<br />
Statistically, though the subgroup analysis has introduced many controversy issues such as type I error control and<br />
potential selection bias, the analysis is routinely done for various purposes mainly hypothesis generating. The example<br />
shown is only for the demonstration of the approach. The approach can be easily extended to a different statistical model<br />
or SAS procedure, more covariates, or more subgroups (e.g., a combination of hypertension and physician visits).<br />
However, in those cases, conformity of the results from both approaches is not guaranteed due to either ancillary<br />
parameter or difference in the statistical models, which is out of the scope of this article.<br />
<strong>Using</strong> model based method with contrasts provides an alternative mean of performing subgroup analysis, which offers<br />
some advantages in the ease of SAS programming and potentials for more complex statistical modeling approaches for<br />
subgroup analysis.<br />
REFERENCES<br />
1. Hosmer and Lemeshow (2000), Applied Logistic Regression, 2 nd Edition, New York: John Wiley & Sons<br />
3
ACKNOWLEDGEMENT<br />
The Authors would like to thank Hong Qi and Richard Lowry for their strong encouragement and support in publishing this<br />
paper.<br />
CONTACT INFORMATION<br />
Comments and questions are greatly appreciated. Contact authors at:<br />
Tracy Lin<br />
Merck Research Laboratories<br />
P.O. Box 1000<br />
Upper Gwynedd, PA 19454-2505<br />
(267)305-8202 (phone)<br />
E-mail: Tracy_lin@Merck.com<br />
Jie Huang<br />
Merck Research Laboratories<br />
P.O. Box 1000<br />
Upper Gwynedd, PA 19454-2505<br />
(267)305-5541 (phone)<br />
E-mail: Jie_Huang4@Merck.com<br />
4