Martis Valley Groundwater Management Plan - Placer County Water ...
Martis Valley Groundwater Management Plan - Placer County Water ...
Martis Valley Groundwater Management Plan - Placer County Water ...

Create successful ePaper yourself
Turn your PDF publications into a flip-book with our unique Google optimized e-Paper software.
<strong>Martis</strong> <strong>Valley</strong> <strong>Groundwater</strong> <strong>Management</strong> <strong>Plan</strong><br />
Prepared for<br />
Truckee Donner Public Utilities District, Truckee, California<br />
<strong>Placer</strong> <strong>County</strong> <strong>Water</strong> Agency, Auburn, California<br />
Northstar Community Services District, Northstar, California<br />
January 10, 2013<br />
140691<br />
This is a draft and is not intended to be a final representation<br />
of the work done or recommendations made by Brown and Caldwell.<br />
It should not be relied upon; consult the final report
MARTIS VALLEY GROUNDWATER MANAGEMENT PLAN<br />
NEVADA AND PLACER COUNTIES, CALIFORNIA<br />
10540 White Rock Road, Suite 180<br />
Rancho Cordova, California 95670<br />
SIGNATURE PAGE<br />
Signatures of principal personnel responsible for the development of the <strong>Martis</strong> <strong>Valley</strong> <strong>Groundwater</strong><br />
<strong>Management</strong> <strong>Plan</strong> are exhibited below:<br />
______________________________<br />
Tina M. Bauer, P.G. #6893, CHG #962<br />
Brown and Caldwell, Project Manager<br />
______________________________<br />
David Shaw, P.G. #8210<br />
Balance Hydrologics, Inc., Project Geologist<br />
______________________________<br />
Paul Selsky, P.E. #43544<br />
Brown and Caldwell, Quality Control Manager
This <strong>Groundwater</strong> <strong>Management</strong> <strong>Plan</strong> (GMP) was prepared by Brown and Caldwell under contract to the<br />
<strong>Placer</strong> <strong>County</strong> <strong>Water</strong> Agency, Truckee Donner Public Utility District and Northstar Community Services<br />
District.<br />
Staff involved in the preparation of the GMP are listed below.<br />
Brown and Caldwell<br />
Tina M. Bauer, PG, CHg, Project Manager<br />
John Ayres, PG,CHg, Hydrogeologist and Public Outreach<br />
Brent Cain, Hydrogeologist and Principal <strong>Groundwater</strong> Modeler<br />
Paul Selsky, PE, Quality Assurance/Quality Control<br />
Tina Crawford, GIS Specialist<br />
Christy Probst, Graphics Specialist<br />
Dawn Schock, Production Coordinator<br />
Balance Hydrologics (Geology)<br />
David Shaw, PG, Geologist<br />
Mark Woyshner, Principal Hydrologist, Quality Assurance/Quality Control<br />
Barry Hecht, CEG, CHg, Principal-in-Charge<br />
Colleen Haraden, GIS Specialist<br />
10540 White Rock Road, Suite 180<br />
Rancho Cordova, California 95670
Table of Contents<br />
List of Figures ...................................................................................................................................................... v<br />
List of Tables ...................................................................................................................................................... vi<br />
List of Abbreviations ......................................................................................................................................... vii<br />
1. Introduction ............................................................................................................................................... 1-1<br />
1.1 Purpose of the <strong>Groundwater</strong> <strong>Management</strong> <strong>Plan</strong> ......................................................................... 1-1<br />
1.2 <strong>Groundwater</strong> <strong>Management</strong> <strong>Plan</strong> Authority and Administration .................................................. 1-1<br />
1.3 <strong>Groundwater</strong> <strong>Management</strong> <strong>Plan</strong> Development Process ............................................................. 1-3<br />
1.4 <strong>Groundwater</strong> <strong>Management</strong> Goal ................................................................................................... 1-5<br />
1.5 Basin <strong>Management</strong> Objectives ..................................................................................................... 1-5<br />
1.6 <strong>Plan</strong> Components ........................................................................................................................... 1-6<br />
1.7 Area Covered by the GMP .............................................................................................................. 1-8<br />
1.8 Public Outreach and Education ..................................................................................................... 1-8<br />
1.9 <strong>Groundwater</strong> Model ....................................................................................................................... 1-8<br />
1.10 Document Organization ................................................................................................................. 1-9<br />
2. Physical Setting ........................................................................................................................................ 2-1<br />
2.1 Topography ..................................................................................................................................... 2-1<br />
2.2 Climate ............................................................................................................................................ 2-1<br />
2.2.1 Climate Variability ............................................................................................................ 2-4<br />
2.2.2 Climate Change ................................................................................................................ 2-6<br />
2.3 Surface <strong>Water</strong> Hydrology ............................................................................................................... 2-6<br />
2.3.1 Truckee River ................................................................................................................... 2-6<br />
2.3.2 <strong>Martis</strong> Creek ................................................................................................................... 2-10<br />
2.3.3 Donner and Cold Creeks ................................................................................................ 2-10<br />
2.3.3.1 Cold Creek .............................................................................................................. 2-10<br />
2.3.4 Trout Creek ..................................................................................................................... 2-10<br />
2.3.5 Prosser Creek ................................................................................................................. 2-11<br />
2.3.6 Truckee Corridor ............................................................................................................. 2-11<br />
2.3.7 Other impoundments ..................................................................................................... 2-11<br />
2.4 Geology ......................................................................................................................................... 2-11<br />
2.4.1 Geologic Database Development ................................................................................. 2-11<br />
2.4.2 Stratigraphy .................................................................................................................... 2-18<br />
2.4.3 Structure ......................................................................................................................... 2-18<br />
2.5 <strong>Groundwater</strong> Occurrence and Movement .................................................................................. 2-20<br />
2.5.1 <strong>Water</strong>-bearing Units and Properties .............................................................................. 2-20<br />
2.5.2 Surface-groundwater interaction .................................................................................. 2-22<br />
2.5.3 <strong>Groundwater</strong> levels and Land Subsidence ................................................................... 2-22<br />
2.5.3.1 Land Subsidence ................................................................................................... 2-23<br />
DRAFT for review purposes only. Use of contents on this sheet is subject to the limitations specified at the end of this document.<br />
P:\40000\140691 - PCWA <strong>Martis</strong> <strong>Valley</strong> GWP\GMP\Report\3rd Draft\<strong>Martis</strong> <strong>Valley</strong> GMP Draft 01-09-13.docx<br />
ii
<strong>Martis</strong> <strong>Valley</strong> <strong>Groundwater</strong> <strong>Management</strong> <strong>Plan</strong> Table of Contents<br />
2.6 <strong>Groundwater</strong> Well Infrastructure ................................................................................................. 2-23<br />
2.7 <strong>Groundwater</strong> Quality .................................................................................................................... 2-26<br />
2.8 Land Use ....................................................................................................................................... 2-27<br />
2.9 <strong>Groundwater</strong> Recharge ................................................................................................................ 2-27<br />
2.10 <strong>Water</strong> Use ..................................................................................................................................... 2-28<br />
3. <strong>Plan</strong> Implementation ................................................................................................................................ 3-1<br />
3.1 Implementation Actions that Support BMO #1 - Manage <strong>Groundwater</strong> to Maintain<br />
Established and <strong>Plan</strong>ned Uses...................................................................................................... 3-1<br />
3.1.1 Develop and implement a summary report every five years ......................................... 3-1<br />
3.1.2 Compile an annual summary of groundwater monitoring data .................................... 3-2<br />
3.1.3 Partner agencies to meet annually to discuss GMP implementation .......................... 3-2<br />
3.1.4 Support TROA provisions associated with well construction, repair, modification,<br />
and destruction ................................................................................................................ 3-2<br />
3.1.5 Evaluate and consider taking a position on relevant water resources-related<br />
policies, programs, and projects under consideration by local, State and<br />
Federal agencies .............................................................................................................. 3-2<br />
3.1.6 Pursue opportunities for improved groundwater basin monitoring and reporting<br />
with local, State, and Federal agencies .......................................................................... 3-2<br />
3.1.7 Evaluate the need for programs to facilitate saline intrusion control, mitigate<br />
the migration of contaminated groundwater, facilitate conjunctive use, and to<br />
mitigate overdraft ............................................................................................................ 3-2<br />
3.1.8 Consider development of contamination cleanup, recharge, storage,<br />
conservation and water recycling projects ..................................................................... 3-3<br />
3.1.9 Pursue funding sources for implementation of plan policies, programs,<br />
reporting and projects ..................................................................................................... 3-3<br />
3.1.10 Participate in the evaluation of relevant local projects to maintain groundwater<br />
quantity and quality ......................................................................................................... 3-4<br />
3.1.11 Summary of BMO #1 Actions .......................................................................................... 3-4<br />
3.2 Implementation Actions that Support BMO #2 - Manage <strong>Groundwater</strong> within the<br />
Provisions of TROA ......................................................................................................................... 3-4<br />
3.2.1 Continue coordination and collaboration with TROA agencies on groundwater<br />
management issues and source well development ...................................................... 3-5<br />
3.2.2 Summary of BMO #2 Actions .......................................................................................... 3-5<br />
3.3 Implementation Actions that Support BMO #3 - Collaborate and Cooperate with<br />
<strong>Groundwater</strong> Users and Stakeholders in the <strong>Martis</strong> <strong>Valley</strong> <strong>Groundwater</strong> Basin ....................... 3-5<br />
3.3.1 Formalize and institute a Stakeholder Working Group to meet at least annually<br />
or as needed on GMP implementation activities and updates ..................................... 3-5<br />
3.3.2 Collaborate with the LRWQCB to limit the migration of contaminated groundwater<br />
and in development of large scale contamination clean up programs ........................ 3-6<br />
3.3.3 Work cooperatively with local stakeholders and local, State and Federal agencies<br />
on groundwater management activities, projects, and studies .................................... 3-6<br />
3.3.4 Identify opportunities for public involvement during GMP implementation ................. 3-6<br />
3.3.5 Summary of BMO #3 Actions .......................................................................................... 3-6<br />
3.4 Implementation Actions that Support BMO #4 - Protect <strong>Groundwater</strong> Quantity and Quality ... 3-7<br />
DRAFT for review purposes only. Use of contents on this sheet is subject to the limitations specified at the end of this document.<br />
<strong>Martis</strong> <strong>Valley</strong> GMP Draft 01-09-13.docx<br />
iii
<strong>Martis</strong> <strong>Valley</strong> <strong>Groundwater</strong> <strong>Management</strong> <strong>Plan</strong> Table of Contents<br />
3.4.1 Establish and maintain a California Statewide <strong>Groundwater</strong> Elevation<br />
Monitoring compliant monitoring program ..................................................................... 3-7<br />
3.4.2 Continue and Encourage <strong>Water</strong> Conservation Activities and Public Education ........... 3-9<br />
3.4.3 Work with local stakeholders and DWR to identify areas that may need<br />
additional groundwater level and groundwater quality monitoring based on<br />
identified data gaps or negative performance trends ................................................... 3-9<br />
3.4.4 Coordinate with other agencies, including DWR and the USGS to identify<br />
opportunities for land subsidence monitoring ............................................................... 3-9<br />
3.4.5 Evaluate the need for, and advocate for, as necessary, a wellhead<br />
protection, groundwater recharge area protection, and other programs as<br />
necessary in MVGB ........................................................................................................ 3-10<br />
3.4.6 Map and share groundwater recharge zones .............................................................. 3-10<br />
3.4.7 Provide relevant information to land use agencies regarding groundwater<br />
availability ....................................................................................................................... 3-10<br />
3.4.8 Summary of BMO #4 Actions ........................................................................................ 3-10<br />
3.5 BMO #5 - Pursue and use the best available science and technology to inform the<br />
decision making process. ............................................................................................................ 3-11<br />
3.5.1 Work with State and Federal agencies to attempt to secure funding for<br />
expansion of the partner agencies’ monitoring grid .................................................... 3-11<br />
3.5.2 Maintain relationship with DWR for groundwater monitoring and database<br />
management activities .................................................................................................. 3-12<br />
3.5.3 Identify opportunities for collecting water quality monitoring data ............................ 3-12<br />
3.5.4 Use and consider updating the hydrologic model to improve understanding of<br />
groundwater in the MVGB ............................................................................................. 3-13<br />
3.5.5 Seek new tools, technology, and information that may improve the<br />
understanding of the water resources in the MVGB and watershed.......................... 3-13<br />
3.5.6 Summary of BMO #5 Actions ........................................................................................ 3-13<br />
3.6 Implementation Actions that Support BMO #6 - Consider the environment and<br />
participate in the stewardship of groundwater resources ......................................................... 3-14<br />
3.6.1 Consider local, State, or Federal riparian, surface water, or surface watergroundwater<br />
interaction investigations, studies or programs in the MVGB ............... 3-14<br />
3.6.2 Continue support and collaboration with local groups that identify, coordinate,<br />
or implement projects that support the overall sustainability of the MVGB .............. 3-14<br />
3.6.3 Summary of BMO #6 Actions ........................................................................................ 3-14<br />
4. References ................................................................................................................................................ 4-1<br />
Appendix A: Resolutions of Intent to Adopt a <strong>Groundwater</strong> <strong>Management</strong> <strong>Plan</strong> ............................................. A<br />
Appendix B: Resolutions Adopting the <strong>Groundwater</strong> <strong>Management</strong> <strong>Plan</strong> ....................................................... B<br />
Appendix C: Public Outreach <strong>Plan</strong> ..................................................................................................................... C<br />
Appendix D: CASGEM Monitoring <strong>Plan</strong> ............................................................................................................. D<br />
Appendix E: <strong>Groundwater</strong> Quality Reports ........................................................................................................E<br />
Appendix F: DRI Technical Note ......................................................................................................................... F<br />
DRAFT for review purposes only. Use of contents on this sheet is subject to the limitations specified at the end of this document.<br />
<strong>Martis</strong> <strong>Valley</strong> GMP Draft 01-09-13.docx<br />
iv
<strong>Martis</strong> <strong>Valley</strong> <strong>Groundwater</strong> <strong>Management</strong> <strong>Plan</strong> Table of Contents<br />
List of Figures<br />
Figure 1-1. <strong>Groundwater</strong> <strong>Management</strong> <strong>Plan</strong> Area ....................................................................................... 1-2<br />
Figure 1-2. GMP Development Process ........................................................................................................ 1-4<br />
Figure 2-1. <strong>Groundwater</strong> Basin Location and Physiography ....................................................................... 2-2<br />
Figure 2-2. Mean Annual Precipitation ......................................................................................................... 2-3<br />
Figure 2-3. Mean Monthly Precipitation, Truckee Ranger Station, from 1904 to 1919 and<br />
1935 to 2009 ........................................................................................................................................... 2-4<br />
Figure 2-4. Percent Deviation from Mean Annual Precipitation at the Truckee Ranger Station<br />
and Total Annual Streamflow at Farad .................................................................................................... 2-5<br />
Figure 2-5. Hydrography and Long-Term Monitoring Stations .................................................................... 2-7<br />
Figure 2-6. Mean Monthly Streamflows in the Middle Truckee River <strong>Water</strong>shed ..................................... 2-9<br />
Figure 2-7. Stratigraphic Column showing Primary Hydrostratigraphic Units .......................................... 2-12<br />
Figure 2-8. Well Locations ........................................................................................................................... 2-13<br />
Figure 2-9. Geologic Map and Cross Section Locations ............................................................................ 2-14<br />
Figure 2-10. Cross-section A-A’ ................................................................................................................... 2-15<br />
Figure 2-11. Cross-section B-B’ .................................................................................................................... 2-16<br />
Figure 2-12. Cross-section C-C’ ................................................................................................................... 2-17<br />
Figure 2-13. Locations of Springs and Mapped Faults (active and inferred) ........................................... 2-19<br />
Figure 2-14a. Lousetown Volcanic Outcrop ............................................................................................... 2-21<br />
Figure 2-14b. Prosser Formation Outcrop Underlying Glacial Outwash ................................................... 2-21<br />
Figure 2-15. <strong>Water</strong> Levels in DWR Long-term <strong>Groundwater</strong> Monitoring Wells ........................................ 2-23<br />
Figure 2-16. Department of <strong>Water</strong> Resources Monitoring Wells and Select Hydrographs ..................... 2-24<br />
Figure 2-17. Depth Distribution of Wells in the <strong>Martis</strong> <strong>Valley</strong> <strong>Groundwater</strong> Basin .................................. 2-26<br />
Figure 2-18. Average Annual <strong>Groundwater</strong> Recharge 1988 to 2011 ...................................................... 2-29<br />
Figure 2-19. Annual <strong>Groundwater</strong> Recharge Dry Year 1988 .................................................................... 2-30<br />
Figure 2-20. Annual <strong>Groundwater</strong> Recharge Wet Year 1995 ................................................................... 2-31<br />
Figure 3-1. CASGEM and DWR <strong>Groundwater</strong> Monitoring Wells .................................................................. 3-8<br />
DRAFT for review purposes only. Use of contents on this sheet is subject to the limitations specified at the end of this document.<br />
<strong>Martis</strong> <strong>Valley</strong> GMP Draft 01-09-13.docx<br />
v
<strong>Martis</strong> <strong>Valley</strong> <strong>Groundwater</strong> <strong>Management</strong> <strong>Plan</strong> Table of Contents<br />
List of Tables<br />
Table 1-2. Required Components and Associated Report Section ............................................................. 1-6<br />
Table 1-3. Voluntary Components and Associated Report Section ............................................................ 1-7<br />
Table 1-4. Recommended Components and Associated Report Section .................................................. 1-7<br />
Table 2-1. Average Monthly Streamflow on the Truckee River and Select Tributaries ............................ 2-8<br />
Table 2-2. Estimated Yield of Public Agency Production Wellsa ................................................................ 2-25<br />
Table 2-3. Summary of Average Annual <strong>Groundwater</strong> Recharge Estimates for the MVGB ................... 2-27<br />
Table 2-4. Estimated Current <strong>Groundwater</strong> Production ............................................................................ 2-28<br />
Table 3-1. Summary BMO#1 Supporting Implementation Actions ............................................................. 3-4<br />
Table 3-2. Summary BMO#2 Supporting Implementation Actions ............................................................. 3-5<br />
Table 3-3. Summary BMO#3 Supporting Implementation Actions ............................................................. 3-6<br />
Table 3-4. Summary BMO#4 Supporting Implementation Actions ........................................................... 3-10<br />
Table 3-5. Summary BMO#5 Supporting Implementation Actions ........................................................... 3-13<br />
Table 3-6. Summary BMO#6 Supporting Implementation Actions ........................................................... 3-14<br />
DRAFT for review purposes only. Use of contents on this sheet is subject to the limitations specified at the end of this document.<br />
<strong>Martis</strong> <strong>Valley</strong> GMP Draft 01-09-13.docx<br />
vi
<strong>Martis</strong> <strong>Valley</strong> <strong>Groundwater</strong> <strong>Management</strong> <strong>Plan</strong> Table of Contents<br />
List of Abbreviations<br />
AB 3030 Assembly Bill 3030<br />
ac-ft/yr acre-feet per year<br />
BMOs Basin <strong>Management</strong> Objectives<br />
CASGEM California<br />
cfs cubic feet per second<br />
CWC California <strong>Water</strong> Code<br />
DPH Department of Public Health<br />
DRI Desert Research Institute<br />
DWR Department of <strong>Water</strong> Resources<br />
DWSAP Drinking <strong>Water</strong> Source Assessment<br />
Program<br />
GAMA <strong>Groundwater</strong> Ambient Monitoring and<br />
Assessment<br />
GCM general circulation model<br />
GMP <strong>Groundwater</strong> <strong>Management</strong> <strong>Plan</strong><br />
gpm gallons per minute<br />
GSFLOW Ground-water and Surface-water Flow<br />
Model<br />
IRWMP Integrated Regional <strong>Water</strong> <strong>Management</strong><br />
<strong>Plan</strong><br />
LGA Local <strong>Groundwater</strong> Assistance<br />
LLNL Lawrence Livermore National Laboratory<br />
LRWQCB Lahontan Regional <strong>Water</strong> Quality Control<br />
Board<br />
LUST leaking underground storage tank<br />
MCL Maximum Contaminant Level<br />
mgd million gallons per day<br />
MODFLOW Modular Three-Dimensional Finite-<br />
Difference <strong>Groundwater</strong> Flow Model<br />
msl mean sea level<br />
MVGB <strong>Martis</strong> <strong>Valley</strong> <strong>Groundwater</strong> Basin<br />
NCSD Northstar Community Services District<br />
NOAA National Oceanic and Atmospheric<br />
Association<br />
PCWA <strong>Placer</strong> <strong>County</strong> <strong>Water</strong> Agency<br />
PRMS Precipitation Runoff Modeling System<br />
PUC Public Utilities Commission<br />
SB Senate Bill<br />
sq mi square miles<br />
SWG Stakeholder Working Group<br />
SWRCB State <strong>Water</strong> Resources Control Board<br />
TDPUD Truckee Donner Public Utility District<br />
TDS Total Dissolved Solids<br />
TROA Truckee River Operating Agreement<br />
T-TSA Tahoe-Truckee Sanitation Agency<br />
USACE United States Army Corps of Engineers<br />
USFS United State Forest Service<br />
USGS United States Geologic Survey<br />
UZF Unsaturated Zone Flow<br />
DRAFT for review purposes only. Use of contents on this sheet is subject to the limitations specified at the end of this document.<br />
<strong>Martis</strong> <strong>Valley</strong> GMP Draft 01-09-13.docx<br />
vii
Section 1<br />
Introduction<br />
In 1992, the State Legislature enacted the California <strong>Groundwater</strong> <strong>Management</strong> Act through Assembly<br />
Bill 3030 (AB 3030) to encourage local public agencies to adopt plans to manage groundwater<br />
resources within their jurisdictions. Provisions were created in the California <strong>Water</strong> Code (CWC) Sections<br />
10750 et.seq. to manage the safe production, quality, and proper storage of groundwater and AB 3030<br />
codified voluntary components of a <strong>Groundwater</strong> <strong>Management</strong> <strong>Plan</strong> (GMP). In 2002, Senate Bill 1938<br />
(SB 1938) was signed into law which amended the CWC with required components of a GMP for any<br />
public agency seeking State funds administered through the California Department of <strong>Water</strong> Resources<br />
(DWR) for groundwater projects. In 2003, DWR published Bulletin 118 – Update 2003, California’s<br />
<strong>Groundwater</strong> which includes seven recommended components of a GMP.<br />
This GMP includes the following components: the partner agencies’ authority, physical setting including<br />
groundwater conditions, management goals and Basin <strong>Management</strong> Objectives (BMOs), and GMP<br />
implementation activities.<br />
1.1 Purpose of the <strong>Groundwater</strong> <strong>Management</strong> <strong>Plan</strong><br />
The Truckee Donner Public Utility District (TDPUD), Northstar Community Services District (NCSD), and<br />
<strong>Placer</strong> <strong>County</strong> <strong>Water</strong> Agency (PCWA) have voluntarily partnered to develop the <strong>Martis</strong> <strong>Valley</strong> GMP, a<br />
collaborative planning tool that assists the partner agencies with efforts to ensure long term quality and<br />
availability of shared groundwater resources in the <strong>Martis</strong> <strong>Valley</strong> <strong>Groundwater</strong> Basin (MVGB). This GMP is<br />
a “living document” that includes an overall goal, BMOs, and implementation actions that will be<br />
periodically updated to reflect changes in groundwater management and progress in meeting its goal<br />
and objectives.<br />
The purpose of the <strong>Martis</strong> <strong>Valley</strong> GMP is to improve the understanding and management of the<br />
groundwater resource in <strong>Martis</strong> <strong>Valley</strong>, while providing a framework for the partner agencies to align<br />
policy and implement effective and sustainable groundwater management programs.<br />
This GMP is not:<br />
mandatory,<br />
regulatory,<br />
an enforcement effort, or<br />
land use or zoning ordinances.<br />
Older groundwater management plans by TDPUD (1995) and PCWA (1998) are herein updated by this<br />
GMP which has been designed to meet the requirements set by SB 1938, addresses the voluntary and<br />
recommended components included in AB 3030, as well as address recommendations outlined in<br />
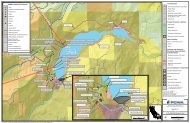
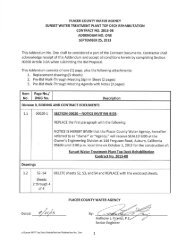
Bulletin 118-2003. The area covered by the <strong>Martis</strong> <strong>Valley</strong> GMP, as shown in Figure 1-1, includes each<br />
partner agencies’ jurisdictional boundaries within Nevada and <strong>Placer</strong> Counties.<br />
1.2 <strong>Groundwater</strong> <strong>Management</strong> <strong>Plan</strong> Authority and Administration<br />
Each partner agency is an authorized groundwater management agency within the meaning of CWC §<br />
10753 (a). In April of 2011, each partner agency adopted respective resolutions of intent to develop a<br />
GMP; the resolutions are included as Appendix A.<br />
DRAFT for review purposes only. Use of contents on this sheet is subject to the limitations specified at the end of this document.<br />
P:\40000\140691 - PCWA <strong>Martis</strong> <strong>Valley</strong> GWP\GMP\Report\3rd Draft\<strong>Martis</strong> <strong>Valley</strong> GMP Draft 01-09-13.docx<br />
1-1
P:\40000\140691 - PCWA <strong>Martis</strong> <strong>Valley</strong> GWP\GIS\MAPDOCS\WORKING\Fig1-1_MV_<strong>Plan</strong>Area_8x11_20120821.mxd<br />
Legend<br />
Independence<br />
Lake<br />
INDEPENDENCE CR<br />
Donner Euer <strong>Valley</strong><br />
Truckee River<br />
Streams<br />
South Fork Prosser Creek<br />
Donner Lake<br />
Cold Creek<br />
Mtn Meadow Lake<br />
S AGEHEN CR<br />
Donner Creek<br />
<strong>Martis</strong> <strong>Valley</strong> <strong>Groundwater</strong> Basin<br />
Alder Creek<br />
<strong>Groundwater</strong> <strong>Management</strong> <strong>Plan</strong> Area Boundary<br />
Northstar CSD Service Area<br />
PCWA Zone 4 Service Area<br />
<strong>Placer</strong> <strong>County</strong> within MVGB<br />
Truckee Donner PUD Service Area<br />
Source: <strong>Placer</strong> <strong>County</strong> <strong>Water</strong> Agency; Truckee Donner<br />
Public Utility District; Northstar Community Services District<br />
DATE PROJECT<br />
SITE<br />
10/18/2012<br />
140691<br />
TITLE<br />
¬« 89<br />
¬« 89<br />
Truckee<br />
Prosser Creek Res<br />
§¨¦I-80<br />
MARTIS CR<br />
Stampede Reservoir<br />
TRU CKEE R<br />
Dry Creek<br />
¬« 267<br />
<strong>Martis</strong><br />
Creek Lake<br />
Boca<br />
Reservoir<br />
Dry Lake<br />
M id dle <strong>Martis</strong> Creek<br />
Source: Esri, i-cubed, USDA, USGS, AEX, GeoEye, Getmapping, Aerogrid,<br />
IGN, IGP, and the GIS User Community<br />
<strong>Martis</strong> <strong>Valley</strong>, California<br />
<strong>Groundwater</strong> <strong>Management</strong> <strong>Plan</strong> Area<br />
TRUCKEE R<br />
Figure<br />
1-1<br />
Juniper Cr ek<br />
NORTH<br />
0 2<br />
Miles<br />
Lake Tahoe
<strong>Martis</strong> <strong>Valley</strong> <strong>Groundwater</strong> <strong>Management</strong> <strong>Plan</strong> Section 1<br />
1.3 <strong>Groundwater</strong> <strong>Management</strong> <strong>Plan</strong> Development Process<br />
During the course of preparing the GMP, various entities were involved in developing, approving, and<br />
adopting the GMP. In addition to the partner agencies, a Stakeholder Working Group (SWG) was created<br />
to provide local knowledge, data and information, opinions, and review and comment on material<br />
prepared by the GMP team. The SWG was comprised of representatives of Federal, State, and local<br />
governments, environmental and special interest groups, and local land use interests. Four SWG<br />
meetings were held with the partner agencies during GMP development. SWG participants and the<br />
agency represented are presented in Table 1-1.<br />
Table 1-1. Stakeholder Working Group Members<br />
Working Group Participant Representing<br />
Chris Bonds Department of <strong>Water</strong> Resources, Central Region Office<br />
Steven Springhorn Department of <strong>Water</strong> Resources, Central Region Office<br />
Ron Parr DMB Highlands Group LLC<br />
Rick Stephens Lahontan Community Association<br />
John Eaton Mountain Area Preservation Foundation<br />
Kaitlin Backlund Mountain Area Preservation Foundation<br />
Michael Johnson <strong>Placer</strong> <strong>County</strong> Community Development<br />
Marcia Beals Tahoe Truckee Sanitation Agency<br />
Tony Lashbrook Town of Truckee<br />
Jeff Boyer Truckee River Operating Agreement<br />
Dave Wathen Truckee River Operating Agreement<br />
Lisa Wallace Truckee River <strong>Water</strong>shed Council<br />
Kenneth Parr United States Bureau of Reclamation<br />
Tom Scott United States Bureau of Reclamation<br />
Andrew Strain Heavenly Mountain Resort/Northstar California Resort<br />
Adam Spear Vail Resorts<br />
Steve Maglisceau Marlin Atlantis/Schaffer’s Mill<br />
Tony Firenzi <strong>Placer</strong> <strong>County</strong> <strong>Water</strong> Agency<br />
Steven Poncelet Truckee Donner Public Utilities District<br />
Mike Staudenmayer Northstar Community Services District<br />
There are five main steps in the development of a GMP, as defined under CWC §10753.2 through<br />
10753.6, and the agencies’ actions to follow them are shown in Figure 1-2 and are summarized below:<br />
Step 1 – Provide public notification of a hearing on whether or not to adopt a resolution of intention to<br />
draft a GMP and subsequently complete a hearing on whether or not to adopt a resolution of intention to<br />
draft a GMP. Following the hearing, draft a resolution of intention to draft a GMP. The agencies provided<br />
public notification and held their respective hearings in March 2011. Copies of newspaper notifications<br />
are included in Appendix A.<br />
DRAFT for review purposes only. Use of contents on this sheet is subject to the limitations specified at the end of this document.<br />
P:\40000\140691 - PCWA <strong>Martis</strong> <strong>Valley</strong> GWP\GMP\Report\3rd Draft\<strong>Martis</strong> <strong>Valley</strong> GMP Draft 01-09-13.docx<br />
1-3
<strong>Martis</strong> <strong>Valley</strong> <strong>Groundwater</strong> <strong>Management</strong> <strong>Plan</strong> Section 1<br />
Step 2 – Adopt a resolution of intention to draft a GMP and publish the resolution of intention in<br />
accordance with public notification. The partner agencies’ adopted their respective resolutions of<br />
intention to develop a GMP in April 2011. The resolutions are included as Appendix A.<br />
Figure 1-2. GMP Development Process<br />
DRAFT for review purposes only. Use of contents on this sheet is subject to the limitations specified at the end of this document.<br />
P:\40000\140691 - PCWA <strong>Martis</strong> <strong>Valley</strong> GWP\GMP\Report\3rd Draft\<strong>Martis</strong> <strong>Valley</strong> GMP Draft 01-09-13.docx<br />
1-4
<strong>Martis</strong> <strong>Valley</strong> <strong>Groundwater</strong> <strong>Management</strong> <strong>Plan</strong> Section 1<br />
Step 3 – Prepare a draft GMP within two years of resolution of intention adoption. Provide to the public a<br />
written statement describing the manner in which interested parties may participate in developing the<br />
GMP. The agencies provided notification and held three SWG meetings where meeting attendees gave<br />
input on the GMP goal, BMOs, and implementation actions. The agencies also held a public meeting on<br />
July 20, 2011 to receive public input.<br />
Step 4 – Provide public notification of a hearing on whether or not to adopt the GMP, followed by holding<br />
a hearing on whether or not to adopt the GMP.<br />
Step 5 – The plan may be adopted within 35 days after the completion of Step 4 above if protests are<br />
received for less than 50 percent of the assessed value of property in the plan area. If protests are<br />
received for greater than 50 percent of the assessed value of the property in the plan area, the plan will<br />
not be adopted. Board meeting minutes reflecting GMP adoption and public comment with responses<br />
are provided in Appendix B.<br />
1.4 <strong>Groundwater</strong> <strong>Management</strong> Goal<br />
The GMP’s goal provides the overarching purpose of the GMP, is used to identify the desired outcome of<br />
GMP implementation, is general in nature, and does not include quantitative components:<br />
The goal of the <strong>Martis</strong> <strong>Valley</strong> GMP is to ensure long term quality and availability of groundwater in the<br />
<strong>Martis</strong> <strong>Valley</strong> <strong>Groundwater</strong> Basin.<br />
1.5 Basin <strong>Management</strong> Objectives<br />
The BMOs provide more specific direction to the GMP; they are generally protective of the groundwater<br />
resource and the environment, and each BMO identifies a distinct portion of the overarching goal which<br />
provides specific areas for focus. Summarized below are six primary areas that are emphasized and<br />
embodied in the BMO’s that support the GMP goal:<br />
1. Manage groundwater to maintain established and planned uses.<br />
Because the MVGB is the primary source of water to multiple users under separate jurisdictions,<br />
this objective encourages the partner agencies to pursue management of groundwater that is<br />
within their jurisdiction in order to protect existing uses.<br />
2. Manage groundwater use within the provisions of the Truckee River Operating Agreement.<br />
The Truckee-Carson-Pyramid Lake <strong>Water</strong> Rights Settlement Act (Settlement Act), Public Law 101-<br />
618 (1990), established entitlements to the waters of Lake Tahoe, the Truckee River and its<br />
tributaries and how the storage reservoirs of the Truckee River are operated. Section 205 of the<br />
Settlement Act directs the Secretary of the Department of the Interior to negotiate an operating<br />
agreement for the operation of Truckee River reservoirs, between California, Nevada, Sierra<br />
Pacific Power Company, Pyramid Tribe, and the United States. The operating agreement is<br />
known as the Truckee River Operating Agreement (TROA).<br />
This objective documents the partner agencies’ commitment to continue to comply with<br />
provisions of the TROA. Some provisions in TROA apply to groundwater and water wells within<br />
the Truckee River Basin (which includes the <strong>Martis</strong> <strong>Valley</strong>) to address potential adverse impacts<br />
to surface water.<br />
3. Collaborate and cooperate with groundwater users and stakeholders in the MVGB.<br />
Collaborating and sharing information and resources with other groundwater users in the MVGB<br />
helps promote GMP goals. This objective encourages the partner agencies to reach out to other<br />
groundwater users within the MVGB.<br />
DRAFT for review purposes only. Use of contents on this sheet is subject to the limitations specified at the end of this document.<br />
P:\40000\140691 - PCWA <strong>Martis</strong> <strong>Valley</strong> GWP\GMP\Report\3rd Draft\<strong>Martis</strong> <strong>Valley</strong> GMP Draft 01-09-13.docx<br />
1-5
<strong>Martis</strong> <strong>Valley</strong> <strong>Groundwater</strong> <strong>Management</strong> <strong>Plan</strong> Section 1<br />
4. Protect groundwater quantity and quality.<br />
<strong>Groundwater</strong> performs an integral function in a watershed, one of which is satisfying water<br />
supply needs. Improving the understanding of the groundwater basin is a critical step in<br />
protecting and sustaining the <strong>Martis</strong> <strong>Valley</strong> groundwater supply.<br />
5. Pursue and use the best available science and technology to inform the decision making<br />
process.<br />
Science and technology continue to develop new tools that may improve the understanding of<br />
the MVGB. This objective encourages the partner agencies to take actions that work with the<br />
best available science to help make informed agency decisions.<br />
6. Consider the environment and participate in the stewardship of groundwater resources.<br />
The partner agencies are dedicated to stewardship of groundwater resources and this BMO<br />
ensures that stewardship is part of the GMP.<br />
1.6 <strong>Plan</strong> Components<br />
Required GMP components and their location in the GMP are summarized in Table 1-2, Voluntary GMP<br />
components and their location in the GMP are summarized in Table 1-3, and recommended GMP<br />
components and their location in the GMP are summarized in Table 1-4.<br />
Category<br />
Required<br />
Table 1-2. Required Components and Associated Report Section<br />
GMP Components<br />
Required Components: (10753.7.)<br />
DRAFT for review purposes only. Use of contents on this sheet is subject to the limitations specified at the end of this document.<br />
P:\40000\140691 - PCWA <strong>Martis</strong> <strong>Valley</strong> GWP\GMP\Report\3rd Draft\<strong>Martis</strong> <strong>Valley</strong> GMP Draft 01-09-13.docx<br />
Report<br />
Section<br />
1 Establish Basin <strong>Management</strong> Objectives (BMOs) Section 1.5<br />
2 Include components relating to the monitoring and management of:<br />
groundwater levels, groundwater quality, and inelastic land subsidence<br />
3 Include components relating to changes in surface flow and surface<br />
water quality that directly affect groundwater levels or quality or are<br />
caused by groundwater pumping in the basin<br />
4 Include description of how recharge areas identified in the<br />
GMPsubstantially contribute to the replenishment of the groundwater<br />
basin<br />
5 Prepare a GMP that enables the partner agencies to work cooperatively<br />
with other public entities whose service area falls within the plan area<br />
and overlies the groundwater basin<br />
6 Prepare a map that details the area of the groundwater basin, the area<br />
subject to the GMP, and the boundaries of other local agencies that<br />
overlie the basin<br />
Section 3.4<br />
Section 3.2<br />
Section 2.9<br />
Section 3.1<br />
Section 3.4<br />
Section 1.1<br />
7 Prepare a map identifying the recharge areas for the groundwater basin Section 2.9<br />
8 Adopt monitoring protocols that detect changes in: groundwater levels,<br />
groundwater quality, inelastic land subsidence, and surface water flow or<br />
quality that affects groundwater or groundwater pumping that affects<br />
surface water flow or quality<br />
9 If the GMP area includes areas outside a groundwater basin as defined in<br />
Bulletin 118, the partner agencies will use the required components, and<br />
geologic and hydrologic principles appropriate for the area<br />
Section 3.4<br />
Throughout GMP<br />
1-6
<strong>Martis</strong> <strong>Valley</strong> <strong>Groundwater</strong> <strong>Management</strong> <strong>Plan</strong> Section 1<br />
Category<br />
Voluntary<br />
Table 1-3. Voluntary Components and Associated Report Section<br />
GMP Components<br />
Voluntary Components (10753.8.)<br />
DRAFT for review purposes only. Use of contents on this sheet is subject to the limitations specified at the end of this document.<br />
P:\40000\140691 - PCWA <strong>Martis</strong> <strong>Valley</strong> GWP\GMP\Report\3rd Draft\<strong>Martis</strong> <strong>Valley</strong> GMP Draft 01-09-13.docx<br />
Report<br />
Section<br />
1 Control of saline intrusion Section 3.1<br />
2 Identification and management of wellhead protection Section 3.4<br />
3 Regulation of the migration of contaminated groundwater Section 3.1<br />
Section 3.2<br />
4 Administration of a well abandonment and well destruction program Section 3.1<br />
5 Mitigation of conditions of overdraft Section 3.1<br />
6 Replenishment of groundwater extracted by water producers Section 3.1<br />
7 Monitoring of groundwater levels and storage Section 3.4<br />
8 Facilitating conjunctive use operations Section 3.1<br />
9 Identification of well construction policies Section 3.4<br />
10 Construction and operation by the partner agencies of groundwater<br />
contamination cleanup, recharge, storage, conservation, water<br />
recycling, and extraction projects<br />
11 Development of relationships with state and Federal regulatory<br />
agencies<br />
12 Review of land use plans and coordination with land use planning<br />
agencies to assess activities that create a reasonable risk of<br />
groundwater contamination<br />
Category<br />
Recommended<br />
Table 1-4. Recommended Components and Associated Report Section<br />
GMP Components<br />
Recommended Components<br />
(From Bulletin 118-2003 Appendix C)<br />
1 Document public involvement and ability of the public to participate in<br />
development of the GMP, this may include a Technical Advisory<br />
Committee (Stakeholder Working Group)<br />
2 Establish an advisory committee of stakeholders within the plan area<br />
that will help guide the development and implementation of the GMP<br />
and provide a forum for the resolution of controversial issues<br />
3 Describe the area to be managed under the GMP including:<br />
• The physical structure of the aquifer system<br />
• A summary of available historical data and issues of concern<br />
related to groundwater levels, groundwater quality, inelastic land<br />
subsidence, and surface water flow or quality that effects<br />
groundwater or groundwater pumping that effects surface water<br />
flow or quality<br />
• A general discussion of historical and projected water demands<br />
and supplies<br />
Section 3.1<br />
Section 3.2<br />
Section 3.1<br />
Section 3.2<br />
Section 3.5<br />
Section 3.4<br />
Report<br />
Section<br />
Section 1.3<br />
Section 1.3<br />
Section 3.1<br />
Section 2<br />
1-7
<strong>Martis</strong> <strong>Valley</strong> <strong>Groundwater</strong> <strong>Management</strong> <strong>Plan</strong> Section 1<br />
Category<br />
Recommended<br />
Table 1-4. Recommended Components and Associated Report Section<br />
GMP Components<br />
Recommended Components<br />
(From Bulletin 118-2003 Appendix C)<br />
4 Establish management objectives (MOs) for the groundwater basin<br />
subject to the GMP<br />
DRAFT for review purposes only. Use of contents on this sheet is subject to the limitations specified at the end of this document.<br />
P:\40000\140691 - PCWA <strong>Martis</strong> <strong>Valley</strong> GWP\GMP\Report\3rd Draft\<strong>Martis</strong> <strong>Valley</strong> GMP Draft 01-09-13.docx<br />
Report<br />
Section<br />
Section 1.5<br />
5 Describe the GMP’s monitoring program Section 3.4<br />
6 Describe efforts to coordinate with land use, zoning, or water<br />
management planning agencies or activities<br />
7 Create a summary of monitoring locations with frequency of wells<br />
monitored<br />
8 Provide periodic reports summarizing groundwater conditions and<br />
management activities including:<br />
• A summary of monitoring results, with a discussion of historical<br />
trends<br />
• A summary of management actions during the period covered by<br />
the report<br />
• A discussion of whether actions are achieving progress towards<br />
meeting BMOs<br />
• A summary of proposed management actions for the future<br />
• A summary of any GMP changes that occurred during the period<br />
covered by the report<br />
• A summary of actions taken to coordinate with other water and<br />
land agencies and other government agencies<br />
9 Provide for the periodic re-evaluation of the entire plan by the<br />
managing entity<br />
1.7 Area Covered by the GMP<br />
Section 3.4<br />
Appendix D<br />
Section 3.1<br />
Section 3.1<br />
The <strong>Martis</strong> <strong>Valley</strong> GMP includes the service areas of the TDPUD, PCWA, and NCSD that overlay and<br />
extend beyond the MVGB boundary, as well as the <strong>Placer</strong> <strong>County</strong> portion of the MVGB. It is important to<br />
note that at the time of GMP development, there were no other agencies within the <strong>Placer</strong> <strong>County</strong> portion<br />
of the MVGB that fall within the service area of another local agency, water corporation regulated by the<br />
Public Utilities Commission (PUC), or mutual water company without the agreement of the overlying<br />
agency, as defined in the CWC (CWC § 10750.7(a)). Figure 1-1 shows the <strong>Martis</strong> <strong>Valley</strong> GMP area.<br />
1.8 Public Outreach and Education<br />
The partner agencies developed a Public Outreach <strong>Plan</strong> to guide development of the GMP. Public<br />
outreach included the formation of a Stakeholder Working Group to provide input on GMP development,<br />
two informative public meetings, and publically noticed public hearings (Appendix A) on the intent to<br />
draft and adopt the GMP. The Public Outreach <strong>Plan</strong> is included in Appendix C.<br />
1.9 <strong>Groundwater</strong> Model<br />
The partner agencies are currently collaborating with the Bureau of Reclamation (Reclamation) and their<br />
subcontractor, Desert Research Institute (DRI), to develop an integrated watershed-groundwater model<br />
in conjunction with the <strong>Martis</strong> <strong>Valley</strong> GMP. The geologic investigation conducted and documented in<br />
Section 2 of this report has been used to develop a geologic framework database, which was used to<br />
1-8
<strong>Martis</strong> <strong>Valley</strong> <strong>Groundwater</strong> <strong>Management</strong> <strong>Plan</strong> Section 1<br />
guide the conceptual and numerical model components for the hydrogeology components (groundwater<br />
model) of the integrated watershed model. The integrated watershed model is under development in<br />
parallel with the GMP and is not completed at the time of the issuance of the draft GMP.<br />
The integrated watershed model is comprised of a Precipitation Runoff Modeling System (PRMS) and<br />
Modular Three-Dimensional Finite-Difference <strong>Groundwater</strong> Flow Model (MODFLOW) coupled together<br />
using an Unsaturated Zone Flow (UZF) package. PRMS is used to model surface water within the<br />
watershed, whereas MODFLOW is used to model groundwater within the MVGB. The UZF model package<br />
is a kinematic wave vadose zone model used to simulate the interaction between surface water and<br />
groundwater. Each model will be calibrated separately, and then calibrated together over a ten year<br />
period using a coupled ground-water and surface-water Flow Model (GSFLOW). Predictive model<br />
simulations will be performed using multiple general circulation model (GCM) projections of precipitation<br />
and temperature to estimate the influence of future climate on water resources within the MVGB.<br />
Calibration targets for fully coupled, GSFLOW model will include head values measured from wells,<br />
meadow and spring locations, streamflows, measured snow depth, and remotely sensed snow cover.<br />
The integrated model’s model domain will cover the entire <strong>Martis</strong> <strong>Valley</strong> <strong>Water</strong>shed, which includes the<br />
MVGB, as well as the watersheds that contribute surface water to the region, including Lake Tahoe. The<br />
model grid’s cells are 300 meters by 300 meters in size. To date, DRI has used the PRMS component of<br />
the integrated modeling tool to estimate groundwater recharge across the MVGB, and is discussed in<br />
more detail in Section 2.9.<br />
1.10 Document Organization<br />
The <strong>Martis</strong> <strong>Valley</strong> GMP is organized into the following sections:<br />
Section 2 Physical Setting: describes the physical setting of <strong>Martis</strong> <strong>Valley</strong> including items such as<br />
geologic setting, land use, water sources, and well infrastructure<br />
Section 3 <strong>Plan</strong> Implementation: discusses the implementation actions included in the <strong>Martis</strong> <strong>Valley</strong><br />
GMP<br />
Section 4 References<br />
Appendices<br />
DRAFT for review purposes only. Use of contents on this sheet is subject to the limitations specified at the end of this document.<br />
P:\40000\140691 - PCWA <strong>Martis</strong> <strong>Valley</strong> GWP\GMP\Report\3rd Draft\<strong>Martis</strong> <strong>Valley</strong> GMP Draft 01-09-13.docx<br />
1-9
Section 2<br />
Physical Setting<br />
The MVGB is located in the transition zone between the Sierra Nevada and the Basin and Range<br />
Geomorphic Provinces, east of the Sierra Nevada crest and part of the larger Tahoe-Truckee River Basin<br />
of California and Nevada. <strong>Martis</strong> <strong>Valley</strong> is the principal topographic feature within the MVGB. The<br />
surrounding landscape is mountainous, underlain by volcanic and, to some extent, granitic bedrock, with<br />
apparent faulting and some portions that have been glaciated. A significant portion of the land within the<br />
MVGB boundary is privately owned with some areas managed as forest, open space and/or for<br />
recreation by special districts or agencies, including the U.S. Forest Service. This section of the GMP<br />
characterizes the physical setting of the MVGB, including: topography, climate, surface water hydrology,<br />
geology, hydrogeology, and water use.<br />
2.1 Topography<br />
The MVGB encompasses roughly 57 square miles, and lies within the Middle Truckee River <strong>Water</strong>shed.<br />
Elevations of the valley floor range from 5,700 to 5,900 feet above mean sea level (msl). The valley is<br />
accented by hills rising above the valley floor and mountains to the south and east of the valley. High<br />
points within or immediately adjacent to the MVGB include Bald Mountain at an elevation of 6,760 feet<br />
and Alder Hill at 6,733 feet, located on the western margin of the MVGB, and Lookout Mountain at<br />
8,104 feet and Mt. Pluto at 8,617 feet, located on its the southern fringe. <strong>Martis</strong> Peak, further to the<br />
east, is at 8,742 feet. Figure 2-1 illustrates the MVGB location and topography.<br />
2.2 Climate<br />
The Tahoe-Truckee region experiences warm and dry summers, and cold, wet and snowy winters.<br />
Elevation and rain shadow play major roles in the spatial distribution of temperature and precipitation.<br />
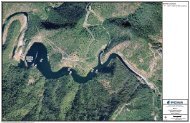
Precipitation is highest at upper elevations in the western portion of the basin, toward the Sierra Crest,<br />
and decreases with elevation in the eastern portion of the basin (Figure 2-2). Mean annual precipitation<br />
(as snow water equivalent) ranges from approximately 30 inches below 6,500 feet to over 45 inches<br />
above 6,500 feet. Precipitation falls mostly as snow between October and April, though runoff and<br />
streamflow also responds to periodic mid-winter rain-on-snow events. Annual peak streamflow typically<br />
occurs during spring snowmelt in May or June. A small proportion of the total annual precipitation falls<br />
during brief thunderstorms in the summer months. Average monthly precipitation is shown in Figure 2-3,<br />
as recorded at the United States Forest Service (USFS) Truckee Ranger Station, near the center of the<br />
watershed (California Data Exchange Center Station TKE). Average temperatures range from daily lows<br />
of 15ºF in December and January to daily highs of 82ºF in July, as recorded at SNOTEL Station<br />
Truckee #2.<br />
DRAFT for review purposes only. Use of contents on this sheet is subject to the limitations specified at the end of this document.<br />
P:\40000\140691 - PCWA <strong>Martis</strong> <strong>Valley</strong> GWP\GMP\Report\3rd Draft\<strong>Martis</strong> <strong>Valley</strong> GMP Draft 01-09-13.docx<br />
2-1
P:\40000\140691 - PCWA <strong>Martis</strong> <strong>Valley</strong> GWP\GMP\Report\1st Draft\Figures<br />
DATE PROJECT<br />
SITE<br />
9-7-12 140691<br />
TITLE<br />
<strong>Martis</strong> <strong>Valley</strong> <strong>Groundwater</strong> Basin<br />
<strong>Martis</strong> <strong>Valley</strong> <strong>Groundwater</strong> Basin, California<br />
Mean Annual Precipitation<br />
Figure<br />
2-2
<strong>Martis</strong> <strong>Valley</strong> <strong>Groundwater</strong> <strong>Management</strong> <strong>Plan</strong> Section 2<br />
Mean monthly precipitation (inches)<br />
7<br />
6<br />
5<br />
4<br />
3<br />
2<br />
1<br />
0<br />
JAN FEB MAR APR MAY JUN JUL AUG SEP OCT NOV DEC<br />
Figure 2-3. Mean Monthly Precipitation, Truckee Ranger Station, from 1904 to 1919 and 1935 to 2009<br />
2.2.1 Climate Variability<br />
The region experiences a wide range in climate variability. Variability is marked by periods of greater<br />
than average precipitation (‘wet periods’) and periods of below average precipitation or drought periods.<br />
Droughts have been historically common in the Sierra Nevada; Figure 2-4 illustrates the annual percent<br />
deviation from mean annual precipitation in Truckee and annual streamflow recorded at Farad from<br />
1910 to 2009. The data shows that recent dry periods (periods of below average precipitation) generally<br />
have longer duration (e.g., 1971-1978, 1987-1994) than wet periods, which are typically short-lived and<br />
more extreme (e.g., 1962-1965, 1982-1983). The gray shading shows periods of incomplete annual<br />
precipitation data.<br />
The worst drought in the 110 records of recorded streamflows at Farad was from 1987 to 1994. A<br />
similar pattern is recorded in tree-ring data since 1600 (Fritts and Gordon, 1980), with longer, more<br />
extreme droughts recorded. Lindstrom and others (2000) have described climate changes and details<br />
of wet and dry periods over the past 10,000 years, noting evidence of several dry periods when Lake<br />
Tahoe, and Donner and Independence Lakes dropped below their natural rims for consecutive years or<br />
decades (700 to 500 years ago and 200 to 100 years ago).<br />
DRAFT for review purposes only. Use of contents on this sheet is subject to the limitations specified at the end of this document.<br />
P:\40000\140691 - PCWA <strong>Martis</strong> <strong>Valley</strong> GWP\GMP\Report\3rd Draft\<strong>Martis</strong> <strong>Valley</strong> GMP Draft 01-09-13.docx<br />
2-4
<strong>Martis</strong> <strong>Valley</strong> <strong>Groundwater</strong> <strong>Management</strong> <strong>Plan</strong> Section 2<br />
Percent deviation from mean annual precipitation<br />
Total annual streamflow at Farad (acre-feet)<br />
80<br />
60<br />
40<br />
20<br />
0<br />
‐20<br />
‐40<br />
‐60<br />
‐80<br />
1904<br />
1907<br />
1910<br />
1913<br />
1916<br />
1919<br />
1922<br />
1925<br />
1928<br />
1931<br />
1934<br />
1937<br />
1940<br />
1943<br />
1946<br />
1949<br />
1952<br />
1955<br />
1958<br />
1961<br />
1964<br />
1967<br />
1970<br />
1973<br />
1976<br />
1979<br />
1982<br />
1985<br />
1988<br />
1991<br />
1994<br />
1997<br />
2000<br />
2003<br />
2006<br />
2009<br />
2000000<br />
1800000<br />
1600000<br />
1400000<br />
1200000<br />
1000000<br />
800000<br />
600000<br />
400000<br />
200000<br />
0<br />
1904<br />
1907<br />
1910<br />
1913<br />
mean: 547,000 ac-ft/yr<br />
1916<br />
1919<br />
1922<br />
1925<br />
1928<br />
1931<br />
1934<br />
1937<br />
1940<br />
1943<br />
1946<br />
1949<br />
1952<br />
1955<br />
Figure 2-4. Percent Deviation from Mean Annual Precipitation at the Truckee Ranger Station<br />
and Total Annual Streamflow at Farad<br />
1958<br />
1961<br />
1964<br />
1967<br />
1970<br />
1973<br />
1976<br />
1979<br />
1982<br />
1985<br />
DRAFT for review purposes only. Use of contents on this sheet is subject to the limitations specified at the end of this document.<br />
P:\40000\140691 - PCWA <strong>Martis</strong> <strong>Valley</strong> GWP\GMP\Report\3rd Draft\<strong>Martis</strong> <strong>Valley</strong> GMP Draft 01-09-13.docx<br />
1988<br />
1991<br />
1994<br />
1997<br />
2000<br />
2003<br />
2006<br />
2009<br />
2-5
<strong>Martis</strong> <strong>Valley</strong> <strong>Groundwater</strong> <strong>Management</strong> <strong>Plan</strong> Section 2<br />
2.2.2 Climate Change<br />
The National Oceanic and Atmospheric Association (NOAA) and Coats and others (2010) have predicted<br />
a future shift from snowfall to rain in the next century in this region as a result of projected increases in<br />
average, minimum, and maximum air temperatures. Associated changes in surface water hydrology<br />
include potential increases in the frequency and magnitude of major flooding, such that more water may<br />
leave the basin as runoff, rather than infiltrating and recharging groundwater resources. NOAA has also<br />
predicted that climate change may result in increased drought frequency, and generally reduced water<br />
supplies (U.S. Bureau of Reclamation, 2011).<br />
The U.S. Bureau of Reclamation manages water supply in the Truckee River Basin, and is undertaking a<br />
number of studies to evaluate the degree to which water supply and demand may be impacted by future<br />
changes in climate. This includes the Truckee River Basin Study, as well as funding researchers at DRI<br />
to develop an integrated groundwater, surface water, and climate change model of the MVGB.<br />
2.3 Surface <strong>Water</strong> Hydrology<br />
The Truckee River bisects the MVGB, with several tributaries upstream, within, and downstream of the<br />
MVGB. This section provides a brief discussion of the flow regimes of the Truckee River and the primary<br />
tributaries within the MVGB. <strong>Water</strong>shed areas are based on data available from CalAtlas, but<br />
subwatersheds shown have been modified in places for consistency with other regional studies,<br />
including the <strong>Water</strong> Quality Assessment and Modeling of the California portion of the Truckee River Basin<br />
(McGraw and others, 2001), the Truckee River <strong>Water</strong> Quality Monitoring <strong>Plan</strong> (Nichols Engineers, 2008),<br />
and the <strong>Martis</strong> <strong>Water</strong>shed Assessment (Shaw and others, 2012).<br />
2.3.1 Truckee River<br />
The Middle Truckee River1 flows out of Lake Tahoe at Tahoe City with a number of tributaries<br />
contributing streamflow upstream of <strong>Martis</strong> <strong>Valley</strong>, including Bear, Squaw, Deer, Pole, Silver, and Cabin<br />
Creeks. The Truckee River then enters the MVGB near the junction of State Highway 89 and Interstate<br />
80, flows west to east across <strong>Martis</strong> <strong>Valley</strong> before exiting the basin near Boca, just upstream of its<br />
confluence with the Little Truckee River. Main tributaries within <strong>Martis</strong> <strong>Valley</strong> are Donner, Cold2 , Trout,<br />
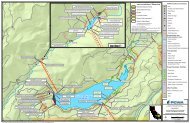
<strong>Martis</strong> and Prosser Creeks (Figure 2-5). Below Boca, the Truckee River descends into the Truckee<br />
Canyon before flowing through Reno and Sparks, Nevada, and terminating at Pyramid Lake.<br />
Streamflow from Lake Tahoe, Donner Lake, <strong>Martis</strong> Creek, and Prosser Creek is controlled by major dams<br />
or impoundments, with the timing of releases and streamflows guided by a number of court decrees,<br />
agreements, and regulations that govern the flow rate from California to Nevada. These streamflow<br />
rates are known as ‘Floriston Rates’ and measured at Farad, California just upstream of the State line.<br />
The Truckee River is currently operated according to the Truckee River and Reservoir Operations Model<br />
(Berris and others, 2001). The Truckee River falls under the jurisdiction of TROA, which is further<br />
discussed in Section 3.2.<br />
1 Definitions of the Upper, Middle, and Lower Truckee River vary among numerous published studies. The definition used in this<br />
report of the “Middle Truckee River” definition used in this report conforms to nomenclature used by the California Lahontan<br />
Regional <strong>Water</strong> Quality Control Board, but differs from that used by the U.S. Bureau of Reclamation.<br />
2 Though it is not a direct tributary to the Truckee River, Cold Creek flows into Donner Creek below Donner Lake, approximately<br />
1.5 miles upstream of the confluence with the Truckee River, and therefore accounts for a significant portion of the unregulated<br />
flow into the MVGB.<br />
DRAFT for review purposes only. Use of contents on this sheet is subject to the limitations specified at the end of this document.<br />
P:\40000\140691 - PCWA <strong>Martis</strong> <strong>Valley</strong> GWP\GMP\Report\3rd Draft\<strong>Martis</strong> <strong>Valley</strong> GMP Draft 01-09-13.docx<br />
2-6
<strong>Martis</strong> Figure2_5_Hydrography.mxd<br />
Independence Lake<br />
Frog Lake<br />
Summit Lake<br />
Flora Lake<br />
Lake Angela<br />
Lake Mary<br />
Donner Euer <strong>Valley</strong><br />
Don ner Creek<br />
Legend<br />
#* USGS Gaging Stations<br />
A<br />
South Fork Prosser Creek<br />
Donner Lake<br />
Donner/Cold Creeks<br />
DWR long-term monitoring wells<br />
<strong>Martis</strong> <strong>Valley</strong> <strong>Groundwater</strong> Basin<br />
Cold Stream-Little Truckee River<br />
Donner Creek<br />
<strong>Martis</strong> Creek<br />
Prosser Creek<br />
Squaw Creek-Truckee River<br />
Trout Creek<br />
Truckee River<br />
Mtn Meadow Lake<br />
DATE PROJECT<br />
SITE<br />
11-2-2012 140691<br />
TITLE<br />
Sagehen Creek<br />
Cold Creek<br />
Trout Creek<br />
A<br />
Alder Creek<br />
Prosser Creek<br />
A<br />
Trout C reek<br />
Truckee River<br />
¬« 89<br />
Prosser Creek<br />
#*<br />
¬« 89<br />
#*<br />
Truckee River<br />
Stampede Reservoir<br />
A<br />
A<br />
Truckee<br />
§¨¦I-80<br />
Prosser Creek Res<br />
A<br />
<strong>Martis</strong> Creek<br />
<strong>Martis</strong> Creek<br />
#*<br />
A<br />
A<br />
Dry Creek<br />
A<br />
Tru ckee River<br />
#*<br />
¬« 267<br />
Boca Reservoir<br />
<strong>Martis</strong> Creek Lake<br />
A<br />
A<br />
Truckee Corridor<br />
Dry Lake<br />
M iddle <strong>Martis</strong> Creek<br />
Lake Tahoe<br />
Source: Esri, i-cubed, USDA, USGS, AEX, GeoEye, Getmapping, Aerogrid,<br />
IGN, IGP, and the GIS User Community<br />
<strong>Martis</strong> <strong>Valley</strong> <strong>Groundwater</strong> Basin, California<br />
Hydrography and long-term monitoring stations<br />
#*<br />
Figure<br />
2-5<br />
J unip er Creek<br />
NORTH<br />
0 2<br />
Miles<br />
§¨¦<br />
¬«
<strong>Martis</strong> <strong>Valley</strong> <strong>Groundwater</strong> <strong>Management</strong> <strong>Plan</strong> Section 2<br />
Table 2-1 summarizes historical monthly and average annual flow of the Truckee River and its<br />
tributaries, and Figure 2-6 correspondingly shows the average monthly streamflow at a number of gaging<br />
stations in the Truckee Basin. This data illustrates how the regulation of streamflows in the Truckee<br />
Basin alters the timing of discharge. Unregulated streams in this region tend to experience seasonal low<br />
flows in the late summer and early fall, with the bulk of total annual runoff occurring as snowmelt in May<br />
and June. This pattern is illustrated by monthly streamflow data collected at Sagehen Creek, an<br />
unregulated watershed approximately 5 miles north of the MVGB. In contrast, streams in the MVGB tend<br />
to have the total annual streamflow more uniformly distributed during the year, due to timed releases<br />
from the various impoundments.<br />
Table 2-1. Average Monthly Streamflow on the Truckee River and Select Tributaries<br />
Sagehen<br />
Creek<br />
Donner<br />
Creek below<br />
Donner Lake<br />
Truckee River<br />
near Truckee<br />
Prosser Creek<br />
below Prosser<br />
Dam<br />
<strong>Martis</strong> Creek<br />
above <strong>Martis</strong><br />
Dam<br />
DRAFT for review purposes only. Use of contents on this sheet is subject to the limitations specified at the end of this document.<br />
P:\40000\140691 - PCWA <strong>Martis</strong> <strong>Valley</strong> GWP\GMP\Report\3rd Draft\<strong>Martis</strong> <strong>Valley</strong> GMP Draft 01-09-13.docx<br />
Truckee River<br />
at Boca<br />
Truckee River<br />
at Farad<br />
USGS Station ID 10343500 10338500 10338000 10340500 10344505 10346000<br />
<strong>Water</strong>shed Size (sq mi) 10.5 14.3 553.0 52.9 37.2 873 932<br />
Period of record<br />
(cfs)<br />
1953present<br />
1931-present 1945-present 1964-present<br />
1959-1971;<br />
1973-2007<br />
2002-present 1910-present<br />
Oct 3 30 175 85 11 382 388<br />
Nov 5 27 179 36 14 277 412<br />
Dec 7 30 256 53 20 341 520<br />
Jan 8 33 293 74 29 390 586<br />
Feb 8 32 315 68 34 348 641<br />
Mar 10 38 305 111 47 540 788<br />
Apr 24 52 372 119 57 835 1240<br />
May 43 86 532 190 52 1190 1680<br />
Jun 25 45 457 112 26 900 1240<br />
Jul 7 11 306 63 14 658 659<br />
Aug 3 7 285 52 10 499 515<br />
Sept 3 27 239 102 11 493 473<br />
Mean annual (cfs) 12 35 310 89 27 571 762<br />
Mean annual (ac-ft) 8,772 25,236 224,068 64,252 19,629 413,445 551,542<br />
Source: U.S. Geological Survey; U.S. Army Corps of Engineers<br />
cfs: cubic feet per second<br />
ac-ft: acre-feet<br />
2-8
<strong>Martis</strong> <strong>Valley</strong> <strong>Groundwater</strong> <strong>Management</strong> <strong>Plan</strong> Section 2<br />
Figure 2-6. Mean Monthly Streamflows in the Middle Truckee River <strong>Water</strong>shed<br />
DRAFT for review purposes only. Use of contents on this sheet is subject to the limitations specified at the end of this document.<br />
P:\40000\140691 - PCWA <strong>Martis</strong> <strong>Valley</strong> GWP\GMP\Report\3rd Draft\<strong>Martis</strong> <strong>Valley</strong> GMP Draft 01-09-13.docx<br />
2-9
<strong>Martis</strong> <strong>Valley</strong> <strong>Groundwater</strong> <strong>Management</strong> <strong>Plan</strong> Section 2<br />
2.3.2 <strong>Martis</strong> Creek<br />
<strong>Martis</strong> Creek generally flows from south to north in the southern portion of the groundwater basin, with<br />
four named tributaries; <strong>Martis</strong>, West, Middle, and East <strong>Martis</strong> Creeks comprising the majority of its 42.7<br />
square-mile watershed. <strong>Martis</strong> Creek Dam was completed in 1972 in order to provide storage for flood<br />
control, recreation, and potential water supply (USACE, 1985). Shortly following construction, seepage<br />
was observed in the dam face, posing a significant failure risk. As a result, the reservoir has rarely been<br />
filled to capacity, and is now maintained at a minimum pool elevation located entirely within the<br />
boundaries of the MVGB. The maximum outlet capacity of the dam is 580 cfs prior to spilling and 4,640<br />
cfs at maximum spilling capacity. The United States Army Corps of Engineers (USACE) currently operates<br />
the dam in a ‘gates wide open’ position, such that minimal regulation or disruptions in the timing of<br />
streamflow occurs under most circumstances.<br />
The United States Geologic Survey (USGS) maintained a streamflow gaging station on <strong>Martis</strong> Creek<br />
between <strong>Martis</strong> Dam and the Truckee River from October 1959 through September 2010, and recently<br />
transferred the gage to the USACE in October 2010. Since <strong>Martis</strong> Dam was constructed in 1972, this<br />
data has been used by the USACE, along with <strong>Martis</strong> Reservoir water level data and stage-storage<br />
information, to develop a record of inflow to <strong>Martis</strong> Reservoir. Daily reservoir inflow data is available for<br />
water years 1972 to 2008, and indicate average annual runoff into and out of the reservoir to be on the<br />
order of 19,629 acre-feet (27.1 cfs).<br />
2.3.3 Donner and Cold Creeks<br />
Donner Lake has a watershed area of approximately 14.3 square miles, all of which lies west of the<br />
MVGB boundary. The lake discharges into Donner Creek near the western boundary of the groundwater<br />
basin, and then flows toward the east and into the Truckee River (Figure 2-5). A dam was constructed at<br />
the lake outlet in 1928 (Berris and others, 2001) allowing for a reservoir capacity of 9,500 ac-ft. The<br />
Donner Lake dam is operated by the Nevada Energy (formerly Sierra Pacific Power Company), with a<br />
typical release season to provide flood control space from September 1 to November 15. The USGS has<br />
maintained a streamflow station on Donner Creek below Donner Lake (Station 10338500) since 1931.<br />
Average annual streamflow is 25,794 acre-feet (35.9 cfs), and Figure 2-6 illustrates the effect of dam<br />
operations on the timing of streamflow during the year.<br />
2.3.3.1 Cold Creek<br />
Cold Creek has a watershed area of approximately 12.5 square miles and flows from Coldstream Canyon<br />
into Donner Creek in the western portion of the groundwater basin. The confluence of these streams<br />
historically migrated across the Coldstream Canyon alluvial fan, but now both channels area confined by<br />
transportation infrastructure and historical aggregate mining operations. Cold Creek is the largest<br />
unregulated watershed that flows into the MVGB; with a runoff regime typical of a snowmelt-dominated<br />
system, with peak flows in May and June and low flows in the late summer and early fall.<br />
A streamflow gage was installed on Cold Creek by Balance Hydrologics for the Truckee River <strong>Water</strong>shed<br />
Council in October, 2010. Cold Creek is the only significant tributary to Donner Creek between USGS<br />
gaging station 10338000 (Donner Creek at Donner Lake) and 10338700 (Donner Creek at Highway<br />
89), therefore, historical streamflow estimates were inferred by calculating the difference in streamflow<br />
between these stations. Based on these data, average annual streamflow from Cold Creek is<br />
approximately 26,731 ac-ft (36.9 cfs).<br />
2.3.4 Trout Creek<br />
With a watershed area of approximately 5 square miles, Trout Creek is the only other unregulated stream<br />
(besides Cold Creek) which flows into the MVGB. The headwaters of Trout Creek are located within the<br />
Tahoe-Donner residential subdivision, part of the Town of Truckee and largely within the boundaries of<br />
DRAFT for review purposes only. Use of contents on this sheet is subject to the limitations specified at the end of this document.<br />
P:\40000\140691 - PCWA <strong>Martis</strong> <strong>Valley</strong> GWP\GMP\Report\3rd Draft\<strong>Martis</strong> <strong>Valley</strong> GMP Draft 01-09-13.docx<br />
2-10
<strong>Martis</strong> <strong>Valley</strong> <strong>Groundwater</strong> <strong>Management</strong> <strong>Plan</strong> Section 2<br />
the MVGB. The runoff regime is predominately snow-melt dominated, but with portions of the watershed<br />
covered with impervious surfaces such as roads and rooftops, rainfall events result in slightly more<br />
runoff and less infiltration and recharge from this watershed compared to others. A streamflow gage on<br />
Trout Creek was installed in January 2011 for the Truckee River <strong>Water</strong>shed Council so long-term<br />
streamflow statistics are not available.<br />
2.3.5 Prosser Creek<br />
Prosser Creek’s approximately 32 square-mile watershed area includes Alder Creek and lies largely<br />
outside the MVGB. Prosser Creek Reservoir however, is entirely within the groundwater basin and is<br />
operated by the U.S. Bureau of Reclamation for water supply and flood control. Reservoir releases for<br />
flood control typically occur between September 1 and October 31 (Berris and others, 2001), as<br />
reflected in the pattern of average monthly flows depicted in Figure 2-6.<br />
2.3.6 Truckee Corridor<br />
The Truckee Corridor includes intervening areas that do not drain to the tributaries mentioned above.<br />
This includes the Union Creek subwatershed, which encompasses much of the Glenshire subdivision in<br />
the eastern portion of the MVGB, as well as urban and open space areas within the Town of Truckee.<br />
2.3.7 Other impoundments<br />
A number of small impoundments are located within the boundaries of the MVGB, including Union Mills<br />
Pond in the Glenshire subdivision, Dry Lake adjacent to the Waddle Ranch Preserve, and Gooseneck<br />
Reservoir, near the Lahontan Golf Club. Though originally constructed for cattle-grazing and/or millpond<br />
operations, these impoundments are now managed primarily for open space, recreational/aesthetic, or<br />
wildlife purposes.<br />
2.4 Geology<br />
The <strong>Martis</strong> <strong>Valley</strong> is located in the Sierra Nevada physiographic region, which is composed primarily of<br />
igneous and metamorphic rocks, with sedimentary rocks in its valleys. The MVGB’s complex geology is<br />
dominated by sedimentary deposits left by glaciations, volcanic rocks, and faulting. A component of the<br />
<strong>Martis</strong> GMP was the development of geologic cross-sections to improve the understanding of MVGB<br />
geology and stratigraphy.<br />
2.4.1 Geologic Database Development<br />
Approximately 200 well logs obtained from the DWR, TDPUD, PCWA, NCSD, and the Tahoe-Truckee<br />
Sanitation Agency (T-TSA) were interpreted to better understand depths and thicknesses of the various<br />
geologic formations comprising the MVGB. The filtered geologic and selected well data were entered<br />
into an ESRI ArcGIS Geodatabase, a spatially-referenced database. The benefit of the Geodatabase<br />
allowed a visual representation of the geologic data and was also used as the geologic framework for the<br />
DRI groundwater model that provides consistency between the GMP geologic interpretation and the<br />
groundwater model.<br />
The geochronology and stratigraphic relationships of water-bearing formations was based on Birkeland’s<br />
(1961; 1963; 1964) work, as well as subsequent investigations by Latham (1985), and Hydro-Search<br />
(1995), and mapping published by Saucedo (2005) and Melody (2009). The stratigraphic relationships,<br />
lithologies, and formation locations described in these studies, as well as through field observations,<br />
formed the basis for the designation of the primary hydrostratigraphic units, as displayed in Figure 2-7.<br />
Figure 2-8 shows the approximate locations of wells used to develop the geologic database.<br />
DRAFT for review purposes only. Use of contents on this sheet is subject to the limitations specified at the end of this document.<br />
P:\40000\140691 - PCWA <strong>Martis</strong> <strong>Valley</strong> GWP\GMP\Report\3rd Draft\<strong>Martis</strong> <strong>Valley</strong> GMP Draft 01-09-13.docx<br />
2-11
<strong>Martis</strong> <strong>Valley</strong> <strong>Groundwater</strong> <strong>Management</strong> <strong>Plan</strong> Section 2<br />
Figure 2-7. Stratigraphic Column showing Primary Hydrostratigraphic Units<br />
Stratigraphic interpretations shown in Figure 2-7 and in Section 2.4.3 (below) are consistent with<br />
published geologic maps of the basin (Birkeland, 1961; Birkeland, 1963; Saucedo, 2005; Melody,<br />
2009), and delineate four primary water-bearing stratigraphic units that make up the aquifer, and<br />
underlying rocks that are considered to be relatively water-limited (see Figure 2-9). The primary units<br />
shown in Figure 2-7 include a number of subunits mapped by previous investigators and shown on<br />
Figure 2-9 and noted in parenthesis with the descriptions below. When available, information regarding<br />
potentially confining (fine grained) or water-bearing (coarse) subunits are also delineated. Following well<br />
log interpretation, three representative geologic cross-sections were located and developed. Figure 2-9<br />
shows the cross-section locations; Figure 2-10 shows cross-section A-A’; Figure 2-11 shows cross-section<br />
B-B’, and Figure 2-12 shows cross-section C-C’.<br />
It should be noted that Figure 2-9, a geologic map of the MVGB and surrounding areas, is based on<br />
published geologic mapping by Saucedo (2005), Melody (2009), and Saucedo and Wagner (1992). The<br />
Saucedo and Wagner (2009) mapping was completed at a statewide scale and is therefore, less precise<br />
than other portions of the map and geological cross-sections. Accordingly, portions of the geologic map<br />
in Figure 2-9 do not correspond to the more detailed geological mapping and cross-sections.<br />
DRAFT for review purposes only. Use of contents on this sheet is subject to the limitations specified at the end of this document.<br />
P:\40000\140691 - PCWA <strong>Martis</strong> <strong>Valley</strong> GWP\GMP\Report\3rd Draft\<strong>Martis</strong> <strong>Valley</strong> GMP Draft 01-09-13.docx<br />
2-12
<strong>Martis</strong> <strong>Valley</strong> <strong>Groundwater</strong> <strong>Management</strong> <strong>Plan</strong> Section 2<br />
2.4.2 Stratigraphy<br />
The uplift along the faults that created the MVGB probably began during the late Pliocene and into the<br />
early Pleistocene, with relatively low-permeability Tertiary volcanics forming the bottom of the basin<br />
(considered basement rocks in this report). Prior to and throughout the middle Pliocene, the<br />
sedimentary material of the Truckee Formation was deposited in the MVGB, directly overlying andesite<br />
tuff breccias, andesite flows, and intrusive rocks of Tertiary age. Following deformation, the general<br />
topography of the <strong>Martis</strong> <strong>Valley</strong> was probably somewhat similar to today’s topography (Birkeland, 1963),<br />
with the Truckee River flowing out of the MVGB near where it does today, cutting a canyon through the<br />
pre-Pleistocene rocks of the Carson Range.<br />
During the Pleistocene, a series of volcanic flows occurred in the regional Truckee area. At least 20<br />
distinct flows have been recognized (Birkeland, 1961), mostly (but not exclusively) consisting of finegrained<br />
latites and basalts, and are noted as being fairly local in extent. Flows found in the MVGB<br />
include the Dry Lake Flows (QPvd), the Bald Mountain olivine latite (Qvbm), Alder Hill Basalt, Polaris<br />
olivine latite, and Hirschdale olivine latite. Collectively, these units are referred to as Lousetown<br />
volcanics (Qv) based on Birkeland’s (1963) correlation to other Lousetown flows in the Carson Range.<br />
Also included within the in the Lousetown Formation are interbedded Lousetown sediments (Qps); fluvial<br />
(stream) and lacustrine (lake) deposits accumulating, and thereby raising land surface elevation, in the<br />
valley between flow events.<br />
As volcanic activity waned, one of the last flows, the Hirschdale Olivine Latite, flowed across the Truckee<br />
River Canyon, damming the basin and causing widespread sediment accumulation and deposition of the<br />
Prosser Formation (Qpc), a partly-lacustrine and partly fluvial sedimentary unit (Birkeland, 1963). Brown<br />
(2010) has subdivided the Prosser Formation into Upper, Middle, and Lower Members. For geodatabase<br />
development purposes, interbedded Lousetown sediments are defined as being capped by volcanics,<br />
while the Prosser Formation is not. It is recognized however, that the lower Prosser Formation may have<br />
been deposited concurrently with the interbedded Lousetown sediments, and in some cases, may be<br />
correlated to these upper sediments where capping volcanics pinch out laterally.<br />
During this same period, Juniper Flat alluvium was being deposited in the Glenshire area with sediment<br />
derived from the paleo-Juniper Creek watershed and alluvium derived from the west.<br />
The Prosser Formation and volcanics in other areas are capped by glacial deposits, derived from glacial<br />
advances and retreats during a number of glacial episodes (Birkeland, 1961). In the MVGB, most of the<br />
deposits consist of glacial outwash deposits of varying age (Qgo). The outwash deposits consist of loose<br />
and unconsolidated boulder, cobble, gravel, and sand. In the vicinity of the Truckee River, three distinct<br />
outwash deposits (Qogo, Qtao, and Qti) are apparent and form terraces along the course of the river<br />
(Birkeland, 1961). A number of glacial moraines were also deposited, and are visible today in the vicinity<br />
of Donner Lake, the Tahoe-Donner residential neighborhood, and the Gateway Neighborhood of Truckee.<br />
2.4.3 Structure<br />
The MVGB lies within the Truckee Basin, a structural trough formed at the boundary of the Sierra Nevada<br />
and Basin and Range Geomorphic Provinces. Tectonics in this zone are complex and include active<br />
right-lateral (strike-slip) shear associated with the Pacific-North American Plate boundary and North<br />
Walker Lane Belt, as well as extensional (normal) faulting associated with the Basin and Range Province.<br />
The uplift along the faults that created the basin probably began during the late Pliocene and into the<br />
early Pleistocene (Birkeland, 1963), while right-lateral faulting is inferred to have occurred into the<br />
Holocene (Melody, 2009; Brown, 2010; Hunter and others, 2011). Most recently, the Polaris Fault has<br />
been mapped as an active North-South Holocene fault across the center of the MVGB. Identified faults<br />
are shown in Figure 2-13.<br />
DRAFT for review purposes only. Use of contents on this sheet is subject to the limitations specified at the end of this document.<br />
P:\40000\140691 - PCWA <strong>Martis</strong> <strong>Valley</strong> GWP\GMP\Report\3rd Draft\<strong>Martis</strong> <strong>Valley</strong> GMP Draft 01-09-13.docx<br />
2-18
<strong>Martis</strong> <strong>Valley</strong> <strong>Groundwater</strong> <strong>Management</strong> <strong>Plan</strong> Section 2<br />
2.5 <strong>Groundwater</strong> Occurrence and Movement<br />
The geologic units described above are interlayered, with complex spatial relationships, and as such, the<br />
occurrence and movement of groundwater within and between these units is variable. For this report,<br />
the low-permeability Miocene (Tertiary) volcanic rocks are considered the bottom of the MVGB. This<br />
section discusses where groundwater occurs, groundwater and surface water interaction, and water<br />
levels over time.<br />
2.5.1 <strong>Water</strong>-bearing Units and Properties<br />
The Truckee Formation (Tt) is composed of interlayered silts, sands, and clays, and therefore has<br />
variable groundwater availability. Well driller’s logs document sands and gravels within the Truckee<br />
Formation in the center of the basin, near the Truckee Tahoe Airport, at depths of approximately 900 to<br />
1,000 feet, and from 200 to 700 feet in the southern portion of the basin near Shaffer’s Mill and<br />
Lahontan Golf Clubs. Well yields in the Truckee Formation range from 280 gallons per minute (gpm) in<br />
the eastern portion of the basin (Hydro-Search, 1995) to more than 1,000 gpm in faulted areas<br />
underlying the Bald Mountain volcanics in the southwestern portions of the MVGB (Herzog, 2001).<br />
<strong>Water</strong> is found along faults and fractures within the Lousetown volcanics (Qv), though portions of the<br />
volcanic flows are massive and unfractured. Figure 2-14a is a photo of a Lousetown volcanic outcrop<br />
and illustrates the range of fracture concentrations that can occur in this unit. In most cases, water<br />
encountered in this fractured system is pressurized, rising to a static level several hundred feet higher<br />
than where initially encountered, suggesting the presence of confining units above these fracture zones.<br />
Wells located in the southern portion of the groundwater basin have been found to be artesian, or<br />
flowing, along fractures interpreted as faults (Herzog and Whitford, 2001), with yields ranging from<br />
approximately 250 to 1,000 gpm. A number of distinct fault blocks are present in this area, with unique<br />
and heterogeneous aquifer properties where faults serve as barriers to groundwater flow (ECO:LOGIC,<br />
2006; ECO:LOGIC, 2007; Bugenig, 2007; Bugenig, 2006; Peck and Herzog, 2008). <strong>Groundwater</strong><br />
discharge areas in the form of seeps and springs are also found within these areas and along the<br />
periphery of the MVGB (Figure 2-13), including thermal springs in the vicinity of the recently-mapped<br />
Polaris Fault (Hunter and others, 2011).<br />
The Prosser Formation (Qpc) includes interlayered silts, sands, and clays and has variable water bearing<br />
capacity. Figure 2-14b shows an outcrop of the Prosser Formation, where coarser materials such as<br />
sand and gravel are present, and moderate groundwater yields may be encountered. <strong>Water</strong>-bearing<br />
portions of the Prosser Formation may also be hydrologically connected to overlying glacial outwash and<br />
potentially surface water bodies as well. Well yields in these alluvial formations typically range from 12<br />
to 100 gpm, though larger-diameter production wells have estimated yields as high as 500 gpm<br />
according to State well driller’s logs.<br />
Hydraulic properties of the glacial moraines contrast sharply with those of the glacial outwash deposits;<br />
the moraines consist of poorly-sorted clay to boulder-size materials, while the glacial outwash deposits<br />
are primarily well-sorted sands and gravels. As a result, the glacial outwash tends to transmit water<br />
relatively easily, while moraines are typically water-limited.<br />
DRAFT for review purposes only. Use of contents on this sheet is subject to the limitations specified at the end of this document.<br />
P:\40000\140691 - PCWA <strong>Martis</strong> <strong>Valley</strong> GWP\GMP\Report\3rd Draft\<strong>Martis</strong> <strong>Valley</strong> GMP Draft 01-09-13.docx<br />
2-20
<strong>Martis</strong> <strong>Valley</strong> <strong>Groundwater</strong> <strong>Management</strong> <strong>Plan</strong> Section 2<br />
Figure 2-14a. Lousetown Volcanic Outcrop<br />
Figure 2-14b. Prosser Formation Outcrop Underlying Glacial Outwash<br />
DRAFT for review purposes only. Use of contents on this sheet is subject to the limitations specified at the end of this document.<br />
P:\40000\140691 - PCWA <strong>Martis</strong> <strong>Valley</strong> GWP\GMP\Report\3rd Draft\<strong>Martis</strong> <strong>Valley</strong> GMP Draft 01-09-13.docx<br />
2-21
<strong>Martis</strong> <strong>Valley</strong> <strong>Groundwater</strong> <strong>Management</strong> <strong>Plan</strong> Section 2<br />
2.5.2 Surface-groundwater interaction<br />
Generalized groundwater flow directions were inferred by Hydro-Search (1995) and were based on static<br />
water levels reported in State well drillers reports and DWR’s long-term well monitoring data, and<br />
indicated groundwater flow directions toward the Truckee River.<br />
A more detailed surface water and groundwater interaction study (Interflow Hydrology, 2003) was<br />
completed for the TDPUD. The Interflow Hydrology study provides estimates of the magnitude of stream<br />
losses and gains to and from groundwater across the <strong>Martis</strong> <strong>Valley</strong> during summer 2002, in the middle<br />
of a multi-year dry period. Observations made during the course of the study showed <strong>Martis</strong> Creek to be<br />
a ‘gaining stream’ (receiving groundwater discharge) across the Lahontan Golf Club, upstream of <strong>Martis</strong><br />
<strong>Valley</strong>; West <strong>Martis</strong> Creek was found to be a ‘losing stream’ as it enters <strong>Martis</strong> <strong>Valley</strong>, recharging<br />
groundwater between the Northstar Golf Course and its confluence with <strong>Martis</strong> Creek; and Middle <strong>Martis</strong><br />
Creek showed no loss or gain across the valley floor. <strong>Groundwater</strong> discharge in the form of springs<br />
generally support perennial flows in Lower East <strong>Martis</strong> and Dry Lake Creeks, as well as from the hillside<br />
adjacent to <strong>Martis</strong> Reservoir.<br />
Interflow Hydrology (2003) computed a basic water balance based on late season low flow<br />
measurements in the watershed and found that in October 2002, total streamflow losses across the<br />
<strong>Martis</strong> <strong>Valley</strong> floor were on the order of 0.65 cfs (approximately 9 percent of the total baseflow into the<br />
MVGB from <strong>Martis</strong> Creek), while losses at <strong>Martis</strong> Creek Lake were on the order of 1.55 cfs<br />
(approximately 29 percent of the total flow at that point). Evaporation and evapotranspiration by plants<br />
were not measured as part of the study; however, these data suggest that the <strong>Martis</strong> <strong>Valley</strong> floor<br />
potentially serves as a groundwater recharge area during the late summer and fall months.<br />
In addition, Interflow Hydrology (2003) identified groundwater recharge occurring where Prosser Creek<br />
enters the MVGB, just upstream of Prosser Reservoir. All other tributaries, including Cold, Donner, and<br />
Trout Creeks were concluded to be supported by groundwater discharge.<br />
2.5.3 <strong>Groundwater</strong> levels and Land Subsidence<br />
<strong>Groundwater</strong> levels have been generally stable in the <strong>Martis</strong> <strong>Valley</strong> with some declines occurring in<br />
specific regions. Figure 2-15 presents groundwater level monitoring data throughout much of the MVGB<br />
as measured by DWR since 1990 in a single set of hydrographs. This graph shows that overall<br />
groundwater levels have been stable in the MVGB, including during the drought of the early 1990s, and<br />
the wet years of the late 1990s.<br />
Figure 2-16 shows the locations of the 16 DWR monitoring wells and selected respective hydrographs.<br />
The hydrographs indicate that groundwater is locally variable in the MVGB, as levels may decline in some<br />
wells and rise in other wells over the same period of time. These data suggest that there may be several<br />
water-bearing zones in the MVGB that may or not be hydraulically connected. The hydrographs also<br />
provides the following well specific information:<br />
Well 17N16E11F001M (northeast of downtown Truckee) experienced a nearly 50-foot rise in water<br />
level in the late 1990s, and then declined steadily over the following decade. This rise coincides with<br />
above-average precipitation and streamflow (Figure 2-4).<br />
Levels in Well 17N17E29B001M (Northstar) and 17N17E19K001M (Truckee Airport) were relatively<br />
steady throughout the monitoring period until summer 2007, when seasonal fluctuations began to<br />
occur. <strong>Water</strong> levels have declined seven feet between 2007 and 2012.<br />
<strong>Groundwater</strong> levels in well 17N17E05D001M (Truckee River east of Truckee) have increased steadily<br />
over the period of record, rising over 10 feet from 1990 to 2012.<br />
In well 17N1E17F002M (Donner Creek area), groundwater levels fluctuated seasonally but generally<br />
remained constant year to year).<br />
DRAFT for review purposes only. Use of contents on this sheet is subject to the limitations specified at the end of this document.<br />
P:\40000\140691 - PCWA <strong>Martis</strong> <strong>Valley</strong> GWP\GMP\Report\3rd Draft\<strong>Martis</strong> <strong>Valley</strong> GMP Draft 01-09-13.docx<br />
2-22
<strong>Martis</strong> <strong>Valley</strong> <strong>Groundwater</strong> <strong>Management</strong> <strong>Plan</strong> Section 2<br />
<strong>Water</strong> Surface Elevation (feet)<br />
6150<br />
6100<br />
6050<br />
6000<br />
5950<br />
5900<br />
5850<br />
5800<br />
5750<br />
5700<br />
5650<br />
5600<br />
1990<br />
1991<br />
1992<br />
1993<br />
Figure 2-15. <strong>Water</strong> Levels in DWR Long-term <strong>Groundwater</strong> Monitoring Wells<br />
2.5.3.1 Land Subsidence<br />
Permanent land subsidence can occur when groundwater is removed by pumpage or drainage due to<br />
irreversible compression of aquitard materials. Limited data on land subsidence within the MVGB is<br />
available, but no indications of land subsidence have been reported in the documents reviewed as part<br />
of this evaluation.<br />
2.6 <strong>Groundwater</strong> Well Infrastructure<br />
1994<br />
1995<br />
1996<br />
1997<br />
The three partner agencies, hundreds of domestic pumpers, and a number of golf courses rely on the<br />
MVGB for drinking water and irrigation supplies. The TDPUD provides water service to portions of the<br />
Town of Truckee and adjacent unincorporated areas of Nevada and <strong>Placer</strong> Counties. The TDPUD<br />
currently has 13 active production wells for potable water service, plus 3 wells to serve non-potable<br />
water demands. PCWA’s Eastern <strong>Water</strong> System (Zone 4) currently includes two production wells,<br />
Lahontan Well #1 and Lahontan Well #2, to serve the Lahontan Golf Club, Shaffer’s Mill Golf Club,<br />
Hopkins Ranch, and <strong>Martis</strong> Camp Residences. PCWA is planning to develop a third permanent<br />
groundwater production well to serve planned development in and around the existing communities,<br />
including Shaffer’s Mill Golf Club (Tully and Young, 2011). NCSD supplies water to residents and guests<br />
in the Northstar community, producing water from one production well (TH-2) with an estimated yield of<br />
800 gpm. NCSD is currently working to bring a second well (TH-1) online during summer 2012 with a<br />
similar anticipated yield. Table 2-2 summarizes the estimated yields and production rates associated<br />
with these wells.<br />
DRAFT for review purposes only. Use of contents on this sheet is subject to the limitations specified at the end of this document.<br />
P:\40000\140691 - PCWA <strong>Martis</strong> <strong>Valley</strong> GWP\GMP\Report\3rd Draft\<strong>Martis</strong> <strong>Valley</strong> GMP Draft 01-09-13.docx<br />
1998<br />
1999<br />
2000<br />
17N16E11F001M 17N16E13H001M 17N16E13K001M<br />
17N16E13K003M 17N16E13K004M 17N16E17F002M<br />
17N16E19G001M 17N17E05D001M 17N17E06D001M<br />
17N17E07P001M 17N17E18C001M 17N17E18E001M<br />
17N17E19K001M 17N17E29B001M 18N16E22H001M<br />
18N17E33L001M<br />
2001<br />
2002<br />
2003<br />
2004<br />
2005<br />
2006<br />
2007<br />
2008<br />
2009<br />
2010<br />
2011<br />
2-23
<strong>Martis</strong> <strong>Valley</strong> <strong>Groundwater</strong> <strong>Management</strong> <strong>Plan</strong> Section 2<br />
NCSD<br />
Table 2-2. Estimated Yield of Public Agency Production Wells a<br />
Well Name Estimated Maximum Yield (gpm)<br />
TH-2 800<br />
TH-1 (anticipated in 2012) 800 (estimated)<br />
PCWA<br />
Lahontan Well 1 1,400<br />
Lahontan Well 2 1,400<br />
TDPUD<br />
A Well 160<br />
Airport 2,140<br />
Prosser Annex 460<br />
Glenshire Drive 1,725<br />
<strong>Martis</strong> <strong>Valley</strong> No. 1 1,585<br />
Northside 575<br />
Southside No. 2 200<br />
Southside No. 1 (non-potable) N/A<br />
Sanders 290<br />
Old Greenwood 870<br />
Hirschdale 35<br />
Prosser Heights 360<br />
Prosser Village 800<br />
Well No. 20 540<br />
Fibreboard (non-potable) N/A<br />
Donner Creek (non-potable) N/A<br />
a Well Yield information provided by NCSD, PCWA (Tully and Young, 2011),<br />
and TDPUD (Kaufman, 2011)<br />
A number of private wells are distributed across the basin, and a number of residential neighborhoods or<br />
tracts have relatively higher concentrations of wells. <strong>Martis</strong> Camp operates 2 irrigation wells for their<br />
own use and provides Northstar with water from these wells for snowmaking and irrigation purposes as<br />
well (Josh Detweiller, NCSD, pers. comm.). At higher elevations in the eastern portion of the basin, the<br />
Juniper Hills area includes a number of estates, most of which rely on private wells drilled deep (typically<br />
500 to 800 feet) into uplifted Lousetown volcanics and/or deeper volcanics. In the center of the MVGB,<br />
a high density of relatively shallow (200 to 300 feet deep) private wells have been drilled and are in use<br />
along Prosser Dam Road. Many of these are drilled into shallow Lousetown volcanics, while others are<br />
drilled into glacial outwash and the Prosser Formation. In the northwestern portion of the MVGB a<br />
number of homes located on Alder Hill have domestic wells drilled primarily into uplifted Lousetown<br />
volcanics and range in depth from 300 to 800 feet.<br />
DRAFT for review purposes only. Use of contents on this sheet is subject to the limitations specified at the end of this document.<br />
P:\40000\140691 - PCWA <strong>Martis</strong> <strong>Valley</strong> GWP\GMP\Report\3rd Draft\<strong>Martis</strong> <strong>Valley</strong> GMP Draft 01-09-13.docx<br />
2-25
<strong>Martis</strong> <strong>Valley</strong> <strong>Groundwater</strong> <strong>Management</strong> <strong>Plan</strong> Section 2<br />
Figure 2-17 is a cumulative frequency plot derived from DWR data, and shows the number of public and<br />
domestic wells drilled at various depths in the MVGB. These data show that the vast majority of<br />
domestic wells drilled in the area are relatively shallow, with 50% of domestic wells being installed at<br />
depths of 300 feet below ground surface or less, while the public production wells range widely in depth.<br />
Figure 2-17. Depth Distribution of Wells in the <strong>Martis</strong> <strong>Valley</strong> <strong>Groundwater</strong> Basin<br />
2.7 <strong>Groundwater</strong> Quality<br />
<strong>Groundwater</strong> quality in the MVGB is generally of good quality and is currently monitored as part of the<br />
agencies’ agreements with DPH. Each agency releases an annual water quality report for their service<br />
areas in the MVGB; the 2011 annual reports are included in Appendix E. The USGS carried out<br />
groundwater monitoring activities in the MVGB in cooperation with the California State <strong>Water</strong> Resources<br />
Control Board (SWRCB) as part of the California <strong>Groundwater</strong> Ambient Monitoring and Assessment<br />
(GAMA) Program (Fram and others, 2007), and sampled 14 wells in the MVGB for a wide range of<br />
constituents during summer 2007. The concentrations of most constituents detected in these samples<br />
were below drinking-water thresholds, with some exceptions: a) concentrations of arsenic were above<br />
the Maximum Contaminant Level (MCL) in 4 of the 14 wells sampled, and b) manganese concentrations<br />
were elevated above the MCL in one well. Arsenic levels above the MCL have also been reported by the<br />
TDPUD.<br />
The T-TSA operates a water reclamation plant which includes the discharge of tertiary-treated effluent<br />
into glacial outwash and Prosser Formation alluvium downstream of the Town of Truckee on the south<br />
side of the Truckee River. Hydrogeologic investigations in the vicinity of the plant indicate that effluent<br />
flows laterally toward the Truckee River and <strong>Martis</strong> Creek, discharging to these water bodies after a<br />
DRAFT for review purposes only. Use of contents on this sheet is subject to the limitations specified at the end of this document.<br />
P:\40000\140691 - PCWA <strong>Martis</strong> <strong>Valley</strong> GWP\GMP\Report\3rd Draft\<strong>Martis</strong> <strong>Valley</strong> GMP Draft 01-09-13.docx<br />
2-26
<strong>Martis</strong> <strong>Valley</strong> <strong>Groundwater</strong> <strong>Management</strong> <strong>Plan</strong> Section 2<br />
minimum 50 day travel time (CH2MHill, 1974). DWR (2003) noted that a water quality monitoring<br />
program is in place to evaluate potential changes to ground- and surface-water quality.<br />
Sixty-three leaking underground storage tank (LUST) cleanup sites have been identified by the SWRCB’s<br />
GeoTracker database in the MVGB. Of these 63 sites, cleanup actions for 49 are documented as<br />
“completed”, while 14 are listed as “open” or “active.” All the sites are located in the Town of Truckee,<br />
except for one active site in Hirschdale.<br />
2.8 Land Use<br />
Prior to the 1950s, land use in <strong>Martis</strong> <strong>Valley</strong> and the Truckee area was primarily ranching and timber<br />
related (Shaw and others, 2012). During the 1950s, 60s, and 70s, the rural ranching- and timber-based<br />
economy began shifting to more recreational and community development. Today, the primary land<br />
uses in the MVGB are residential and ski and/or golf resort related communities with commercial<br />
centers in and near downtown Truckee and at the Truckee Airport. Timber and sand and gravel mining<br />
operations still continue to operate on a seasonal basis (Shaw and others, 2012).<br />
2.9 <strong>Groundwater</strong> Recharge<br />
Several previous studies estimated groundwater recharge within the MVGB using water balance and<br />
empirical data, resulting in a range from 18,000 to 34,560 acre-feet per year. Recently, DRI has<br />
developed annual groundwater recharge estimates using the physically-based PRMS. Table 2-3<br />
summarizes previous and current studies including the study’s author, year, and average annual<br />
groundwater recharge estimates.<br />
Hydro-Search<br />
Table 2-3. Summary of Average Annual <strong>Groundwater</strong> Recharge<br />
Estimates for the MVGB<br />
Author Year Recharge (ac-ft/yr)<br />
1974,<br />
1980,<br />
1995<br />
18,000<br />
Nimbus Engineers 2001 24,700<br />
Kennedy/Jenks Consultants 2001 none<br />
Interflow Hydrology, Inc. and Cordilleran Hydrology, Inc 2003 34,560<br />
DRI, PRMS estimate<br />
DRI, modified Maxey-Eakin method<br />
DRAFT for review purposes only. Use of contents on this sheet is subject to the limitations specified at the end of this document.<br />
P:\40000\140691 - PCWA <strong>Martis</strong> <strong>Valley</strong> GWP\GMP\Report\3rd Draft\<strong>Martis</strong> <strong>Valley</strong> GMP Draft 01-09-13.docx<br />
2012<br />
32,745<br />
35,168<br />
DRI outlines its scientific and technical methods, including the climate data used, the PRMS method,<br />
and total recharge estimates in a Technical Note, which is included in Appendix F. PRMS simulates land<br />
surface hydrologic processes of evapotranspiration, runoff, infiltration, and interflow by balancing energy<br />
and mass budgets of the plant canopy, snowpack, and soil zone on the basis of distributed climate<br />
information. The PRMS computed recharge consists of the sum of shallow infiltrated water that<br />
discharges into the Truckee River and its tributaries as well as deep percolation of ground water to<br />
deeper aquifers with water supply wells (Rajagopal and others, 2012). DRI’s study “…also applied a<br />
modified Maxey-Eakin (1949) method to estimate recharge which relates mean annual precipitation to<br />
recharge using recharge coefficients applied to precipitation amounts.”<br />
The PRMS is modeled for the years 1983 to 2011 with annual recharge estimates ranging from 12,143<br />
ac-ft/yr (dry year) to 56,792 ac-ft/yr (wet year), with an average annual recharge estimate of 32,745 ac-<br />
2-27
<strong>Martis</strong> <strong>Valley</strong> <strong>Groundwater</strong> <strong>Management</strong> <strong>Plan</strong> Section 2<br />
ft/yr. Because annual precipitation drives recharge, the PRMS simulated recharge varies from year to<br />
year. DRI included in its Technical Note annual recharge efficiency, or the ratio of annual recharge to<br />
annual precipitation. For the MVGB, the calculated annual recharge efficiency is 18-26%. Figure 2-18<br />
shows the average annual groundwater recharge as simulated by the PRMS model, for a period of record<br />
from 1983 to 2011. Figure 2-19 shows the annual recharge for the year 1988, a dry year. Figure 2-20<br />
shows the annual recharge for the year 1995, a wet year.<br />
2.10 <strong>Water</strong> Use<br />
<strong>Groundwater</strong> use in the MVGB is primarily for municipal, domestic, and recreational uses. The TDPUD<br />
and PCWA have summarized water supply and demand as part of Urban <strong>Water</strong> <strong>Management</strong> <strong>Plan</strong>s<br />
completed for their respective service areas (Tully and Young, 2011; Kaufman, 2011). Average potable<br />
day demand served by the TDPUD in 2010 was reported to be 4.53 million gallons per day (mgd); 5,073<br />
acre-feet per year (ac-ft/yr)). From 2005 to 2009, production from PCWA wells has increased from an<br />
average day demand of 0.04 to 0.13 mgd (44 to 141 ac-ft/yr).<br />
NCSD meets demand primarily from its Big Springs collection system, outside of the MVGB, and uses<br />
water pumped from TH-2 (and in the future, TH-1) to augment this supply (J. Detwiler, pers. comm.).<br />
Demand on the MVGB imposed by NCSD operations is best represented by pumping records from Well<br />
TH-2. Annual water volumes pumped by NCSD averaged 0.18, 0.36, and 0.29 mgd (200, 398, and 320<br />
ac-ft/yr) in water years 2008, 2009, and 2010, respectively.<br />
Nine golf courses depend on the MVGB for irrigation supply; four are supplied by TDPUD (one uses a<br />
potable supply and 3 are non-potable), 1 is supplied by NCSD (potable), and 4 are supplied privately and<br />
assumed to be all non-potable. Using the partner agencies records of non-potable water pumped and<br />
supplied to the majority of the courses, the average non-potable demands range from 0.19 ac-ft/yr to<br />
0.25 ac-ft/yr (210 ac-ft/yr to 279 ac-ft/yr), with an average of 0.24 mgd (272 ac-ft/yr). This average<br />
demand rate of 0.24 mgd is applied to the four privately-supplied courses for an estimated production of<br />
993 ac-ft/yr.<br />
Based on the available data and summarized in Table 2-4, current annual production from the MVGB is<br />
estimated to be approximately 9,341 ac-ft/yr. Kaufman (2011) estimates buildout water demand for all<br />
users in the MVGB to be approximately 21,000 ac-ft/yr.<br />
TDPUD<br />
Table 2-4. Estimated Current <strong>Groundwater</strong> Production<br />
mgd ac-ft/yr<br />
Potable - Average (2007-2010) 5.78 6,475<br />
Golf Course non-potable – Average (2001-2011) 0.75 837<br />
PCWA<br />
Potable – Average (2009) 0.10 141<br />
NCSD<br />
Potable - Average (2008-2010) 0.08 96<br />
Golf Course (potable) – Average (2009-2011) 0.19 210<br />
Snowmaking (<strong>Water</strong> Year 2011) 0.53 589<br />
Privately Supplied Golf Courses<br />
Total estimated non-potable production 0.96 993<br />
Estimated Total Demand 8.39 9,341<br />
DRAFT for review purposes only. Use of contents on this sheet is subject to the limitations specified at the end of this document.<br />
P:\40000\140691 - PCWA <strong>Martis</strong> <strong>Valley</strong> GWP\GMP\Report\3rd Draft\<strong>Martis</strong> <strong>Valley</strong> GMP Draft 01-09-13.docx<br />
2-28
Independence<br />
Lake<br />
Donner Euer <strong>Valley</strong><br />
P:\40000\140691 - PCWA <strong>Martis</strong> <strong>Valley</strong> GWP\GIS\MAPDOCS\WORKING\Fig2-18_MV_Recharge1988_8x11_20120820.mxd<br />
INDE PENDENCE CR<br />
Legend<br />
South Fork Prosser Creek<br />
Donner Lake<br />
Cold Creek<br />
Mtn Meadow Lake<br />
SAGEHEN CR<br />
Donner Creek<br />
DATE PROJECT<br />
SITE<br />
9-17-12<br />
<strong>Martis</strong> <strong>Valley</strong> <strong>Groundwater</strong> Basin<br />
Truckee River<br />
Streams<br />
Alder Creek<br />
<strong>Groundwater</strong> Recharge 1983-2011 Average<br />
Inches / Year<br />
0<br />
0 - 5<br />
5 - 10<br />
10 - 15<br />
15 - 20<br />
20 - 25<br />
Source: 2012 Desert Research Institute (DRI)<br />
140691<br />
TITLE<br />
89<br />
89<br />
Truckee<br />
Prosser Creek Res<br />
I-80<br />
MARTIS CR<br />
Stampede Reservoir<br />
TRU CKEE R<br />
Dry Creek<br />
<strong>Martis</strong><br />
Creek Lake<br />
267<br />
Boca<br />
Reservoir<br />
Dry Lake<br />
M id dle <strong>Martis</strong> Cree k<br />
<strong>Martis</strong> <strong>Valley</strong> <strong>Groundwater</strong> Basin, California<br />
Average Annual <strong>Groundwater</strong> Recharge 1983-2011<br />
0<br />
NORTH<br />
Miles<br />
2<br />
TRUCKEE R<br />
Juniper Cr ek<br />
Lake Tahoe<br />
I-80<br />
28<br />
Figure<br />
2-18
Independence<br />
Lake<br />
Donner Euer <strong>Valley</strong><br />
P:\40000\140691 - PCWA <strong>Martis</strong> <strong>Valley</strong> GWP\GIS\MAPDOCS\WORKING\Fig2-19_MV_Recharge1988_8x11_20120820.mxd<br />
INDE PENDENCE CR<br />
Legend<br />
South Fork Prosser Creek<br />
Donner Lake<br />
Cold Creek<br />
Mtn Meadow Lake<br />
SAGEHEN CR<br />
Donner Creek<br />
DATE PROJECT<br />
SITE<br />
9-17-12<br />
<strong>Martis</strong> <strong>Valley</strong> <strong>Groundwater</strong> Basin<br />
Truckee River<br />
Streams<br />
<strong>Groundwater</strong> Recharge 1988<br />
Inches / Year<br />
0<br />
0 - 2<br />
2 - 4<br />
4 - 6<br />
6 - 8<br />
8 - 10<br />
10 - 12<br />
Alder Creek<br />
Source: 2012 Desert Research Institute (DRI)<br />
140691<br />
TITLE<br />
89<br />
89<br />
Truckee<br />
Prosser Creek Res<br />
I-80<br />
MARTIS CR<br />
Stampede Reservoir<br />
TRU CKEE R<br />
Dry Creek<br />
<strong>Martis</strong><br />
Creek Lake<br />
267<br />
Boca<br />
Reservoir<br />
Dry Lake<br />
M id dle <strong>Martis</strong> Cree k<br />
<strong>Martis</strong> <strong>Valley</strong> <strong>Groundwater</strong> Basin, California<br />
Annual <strong>Groundwater</strong> Recharge 1988<br />
0<br />
NORTH<br />
Miles<br />
2<br />
TRUCKEE R<br />
Juniper Cr ek<br />
Lake Tahoe<br />
I-80<br />
28<br />
Figure<br />
2-19
Independence<br />
Lake<br />
Donner Euer <strong>Valley</strong><br />
P:\40000\140691 - PCWA <strong>Martis</strong> <strong>Valley</strong> GWP\GIS\MAPDOCS\WORKING\Fig2-20_MV_Recharge1995_8x11_20120820.mxd<br />
INDE PENDENCE CR<br />
Legend<br />
South Fork Prosser Creek<br />
Donner Lake<br />
Cold Creek<br />
Mtn Meadow Lake<br />
SAGEHEN CR<br />
Donner Creek<br />
DATE PROJECT<br />
SITE<br />
9-7-12<br />
<strong>Martis</strong> <strong>Valley</strong> <strong>Groundwater</strong> Basin<br />
Truckee River<br />
Streams<br />
<strong>Groundwater</strong> Recharge 1995<br />
Inches / Year<br />
0<br />
0 - 5<br />
5 - 10<br />
10 - 15<br />
15 - 20<br />
20 - 25<br />
25 - 30<br />
30 - 35<br />
Alder Creek<br />
Source: 2012 Desert Research Institute (DRI)<br />
140691<br />
TITLE<br />
89<br />
89<br />
Truckee<br />
Prosser Creek Res<br />
I-80<br />
MARTIS CR<br />
Stampede Reservoir<br />
TRU CKEE R<br />
Dry Creek<br />
<strong>Martis</strong><br />
Creek Lake<br />
267<br />
Boca<br />
Reservoir<br />
Dry Lake<br />
M id dle <strong>Martis</strong> Cree k<br />
<strong>Martis</strong> <strong>Valley</strong> <strong>Groundwater</strong> Basin, California<br />
Annual <strong>Groundwater</strong> Recharge 1995<br />
0<br />
NORTH<br />
Miles<br />
2<br />
TRUCKEE R<br />
Juniper Cr ek<br />
Lake Tahoe<br />
I-80<br />
28<br />
Figure<br />
2-20
Section 3<br />
<strong>Plan</strong> Implementation<br />
The partner agencies are already performing many of the groundwater management activities<br />
associated with an AB 3030 GMP. Through GMP implementation, the partner agencies formalize their<br />
groundwater management goal, BMOs, and implementation actions that elaborate on both current<br />
actions and planned future actions under the GMP. As discussed in Section 1.6 and shown on Tables 1-<br />
2, 1-3, and 1-4, a number of required, voluntary, and suggested components constitute a GMP.<br />
This chapter discusses implementation actions that are grouped under each BMO. The BMOs are fully<br />
described in Section 1.5, and are listed below:<br />
1. Manage groundwater to maintain established and planned uses.<br />
2. Manage groundwater use within the provisions of the Truckee River Operating Agreement.<br />
3. Collaborate and cooperate with groundwater users and stakeholders in the <strong>Martis</strong> <strong>Groundwater</strong><br />
Basin.<br />
4. Protect groundwater quantity and quality.<br />
5. Pursue and use the best available science and technology to inform the decision making process.<br />
6. Consider the environment and participate in the stewardship of groundwater resources.<br />
3.1 Implementation Actions that Support BMO #1 - Manage<br />
<strong>Groundwater</strong> to Maintain Established and <strong>Plan</strong>ned Uses<br />
The MVGB is the primary source of water to multiple users under separate jurisdictions. BMO #1<br />
encourages the partner agencies to pursue management of groundwater that is within their jurisdiction<br />
in order to protect existing uses.<br />
Implementation actions identified as falling under BMO #1 facilitate the management of groundwater in<br />
the MVGB. These implementation actions are focused on regular communication and consideration of<br />
future programs intended to protect the groundwater resource from degradation and depletion.<br />
3.1.1 Develop and implement a summary report every five years<br />
This action is intended to concentrate and document GMP activity, data, and management decisions into<br />
periodic reports for use by partner agencies, Stakeholders, and local planning agencies for continual<br />
groundwater management decisions and maintenance.<br />
This implementation action provides a report every five years that summarizes groundwater conditions<br />
and management activities, and presents an opportunity to update and improve the GMP. The summary<br />
report will include:<br />
A summary of monitoring results with a discussion of historical trends.<br />
A summary of management actions during the period covered by the report.<br />
A discussion of whether actions are achieving progress towards meeting BMOs.<br />
A summary of proposed management actions for the future.<br />
A summary of any GMP changes that occurred during the period covered by the report.<br />
A summary of actions taken to coordinate with other water and land agencies and other government<br />
agencies.<br />
DRAFT for review purposes only. Use of contents on this sheet is subject to the limitations specified at the end of this document.<br />
P:\40000\140691 - PCWA <strong>Martis</strong> <strong>Valley</strong> GWP\GMP\Report\3rd Draft\<strong>Martis</strong> <strong>Valley</strong> GMP Draft 01-09-13.docx<br />
3-1
<strong>Martis</strong> <strong>Valley</strong> <strong>Groundwater</strong> <strong>Management</strong> <strong>Plan</strong> Section 3<br />
Recommendation of updates and changes to the GMP.<br />
3.1.2 Compile an annual summary of groundwater monitoring data<br />
This action will compile, organize and evaluate groundwater level elevation and groundwater quality<br />
monitoring data collected during the previous year. The annual summary of monitoring data will include<br />
groundwater level monitoring information from the partner agencies water level monitoring efforts, and<br />
water quality data collected by the partner agencies from production wells. The annual summary of<br />
groundwater monitoring data will be used by the agencies at the annual GMP implementation meeting<br />
described in Section 3.1.3 to evaluate the need to implement other portions of the GMP that are<br />
contingent on monitoring data. The annual summary of groundwater monitoring data will also be<br />
included in the five year summary report.<br />
3.1.3 Partner agencies to meet annually to discuss GMP implementation<br />
This action will require the partnership agencies to meet at least once annually to discuss GMP<br />
implementation. Currently, the partner agencies meet in the Truckee area annually and GMP<br />
implementation will be added as an agenda item during this annual meeting.<br />
3.1.4 Support TROA provisions associated with well construction, repair, modification, and<br />
destruction<br />
The Settlement Act may eventually establish additional requirements for the siting and construction of<br />
wells drilled in the Truckee River Basin, which includes the MVGB. Section 6.E of TROA outlines Truckee<br />
River basin allocation procedures including well construction, repair, modification and destruction to<br />
address groundwater-surface water interactions within the Truckee River Basin including areas of <strong>Martis</strong><br />
<strong>Valley</strong>. Section 204(c)(1)(B) of the Settlement Act provides that, “...all new wells drilled after the date of<br />
enactment of this title shall be designed to minimize any short-term reductions of surface streamflows to<br />
the maximum extent feasible.” This implementation action supports the implementation of TROA’s well<br />
construction guidelines.<br />
3.1.5 Evaluate and consider taking a position on relevant water resources-related policies,<br />
programs, and projects under consideration by local, State and Federal agencies<br />
Throughout the state, surface water and groundwater resource management are becoming critical<br />
components of meeting growing water supply demands. As part of this implementation action, the<br />
partner agencies will actively evaluate and consider policies, programs and projects that may impact<br />
water resources quality and/or quantity within the <strong>Martis</strong> <strong>Valley</strong>.<br />
3.1.6 Pursue opportunities for improved groundwater basin monitoring and reporting with<br />
local, State, and Federal agencies<br />
This implementation action prompts the partner agencies to continuously pursue opportunities and<br />
funding that may provide additional groundwater data collection and/or reporting. <strong>Groundwater</strong><br />
monitoring is a critical component in understanding the physical condition of the groundwater basin and<br />
is further described in Section 3.3.1.<br />
3.1.7 Evaluate the need for programs to facilitate saline intrusion control, mitigate the<br />
migration of contaminated groundwater, facilitate conjunctive use, and to mitigate<br />
overdraft<br />
This implementation action includes evaluation of a variety of potential programs to manage<br />
groundwater within the jurisdiction of the partner agencies. As part of this action, the agencies will<br />
DRAFT for review purposes only. Use of contents on this sheet is subject to the limitations specified at the end of this document.<br />
P:\40000\140691 - PCWA <strong>Martis</strong> <strong>Valley</strong> GWP\GMP\Report\3rd Draft\<strong>Martis</strong> <strong>Valley</strong> GMP Draft 01-09-13.docx<br />
3-2
<strong>Martis</strong> <strong>Valley</strong> <strong>Groundwater</strong> <strong>Management</strong> <strong>Plan</strong> Section 3<br />
evaluate the need for saline intrusion controls, mitigation of the migration of contaminated groundwater,<br />
conjunctive use programs, and overdraft mitigation.<br />
Currently, the groundwater supply in <strong>Martis</strong> <strong>Valley</strong> is not threatened by saline intrusion, contaminant<br />
plumes, or in a state of overdraft that would warrant immediate steps for mitigation. Saline intrusion is a<br />
primary concern along coastal areas with intruding sea water, which is high in Total Dissolved Solids<br />
(TDS) that may threaten fresh groundwater supplies. Saline conditions may also occur in interior basins.<br />
In the <strong>Martis</strong> <strong>Valley</strong>, groundwater monitoring (discussed under Section 3.4), will assist in identifying<br />
saline issues. Should future monitoring indicate that saline intrusion is a potential problem in the MVGB,<br />
the partner agencies will evaluate development of a saline intrusion control program.<br />
<strong>Groundwater</strong> contamination in the MVGB falls under the jurisdiction of the Lahontan Regional <strong>Water</strong><br />
Quality Control Board (LRWQCB). Should monitoring indicate a large scale groundwater contamination<br />
issue, the partner agencies will share knowledge of the issue and collaborate with the LRWQCB. If<br />
monitoring indicates that contaminated groundwater is migrating, the partner agencies will further<br />
collaborate with the LRWQCB to mitigate the migration.<br />
Conjunctive use is the management of surface water and groundwater to optimize the yield of the overall<br />
water resource. One method would be to rely primarily on surface water in wet years and groundwater in<br />
dry years. Other methods employ artificial recharge, where surface water is intentionally stored into<br />
aquifers for later use. NCSD currently manages both its springwater and groundwater supply and TDPUD<br />
currently relies solely on groundwater but maintains water rights to several springs. <strong>Groundwater</strong> is<br />
PCWA’s only supply source. The partner agencies will evaluate opportunities to increase the use of<br />
conjunctive management as they arise within the MVGB.<br />
<strong>Groundwater</strong> overdraft occurs when pumping exceeds recharge to a groundwater basin. If monitoring<br />
indicates through declining groundwater levels that groundwater overdraft is occurring, the partner<br />
agencies will consider development of programs to mitigate the groundwater overdraft.<br />
3.1.8 Consider development of contamination cleanup, recharge, storage, conservation<br />
and water recycling projects<br />
This implementation action includes evaluation of a variety of potential programs to manage<br />
groundwater within the jurisdiction of the partner agencies. As part of this action, the partner agencies<br />
will consider development of projects that cleanup contamination, increase groundwater recharge and<br />
storage, or increase conservation and water recycling.<br />
The LRWQCB is responsible for developing and enforcing water quality objectives and plans that best<br />
protect the State’s waters within its hydrologic area. Should monitoring indicate that contaminated<br />
groundwater is a threat to groundwater supplies, the partner agencies will consider collaborating with<br />
the LRWQCB.<br />
During GMP implementation, opportunities may arise for the partner agencies to engage in activities<br />
related to groundwater recharge, storage, conservation and recycling. As those opportunities arise, the<br />
agencies will consider participating in projects to improve groundwater recharge, storage, conservation<br />
and recycling efforts.<br />
3.1.9 Pursue funding sources for implementation of plan policies, programs, reporting<br />
and projects<br />
This implementation action directs the partner agencies to pursue funds from Federal, State and other<br />
sources as they become available and are beneficial to pursue. Funding sources may include Local<br />
<strong>Groundwater</strong> Assistance (LGA) grants and Integrated Regional <strong>Water</strong> <strong>Management</strong> <strong>Plan</strong>ning (IRWMP)<br />
DRAFT for review purposes only. Use of contents on this sheet is subject to the limitations specified at the end of this document.<br />
P:\40000\140691 - PCWA <strong>Martis</strong> <strong>Valley</strong> GWP\GMP\Report\3rd Draft\<strong>Martis</strong> <strong>Valley</strong> GMP Draft 01-09-13.docx<br />
3-3
<strong>Martis</strong> <strong>Valley</strong> <strong>Groundwater</strong> <strong>Management</strong> <strong>Plan</strong> Section 3<br />
grants from DWR, grants from the California Department of Public Health (DPH), various funds available<br />
through collaboration with the U.S. Bureau of the Interior, and other agencies.<br />
3.1.10 Participate in the evaluation of relevant local projects to maintain groundwater<br />
quantity and quality<br />
Local groups and local, State or Federal agencies may develop opportunities that seek support or<br />
assistance for projects that affect groundwater quantity and/or quality in the <strong>Martis</strong> <strong>Valley</strong>. This action<br />
directs the partner agencies to participate in relevant local projects as appropriate and reasonable.<br />
3.1.11 Summary of BMO #1 Actions<br />
Table 3-1 presents a summary of implementation actions to be undertaken by the partner agencies that<br />
support BMO #1 including the anticipated schedule of implementation.<br />
Table 3-1. Summary BMO#1 Supporting Implementation Actions<br />
Description of Action<br />
1-1 Develop and implement a summary report every five years that includes:<br />
A summary of monitoring results, with a discussion of historical trends<br />
A summary of management actions during the period covered by the report<br />
A discussion of whether actions are achieving progress towards meeting BMOs<br />
A summary of proposed management actions for the future<br />
A summary of any GMP changes that occurred during the period covered by the report<br />
A summary of actions taken to coordinate with other water and land agencies and other government agencies<br />
Review of the GMP and consider updates to the GMP<br />
1-2 Compile an annual summary of groundwater monitoring data Annually<br />
1-3 Partner agencies to meet annually to discuss GMP implementation Annually<br />
1-4 Support TROA provisions associated with well construction, repair, modification, and destruction As Needed<br />
1-5 Evaluate and consider taking a position on relevant water resource-related policies, programs, and projects under<br />
consideration by local, State and Federal agencies<br />
1-6 Pursue opportunities for improved groundwater basin monitoring and reporting with local, State, and Federal<br />
agencies<br />
1-7 Evaluate the need for programs to facilitate saline intrusion control, mitigate the migration of contaminated<br />
groundwater, facilitate conjunctive use, and to mitigate overdraft<br />
DRAFT for review purposes only. Use of contents on this sheet is subject to the limitations specified at the end of this document.<br />
P:\40000\140691 - PCWA <strong>Martis</strong> <strong>Valley</strong> GWP\GMP\Report\3rd Draft\<strong>Martis</strong> <strong>Valley</strong> GMP Draft 01-09-13.docx<br />
Implementation<br />
Schedule<br />
Once every five years, first<br />
summary report to be<br />
completed in 2018<br />
As Needed<br />
As Needed<br />
As Needed<br />
1-8 Consider development of contamination cleanup, recharge, storage, conservation and water recycling projects As Needed<br />
1-9 Pursue funding sources for implementation of plan policies, programs, reporting and projects Ongoing<br />
1-10 Participate in the evaluation of relevant local projects to maintain groundwater quantity and quality As Needed<br />
3.2 Implementation Actions that Support BMO #2 - Manage<br />
<strong>Groundwater</strong> within the Provisions of TROA<br />
The Settlement Act, Public Law 101-618 (1990), established entitlements to the waters of Lake Tahoe,<br />
the Truckee River and its tributaries, and how the storage reservoirs of the Truckee River are operated.<br />
Section 205 of the Settlement Act directs the Secretary of the Department of the Interior to negotiate an<br />
operating agreement for the operation of Truckee River reservoirs, between DWR, Nevada, Nevada<br />
3-4
<strong>Martis</strong> <strong>Valley</strong> <strong>Groundwater</strong> <strong>Management</strong> <strong>Plan</strong> Section 3<br />
Energy (formerly Sierra Pacific Power Company), Pyramid Tribe, and the United States Bureau of<br />
Reclamation. The operating agreement is known as TROA.<br />
Section 204(c)(1) of the Settlement Act outlines the allocation of 32,000 acre-feet of water (both surface<br />
and groundwater) to the State of California from within the Truckee River Basin. The Settlement Act may<br />
eventually establish additional requirements for the siting and construction of wells drilled in the Truckee<br />
River Basin, which includes the MVGB. Section 6.E of TROA outlines Truckee River Basin allocation<br />
procedures including surface water diversions and water accounting procedures. Article 10 of TROA<br />
identifies well construction, repair, modification and destruction to address groundwater-surface water<br />
interactions within the Truckee River Basin including areas of <strong>Martis</strong> <strong>Valley</strong>. Section 204(c)(1)(B) of the<br />
Settlement Act provides that, “...all new wells drilled after the date of enactment of this title shall be<br />
designed to minimize any short-term reductions of surface streamflows to the maximum extent feasible.”<br />
Article 10 of TROA requires that new water supply wells be designed to minimize impacts to surface<br />
water and outlines siting and design processes. Wells drilled or under construction before May 1, 1996<br />
are presumed to comply with the Settlement Act.<br />
This BMO documents the partner agencies’ commitment to continue to comply with provisions of TROA.<br />
There are provisions in TROA that apply to groundwater and water wells within the Truckee River Basin<br />
(which includes the <strong>Martis</strong> <strong>Valley</strong>) to address potential adverse impacts to surface water.<br />
3.2.1 Continue coordination and collaboration with TROA agencies on groundwater<br />
management issues and source well development<br />
This implementation action directs the partner agencies to coordinate and collaborate with TROA<br />
agencies as necessary to be compliant with the Settlement Act. To meet this implementation action, the<br />
agencies will continue regular contact with TROA agencies as appropriate.<br />
3.2.2 Summary of BMO #2 Actions<br />
Table 3-2 presents a summary of implementation actions to be undertaken by the partner agencies that<br />
support BMO #2 including the anticipated schedule of implementation.<br />
2-1<br />
Table 3-2. Summary BMO#2 Supporting Implementation Actions<br />
Description of Action Implementation Schedule<br />
Continue coordination and collaboration with TROA agencies on groundwater<br />
management issues and source well development<br />
DRAFT for review purposes only. Use of contents on this sheet is subject to the limitations specified at the end of this document.<br />
P:\40000\140691 - PCWA <strong>Martis</strong> <strong>Valley</strong> GWP\GMP\Report\3rd Draft\<strong>Martis</strong> <strong>Valley</strong> GMP Draft 01-09-13.docx<br />
Ongoing<br />
3.3 Implementation Actions that Support BMO #3 - Collaborate and<br />
Cooperate with <strong>Groundwater</strong> Users and Stakeholders in the <strong>Martis</strong><br />
<strong>Valley</strong> <strong>Groundwater</strong> Basin<br />
With one common groundwater supply it makes sense to share information and resources toward similar<br />
goals. This objective encourages the partner agencies to reach out to other agencies and groundwater<br />
users within the MVGB.<br />
3.3.1 Formalize and institute a Stakeholder Working Group to meet at least annually or<br />
as needed on GMP implementation activities and updates<br />
The SWG has been a key component of the GMP development process and will be continued into the<br />
implementation phase. This implementation action directs the partner agencies to continue using a<br />
3-5
<strong>Martis</strong> <strong>Valley</strong> <strong>Groundwater</strong> <strong>Management</strong> <strong>Plan</strong> Section 3<br />
SWG during implementation of the GMP. The SWG will continue to work cooperatively with the partner<br />
agencies and will meet at least once a year to discuss GMP implementation.<br />
3.3.2 Collaborate with the LRWQCB to limit the migration of contaminated groundwater<br />
and in development of large scale contamination clean up programs<br />
This implementation action directs the partner agencies to communicate, collaborate, and coordinate<br />
with the LRWQCB on groundwater contamination issues. There are no currently identified large scale<br />
groundwater contamination issues in the <strong>Martis</strong> <strong>Valley</strong> at this time. Communication with the LRWQCB<br />
allows for collaboration in the event of the identification of groundwater contamination and collaboration<br />
with the LRWQCB on the prevention of contaminant migration.<br />
3.3.3 Work cooperatively with local stakeholders and local, State and Federal agencies on<br />
groundwater management activities, projects, and studies<br />
Strong relationships with Federal, State, and local agencies and stakeholders are critical in developing<br />
and implementing many of the GMP’s implementation actions. The partner agencies are already working<br />
cooperatively with local stakeholders and agencies on groundwater management, as evidenced by the<br />
use of the SWG during GMP development. This implementation action directs the partner agencies to<br />
communicate and work cooperatively with local groundwater interests, and includes outreach activities<br />
aimed to educate agencies and stakeholders on groundwater management opportunities and activities<br />
in the MVGB.<br />
3.3.4 Identify opportunities for public involvement during GMP implementation<br />
Informing the public of GMP implementation activities increases local understanding and support of<br />
GMP activities. This implementation action encourages the partner agencies to inform and invite the<br />
public to participate in GMP implementation activities. Public information and involvement may take<br />
place in the form of a specific webpage designed to communicate GMP implementation actions, public<br />
meetings, and at agency board meetings, as well as other activities.<br />
3.3.5 Summary of BMO #3 Actions<br />
Table 3-3 presents a summary of implementation actions to be undertaken by the partner agencies that<br />
support BMO #3 including the anticipated schedule of implementation.<br />
3-1<br />
3-2<br />
3-3<br />
Table 3-3. Summary BMO#3 Supporting Implementation Actions<br />
Description of Action Implementation Schedule<br />
Formalize and institute a Stakeholder Working Group to meet at least annually<br />
or as needed on GMP implementation activities and updates.<br />
Collaborate with the LRWQCB to limit the migration of contaminated<br />
groundwater and in development of large scale contamination clean up<br />
programs<br />
Work cooperatively with local stakeholders and local, State and Federal<br />
agencies on groundwater management activities, projects and studies<br />
DRAFT for review purposes only. Use of contents on this sheet is subject to the limitations specified at the end of this document.<br />
P:\40000\140691 - PCWA <strong>Martis</strong> <strong>Valley</strong> GWP\GMP\Report\3rd Draft\<strong>Martis</strong> <strong>Valley</strong> GMP Draft 01-09-13.docx<br />
Annually<br />
As Needed<br />
Ongoing<br />
3-4 Identify opportunities for public involvement during plan implementation Ongoing<br />
3-6
<strong>Martis</strong> <strong>Valley</strong> <strong>Groundwater</strong> <strong>Management</strong> <strong>Plan</strong> Section 3<br />
3.4 Implementation Actions that Support BMO #4 - Protect<br />
<strong>Groundwater</strong> Quantity and Quality<br />
<strong>Groundwater</strong> performs an integral function in a watershed, one of which is satisfying water supply needs.<br />
Improving the understanding of the regional supplies is a critical step in protecting and sustaining the<br />
<strong>Martis</strong> <strong>Valley</strong> groundwater supply.<br />
The collection, evaluation and analysis of groundwater monitoring data including water quality and water<br />
levels on a regular basis is the cornerstone in understanding the MVGB’s groundwater resources and<br />
provides critical information for management decisions. <strong>Groundwater</strong> level monitoring can identify areas<br />
of overdraft, enabling appropriate management decisions and responses. <strong>Groundwater</strong> quality<br />
monitoring can help identify areas of degrading water quality, potentially identifying specific water quality<br />
issues. Ongoing groundwater monitoring provides information needed to document current conditions,<br />
assess long-term trends, and to support development and implementation of GMP components.<br />
<strong>Groundwater</strong> data is collected by both DWR and the partner agencies on a regular basis; and by the<br />
USGS on a less regular basis. Accumulating, processing, evaluating, summarizing and reporting the<br />
available data for discussion and distribution will be required to make informed decisions regarding<br />
continued groundwater supply and demand. Additionally, surface water data is collected by local, State,<br />
and Federal agencies and is evaluated by the appropriate agency for their own purpose. These data are<br />
critical and can be used in conjunction with the accumulated groundwater data to help improve the<br />
understanding of surface water-groundwater relationships.<br />
3.4.1 Establish and maintain a California Statewide <strong>Groundwater</strong> Elevation Monitoring<br />
compliant monitoring program<br />
This implementation action directs the partner agencies to continue their California Statewide<br />
<strong>Groundwater</strong> Elevation Monitoring (CASGEM) compliant monitoring program (included as Appendix D).<br />
Figure 3-1 shows the locations of CASGEM monitoring wells in the MVGB. CASGEM monitoring results will<br />
be used in the annual groundwater monitoring summary prepared under implementation action 1-2.<br />
DRAFT for review purposes only. Use of contents on this sheet is subject to the limitations specified at the end of this document.<br />
P:\40000\140691 - PCWA <strong>Martis</strong> <strong>Valley</strong> GWP\GMP\Report\3rd Draft\<strong>Martis</strong> <strong>Valley</strong> GMP Draft 01-09-13.docx<br />
3-7
Legend<br />
Q <strong>Martis</strong> <strong>Valley</strong> <strong>Groundwater</strong> Basin<br />
---- Truckee River<br />
-- Streams<br />
<strong>Martis</strong> <strong>Valley</strong> <strong>Groundwater</strong> Basin, California<br />
CASGEM and DWR <strong>Groundwater</strong> Monitoring Wells<br />
Figure<br />
3-1
<strong>Martis</strong> <strong>Valley</strong> <strong>Groundwater</strong> <strong>Management</strong> <strong>Plan</strong> Section 3<br />
3.4.2 Continue and Encourage <strong>Water</strong> Conservation Activities and Public Education<br />
The partner agencies currently implement significant water conservation and public outreach programs<br />
per State requirements. All three agencies hold public board meetings and maintain informative<br />
websites for public outreach purposes at the following web addresses:<br />
www.tdpud.org<br />
www.pcwa.net<br />
www.northstarcsd.org<br />
This implementation action encourages the partner agencies to continue to implement conservation<br />
activities and continue public outreach activities as opportunities become available.<br />
3.4.3 Work with local stakeholders and DWR to identify areas that may need additional<br />
groundwater level and groundwater quality monitoring based on identified data<br />
gaps or negative performance trends<br />
Currently, groundwater is monitored by the partner agencies under CASGEM, and by DWR, who monitors<br />
a number of wells in the MVGB. DWR monitoring wells are shown in Figure 3-1. This implementation<br />
action requires the partner agencies to work with local stakeholders and DWR to identify areas in need<br />
of additional monitoring. The SWG included two DWR North Central Region office staff and future<br />
members of the SWG should continue to include DWR staff. Through the SWG, the partner agencies will<br />
be working with local stakeholders and DWR, and will discuss identification of additional monitoring<br />
areas at the SWG annual meetings.<br />
3.4.4 Coordinate with other agencies, including DWR and the USGS to identify<br />
opportunities for land subsidence monitoring<br />
Inelastic land subsidence is caused by dewatering of aquifers and the compressing of clays. As water is<br />
removed from the aquifer, it is transported through interconnected pore spaces between grains of sand<br />
and gravel. If an aquifer has intervals of clay or silt within it, the lowered water pressure in the sand and<br />
gravel results in the slow drainage of water from the clay and silt beds. The decreased water pressure<br />
reduces the support for the clay and silt beds. Because these beds are compressible, they compact<br />
(become thinner) and the effects are seen as a lowering of the land surface. The lowering of the land<br />
surface elevation from this process is often permanent (inelastic). Recharge of the aquifer will not result<br />
in an appreciable recovery of the land-surface elevation.<br />
The partner agencies have not developed a network of extensometers to measure inelastic land<br />
subsidence. <strong>Groundwater</strong> level monitoring indicates that groundwater levels have not been significantly<br />
lowered, a condition required for land subsidence due to groundwater extraction to occur. Additionally,<br />
the geology (Section 2.4) in the MVGB does not consist of large layers of clay to be compressed, and is<br />
unlikely to experience inelastic land subsidence even if groundwater levels begin to decline. Based on a<br />
review of groundwater elevation trends over time, it can reasonably be assumed that significant land<br />
subsidence has not occurred on a regional scale due to groundwater extraction within the MVGB.<br />
Under this implementation action, the partner agencies will coordinate with DWR and the USGS to<br />
identify opportunities for collaboration to detect land subsidence. Because inelastic land subsidence is<br />
tied to groundwater levels, the primary means for early detection include:<br />
Monitor and analyze groundwater levels, watching for significant declines<br />
Inspect wells for anecdotal evidence of subsidence during groundwater level monitoring<br />
Monitoring groundwater levels with concurrent inspections for anecdotal evidence of subsidence is the<br />
least expensive, and least reliable, method to monitor for land subsidence. Declines in groundwater<br />
levels can be a precursor to land subsidence. Staff performing water level monitoring can inspect the<br />
DRAFT for review purposes only. Use of contents on this sheet is subject to the limitations specified at the end of this document.<br />
P:\40000\140691 - PCWA <strong>Martis</strong> <strong>Valley</strong> GWP\GMP\Report\3rd Draft\<strong>Martis</strong> <strong>Valley</strong> GMP Draft 01-09-13.docx<br />
3-9
<strong>Martis</strong> <strong>Valley</strong> <strong>Groundwater</strong> <strong>Management</strong> <strong>Plan</strong> Section 3<br />
monitoring well for indicators of subsidence. Anecdotal subsidence indicators include cracks in the well<br />
pad, elevation of the well casing in comparison to the ground surface, and cracks in the ground surface.<br />
3.4.5 Evaluate the need for, and advocate for, as necessary, a wellhead protection,<br />
groundwater recharge area protection, and other programs as necessary in MVGB<br />
Wellhead protection is a component of the Drinking <strong>Water</strong> Source Assessment and Protection (DWSAP)<br />
program administered by the DPH. The purpose of the DWSAP program is to protect groundwater<br />
sources of public drinking water supplies from contamination, thereby eliminating the need for costly<br />
treatment to meet drinking water standards. There are three major components to the DWSAP program,<br />
including: Delineation of capture zones around source wells, inventory of potential contaminating<br />
activities within protection areas, and analysis of vulnerabilities.<br />
The partner agencies are in compliance with the DWSAP program, will work to comply with the DWSAP<br />
program into the future, and will consider supporting programs that will protect groundwater quality in<br />
the MVGB.<br />
3.4.6 Map and share groundwater recharge zones<br />
This GMP identifies preliminary areas of groundwater recharge in the MVGB in Section 2.9. Once the<br />
groundwater model is calibrated and finalized, groundwater recharge zones will be updated during the<br />
scheduled plan update identified in Section 3.1.1. This implementation action encourages the partner<br />
agencies to share the recharge zone maps developed in this GMP with local land use agencies to<br />
consider in land use decisions.<br />
3.4.7 Provide relevant information to land use agencies regarding groundwater<br />
availability<br />
Through GMP implementation activities, such as CASGEM monitoring, groundwater monitoring summary<br />
reports and annual meetings of the SWG, the partner agencies will develop water resources information<br />
about the MVGB. As development increases in the MVGB, local land use agencies will be faced with<br />
decisions regarding zoning and permitting. In <strong>Placer</strong> <strong>County</strong>, the Community Development Resource<br />
Agency leads development of the <strong>County</strong>’s general plan and land development activities. The Nevada<br />
<strong>County</strong> Community Development Agency is responsible for the Nevada <strong>County</strong> General <strong>Plan</strong> and zoning,<br />
and the Town of Truckee has developed its own general plan and zoning. This implementation action<br />
directs the partner agencies to communicate relevant groundwater information to the appropriate<br />
planning agencies to assist them in making informed land use decisions.<br />
3.4.8 Summary of BMO #4 Actions<br />
Table 3-4 presents a summary of implementation actions to be undertaken by the partner agencies that<br />
support BMO #3 including the anticipated schedule of implementation.<br />
Table 3-4. Summary BMO#4 Supporting Implementation Actions<br />
Description of Action Implementation Schedule<br />
4-1 Establish and maintain a CASGEM compliant monitoring program Ongoing<br />
4-2 Continue and encourage water conservation activities and public education Ongoing<br />
4-3<br />
Work with local stakeholders and DWR to identify areas that may need additional groundwater<br />
level and groundwater quality monitoring based on identified data gaps or negative performance<br />
trends<br />
DRAFT for review purposes only. Use of contents on this sheet is subject to the limitations specified at the end of this document.<br />
P:\40000\140691 - PCWA <strong>Martis</strong> <strong>Valley</strong> GWP\GMP\Report\3rd Draft\<strong>Martis</strong> <strong>Valley</strong> GMP Draft 01-09-13.docx<br />
Annually<br />
3-10
<strong>Martis</strong> <strong>Valley</strong> <strong>Groundwater</strong> <strong>Management</strong> <strong>Plan</strong> Section 3<br />
4-4<br />
4-5<br />
Table 3-4. Summary BMO#4 Supporting Implementation Actions<br />
Description of Action Implementation Schedule<br />
Coordinate with other agencies, including DWR and the USGS to identify opportunities for land<br />
subsidence monitoring<br />
Evaluate the need for, and advocate for, as necessary, a wellhead protection, groundwater<br />
recharge area protection, and other programs as necessary in MVGB<br />
DRAFT for review purposes only. Use of contents on this sheet is subject to the limitations specified at the end of this document.<br />
P:\40000\140691 - PCWA <strong>Martis</strong> <strong>Valley</strong> GWP\GMP\Report\3rd Draft\<strong>Martis</strong> <strong>Valley</strong> GMP Draft 01-09-13.docx<br />
As Needed<br />
As Needed<br />
4-6 Map and share groundwater recharge zones Ongoing<br />
4-6 Provide relevant information to land use agencies regarding groundwater availability As Needed<br />
3.5 BMO #5 - Pursue and use the best available science and<br />
technology to inform the decision making process.<br />
Science and technology continue to develop new tools that may improve our understanding of the MVGB.<br />
This objective encourages the partner agencies to take actions that work with the best available science<br />
to help make informed agency decisions.<br />
The partner agencies are currently working to develop the best groundwater science available by<br />
collaborating with the Bureau of Reclamation (Reclamation) and DRI to develop an integrated<br />
watershed-groundwater model in conjunction with the <strong>Martis</strong> <strong>Valley</strong> GMP. The geologic investigation<br />
conducted and documented in Section 2 of this report has been used to shape a bi-modal geologic<br />
framework which was used to develop the conceptual model for the hydrogeology of the subsurface<br />
components of the integrated watershed model. The integrated model is under development in parallel<br />
with the GMP and is not completed at the time of the issuance of the draft GMP.<br />
The integrated watershed model is comprised of a PRMS and MODFLOW coupled together using an UZF<br />
package. The PRMS is used to model surface water within the watershed, the MODFLOW is used to<br />
model groundwater within the MVGB, and UZF is a kinematic wave vadose zone model used to model<br />
the interaction between surface water and groundwater. Each model will be calibrated separately, and<br />
then calibrated together over a ten year period using a coupled GSFLOW. Calibrations will be conducted<br />
using multiple GCM projections of precipitation and temperature to investigate the influence of future<br />
climate on water resources. Calibration targets for GSFLOW will include head values measured from<br />
wells, meadow and spring locations, streamflows, measured snow depth, and remotely sensed snow<br />
cover.<br />
The integrated model’s model domain will cover the entire MVGB, and the watersheds that contribute<br />
surface water to the region up to Lake Tahoe. The model grid’s cells are 300 meters by 300 meters in<br />
size.<br />
The partner agencies will obtain a copy of the groundwater model component for future use.<br />
3.5.1 Work with State and Federal agencies to attempt to secure funding for expansion of<br />
the partner agencies’ monitoring grid<br />
Increasing the number of monitoring points and frequency of monitoring provides for better long term<br />
understanding of groundwater trends in the MVGB. Monitoring locations can be added by drilling new,<br />
dedicated monitoring wells, and by reaching agreements with well owners that have wells suitable for<br />
monitoring activities. Suitable wells will have a driller’s log that describes well construction and<br />
sediments encountered, a short screened interval, a sanitary seal to prevent surface water from entering<br />
the well, and cannot be municipal supply wells.<br />
3-11
<strong>Martis</strong> <strong>Valley</strong> <strong>Groundwater</strong> <strong>Management</strong> <strong>Plan</strong> Section 3<br />
The partner agencies are currently working with DWR to expand the monitoring grid by submitting a<br />
competitive grant application under DWR’s LGA program. The agencies’ application includes plans to drill<br />
and install three monitoring wells located across the <strong>Martis</strong> <strong>Valley</strong>.<br />
This implementation action directs the partner agencies to collaborate with State agencies such as DWR,<br />
DPH, and others, as well as Federal agencies such as Reclamation, to acquire funding for improvements<br />
to the groundwater monitoring grid in the MVGB.<br />
3.5.2 Maintain relationship with DWR for groundwater monitoring and database<br />
management activities<br />
The partner agencies are a designated monitoring entity under DWR’s CASGEM program. DWR staff have<br />
been an integral part of the SWG during GMP development and their contribution in the SWG is<br />
anticipated during GMP implementation.<br />
This implementation action directs the partner agencies to continue to maintain a collaborative<br />
relationship with DWR for monitoring and database management activities in the MVGB. A continued<br />
relationship with DWR benefits the GMP by continuing the monitoring of long-term monitoring wells<br />
(especially those with long periods of records), and ensures that DWR groundwater expertise is involved<br />
during plan implementation activities through the SWG.<br />
3.5.3 Identify opportunities for collecting water quality monitoring data<br />
The purpose of water quality monitoring as a GMP implementation action is to assess regional trends in<br />
water quality that may be caused by changes in groundwater-related activities. For example,<br />
groundwater pumping may induce groundwater flow from deeper aquifers or hard rock areas that are<br />
less desirable, such as water with a high mineral content or arsenic. <strong>Groundwater</strong> quality monitoring<br />
from a basin-wide perspective is focused on information that is indicative of overall groundwater basin<br />
conditions and not focused on individual anthropogenic contaminants. Localized anthropogenic<br />
groundwater quality contaminants fall under the jurisdiction of the LRWCQB.<br />
<strong>Groundwater</strong> quality is currently monitored as part of the agencies’ agreements with DPH. Each agency<br />
releases an annual water quality report for their service areas in the MVGB, and maintains databases of<br />
water quality information. Partner agency annual water quality reports are included in Appendix E.<br />
Additional opportunities exist to collect groundwater quality information by collaborating with other State<br />
and Federal programs, such as the USGS funded California <strong>Groundwater</strong> Ambient Monitoring and<br />
Assessment Special Studies Program (GAMA). The 2007 GAMA study collected water quality data in the<br />
MVGB from 52 groundwater wells. The GAMA fact sheet for the MVGB is included in Appendix E.<br />
Another example of how the partner agencies optimize collaboration opportunities occurred in February,<br />
2012. The partner agencies teamed with Lawrence Livermore National Laboratory (LLNL) to conduct a<br />
water aging study that will help improve the understanding of how the MVGB functions. The LLNL study<br />
is funded by the GAMA Special Studies Program. Results of the LLNL study will supplement and validate<br />
the DRI integrated <strong>Martis</strong> <strong>Valley</strong> surface-groundwater model.<br />
This implementation action encourages the partner agencies to continue to identify opportunities, both<br />
within the agencies’ operations and by collaborating with State and Federal agencies to improve<br />
groundwater quality data collection in the MVGB. Data collected for GMP implementation will be focused<br />
on identifying long-term water quality trends as they are related to groundwater use.<br />
DRAFT for review purposes only. Use of contents on this sheet is subject to the limitations specified at the end of this document.<br />
P:\40000\140691 - PCWA <strong>Martis</strong> <strong>Valley</strong> GWP\GMP\Report\3rd Draft\<strong>Martis</strong> <strong>Valley</strong> GMP Draft 01-09-13.docx<br />
3-12
<strong>Martis</strong> <strong>Valley</strong> <strong>Groundwater</strong> <strong>Management</strong> <strong>Plan</strong> Section 3<br />
3.5.4 Use and consider updating the hydrologic model to improve understanding of<br />
groundwater in the MVGB<br />
The implementation action directs the partner agencies to utilize the groundwater model component of<br />
the integrated watershed model to improve local hydrogeologic understanding within the MVGB. This<br />
may be achieved by revising the current regional groundwater model (when completed) to include the<br />
following:<br />
Development of a focused MVGB hydrogeologic conceptual model;<br />
Refinement of the numerical groundwater model grid size and model extent;<br />
Revisions to numerical groundwater model layering and parameterization to reflect updates in the<br />
conceptual model; and,<br />
Establishment of appropriate stress periods and time scales for transient model simulations.<br />
Incorporation of these revisions to the DRI-developed groundwater model will improve the tool so that it<br />
can be used to characterize groundwater flow patterns originating from key recharge zones; to quantify<br />
potential impacts on groundwater resources resulting from localized extractions; and to evaluate current<br />
and future impacts on base flows within the Truckee River as a result of groundwater pumping within the<br />
MVGB.<br />
3.5.5 Seek new tools, technology, and information that may improve the understanding of<br />
the water resources in the MVGB and watershed<br />
The partner agencies strive to have the best possible understanding of water resources in the MVGB,<br />
and prepare reports on water resources such as urban water management plans, water supply analyses,<br />
and water master plans in accordance to State requirements.<br />
This implementation action directs the partner agencies to actively seek out tools, technology, and<br />
compiled information in order to improve the understanding of water resources in the MVGB. The<br />
agencies will share and compare their water resources planning documents to identify similarities and<br />
differences. Additionally the agencies will continue to be proactive in looking for methods, approaches,<br />
and analysis that improves understanding of water in the MVGB.<br />
3.5.6 Summary of BMO #5 Actions<br />
Table 3-5 presents a summary of implementation actions to be undertaken by the partner agencies that<br />
support BMO #5 including the anticipated schedule of implementation.<br />
5-1<br />
5-2<br />
Table 3-5. Summary BMO#5 Supporting Implementation Actions<br />
Description of Action Implementation Schedule<br />
Work with State and Federal agencies to attempt to secure funding for expansion of the Partner<br />
Agencies monitoring grid<br />
Maintain relationship with DWR for groundwater monitoring and database management<br />
activities<br />
DRAFT for review purposes only. Use of contents on this sheet is subject to the limitations specified at the end of this document.<br />
P:\40000\140691 - PCWA <strong>Martis</strong> <strong>Valley</strong> GWP\GMP\Report\3rd Draft\<strong>Martis</strong> <strong>Valley</strong> GMP Draft 01-09-13.docx<br />
Ongoing<br />
Ongoing<br />
5-3 Identify opportunities for collecting water quality monitoring data As Available<br />
5-4<br />
5-5<br />
5-6<br />
Use and consider updating the hydrologic model to improve understanding of groundwater in<br />
the MVGB<br />
Seek new tools, technology, and information that may improve the understanding of the water<br />
resources in the MVGB and watershed<br />
Use the best available data to inform and link agency interdependent planning documents (i.e.<br />
urban water management plans, water supply analyses, and water master plans)<br />
Ongoing<br />
Ongoing<br />
Ongoing<br />
3-13
<strong>Martis</strong> <strong>Valley</strong> <strong>Groundwater</strong> <strong>Management</strong> <strong>Plan</strong> Section 3<br />
3.6 Implementation Actions that Support BMO #6 - Consider the<br />
environment and participate in the stewardship of groundwater<br />
resources<br />
The partner agencies are dedicated stewards of the <strong>Martis</strong> <strong>Valley</strong> groundwater resources. The partner<br />
agencies’ mission statements reflect the importance of managing their respective agencies in an<br />
environmentally sound manner, such as minimizing negative impacts of operations on the environment.<br />
This BMO directs the partner agencies to continue their leadership in the stewardship of the<br />
groundwater, watershed and natural infrastructure.<br />
3.6.1 Consider local, State, or Federal riparian, surface water, or surface watergroundwater<br />
interaction investigations, studies or programs in the MVGB<br />
This implementation action directs the partner agencies to consider existing and future studies and<br />
investigations of riparian habitat, surface water, and surface- groundwater interaction investigations.<br />
Wetlands and riparian areas play an important role in protecting water quality and reducing adverse<br />
water quality impacts (EPA, 2005). This implementation action, while not solely focused on pollution<br />
prevention, may address issues with such through traditional point sources and non-point sources.<br />
Many pollutants are delivered to surface waters and to groundwater from diffuse sources, such as urban<br />
runoff, agricultural runoff, and atmospheric deposition of contaminants. Pollution of surface water can<br />
impact groundwater quality and conversely pollution of groundwater can impact surface water. The<br />
agencies will evaluate the need to consider studies, guidance documents, and programs that investigate<br />
the linkages between ground and surface waters.<br />
3.6.2 Continue support and collaboration with local groups that identify, coordinate, or<br />
implement projects that support the overall sustainability of the MVGB<br />
This implementation action directs the partner agencies to support and collaborate with local groups<br />
that improve sustainability in the MVGB.<br />
The partner agencies will continue support and collaboration with groups and agency members of the<br />
SWG, and through public involvement and outreach, identify additional groups to include in GMP<br />
implementation.<br />
3.6.3 Summary of BMO #6 Actions<br />
Table 3-6 presents a summary of implementation actions to be undertaken by the partner agencies that<br />
support BMO #3 including the anticipated schedule of implementation.<br />
6-1<br />
6-2<br />
Table 3-6. Summary BMO#6 Supporting Implementation Actions<br />
Description of Action Implementation Schedule<br />
Consider local, State, or Federal riparian, surface water, or surface watergroundwater<br />
interaction investigations, studies or programs in the MVGB.<br />
Continue support and collaboration with local groups that identify, coordinate,<br />
or implement projects that support the overall sustainability of the MVGB.<br />
DRAFT for review purposes only. Use of contents on this sheet is subject to the limitations specified at the end of this document.<br />
P:\40000\140691 - PCWA <strong>Martis</strong> <strong>Valley</strong> GWP\GMP\Report\3rd Draft\<strong>Martis</strong> <strong>Valley</strong> GMP Draft 01-09-13.docx<br />
As Needed<br />
Ongoing<br />
3-14
Section 4<br />
References<br />
Berris, S.N., Hess, G.W., and Bohman, L.R., 2001, River and Reservoir Operations Model, Truckee River Basin, California<br />
and Nevada, 1998, U.S. Geological Survey <strong>Water</strong>-Resources Investigations Report 01-4017, 137 p. + plate.<br />
Birkeland, P.W., 1961, Pleistocene history of the Truckee area, north of Lake Tahoe, California: Stanford University, Ph.D.<br />
dissertation, 126 p. + plates<br />
Birkeland, P.W., 1963, Pleistocene volcanism and deformation of the Truckee Area, north of Lake Tahoe, California,<br />
Geological Society of America Bulletin, v. 64, p. 1453-1464.<br />
Birkeland, P.W., 1964, Pleistocene glaciation of the northern Sierra Nevada, north of Lake Tahoe, California, The Journal<br />
of Geology, v. 72 n. 6, p. 810-825.<br />
Brown, V.E., 2010, Geotechnical Investigations at <strong>Martis</strong> Creek Dam, Truckee, California, Proceedings of the 30 th annual<br />
USSD Conference: Collaborative <strong>Management</strong> of Integrated <strong>Water</strong>sheds, Sacramento, California, April 12-16, 2010.<br />
Bugenig, D., and Hanneman, M., 2006, Review of Eaglewood Well #3 construction and testing report: ECO:LOGIC<br />
Engineering technical memo prepared for PCWA Lahontan, 9 p.<br />
Bugenig, D., 2007, Analysis of pumping test data for the August 27 through 31, 2007 test of Timilick Well #3: ECO:LOGIC<br />
Engineering technical memo prepared for Leslie Gault, PE, <strong>Placer</strong> <strong>County</strong> <strong>Water</strong> Agency, 19 p. + location map.<br />
California Department of <strong>Water</strong> Resources, 2003, California’s <strong>Groundwater</strong>: Bulletin 118 – Update 2003, 213 p. +<br />
figures, tables, and appendices.<br />
Coats, R., Reuter, J., Dettinger, M., Riverson, J., Sahoo, G., Schladow, G., Wolfe, B., and Costa-Cabral, M., 2010, The<br />
effects of climate change on Lake Tahoe in the 21 st Century: Meteorology, hydrology, loading and lake response.<br />
Report prepared for Pacific Southwest Research Station, Tahoe Environmental Science Center, Incline Village, NV.,<br />
200 p.<br />
CH2MHill, 1974, Hydrogeological investigation of land disposal of reclaimed wastewater near Truckee, California: report<br />
prepared for Tahoe-Truckee Sanitation Agency.<br />
Environmental Protection Agency, 2005, National <strong>Management</strong> Measures to Protect and Restore Wetlands and Riparian<br />
Areas for the Abatement of Nonpoint Source Pollution, EPA 841-B-05-003, July, 2005. Available at<br />
www.epa.gov/owow/nps/wetmeasures/<br />
Fram, M.S., Munday, C., Belitz, K., 2007, <strong>Groundwater</strong> quality data for the Tahoe-<strong>Martis</strong> Study Unit, 2007: Results from<br />
the California GAMA Program, US Geological Survey Data Series 432, 88 p. Available at<br />
http://pubs.usgs.gov/ds/432/<br />
Fritts, H.C., and Gordon, G.A., 1980, Annual precipitation for California since 1600 reconstructed from western North<br />
American tree rings: Laboratory of Tree-Ring Research, University of Arizona, Tucson, under California Department of<br />
<strong>Water</strong> Resources Agreement No. B53367, July 1980, 45 p.<br />
Herzog, D.J., and Whitford, W.B., 2001, Summary of hydrogeological Services, Phase 2 <strong>Water</strong> Resources Investigation,<br />
Northstar-at-Tahoe, Truckee, Caliofornia: Kleinfelder consulting report prepared for Auerbach Engineering Group, 11<br />
p. + tables, plates, and appendices.<br />
Hunter, L.E., Howle, J.F., Rose, R.S., and Bawden, G.W., 2011, LiDAR-Assisted identification of an active fault near<br />
Truckee, California, Bulletin of the Seismological Society of America, v.101 n.3, p.1162-1181.<br />
California, Bulletin of the Seismological Society of America, v. 101, n. 3, p. 1162-1181.<br />
Hydro-Search, Inc., 1995. Ground <strong>Water</strong> <strong>Management</strong> <strong>Plan</strong> Phase 1 <strong>Martis</strong> <strong>Valley</strong> Ground-<strong>Water</strong> Basin No. 6-67 Nevada<br />
and <strong>Placer</strong> counties, California. Prepared for Truckee Donner Public Utility District January 31, 1995.<br />
DRAFT for review purposes only. Use of contents on this sheet is subject to the limitations specified at the end of this document.<br />
P:\40000\140691 - PCWA <strong>Martis</strong> <strong>Valley</strong> GWP\GMP\Report\3rd Draft\<strong>Martis</strong> <strong>Valley</strong> GMP Draft 01-09-13.docx<br />
4-1
<strong>Martis</strong> <strong>Valley</strong> <strong>Groundwater</strong> <strong>Management</strong> <strong>Plan</strong> Section 4<br />
Interflow Hydrology and Cordilleran Hydrology, 2003, Measuremet of ground water discharge to streams tributary to the<br />
Truckee River in <strong>Martis</strong> <strong>Valley</strong>, <strong>Placer</strong> and Nevada Counties, California: consulting report prepared for <strong>Placer</strong> <strong>County</strong><br />
<strong>Plan</strong>ning Department, 30 p. + tables, figures, and appendices.<br />
Josh Detweiller, NCSD, personal communication, May 2012<br />
Kaufman, N., 2011, Truckee Donner Public Utility District Urban <strong>Water</strong> <strong>Management</strong> <strong>Plan</strong>, Adopted June 1, 2011, 122 p.<br />
incl. tables, figures + appendices.Lathham, T.S., 1985, Stratigraphy, structure, and geochemistry of Plio-Pleistocene<br />
volcanic rocks of the western Basin and Range Province, near Truckee, California, unpublished doctoral dissertation,<br />
University of California, Davis, 341 p.<br />
Lindström, S., Rucks, P., and Wigand, P., 2000, A contextual overview of human land use and environmental conditions:<br />
in Lake Tahoe <strong>Water</strong>shed Assessment, Volume 1, Dennis Murphy and Christopher M.Knopp (eds.). U.S. Forest<br />
Service General Technical Report PSW-GTR-174.<br />
Maxey, G.B., and T.E. Eakin, 1949. Ground water in White River <strong>Valley</strong>, White Pine, Nye, and Lincoln counties, Nevada.<br />
State of Nevada, Office of the State Engineer, <strong>Water</strong> Resources Bulletin 8.Melody, A., 2009, Active faulting and<br />
Quaternary paleohydrology of the Truckee Fault Zone north of Truckee, California; MS thesis, Humbolt State<br />
University, Humbolt, CA 71 p.<br />
Nimbus Engineers, 2001, Ground water availability in the <strong>Martis</strong> <strong>Valley</strong> <strong>Groundwater</strong> Basin, Nevada and <strong>Placer</strong> Counties,<br />
California: consulting report prepared for Truckee Donner Public Utility District, <strong>Placer</strong> <strong>County</strong> <strong>Water</strong> Agency, and<br />
Northstar Community Services District42 p. + tables and figures.<br />
Nichols Consulting Engineers, 2008, Truckee River <strong>Water</strong> Quality Monitoring <strong>Plan</strong>, Final <strong>Plan</strong>: consulting report prepared<br />
for <strong>Placer</strong> <strong>County</strong> and the Town of Truckee, 267 p. + appendices.<br />
Peck, B.J., and Herzog, D.J., 2008, Response to ECO:LOGIC Memos dated October 18, 2007 and January 3, 2008 review<br />
of Eaglewood No. 4 construction and testing report: Kleinfelder letter report prepared for Mr. Roger Cook, 10 p. +<br />
plates.<br />
Rajagopal, S., Reeves, D.M., Huntington, J., Pohll, G., 2012, Desert Research Institute Technical Note to PCWA:<br />
Estimates of Ground <strong>Water</strong> Recharge in the <strong>Martis</strong> <strong>Valley</strong> Ground <strong>Water</strong> Basin: prepared for PCWA.<br />
Saucedo, G.J., 2005, Geologic Map of the Lake Tahoe Basin, California and Nevada, 2005, California Department of<br />
Conservation California Geological Survey Regional Geologic Map Series, Map No. 4, 1:100,000 scale.<br />
Saucedo, G.J., and Wagner, D.L., 1992, Geologic Map of the Chico Quadrangle, 1:250,000: California Division of Mines<br />
and Geology Regional Map Series, v. 7A<br />
Tully and Young, 2011, <strong>Placer</strong> <strong>County</strong> <strong>Water</strong> Agency 2010 Urban <strong>Water</strong> <strong>Management</strong> <strong>Plan</strong>: report prepared for the <strong>Placer</strong><br />
<strong>County</strong> <strong>Water</strong> Agency, 126 p. incl. tables + figures.<br />
Shaw, D., Hastings, B., Drake, K., Hogan, M., and Lindstrom, S., 2012, <strong>Martis</strong> <strong>Water</strong>shed Assessment: Balance<br />
Hydrologics consulting report prepared for the Truckee River <strong>Water</strong>shed Council. 66 p. + figures, tables, and<br />
appendices.<br />
U.S. Department of the Interior Bureau of Reclamation, 2011, Truckee Basin Study <strong>Plan</strong> of Study. 22 p. + appendices<br />
and attachments.<br />
U.S. Environmental Protection Agency, 2005, National <strong>Management</strong> Measure to Protect and Restore Wetlands and<br />
Riparian Areas for the Abatement of Nonpoint Source Pollution, EPA-841-B-05-003.<br />
U.S. Forest Service, 2011, Monthly and annual precipitation records (1904-2010) for Truckee ranger station, Truckee,<br />
California, station #49043<br />
U.S. Army Corps of Engineers, 1985, Truckee River Basin Reservoirs, Truckee River, Nevada and California: <strong>Water</strong> Control<br />
Manual, 71 p. + Tables, Plates, and Exhibits<br />
U.S. Army Corps of Engineers, 2002, Truckee River Basin, California/Nevada, <strong>Martis</strong> Creek Spillway Adequacy Study,<br />
Hydrology Office Report, 16 p. + Tables, Figures, Charts, and Plates.<br />
DRAFT for review purposes only. Use of contents on this sheet is subject to the limitations specified at the end of this document.<br />
P:\40000\140691 - PCWA <strong>Martis</strong> <strong>Valley</strong> GWP\GMP\Report\3rd Draft\<strong>Martis</strong> <strong>Valley</strong> GMP Draft 01-09-13.docx<br />
4-2
<strong>Martis</strong> <strong>Valley</strong> <strong>Groundwater</strong> <strong>Management</strong> <strong>Plan</strong><br />
Appendix A: Resolutions of Intent to Adopt a<br />
<strong>Groundwater</strong> <strong>Management</strong> <strong>Plan</strong><br />
DRAFT for review purposes only. Use of contents on this sheet is subject to the limitations specified at the end of this document.<br />
P:\40000\140691 - PCWA <strong>Martis</strong> <strong>Valley</strong> GWP\GMP\Report\3rd Draft\<strong>Martis</strong> <strong>Valley</strong> GMP Draft 01-09-13.docx<br />
A
RESOLUTION NO. 11 - .!30F THE BOARD OF DIRECTORS OF THE<br />
PLACER COUNTY WATER AGENCY<br />
DECLARING ITS INTENT TO UPDATE ITS<br />
MARTIS VALLEY GROUNDWATER MANAGEMENT PLAN<br />
AND ADOPT A STATEMENT OF PUBLIC PARTICIPATION<br />
WHEREAS, one of the responsibilities of <strong>Placer</strong> <strong>County</strong> <strong>Water</strong> Agency (Agency) is to<br />
provide for sustainable use of groundwater resources within <strong>Placer</strong> <strong>County</strong>; and<br />
WHEREAS, The Agency uses groundwater to serve customers in its <strong>Martis</strong> <strong>Valley</strong> water<br />
system located near Truckee, California; and<br />
WHEREAS, the Agency adopted its current <strong>Martis</strong> <strong>Valley</strong> <strong>Groundwater</strong> <strong>Management</strong> <strong>Plan</strong><br />
on October 6, 1998; and<br />
WHEREAS, the current groundwater management plan allows for periodic updates and<br />
advocates working collaboratively with others in <strong>Martis</strong> <strong>Valley</strong>; and<br />
WHEREAS, the Agency has established a partnership with Truckee Donner Public Utilities<br />
District and Northstar Community Services District to prepare an updated groundwater management<br />
plan and develop a groundwater model to reflect current water resources planning in <strong>Martis</strong> <strong>Valley</strong><br />
and enhance understanding of the underlying groundwater basin; and<br />
WHEREAS, the Agency intends to prepare, adopt, and implement this updated groundwater<br />
management plan in cooperation with the general public and stakeholders;<br />
NOW, THEREFORE, BE IT RESOLVED by the Board of Directors of the <strong>Placer</strong> <strong>County</strong><br />
<strong>Water</strong> Agency that:<br />
1. The Board intends to prepare, adopt, and implement an updated <strong>Martis</strong> <strong>Valley</strong><br />
<strong>Groundwater</strong> <strong>Management</strong> <strong>Plan</strong>. Among other content, the updated groundwater<br />
management plan will include basin management objectives, plan components, and<br />
management actions.
2. The Agency further intends to provide for and encourage public/stakeholder<br />
involvement in the preparation of this updated groundwater management plan.<br />
The foregoing resolution was duly passed at meeting ofthe Board of Directors ofthe<br />
<strong>Placer</strong> <strong>County</strong> <strong>Water</strong> Agency held on April 7, 2011, by the following on roll call:<br />
A YES DIRECTORS: Gray Allen, Alex Ferreira, Mike Lee, Ben Mavy,<br />
Chairman Lowell Jarvis<br />
NOES DIRECTORS: None<br />
ABSENT DIRECTORS: None<br />
Signed and approved by me after its passage this 7th day of April, 2011.<br />
ATTEST:<br />
Clerk, Board of irectors<br />
<strong>Placer</strong> <strong>County</strong> <strong>Water</strong> Agency<br />
z:/ns.martis valley.resolution. vf<br />
2
NOW, THEREFORE, the BOARD OF DIRECTORS ofthe NORTHSTAR<br />
COMMUNITY SERVICES DISTRICT does hereby RESOLVE, DETERMINE, and ORDER as<br />
follows:<br />
1. The District intends to cooperate with the Agency and TDPUD in the<br />
development a groundwater model to reflect current water resources planning and operations in<br />
the <strong>Martis</strong> <strong>Valley</strong> and an updated <strong>Martis</strong> <strong>Valley</strong> <strong>Groundwater</strong> <strong>Management</strong> <strong>Plan</strong>, and to propose<br />
the <strong>Plan</strong> for adoption as a joint <strong>Plan</strong> within the time provided by law.<br />
2. Among other content, the updated <strong>Plan</strong> will consider inclusion of basin<br />
management objectives, plan components, and management actions.<br />
Together with the Agency and TDPUD, the District further intends to provide for and<br />
encourage public involvement in the preparation of the updated <strong>Plan</strong>.<br />
PASSED AND ADOPTED at a regular meeting ofthe Board ofDirectors on April20, 2011 by<br />
the following vote:<br />
AYES: Evans, Green, Ives, Moll, Seelig<br />
NOES: None<br />
ABSTAIN: None<br />
ABSENT: None<br />
Duaf?e E. Evans, President of the Board<br />
NORTHSTAR CO MMU N IT Y SERVICES D I S TRICT • 908 NORTH S TAR DR I VE, NORTH STAR , CA 96161 • PAG E<br />
2 0 F 2
(<br />
c<br />
2. The District further intends to provide for and encourage public/stakeholder<br />
involvement in the preparation of this updated groundwater management plan.<br />
PASSED AND ADOPTED by the Board of Directors of the Truckee Donner Public Utility<br />
District in a meeting duly called and held within said District on the 6th day of April, 2011 .<br />
A YES: Directors Aguera, Bender, Hemig, Hillstrom and Laliotis<br />
NOES: None<br />
ABSTAIN: None<br />
ABSENT: None<br />
ATTEST:<br />
Michael D. alley, P.E. Clerk of the Board<br />
2 Resolution 2011-01
16395813<br />
PUBLIC NOTICE<br />
·------------<br />
The above space is reserved for Court/<strong>County</strong> Filed Date Stamp<br />
PROOF OF PUBLICATION<br />
(2015.5 C.C.P.)<br />
STATE OF CALIFORNIA<br />
<strong>County</strong> of <strong>Placer</strong><br />
I am a citizen of the United States and employed by a publication<br />
in the <strong>County</strong> aforesaid. I am over the age of eighteen years, and<br />
not a party to the mentioned matter. I am the principal clerk of<br />
The Lincoln News Messenger, a newspaper of general<br />
circulation, in the City of Lincoln, which is printed and published<br />
in the <strong>County</strong> of <strong>Placer</strong>. This newspaper has been judged a<br />
newspaper of general circulation by the Superior Court of the<br />
State of California, in and for the <strong>County</strong> of <strong>Placer</strong>, on the date<br />
of April 3, 1952, Superior Court Order Number 89429. The<br />
notice, of which the attached is a printed copy (set in type not<br />
smaller than nonpareil) has been published in each regular and<br />
entire issue of said newspaper and not in any supplement thereof<br />
on the following dates, to-wit:<br />
APRIL 13,20<br />
I certify, under penalty ofpetjury, that the foregoing is true and<br />
correct.<br />
Dated in Lincoln, California<br />
APRIL 20, 2011<br />
PROOF OF PUBLICATION<br />
THE LINCOLN NEWS MESSENGER<br />
553 F Street<br />
Lincoln, CA 95648
NORTHSTAR COMMUNITY SERVICES DISTRICT<br />
NOTICE OF THE REGULAR MEETING<br />
OF THE BOARD OF DIRECTORS<br />
DATE: MARCH 16, 2011<br />
TIME: 9 A.M.<br />
PLACE: NORTHSTAR FIRE STATION, 910 NORTHSTAR DRIVE<br />
I. CALL TO ORDER, PLEDGE OF ALLEGIANCE, ROLL CALL<br />
II. PUBLIC COMMENTS<br />
Any member of the public may address the Board after roll call on any topic related to the District that is<br />
not on the agenda. Public comment will be taken on agenda action items immediately prior to Board<br />
action.<br />
III. RECURRING BUSINESS<br />
1. Approval and Discussion of the minutes of the February 15, 2011 Finance Committee Meeting and the<br />
February 16, 2011 Regular Meeting.<br />
2. Meetings attended by NCSD Board Members – Discussion.<br />
IV. NEW BUSINESS<br />
3. East West Partners – Update.<br />
4. Northstar Property Owners Association – Update.<br />
5. CAMCO – Update.<br />
6. Northstar-at-Tahoe/Vail – Update.<br />
7. <strong>Martis</strong> <strong>Valley</strong> <strong>Groundwater</strong> <strong>Management</strong> <strong>Plan</strong> – Action to set Public Hearing on Resolution of Intention to<br />
cooperate in the preparation of the <strong>Martis</strong> <strong>Valley</strong> <strong>Groundwater</strong> <strong>Management</strong> <strong>Plan</strong> – Discussion – Action.<br />
8. Resolution 11-03 “Resolution Approving the Department of Forestry and Fire Protection Agreement for Services<br />
from July 1, 2010 to June 30, 2013” – Discussion – Action.<br />
9. Approval of Shift Proposal for Strategic Communications and Community Engagement Strategies – <strong>Martis</strong><br />
<strong>Valley</strong> Regional Trail – Discussion – Action.<br />
10. Approval of Memorandum of Agreement Between the North Lake Tahoe Resort Association and the Northstar<br />
Community Services District for use of Transient Occupancy Tax (TOT) Infrastructure Funds – Discussion –<br />
Action.<br />
11. Approval of Exempt Employee Flexible Work Schedule Policy – Discussion – Action.<br />
V. ATTORNEYS REPORT<br />
VI. CLOSED SESSION<br />
12. Conference with Legal Counsel – Existing Litigation [California Government Code Section<br />
54956.9(a)]; Two cases: 1) Name of Case: Community Facilities District #1 of the Northstar<br />
Community Services District vs. Highlands Hotel Residences Company, LLC, Bank of America, et al,<br />
<strong>Placer</strong> <strong>County</strong>, California Superior Court #SCV0027907. 2) Name of Case: Bank of America &<br />
Thomas Morone, as Receiver for Highlands Hotel Company vs. NCSD & Community Facilities District<br />
No. 1 of NCSD, <strong>Placer</strong> <strong>County</strong>, California Superior Court #SCV0028495.
Page 2 of 2 of the Agenda of the March 16, 2011 Regular Board Meeting<br />
13. Public Employee Performance Evaluation (Government Code Section 54957) – Titles: Engineering and<br />
Mapping Department: Information Systems Supervisor, Director of Public Works, Associate Engineer,<br />
GIS Analyst – Administration Department: Controller, Administrative Manager, Administrative<br />
Assistant, Human Resource Director<br />
14. Conference with Labor Negotiators (Government Code §54957.6) – Agency designated representatives:<br />
Jim Bowling, Mark Shadowens. Employee organization: Employee Representation – Fire Department<br />
employees.<br />
VII. DIRECTOR REPORTS<br />
Individual directors may give brief reports on miscellaneous items for the information of the other<br />
members of the board and NCSD staff. No action will be taken.<br />
VIII. OPERATION REPORTS<br />
15. General Managers Report – Staudenmayer – Discussion.<br />
16. Fire Department Report – Shadowens – Discussion.<br />
17. Director of Public Works Report – Geary – Discussion.<br />
18. Utilities Department Report – Ryan – Discussion.<br />
19. Administration Department Report – Tanner/Lewis/Bowling – Discussion.<br />
IX. WARRANT REGISTER & MELLO-ROOS REQUISITIONS<br />
20. Approval of the Warrant Register.<br />
21. Ratification of Mello-Roos Requisitions in the amount of $15,353.42.<br />
X. ADJOURNMENT<br />
Items may not be taken in the order listed above.<br />
In compliance with the Americans with Disabilities Act, if you are a disabled person and you need a<br />
disability-related modification or accommodation to participate in this meeting, then please contact Myra<br />
Tanner at (530) 562-0747 or (530) 562-1505 (fax). Requests must be made as early as possible and at least<br />
one-full business day before the start of the meeting.<br />
N ORTHSTAR C OMMUNITY S ERVICES D ISTRICT • 908 N ORTHSTAR D RIVE, N ORTHSTAR, CA 96161 • PAGE 2 OF 2
<strong>Martis</strong> <strong>Valley</strong> <strong>Groundwater</strong> <strong>Management</strong> <strong>Plan</strong><br />
Appendix B: Resolutions Adopting the <strong>Groundwater</strong><br />
<strong>Management</strong> <strong>Plan</strong><br />
DRAFT for review purposes only. Use of contents on this sheet is subject to the limitations specified at the end of this document.<br />
P:\40000\140691 - PCWA <strong>Martis</strong> <strong>Valley</strong> GWP\GMP\Report\3rd Draft\<strong>Martis</strong> <strong>Valley</strong> GMP Draft 01-09-13.docx<br />
B
<strong>Martis</strong> <strong>Valley</strong> <strong>Groundwater</strong> <strong>Management</strong> <strong>Plan</strong><br />
Appendix C: Public Outreach <strong>Plan</strong><br />
DRAFT for review purposes only. Use of contents on this sheet is subject to the limitations specified at the end of this document.<br />
P:\40000\140691 - PCWA <strong>Martis</strong> <strong>Valley</strong> GWP\GMP\Report\3rd Draft\<strong>Martis</strong> <strong>Valley</strong> GMP Draft 01-09-13.docx<br />
C
10540 White Rock Road, Suite 180<br />
Rancho Cordova, CA 95670<br />
Tel: 916-444-0123<br />
Fax: 916-635-8805<br />
Project Title: <strong>Martis</strong> <strong>Valley</strong> <strong>Groundwater</strong> <strong>Management</strong> <strong>Plan</strong><br />
Project No: 140691<br />
Technical Memorandum<br />
Public Outreach <strong>Plan</strong> Technical Memorandum (Deliverable Task 1.2)<br />
Date: May 25, 2011<br />
To: Tony Firenzi, Brian Martin, Michael Holley, Steven Poncelet, and Mike Staudenmayer<br />
From: Tina Bauer, Project Manager<br />
Prepared by:<br />
Reviewed by:<br />
John Ayres, Task One Manager<br />
Tina M. Bauer, Project Manager
Introduction<br />
<strong>Martis</strong> <strong>Valley</strong> GMP – Draft Public Outreach <strong>Plan</strong><br />
The partnership of <strong>Placer</strong> <strong>County</strong> <strong>Water</strong> Agency (PCWA), Truckee Donner Public Utilities District (TDPUD), and<br />
Northstar Community Services District (NCSD), herein referred to as the partnership agencies, are working<br />
together to update a <strong>Groundwater</strong> <strong>Management</strong> <strong>Plan</strong> (GMP) for the <strong>Martis</strong> <strong>Valley</strong> in accordance with the<br />
California <strong>Water</strong> Code, Article 107050. The overall goal of the GMP is to develop a framework that maintains<br />
groundwater quantity and quality, thereby providing a sustainable, high-quality supply for beneficial use<br />
in the <strong>Martis</strong> <strong>Valley</strong>. Brown and Caldwell (BC) has been contracted by the partnership to prepare the GMP<br />
and perform public outreach activities.<br />
The reasons for updating the <strong>Martis</strong> <strong>Valley</strong> GMP are to:<br />
• Reflect current water resources planning in the region,<br />
• Update the understanding of the underlying groundwater basin, and<br />
• Prepare the plan in partnership with basin water purveyors in an effort to work collaboratively and align<br />
policy.<br />
In addition to updating the GMP a computer model of the groundwater basin will be developed by the Desert<br />
Research Institute (through a grant from the Bureau of Reclamation) which will assimilate available data and<br />
enhance the understanding of the basin. This groundwater model will be used as a tool to improve basin<br />
understanding during GMP development.<br />
Public outreach as described herein is a key component of the process in preparing the GMP.<br />
Public Outreach Objectives<br />
This plan’s outreach activities are designed to meet the following outreach objectives:<br />
• Inform the public regarding the development of the GMP.<br />
• Provide meaningful opportunities for stakeholders and the general public to contribute to the development<br />
of the GMP.<br />
• Incorporate stakeholder input regarding the GMP.<br />
• Document stakeholder recommendations in a clear, complete manner.<br />
• Develop public understanding and support of the GMP.<br />
To pursue these objectives effectively, various outreach methods will be necessary to reach the groups<br />
targeted for inclusion in the planning process.<br />
<strong>Groundwater</strong> <strong>Management</strong> <strong>Plan</strong> Preparation<br />
During the course of preparing the GMP, various entities will be involved in developing, approving, and<br />
adopting the GMP. Their roles and responsibilities are as follows:<br />
Partnership Agencies – Each individual agency will follow the GMP adoption process. As such, each agency<br />
will conduct two public hearings. The first hearing will be to adopt a resolution of intent to prepare a GMP<br />
and the second hearing will be to determine whether or not to adopt the GMP. These hearings will be<br />
conducted in compliance with the California <strong>Water</strong> Code, Article 10753.2 through Article 10753.6. Hearings<br />
were held by each agency in April 2011 to indicate to the public the intent of the agencies to develop a GMP.<br />
The public was notified in advance in accordance with the California <strong>Water</strong> Code.<br />
<strong>Groundwater</strong> <strong>Management</strong> <strong>Plan</strong> Team – The GMP team consists of the partnership agencies, BC, and BC’s<br />
subcontractor, Balance Hydrologics, Inc of Truckee, Ca. Brown and Caldwell will perform the majority of the<br />
technical work and analyses, conduct and document the public outreach effort, conduct public meetings and<br />
SWG meetings, develop and maintain a website so that information on the project is available to interested<br />
P:\40000\140691 - PCWA <strong>Martis</strong> <strong>Valley</strong> GWP\Public Outreach\Public Outreach <strong>Plan</strong>\<strong>Martis</strong> <strong>Valley</strong> GMP Public Outreach <strong>Plan</strong> Final 5-25-11.docx<br />
2
<strong>Martis</strong> <strong>Valley</strong> GMP – Draft Public Outreach <strong>Plan</strong><br />
parties, and prepare newsletters and notifications of meetings and events. The partnership agencies will<br />
provide available resource data, GIS information, and review BC’s work. The partnership agencies will<br />
provide the names and addresses of special interest groups and interested public members, and assist in<br />
distributing newsletters and notifications of meetings and events through the media. The Partnership<br />
Agencies will also provide available data and information related to land and water use policies and ordinances<br />
affecting water management in <strong>Martis</strong> <strong>Valley</strong>.<br />
Stakeholder Working Group – The Stakeholder Working Group (SWG) will be comprised of representatives of<br />
federal, state, and local governments, environmental and special interest groups, local land use interests,<br />
and the general public selected by the partnership agencies. The SWG will provide local knowledge, data and<br />
information, opinions, and review and comment on material prepared by the GMP team. Five meetings with<br />
the SWG are anticipated to occur at strategic times for addressing particular items, as appropriate.<br />
General Public – The public will be invited to participate in two public hearings for each partnership agency<br />
and two public workshops. The first workshop will explain the process of GMP development and present<br />
groundwater model concepts (July 2011). The second workshop will be conducted near project completion<br />
and will provide an overview of GMP content. The first agency public hearings have been completed. The<br />
second agency public hearings will be conducted at project completion (anticipated November 2012). All<br />
agency public hearings will be in compliance with the California <strong>Water</strong> Code, Article 107050.<br />
Communications and Notifications<br />
Communication and notification is an important aspect of effective outreach. Various means of communication<br />
and notification will be utilized to implement this Public Outreach <strong>Plan</strong> including the following:<br />
Notifications - Notifications are the primary method of outreach used to inform the public of upcoming<br />
meetings and hearings. Notifications will be published in the Sierra Sun and the Auburn Journal and will be<br />
prepared and submitted to the review group approximately one week prior to the planned publication date.<br />
Website - During project implementation, a public website will be developed and hosted. The website will<br />
also contain basic information about the project, including project goals, sponsoring agencies, and who to<br />
contact for more information. The website will be updated monthly to supply regular information updates to<br />
the public about project progress, data gathered, and decisions made. The website will have pages dedicated<br />
to GMP development, groundwater model development, and a page that provides notices, newsletters,<br />
and quarterly reports.<br />
Mailing/Contact List - A list of the names and addresses of participants and interested parties will be<br />
created by BC and used for communicating information regarding meetings and materials related to the<br />
GMP.<br />
Newsletters - Public outreach will include three newsletters. Newsletters will consist of a double-sided full<br />
page color flyer that provides basic information about the project including the project goal, sponsoring<br />
agencies, and who to contact for more information. Each newsletter will address specific components of the<br />
project. The newsletters will be distributed at each partnership agency office and be uploaded onto the<br />
website.<br />
Public Workshops, Public Hearings, and SWG Meetings<br />
An important part of the public outreach will be the communications provided by the GMP team and comments<br />
provided by those participating in a particular forum. In general, the framework for the various forums<br />
conducted by Brown and Caldwell will be as described below. The timing for conducting the respective<br />
forums is shown on attached Table 1. Communications and notifications will be made in advance of each<br />
forum using the means noted.<br />
P:\40000\140691 - PCWA <strong>Martis</strong> <strong>Valley</strong> GWP\Public Outreach\Public Outreach <strong>Plan</strong>\<strong>Martis</strong> <strong>Valley</strong> GMP Public Outreach <strong>Plan</strong> Final 5-25-11.docx<br />
3
<strong>Martis</strong> <strong>Valley</strong> GMP – Draft Public Outreach <strong>Plan</strong><br />
Public Workshops – Two public workshops will be conducted. The 1st public workshop will be held to explain<br />
the process of GMP and model development to the public. This goal of this workshop is to inform the public<br />
of the purpose of the GMP and expected outcomes of GMP and model development. The second public<br />
workshop will provide an overview of GMP content and present groundwater modeling results. The goal of<br />
this workshop is to build public support of the GMP and model. Public workshops will be held using an open<br />
format, with presenters at multiple stations in different parts of the meeting room. Each presenter will be<br />
focused on a specific component of project development, and will have visual materials with them to facilitate<br />
explanation of the subject matter. Meeting participants will move from station to station according to<br />
their interests and time constraints.<br />
Public Hearings – Two public hearings are required to adopt a GMP in compliance with the California <strong>Water</strong><br />
Code, Article 17050. The first public hearing is conducted to adopt a resolution of intent to prepare a GMP<br />
and the second public hearing will be conducted to determine whether or not to adopt the GMP. Hearings<br />
were held by each partnership agency in April, 2011 to indicate to the public the intent of the agencies to<br />
develop a GMP.<br />
Stakeholder Working Group Meetings – During the course of the project, meetings will be held with the<br />
partnership agencies and the SWG. All meetings will have an agenda and PowerPoint presentation with<br />
copies of pertinent information, as appropriate. Notes of the meetings will be prepared to document the<br />
salient items discussed. The anticipated content of the SWG meetings are as follows:<br />
• The 1st SWG meeting will be held to introduce SWG members to the project and solicit their involvement.<br />
Presentation materials will include an overview of GMP content, discussion of the GMP’s relationship with<br />
the groundwater model, and discussion of SWG member’s local knowledge and the SWG’s role during<br />
GMP development.<br />
• The 2nd SWG meeting will present the conceptual model and physical conditions of the groundwater basin<br />
to SWG members. The physical conditions of the <strong>Martis</strong> <strong>Valley</strong> groundwater basin will be presented, including<br />
cross sections, monitoring well hydrographs, and other information as appropriate. The goal of<br />
this meeting is form consensus on what groundwater resources are present in the basin to be managed<br />
by the GMP.<br />
• The 3rd SWG meeting will present preliminary GMP goals and management objectives for comment and<br />
suggestions to SWG members. The goal of this meeting is to build consensus about the identified goal<br />
and management objectives of the GMP.<br />
• The 4th SWG meeting will present preliminary implementation actions and implementation schedule to<br />
the SWG for comment and suggestions. The goal of this meeting is to fully identify implementation actions<br />
for the GMP.<br />
• The goal of the 5th SWG meeting is to discuss steps taken after adoption of the GWMP.<br />
Summary of Opportunities for Public Participation<br />
The partnership agencies are providing numerous opportunities for the public to participate in and to stay<br />
informed throughout the GMP planning process. A summary of the opportunities noted above with the<br />
anticipated timing of the event, as shown on the Outreach Activity Schedule, include the following:<br />
• Partnership agency meetings and public hearings.<br />
• Public Workshops.<br />
In addition, a website will be available to the public to facilitate being informed of meeting dates, draft<br />
documents, notices, newsletters, and contact information.<br />
P:\40000\140691 - PCWA <strong>Martis</strong> <strong>Valley</strong> GWP\Public Outreach\Public Outreach <strong>Plan</strong>\<strong>Martis</strong> <strong>Valley</strong> GMP Public Outreach <strong>Plan</strong> Final 5-25-11.docx<br />
4
Table 1 Outreach Scheduule<br />
PP:\40000\140691<br />
- PCW WA <strong>Martis</strong> <strong>Valley</strong> GWP\Public Outreach\Public Outreach <strong>Plan</strong>\<strong>Martis</strong> <strong>Valley</strong> GMMP<br />
Public Outreach <strong>Plan</strong> Final 5-25-11.docx<br />
<strong>Martis</strong> <strong>Valley</strong> GMP – Draft Public Outreach <strong>Plan</strong><br />
5
<strong>Martis</strong> <strong>Valley</strong> <strong>Groundwater</strong> <strong>Management</strong> <strong>Plan</strong><br />
Appendix D: CASGEM Monitoring <strong>Plan</strong><br />
DRAFT for review purposes only. Use of contents on this sheet is subject to the limitations specified at the end of this document.<br />
P:\40000\140691 - PCWA <strong>Martis</strong> <strong>Valley</strong> GWP\GMP\Report\3rd Draft\<strong>Martis</strong> <strong>Valley</strong> GMP Draft 01-09-13.docx<br />
D
<strong>Martis</strong> <strong>Valley</strong> <strong>Groundwater</strong> Monitoring Program<br />
California Statewide <strong>Groundwater</strong> Elevation Monitoring (CASGEM)<br />
<strong>Placer</strong> <strong>County</strong><br />
<strong>Water</strong> Agency<br />
Truckee Donner<br />
Public Utilities District<br />
Northstar Community<br />
Services District<br />
December 2011<br />
Revised July 12, 2012
TABLE OF CONTENTS<br />
i<br />
Table of Contents<br />
1.0 INTRODUCTION .................................................................................................... 1-1<br />
2.0 BACKGROUND ..................................................................................................... 2-1<br />
3.0 MONITORING NETWORK .................................................................................... 3-1<br />
4.0 MONITORING EQUIPMENT AND PREPARATION .............................................. 4-1<br />
5.0 DEPTH-TO-GROUNDWATER PROCEDURES AND FREQUENCY OF<br />
MONITORING AND REPORTING ............................................................................... 5-1<br />
6.0 RECORDING OF MONITORING DATA, DATA MANAGEMENT AND THE<br />
CASGEM REQUIREMENTS ........................................................................................ 6-1<br />
APPENDICES<br />
Appendix A – CASGEM Guidelines<br />
Appendix B – CASGEM Monitoring <strong>Plan</strong> Summary
1.0 INTRODUCTION<br />
1-1<br />
Introduction<br />
This <strong>Martis</strong> <strong>Valley</strong> (MV) <strong>Groundwater</strong> Monitoring Program (Monitoring Program) report serves<br />
to describe the activities related to the monitoring of groundwater elevations in the MV area, as<br />
shown on Figure 1-1.<br />
The elevation data gathered as part of this program will be included as part of the California<br />
Statewide <strong>Groundwater</strong> Elevation Monitoring (CASGEM) Program recently adopted by the<br />
California Department of <strong>Water</strong> Resources (DWR) as part of their mandated monitoring<br />
requirements under Senate Bill (SB) 6 1 of the State <strong>Water</strong> Code. This report strongly<br />
encourages the reader to review and understand the full text of the CASGEM Well Monitoring<br />
Guidelines, attached as Appendix A.<br />
This Monitoring Program pulls together the efforts completed to date in the identification of<br />
existing and future well monitoring sites that satisfy the local and state requirements for a<br />
monitored groundwater basin. In addition, the Monitoring Program prepares the MV<br />
groundwater users to initiate a semi-annual monitoring event, which started with its first<br />
measurements in fall of 2011. <strong>Placer</strong> <strong>County</strong> <strong>Water</strong> Agency (PCWA), Truckee Donner Public<br />
Utilities District (TDPUD), and Northstar Community Services District (NCSD) are the three<br />
partners in MV area, in which their respective services areas are presented in Figure 1-1.<br />
All field forms and measurement methods are included herein for the sole purpose of providing<br />
monitoring staff with easy access to printing and using these forms as part of their monitoring<br />
activities. The MV Monitoring Program report is a living document subject to change over time<br />
as more information is collected on the wells, and as technologies change to provide the best<br />
measurement of groundwater levels and water quality, and as more wells become available.<br />
1 SB 6 requires collaboration between local monitoring parties, or entities, and DWR to collect groundwater elevations<br />
statewide and that this information is made available to the public. SB 6 provides that:<br />
Local parties may assume responsibility for monitoring and reporting groundwater elevations.<br />
DWR work cooperatively with local Monitoring Entities to achieve monitoring programs that demonstrate<br />
seasonal and long-term trends in groundwater elevations.<br />
DWR accept and review prospective Monitoring Entity submittals, then determine the designated Monitoring<br />
Entity, notify the Monitoring Entity, and make that information available to the public.<br />
DWR perform groundwater elevation monitoring in basins where no local party has agreed to perform the<br />
monitoring functions.<br />
If local parties (for example, counties) do not volunteer to perform the groundwater monitoring functions, and<br />
DWR assumes those functions, then those parties become ineligible for water grants or loans from the<br />
State.
FIGURE 1-1. MAP OF GROUNDWATER BASIN TO BE MONITORED<br />
1-2<br />
Introduction
1.1 ORGANIZATION OF REPORT<br />
The Monitoring Program will be described in the sections summarized below:<br />
1-3<br />
Introduction<br />
Section 1. Introduction – An initial summary of the report’s contents and goals while<br />
highlighting the reasons for the Monitoring Program.<br />
Section 2. Background – A brief understanding of the groundwater aquifer is provided<br />
to ensure a minimum level of understanding by field staff of the conditions taking place<br />
below the ground.<br />
Section 3. Monitoring Network – Criteria for selection of monitoring wells is described<br />
and the current list of wells to be monitored is provided.<br />
Section 4. Monitoring Equipment and Preparation – Each monitoring event requires<br />
an inventory of the equipment that will be taken out into the field and to have staff<br />
trained to conduct the measurement and interface with the well owners.<br />
Section 5. Depth-to-<strong>Groundwater</strong> Procedures and Frequency of Monitoring and<br />
Reporting – The resolution of measurement data is described with a brief discussion of<br />
the pros and cons of high and low sampling frequency.<br />
Section 6. Recording of Monitoring Data, Data <strong>Management</strong> and the CASGEM<br />
Requirements – Once data is brought back from the field (and laboratory); all data will<br />
need to be uploaded to the State. DWR will allow batch uploading and downloading<br />
using the CASGEM database and graphical user interface.
2.0 BACKGROUND<br />
2-1<br />
Background<br />
This section briefly describes the MV groundwater basin. The MV basin is located beneath the<br />
Truckee River, near Truckee, CA, in which the Truckee River crosses the basin from south to<br />
east in a shallow, incised channel. Principal tributaries to the Truckee River are Donner Creek,<br />
<strong>Martis</strong> Creek, and Prosser Creek. Major surface water storage reservoirs include Donner Lake,<br />
<strong>Martis</strong> Creek Lake, and Prosser Creek Reservoir. State driller logs required as part of the well<br />
construction process provide the lithology (i.e., soil types and thickness) to characterize the<br />
water-bearing formations.<br />
Figure 1 delineates the MV groundwater basin along with overlying geography and the<br />
alignment of three basin cross sections. These cross sections are presented in Plates 1, 2, and 3.<br />
The geological formations in the MV basin include basement rocks, sedimentary deposits, and<br />
volcanic deposits. The two types of basement rock in this region are Cretaceous-Jurassic<br />
plutonic/metamorphic rocks and Miocene volcanic units. Plutonic/metamorphic rocks appear<br />
east of the basin and Miocene volcanic units which ranges from andesite to basalt appear<br />
adjacent to the basin. These basement rocks contain a very small portion of the groundwater.<br />
Sedimentary deposits which include stream/lake deposits and alluvial material provide storage<br />
for groundwater. Volcanic deposits include basaltic andesite lava, tuff breccia and volcaniclastic<br />
deposits, and also provide storage for groundwater. Municipal and private wells in the basin<br />
primarily extract from the Prosser Creek Alluvium and Truckee Formation, with some Shallow<br />
wells also extracting from Outwash Deposits.
210142 X-sec locations.mxd<br />
C<br />
B<br />
A<br />
Figure 1. Geologic cross-section locations,<br />
<strong>Martis</strong> <strong>Groundwater</strong> <strong>Management</strong> <strong>Plan</strong>,<br />
<strong>Placer</strong> and Nevada Counties, California<br />
A'<br />
C'<br />
B'<br />
o<br />
SIERRA COUNTY<br />
N EVADA COUNTY<br />
TRUCKEE<br />
Lake<br />
Tahoe<br />
LACER COUNTY<br />
Legend<br />
Cross-section location<br />
<strong>Martis</strong> <strong>Groundwater</strong> Basin<br />
0 0.5 1 1.5 2<br />
Miles<br />
2011 Balance Hydrologics, Inc.
ELEVATION (FEET NAVD88)<br />
A<br />
North<br />
7500<br />
7000<br />
6500<br />
6000<br />
5500<br />
5000<br />
4500<br />
4000<br />
75001<br />
?<br />
Qv<br />
?<br />
Tt<br />
Prosser Creek<br />
Reservoir<br />
?<br />
?<br />
365668<br />
Prosser Creek<br />
Reservoir<br />
?<br />
?<br />
?<br />
Tt<br />
? ? ?<br />
0 10,000 20,000<br />
Qv<br />
Qgo<br />
QPs<br />
NOTES:<br />
1. Approximate vertical exaggeration = 5x.<br />
2. Elevation profile developed from 30-meter digital elevation model,<br />
downloaded from National Elevation Dataset<br />
(http://seamless.usgs.gov/index.php).<br />
3. Well log locations are approximate within 600 feet.<br />
\\192.168.1.152\gis\Projects\210142 <strong>Martis</strong> GMP\CrossSection\110925_Plate01_ProfileA-A_FinalDraft.ai<br />
Tv<br />
Qpc<br />
Polaris Fault<br />
101008<br />
155710<br />
?<br />
Cross-Section B-B’<br />
323656<br />
Interstate 80<br />
? ? ?<br />
E008545<br />
312958<br />
421088<br />
301841<br />
Qv<br />
? QPs<br />
? ? ?<br />
Qv<br />
Truckee River<br />
?<br />
?<br />
?<br />
Tt<br />
?<br />
?<br />
Tv<br />
?<br />
? ?<br />
30,000 40,000 50,000 60,000<br />
DISTANCE IN FEET<br />
4. Fault locations are approximate, based on Saucedo, “Geologic Map of Lake Tahoe Basin,”<br />
2005 and Hunter and others, 2011.<br />
5. Surficial geology inferred from Saucedo, 2005.<br />
6. Significant sand, gravel, and clay beds shown where noted in well logs.<br />
7. Fracture zones shown where noted in well logs.<br />
119958<br />
Cross-Section C-C’<br />
733244<br />
Qgo<br />
Truckee-Tahoe<br />
Airport<br />
Nevada <strong>Placer</strong><br />
Qv<br />
<strong>County</strong> Line<br />
Qpc<br />
372325<br />
California State<br />
Route 267<br />
?<br />
Fault Zone<br />
733247<br />
Qpc<br />
Qv<br />
Qv<br />
?<br />
Qgo<br />
Tv<br />
429743<br />
?<br />
?<br />
433365<br />
Tv<br />
?<br />
Vertical Exaggeration ~5x<br />
A’<br />
South<br />
References:<br />
Birkeland, P.W., 1963 Pleistocene History of the Truckee area, north of Lake Tahoe, California, Geological Society of America<br />
Bulletin, v. 64, p. 1453-1464.<br />
Hunter, L.E., Howle, J.F., Rose, R.S., and Bawden, G.W., 2011, LiDAR – assisted identification of an active fault near Truckee,<br />
California, Bulletin of the Seismological Society of America, v. 101, n. 3, p. 1162-1181.<br />
Latham, T.S., 1985, Stratigraphy, structure, and geochemistry of Plio-Pleistocene volcanic rocks of the western Basin and Range<br />
Province, near Truckee, California, unpublished doctoral dissertation, University of California, Davis, 341 p.<br />
Melody, A., 2009, Active faulting and Quaternary paleohydrology of the Truckee Fault Zone north of Truckee, California, MS<br />
Thesis, Humboldt State University, Humboldt, CA 71 p.<br />
Saucedo, G.J., 2005, Geologic Map of Lake Tahoe Basin, California and Nevada, California<br />
Geological Survey Regional Geologic Map Series, Map No. 4, 1:100,000 scale.<br />
?<br />
7500<br />
7000<br />
6500<br />
6000<br />
5500<br />
5000<br />
4500<br />
4000<br />
ELEVATION (FEET NAVD88)<br />
Plate 1: Cross-section A-A’<br />
<strong>Martis</strong> <strong>Groundwater</strong> Basin,<br />
<strong>Placer</strong> and Nevada Counties, California<br />
Qg<br />
Qgo<br />
Qpc<br />
Qv<br />
QPs<br />
Tt<br />
Tv<br />
?<br />
429743<br />
Glacial Till/Moraine<br />
Glacial Outwash deposits<br />
Prosser Creek alluvium<br />
(Pleistocene)<br />
Lousetown Volcanics<br />
(Pleistocene)<br />
Lousetown Interbedded Sediments<br />
(Unnamed gravels, sand and alluvium)<br />
(Pliocene and (or) Pleistocene)<br />
Truckee Formation<br />
(Lake and Stream Deposits)<br />
Tertiary Volcanics<br />
Sands and Gravels<br />
Clay Bed<br />
Tuff/Ash<br />
Interbedded Basalt<br />
and Andesite Basalt<br />
Fracture Zone<br />
Lithologic Contact<br />
Inferred Lithologic Contact<br />
Fault, direction of displacement<br />
(dashed where inferred)<br />
Well log<br />
©2011 Balance Hydrologics, Inc.
ELEVATION (FEET NAVD88)<br />
B<br />
West<br />
7500<br />
7000<br />
6500<br />
6000<br />
5500<br />
5000<br />
4500<br />
4000<br />
752945<br />
Tt<br />
?<br />
180560<br />
312956<br />
NOTES:<br />
1. Approximate vertical exaggeration = 5x.<br />
2. Elevation profile developed from 30-meter digital elevation model,<br />
downloaded from National Elevation Dataset<br />
(http://seamless.usgs.gov/index.php).<br />
3. Well log locations are approximate within 600 feet.<br />
Tv<br />
?<br />
Qv<br />
\\192.168.1.152\gis\Projects\210142 <strong>Martis</strong> GMP\CrossSection\110925ProfileB_BFinalDraft.ai<br />
290853<br />
?<br />
312985<br />
354807<br />
0 10,000 20,000<br />
Qgo<br />
?<br />
Highway 89<br />
?<br />
38890<br />
753025<br />
?<br />
323656<br />
153113<br />
186854<br />
119903<br />
4. Fault locations are approximate, based on Saucedo, “Geologic Map of Lake Tahoe Basin,”<br />
2005 and Hunter and others, 2011.<br />
5. Surficial geology inferred from Saucedo, 2005.<br />
6. Significant sand, gravel, and clay beds shown where noted in well logs.<br />
7. Fracture zones shown where noted in well logs.<br />
?<br />
290858<br />
233993<br />
Prosser Village Well<br />
DISTANCE IN FEET<br />
?<br />
?<br />
712059<br />
181525<br />
Qgo<br />
Qpc<br />
Qps<br />
Qgo<br />
Qpc<br />
Qpc<br />
Qps<br />
Qv<br />
Tt<br />
Cross-Section A-A’<br />
Polaris Fault<br />
Tv<br />
?<br />
?<br />
753383<br />
Qv<br />
Tt<br />
Tv<br />
Truckee River<br />
?<br />
Qv<br />
?<br />
233946<br />
Qgo<br />
Qv<br />
?<br />
Qjf<br />
433600<br />
?<br />
Tt<br />
Qjf<br />
Tv<br />
65421<br />
30,000 40,000<br />
Qv<br />
References:<br />
Birkeland, P.W., 1963 Pleistocene History of the Truckee area, north of Lake Tahoe, California, Geological Society of America<br />
Bulletin, v. 64, p. 1453-1464.<br />
Hunter, L.E., Howle, J.F., Rose, R.S., and Bawden, G.W., 2011, LiDAR – assisted identification of an active fault near Truckee,<br />
California, Bulletin of the Seismological Society of America, v. 101, n. 3, p. 1162-1181.<br />
Latham, T.S., 1985, Stratigraphy, structure, and geochemistry of Plio-Pleistocene volcanic rocks of the western Basin and Range<br />
Province, near Truckee, California, unpublished doctoral dissertation, University of California, Davis, 341 p.<br />
Melody, A., 2009, Active faulting and Quaternary paleohydrology of the Truckee Fault Zone north of Truckee, California, MS<br />
Thesis, Humboldt State University, Humboldt, CA 71 p.<br />
Saucedo, G.J., 2005, Geologic Map of Lake Tahoe Basin, California and Nevada, California<br />
Geological Survey Regional Geologic Map Series, Map No. 4, 1:100,000 scale.<br />
?<br />
Qls<br />
561677<br />
769296<br />
Qv<br />
?<br />
Qgo<br />
Vertical Exaggeration ~5x<br />
B’<br />
East<br />
7500<br />
7000<br />
6500<br />
6000<br />
5500<br />
5000<br />
4500<br />
ELEVATION (FEET NAVD88)<br />
Plate 2: Cross-section B-B’<br />
<strong>Martis</strong> <strong>Groundwater</strong> Basin,<br />
<strong>Placer</strong> and Nevada Counties, California<br />
Qg<br />
Qgo<br />
Qls<br />
Qjf<br />
Qpc<br />
Qv<br />
QPs<br />
Tt<br />
Tv<br />
?<br />
429743<br />
GlacialTill/Moraine<br />
Glacial Outwash deposits<br />
Landslide deposits<br />
Juniper Flat alluvium<br />
(Pleistocene)<br />
Prosser Creek alluvium<br />
(Pleistocene)<br />
Lousetown Volcanics<br />
(Pleistocene)<br />
Lousetown Interbedded Sediments<br />
(Unnamed gravels, sand and alluvium)<br />
(Pliocene and (or) Pleistocene)<br />
Truckee Formation<br />
(Lake and Stream Deposits)<br />
Tertiary Volcanics<br />
Sands and Gravels<br />
Clay Bed<br />
Tuff/Ash<br />
Interbedded Basalt<br />
and Andesite Basalt<br />
Fracture Zone<br />
Lithologic Contact<br />
Inferred Lithologic Contact<br />
Fault, direction of displacement<br />
(dashed where inferred)<br />
Well log<br />
©2011 Balance Hydrologics, Inc.
ELEVATION (FEET NAVD88)<br />
7500<br />
7000<br />
6500<br />
6000<br />
5500<br />
5000<br />
4500<br />
4000<br />
C<br />
West<br />
Qgo<br />
62503<br />
10612<br />
?<br />
Tahoe Moraine Truckee-Tahoe<br />
<strong>Martis</strong> Creek<br />
Dry Lake<br />
Airport<br />
Polaris Fault<br />
Tv<br />
Qv<br />
116952<br />
Qps<br />
354809<br />
Qgo<br />
Qpc<br />
Qv<br />
Qps<br />
0 10,000 20,000<br />
DISTANCE IN FEET<br />
NOTES:<br />
1. Approximate vertical exaggeration = 5x.<br />
2. Elevation profile developed from 30-meter digital elevation model,<br />
downloaded from National Elevation Dataset<br />
(http://seamless.usgs.gov/index.php).<br />
3. Well log locations are approximate within 600 feet.<br />
Qg<br />
Tt<br />
?<br />
?<br />
Tt<br />
?<br />
\\192.168.1.152\gis\Projects\210142 <strong>Martis</strong> GMP\CrossSection\110925_Plate03_ProfileC_C_FinalDraft.ai<br />
Southside<br />
62502<br />
?<br />
323549<br />
?<br />
Qv<br />
Qgo<br />
Tv<br />
Qpc<br />
Tt<br />
119914<br />
?<br />
733244<br />
733241<br />
Qgo<br />
4. Fault locations are approximate, based on Saucedo, “Geologic Map of Lake Tahoe Basin,”<br />
2005 and Hunter and others, 2011.<br />
5. Surficial geology contacts inferred from Saucedo, 2005.<br />
6. Significant sand, gravel, and clay beds shown where noted in well logs.<br />
7. Fracture zones shown where noted in well logs.<br />
Cross-Section A-A’<br />
?<br />
?<br />
Tv<br />
116960<br />
Qv<br />
Qpc<br />
Tt<br />
422739<br />
Tv<br />
Tt<br />
?<br />
233973<br />
575720<br />
575706<br />
119946<br />
712334<br />
30,000 40,000<br />
Tt<br />
Tv<br />
Qv<br />
? ?<br />
? ?<br />
Vertical Exaggeration ~5x<br />
C’<br />
East<br />
References:<br />
Birkeland, P.W., 1963 Pleistocene History of the Truckee area, north of Lake Tahoe, California, Geological Society of America<br />
Bulletin, v. 64, p. 1453-1464.<br />
Hunter, L.E., Howle, J.F., Rose, R.S., and Bawden, G.W., 2011, LiDAR – assisted identification of an active fault near Truckee,<br />
California, Bulletin of the Seismological Society of America, v. 101, n. 3, p. 1162-1181.<br />
Latham, T.S., 1985, Stratigraphy, structure, and geochemistry of Plio-Pleistocene volcanic rocks of the western Basin and Range<br />
Province, near Truckee, California, unpublished doctoral dissertation, University of California, Davis, 341 p.<br />
Melody, A., 2009, Active faulting and Quaternary paleohydrology of the Truckee Fault Zone north of Truckee, California, MS<br />
Thesis, Humboldt State University, Humboldt, CA 71 p.<br />
Saucedo, G.J., 2005, Geologic Map of Lake Tahoe Basin, California and Nevada, California<br />
Geological Survey Regional Geologic Map Series, Map No. 4, 1:100,000 scale.<br />
7500<br />
7000<br />
6500<br />
6000<br />
5500<br />
5000<br />
4500<br />
4000<br />
ELEVATION (FEET NAVD88)<br />
Plate 3: Cross-section C-C’<br />
<strong>Martis</strong> <strong>Groundwater</strong> Basin,<br />
<strong>Placer</strong> and Nevada Counties, California<br />
Qg<br />
Qgo<br />
Qpc<br />
Qv<br />
QPs<br />
Tt<br />
Tv<br />
?<br />
429743<br />
Glacial Till/Moraine<br />
Glacial Outwash deposits<br />
Prosser Creek alluvium<br />
(Pleistocene)<br />
Lousetown Volcanics<br />
(Pleistocene)<br />
Lousetown Interbedded Sediments<br />
(Unnamed gravels, sand and alluvium)<br />
(Pliocene and (or) Pleistocene)<br />
Truckee Formation<br />
(Lake and Stream Deposits)<br />
Tertiary Volcanics<br />
Sands and Gravels<br />
Clay Bed<br />
Tuff/Ash<br />
Interbedded Basalt<br />
and Andesite Basalt<br />
Fracture Zone<br />
Lithologic Contact<br />
Inferred Lithologic Contact<br />
Fault, direction of displacement<br />
(dashed where inferred)<br />
Well log<br />
©2011 Balance Hydrologics, Inc.
3.0 MONITORING NETWORK<br />
3-1<br />
Monitoring Network<br />
The following sections describe the rationale for selection of monitoring wells to be included in<br />
the monitoring network. Because surface water and groundwater may interact, the monitoring<br />
network may need to be expanded at some future date to include data available from surface<br />
water monitoring of major rivers and local streams. The partners involved in this Monitoring<br />
Program are also underway in preparing an updated <strong>Groundwater</strong> <strong>Management</strong> <strong>Plan</strong> (GMP) and<br />
groundwater model. It is anticipated that knowledge gained from that effort will help inform the<br />
partners and the State on where additional monitoring points, in the ground and at the surface,<br />
should be located. If existing wells are not available at such locations, the partners will seek<br />
opportunities to construct new ones in data gap areas.<br />
3.1 RATIONALE OF MONITORING NETWORK<br />
In order to manage groundwater resources for long-term sustainability, key issues in the basin<br />
that need to be documented include:<br />
Identification of sources of recharge and the protection of recharge areas<br />
Changes in groundwater elevations that affect groundwater storage<br />
<strong>Groundwater</strong> quality and changes over time<br />
The following sections describe the rationale for selecting the MV monitoring network well sites.<br />
MV groundwater monitoring wells will be selected to provide regional coverage that can be<br />
economically accomplished yet provide high quality, reliable data that adequately characterizes<br />
basin conditions over time. The location and spacing of the MV monitoring wells are expected<br />
to vary, dependent upon a group of selected characteristics (i.e., geographic location,<br />
accessibility, age, well construction, well log availability, etc.). The approach described herein is<br />
intended to assist in the selection of monitoring locations that are sufficiently distinct from each<br />
other and address the issues bulleted above.<br />
3.2 GROUNDWATER WELL NETWORK DEVELOPMENT PROCESS<br />
A database of wells in <strong>Martis</strong> <strong>Valley</strong> was developed as part of the GMP and modeling effort.<br />
The State well logs provided more than 700 wells; however, these were filtered to omit wells that<br />
had limited information available, shallow depths, and other factors that rendered them not<br />
useful for hydrogeologic evaluation. The database includes 197 wells that are presented in<br />
Figure 3-1, in which wells owned and operated by the three partners are distinguished from the<br />
others. These wells include municipal and private, monitoring and production, and are generally<br />
concentrated in the lowland areas of the basin surrounding the Truckee River and other surface<br />
waters. In addition to these wells, wells currently monitored by the State Department of <strong>Water</strong><br />
Resources (DWR) are presented.
DWR CASGEM Well<br />
FIGURE 3-1. EXISTING WELLS IN MARTIS VALLEY<br />
3-2<br />
17N17E19K001M<br />
18N17E33L001M<br />
Monitoring Network
3-3<br />
Monitoring Network<br />
Development of a full well monitoring network will be a long-term process that is based on the<br />
scientific knowledge gained from the GMP and modeling effort that is currently underway. The<br />
network is currently limited to monitoring wells owned by TDPUD. This network includes a<br />
total of three wells that are presented in Table 3-1 along with pertinent well information. It is<br />
expected that ideal monitoring locations as related to the issues bulleted above will be<br />
scientifically resolved in the next few years. If existing wells, such as those shown in Figure 3-1,<br />
meet the monitoring well requirements described below and can be made available, they will be<br />
used. If existing wells cannot be used, the partners will seek funding and property rights to<br />
construct designated monitoring wells in these locations. It is anticipated that desired new<br />
monitoring sites will be prioritized based on value, availability of existing wells, feasibility of<br />
installing new wells, and cost. This prioritization will ensure optimal value relative to these<br />
constraints in establishing new monitoring locations until the full network is established.<br />
3.3 MONITORING WELL REQUIREMENTS<br />
The following are criteria for selecting monitoring wells in the MV groundwater basin. Wells<br />
selected for monitoring should have:<br />
A State Well Driller Log that describes the well construction details and a description of<br />
the sediments encountered<br />
A detailed description of the well’s location<br />
A brief description of the well’s use (i.e. irrigation, residential)<br />
A relatively short screen interval in only one aquifer<br />
A sanitary seal to prevent surface water from entering the well<br />
Wells cannot be municipal (public) production wells for water supply<br />
The most desirable wells to be included in the monitoring network are wells with short screen<br />
intervals completed within a specified aquifer. However, some wells with longer screen intervals<br />
may need to be initially included in the network when no others are available. Wells with long<br />
screen intervals may also be designated for monitoring because their long historic records<br />
provide valuable trending information. Data obtained from the longer screen wells usually<br />
represents an average of groundwater elevations across the unconfined and semi-confined<br />
aquifers.
Figure 3‐1 Reference Index 1 2 3<br />
State Well Number 17N16E01 17N16E01 17N16E13<br />
Reference Point Elevation (ft ‐<br />
NAVD88)<br />
Reference Point Description<br />
Ground Surface Elevation (ft ‐<br />
NAVD88)<br />
Method of Determining Elevation<br />
Accuracy of Elevation (ft)<br />
Well Use<br />
Well Status<br />
TABLE 3‐1. SELECTED INFORMATION FOR CURRENT MONITORING WELLS IN MARTIS VALLEY<br />
GROUNDWATER BASIN<br />
Geographic Coordinates (NAD83,<br />
CA Z2)<br />
Method of Determining Coordinates<br />
Accuracy of Coordinates (ft)<br />
Well Completion Type<br />
5,843 5,904 5,796<br />
5,839 5,900 5,792<br />
Latitude: 39.354541 39.344834 39.325769<br />
Longitude: ‐120.14377 ‐120.156033 ‐120.143471<br />
Casing Diameter (in.) 8 6 8<br />
Total Depth (ft) 1,197 1,220 1,040<br />
Screen Intervals (2 ea.) (ft)<br />
First Screen: 360 to 620 120 to 160 315 to 633<br />
Second Screen: 760 to 1,160 200 to 240 707 to 978<br />
Well Completion Report Number 733242 E008043 733241<br />
Year Drilled 2000 2003 2000<br />
Common Name Prosser Village Fibreboard <strong>Martis</strong> <strong>Valley</strong><br />
Well Location Description<br />
12546 Fairway Drive<br />
75 Yards Southwest of Building<br />
Top of Casing (All Three)<br />
Digital Terrain Model (All Three)<br />
+/‐ 3 (All Three)<br />
Monitoring (All Three)<br />
Active (All Three)<br />
GPS (All Three)<br />
+/‐ 3 (All Three)<br />
Single (All Three)<br />
12650 Caleb Circle<br />
On Path to Pond<br />
12201 Joerger Road<br />
50 Yards East of Building
TABLE 3‐1 CONTINUED. SELECTED INFORMATION FOR DWR CASGEM MONITORING WELLS IN MARTIS VALLEY<br />
GROUNDWATER BASIN<br />
Figure 3‐1 Reference Index 17N17E19K001M 18N17E33L001M<br />
State Well Number 17N17E19K001M 18N17E33L001M<br />
Reference Point Elevation (ft‐<br />
NAVD88)<br />
5862.8 5922.5<br />
Reference Point Description Top of PVC Casing Top of PVC Casing<br />
Ground Surface Elevation (ft‐<br />
NAVD88)<br />
Method of Determining Elevation<br />
Accuracy of Elevation (ft)<br />
5860 5920<br />
Well Use Observation Observation<br />
Well Status Active Active<br />
Geographic Coordinates (NAD83)<br />
Method of Determining Elevation<br />
Accuracy of Elevation (ft)<br />
Latitude: 39.3072 39.3653<br />
Longitude -120.1315 -120.099<br />
Well Completion Type Single Well Single Well<br />
Casing Diameter (in.) 2 2<br />
Total Depth (ft) 201 200<br />
Screen Intervals (ft) 187‐197 180‐190<br />
Well Completion Report Number N/A 365669<br />
Year Drilled 1990 1990<br />
Well Location Description<br />
50 ft. South of <strong>Martis</strong> Creek Rd. 1000 ft.<br />
east of the intersection of <strong>Martis</strong> Creek<br />
Rd. and Hwy 267.<br />
Surveying<br />
Within 0.1 ft.<br />
Unkown<br />
Unkown<br />
Truckee Fire Protection District P.O. Box<br />
686 Truckee, CA
3.4 REQUIRED STEPS IN SELECTING A NEW MV MONITORING WELL<br />
3-5<br />
Monitoring Network<br />
Upon selection of any new well, that is not currently a MV monitoring well, to be potentially<br />
included in the monitoring network, a site visit will be necessary to assess the field conditions.<br />
The conditions necessary for a well to be used in the network include:<br />
A well owner (and tenant) who will allow access for monitoring.<br />
All-weather access, key to locked gates or fences, and no guard dogs.<br />
Ability to survey the ground elevation and reference point elevation of the well. See<br />
Page 9 of the DWR <strong>Groundwater</strong> Elevation Monitoring Guidelines for details<br />
establishing the reference point.<br />
A clear access point through the pump or well casing for water-level sounders. Figure 3-<br />
2 shows a typical well sounding location detail.<br />
An assessment to determine if lubrication oil from a turbine pump has accumulated in the<br />
well or if there are obstructions in the well that would prevent obtaining repeat and<br />
reliable measurements.<br />
If currently in use, to have access in shutting a well down for a minimum 2-hour period<br />
(24-hous preferred) for reaching quasi-equilibrium.<br />
For wells that are owned by others, private or public, the protocols discussed below shall<br />
be followed for explaining the project purpose and establishing rights for access.<br />
If a new monitoring well is to be installed, appropriate hydrogeologic investigation shall<br />
be made, a design that considers the specific needs of monitoring shall be prepared, and<br />
the well shall be drilled under the observation and direction of a hydrogeologist.
FIGURE 3-2. ACCESS POINT ON A WELL<br />
3-6<br />
Monitoring Network<br />
Monitoring<br />
Access Point<br />
Before knocking on the door of potential well owners, every effort should be made to justify the<br />
need for the owner’s well in the network. Staff shall coordinate with Right-of-Way personnel to<br />
arrange a field visit if the owner allows it. The reason for monitoring and the benefits to longterm<br />
sustainability shall be described. Additionally, practical details about site access and how<br />
measurements are made shall be discussed. If the owner is interested in allowing their well into<br />
the network, the well shall be inspected for adequacy based on the bulleted criteria above. If the<br />
well is adequate, formal rights of entry shall be prepared by Right-of-Way personnel before<br />
proceeding. Any special contact information to perform the monitoring should also be noted<br />
along with information related to sites where a tenant is renting from the property owner. These<br />
steps will ensure consistent monitoring even though monitoring staff, tenants and well site access<br />
may change over time.
4.0 MONITORING EQUIPMENT AND PREPARATION<br />
4-1<br />
Monitoring Equipment and Preparation<br />
This section provides the MV monitoring entities with a “how to” manual for accessing<br />
monitoring wells and, taking depth-to-groundwater measurements and water quality samples.<br />
The range of equipment and protocols covered in this section will assist monitoring staff with the<br />
challenges that exist in the field. Each time a well is accessed as part of a monitoring event, staff<br />
needs to conduct themselves in a professional manner by being prepared with the right<br />
equipment and looking prepared with the correctly labeled vehicle and clothing, and pertinent<br />
staff identification. Staff should also strive to maintain a good relationship with the well owners<br />
and demonstrate genuine courtesy.<br />
This section also provides relevant portions of the CASGEM <strong>Groundwater</strong> Elevation Monitoring<br />
Guidelines (Guidelines) handbook attached as Appendix A. The CASGEM handbook is<br />
intended for the following purpose:<br />
…Guidelines were developed to assist DWR by establishing<br />
criteria for the selection and measurement of monitoring wells in<br />
the event that DWR is required to perform the groundwater<br />
monitoring functions in lieu of a local monitoring agency pursuant<br />
to <strong>Water</strong> Code Section 10933.5(a).<br />
The Guidelines also imply that a local agency that wishes to take over an existing monitoring<br />
well or create a new monitoring well should follow a documented consistent approach for each<br />
well over the life of the well. Given the unique location, construction technique, and down-hole<br />
equipment installation, measurement of each well should endeavor to follow the Guidelines<br />
knowing that field conditions may require slight deviations. This endeavor leads to the need of<br />
having a specialized documented procedure for each monitoring well that ensures a consistent<br />
measurement technique over time (some wells dating back to the 1930s). Changes in the well<br />
setting, use, and equipment may change over time, requiring changes in monitoring techniques.<br />
Wells constructed for and devoted to monitoring the groundwater can also change depending on<br />
activities around the well that may artificially change the static condition of groundwater levels<br />
(e.g., construction and use of a nearby high-production municipal well) or the elevation of the<br />
well head (e.g., well is located in proposed paved area where the well head will be cut below<br />
grade with a sealed and locked access chamber flush to pavement).<br />
4.1 PERSONNEL TRAINING<br />
All well monitoring programs are subject to turnover in agency staff. The best and most<br />
effective way of transitioning and training new staff is to have new staff work alongside the<br />
experienced staff during a transition period. Absent this on-the-job-training, thorough record<br />
keeping, periodic updating of the monitoring plan, and review of this document will expose new<br />
staff to the wells and the protocols followed from previous measurements.
4.2 WELL MONITORING LOG BOOK (WMLB)<br />
The WMLB is the definitive field document that contains the following:<br />
Well owner and contact information<br />
4-2<br />
Monitoring Equipment and Preparation<br />
Special entrance instructions (e.g., call at gate, honk horn, or dog off leash)<br />
A schematic identifying the location of the well (high-resolution aerial imagery can also<br />
be used if the monitoring well can be clearly identified)<br />
Pictures of the well including reference point and access port (See Figure 4-1)<br />
Checklist of special instructions based on well owner requirements or special conditions<br />
(i.e. – closed gates, protected wetlands, electrical power shut off, etc.)<br />
Equipment needed for measurement (i.e., some wells require walking a fair distance into<br />
the field, wrench to remove access plug)<br />
Ground and reference point elevations and source of measurement<br />
List of historical measurements and codes identifying questionable measurements or field<br />
conditions making measurements impossible<br />
Multiple wells can be in the same WMLB for convenience out in the field. This will likely be<br />
the case if multiple agencies will be making measurements within their respective jurisdiction.<br />
An example of the minimum data form and information kept for each well is taken from the<br />
CASGEM Guidelines, as shown on Figure 4-1.<br />
4.2.1 Required Equipment<br />
The monitoring agency will need to compile a set of tools and have them stored in a designated<br />
location at the monitoring agency’s premises. The equipment should be in a locked toolbox that<br />
can easily be carried by one person, if needed. The CASGEM Guidelines include a list of field<br />
equipment needed for the initial well measurements, as shown on Figure 4-2. Once all wells<br />
have established reference points and measurement conditions, a shorter list of supplies can be<br />
assembled for field measurements as follows:<br />
Digital camera<br />
Crescent wrench (large and small)<br />
Channel lock pliers (large and small)<br />
Small hammer and rubber mallet
4-3<br />
Monitoring Equipment and Preparation<br />
Source: Table 3. General Well Data Form, CASGEM Guidelines, DWR, December 2010<br />
FIGURE 4-1. GENERAL WELL DATA FORM (DWR FORM 429)
FIGURE 4-2. CASGEM FIELD EQUIPMENT LIST<br />
4-4<br />
Monitoring Equipment and Preparation<br />
Source: Table 4- Equipment and Supply List, CASGEM Guidelines, DWR, December 2010
Keys for gates and monitoring well covers<br />
Stop watch<br />
Wasp or hornet nest spray<br />
Twelve-foot tape measure<br />
Pencil and graph paper<br />
First aid kit<br />
4-5<br />
Monitoring Equipment and Preparation<br />
Minimum Tools needed for actual in the field depth-to-groundwater measurements include:<br />
200-foot well sounding steel tape measure<br />
Blue chalk for metal tape<br />
200-foot electronic well sounding probe (See Figure 4-3)<br />
Soap, high-purity water, and spray bottle for cleaning tape and probe<br />
Sterilizer solution for tape and probe to prevent introducing contaminants to a the well<br />
FIGURE 4-3. WELL SOUNDING PROBE AND TAPE
4.3 CHALLENGES TO BE PREPARED FOR<br />
4-6<br />
Monitoring Equipment and Preparation<br />
The steps necessary to complete a measurement of depth to groundwater are different for each<br />
monitoring well. See Pages 14 through 28 of the DWR <strong>Groundwater</strong> Elevation Monitoring<br />
guidelines for details on measuring water levels. Monitoring staff will need to understand these<br />
steps before accessing the well’s property location. The WMLB will include a written and<br />
graphical stepwise illustration to fully inform monitoring staff. Consideration of how diversified<br />
the steps could be are illustrated in the following real-life examples:<br />
Well is located on hilly terrain with no defined access trail or markers – This type of<br />
well benefits from training new staff for at least two monitoring events. Absent the onthe-job<br />
experience the WMLB should be detailed enough in its descriptions and images<br />
to find the well. Steeper terrain may also require several trips to the vehicle for<br />
equipment to ensure free hands are available in case of a fall.<br />
Well has no access port or casing bolt – Many of the older wells and private domestic<br />
wells were not designed for dropping a tape measure or probe into the well. In these<br />
cases, the monitoring staff should clearly identify the access point by using orange utility<br />
marking spray paint while being careful to not get paint overspray into the well itself.<br />
Absent the paint identifier, the tape chalk can be used as well, but it may disappear over<br />
time due to rain and wind. Wells with only a small slit at the base of the concrete casing<br />
interface will require a tape measurement.<br />
Well can only be accessed when owner is home – This occurs in many cases where the<br />
well owner has to unlock a gate or simply wants to be home when the monitoring event<br />
occurs. In this case, an appointment is made by phone providing owner with a 1 hour or<br />
less window when monitoring staff will show up. In cases where this is needed to open a<br />
locked gate, the owner may allow access and then request that the gate be closed and<br />
locked when finished. Review the checklist in the WMLB before leaving the monitoring<br />
well.<br />
Well is running when monitoring staff arrive – If the well is a municipal production<br />
well or large agricultural well, it is best to work with the well owner to allow a 24-hour<br />
period of off-time before taking a measurement. If the well owner is not responsive to<br />
this request, ask to turn off the well upon arrival and monitor recovery. If the well is a<br />
private domestic well, ask if the water use can be turned off (typically a hydropneumatic<br />
tank will allow small quantities of water use without the well turning on) and monitor<br />
recovery as explained in next chapter.<br />
Well casing is set flush to the ground – This occurs when a well uses a submersible<br />
pump or no pump and no onsite hydropneumatic tank– in most cases this is a private well<br />
that may be abandoned or the tank is located away from well. In addition, wells with no<br />
visible casing can become covered with vegetation or debris and be difficult to find. In<br />
both cases, monitoring staff should stake the well and paint the wood stake orange.
4-7<br />
Monitoring Equipment and Preparation<br />
Reference point is missing or the wellhead has been replaced – This occurs if the<br />
reference point is not a permanent mark such as a cut or welded steel marker. This will<br />
also occur when a well is deepened or redrilled and the upper casing has been replaced.<br />
Monitoring staff will need to select a permanent mark (e.g., top of casing, monitoring<br />
hole) where the depth to groundwater can be measured. Monitoring staff should also<br />
measure the distance between the new reference point and the ground elevation at the<br />
base of the well. This measurement should be noted in the logbook. 2<br />
2 The elevation of the new reference point will be calculated by the assigned data entry personnel using the ground<br />
elevation from the original survey and the reference point distance measured by field staff. The data entry personnel<br />
will need to be careful if the groundwater elevation is an automated calculation (i.e., past measurements will need to<br />
keep the old reference point) in a spreadsheet or DMS.
Depth-to-groundwater Procedures and Frequency of Monitoring and Reporting<br />
5.0 DEPTH-TO-GROUNDWATER PROCEDURES AND<br />
FREQUENCY OF MONITORING AND REPORTING<br />
The following section describes the frequency for monitoring and reporting and describes the<br />
depth-to-groundwater measurement during each of the designated monitoring periods. Figure 5-<br />
1 provides a form for documenting these described field measurements. An alternate form can<br />
be used if desired as long as the salient information is included. See also Pages 5 through 7 of<br />
the DWR <strong>Groundwater</strong> Elevation Monitoring Guidelines for additional details.<br />
5.1 SEMIANNUAL GROUNDWATER-LEVEL MONITORING<br />
<strong>Groundwater</strong> levels from all designated monitoring wells listed in Table 3-1 will be measured in<br />
the spring and fall (semiannually). Spring is generally considered to be the first week in May.<br />
Fall is generally considered to be the first week of November. If possible, all groundwater-level<br />
measurements should be taken within a 2-week period and, if possible, coordinate groundwaterlevel<br />
monitoring with DWR and its semiannual measurements.<br />
5.2 DEPTH-TO-GROUNDWATER MONITORING PROCEDURES<br />
DWR’s <strong>Groundwater</strong> Elevation Monitoring Guidelines (see Appendix A) provide a complete set<br />
of procedures for measuring the depth to groundwater. The following procedures are included to<br />
supplement the CASGEM’s broader guidelines. Over time, as monitoring staff become familiar<br />
with the well sites, a customized list can be documented. Staff will find that steps and<br />
monitoring equipment identified in the Guidelines do not apply to the wells being measured in<br />
the MV region or additional steps are required. The one exception to the MV monitoring wells is<br />
those that are measured through a continuous data logger. It is expected that the agency owning<br />
these wells will be downloading data collected by these devices separately from the MV<br />
Monitoring Program. This section focuses on measuring the depth to groundwater at designated<br />
MV monitoring well sites using a sounding probe or metal tape. <strong>Water</strong>-level measurements will<br />
be collected semiannually to assess the groundwater flow direction and to detect trends that can<br />
lead to improved management of the groundwater resources.<br />
Each well has been assigned a unique Well Log identification (ID) number. The numbers and<br />
pertinent information for each well are listed in Table 3-1. Figure 6-1 (DWR Form 429, Page<br />
11) extracted from the DWR’s CASGEM Monitoring Guideline Handbook, along with the time<br />
and date of the measurement is recorded with groundwater-level measurements during the<br />
semiannual monitoring event.<br />
5-1
Depth-to-groundwater Procedures and Frequency of Monitoring and Reporting<br />
FIGURE 5-1. GROUNDWATER-LEVEL DATA FORM FOR MANUAL<br />
MEASUREMENTS<br />
5-2
Depth-to-groundwater Procedures and Frequency of Monitoring and Reporting<br />
The depth-to-static-groundwater level will be obtained at each well using an electric water-level<br />
sounder with a cable graduated in increments of 0.01 foot. Before measurement, monitoring<br />
staff will need to review the WMLB for the location of the reference point and measurement<br />
access port. A crescent wrench may be needed to access the well casing for measurement.<br />
Monitoring staff will need to also review past measurements in the WMLB to allow for careful<br />
lowering of the probe or tape. 3 To obtain a depth-to-water measurement, the electric sounder<br />
cable or tape will be lowered into the well to within 20 feet short of past measurements taken in<br />
the same season of the year, spring or fall.<br />
Monitoring staff will continue to slowly lower the probe through the access port until the<br />
sounder indicates submergence by either a beeping sound or a light, depending on the type of<br />
signal installed for that particular model. At this point, the sampling personnel will note the<br />
depth to water (to the nearest 0.01 foot) from the reference point. The depth will be confirmed<br />
by lifting the sounder above the water surface by about 2 to 3 feet and then remeasuring the<br />
depth to water. If the depth remains constant, the depth to water will be recorded on Figure 6-1<br />
(DWR Form 1213, Page 18). If measurements are showing change with each measurement, the<br />
monitoring staff will indicate the issue on the form and, with it, attach a graphic curve of the<br />
variable nature of the measurement, and its possible cause (e.g., bouncing, recovering water<br />
level).<br />
5.3 QUALITY CONTROL<br />
After completing their field work, the monitoring staff will enter the data into an electronic<br />
database management system. The monitoring staff will review the groundwater-level and water<br />
quality data for accuracy within 5 days of obtaining the measurements. Should a measurement<br />
appear suspicious, a groundwater level confirmation reading will be obtained.<br />
3<br />
Tape measurements will require chalking of the tape and repeated measurements as per the CASGEM Guidelines<br />
(Page 15).<br />
5-3
Recording of Monitoring Data, Data <strong>Management</strong> and the CASGEM Requirements<br />
6.0 RECORDING OF MONITORING DATA, DATA MANAGEMENT<br />
AND THE CASGEM REQUIREMENTS<br />
Once data is brought back from the field it will need to be digitized and loaded onto the<br />
CASGEM website. The partners will be collecting data from their respective wells and<br />
distributing it to the plan administrator, which is currently <strong>Placer</strong> <strong>County</strong> <strong>Water</strong> Agency. The<br />
Agency will function as the clearinghouse of all data that is relevant to the MV groundwater<br />
basin. In addition, the Agency will be the primary point of contact for the CASGEM Program<br />
and will upload all relevant data in a timely manner. The steps laid out currently for CASGEM<br />
participation are described as follows (see Appendix C, On-line Submittal System Manual):<br />
Phase 1 of the CASGEM System was released in December, 2010,<br />
and allows prospective Monitoring Entities to do the following:<br />
Create, edit, and submit notifications to<br />
become a Monitoring Entity<br />
Create and manage user accounts<br />
Create and manage agency information<br />
Submit GIS shapefiles of mapped monitoring<br />
areas<br />
Phase 2 of the CASGEM System, released in May, 2011, makes the<br />
following additional functions available to prospective Monitoring<br />
Entities:<br />
Submittal of groundwater monitoring plans<br />
Submittal of well construction and location<br />
information on monitoring wells proposed to<br />
be monitored<br />
Allow corrections to initial Monitoring<br />
Entity notifications or submittal of<br />
additional information requested by DWR<br />
Ability to view and query maps of<br />
groundwater basins, proposed monitoring<br />
areas, monitored wells, and other<br />
geographic information associated with the<br />
CASGEM Program Phase 3 of the CASGEM<br />
System, scheduled for release in late fall,<br />
2011, will allow designated Monitoring<br />
Entities to do the following:<br />
6-1
Recording of Monitoring Data, Data <strong>Management</strong> and the CASGEM Requirements<br />
Submit groundwater elevation measurement<br />
data<br />
View and update their CASGEM data, as<br />
needed<br />
With Phase 3 of the CASGEM System, public access to the<br />
Statewide CASGEM data will be available. Users will be able to<br />
download data and view spatial and temporal groundwater<br />
elevation trends in the GIS viewer application.<br />
(URL: http://www.water.ca.gov/groundwater/casgem/submittal_system.cfm, On-line Submittal System, DWR)<br />
The Agency has already completed Phase 1 of the CASGEM Program. The next step requires<br />
entry of data for each of the monitoring wells included as part of this Monitoring Program.<br />
Figure 6-1 is taken from the CASGEM On-line System manual. The manual states that “Data<br />
may be entered on a well‐by‐well basis on a system data entry screen, or users can do a batch<br />
upload of information from multiple wells (using a spreadsheet template available for download<br />
within the system).” The latter will likely be the best method for entering the data given that<br />
most of the well information is already captured in an Excel Workbook.<br />
Data entry for groundwater elevations is not fully described but will likely be similar to the well<br />
inventory where a spreadsheet template can be uploaded for all groundwater-elevation data. The<br />
conversion of groundwater-elevation data from a database (including GIS) platform is typically<br />
straight forward with a copy-and-paste step or a small routine that outputs the data in the desired<br />
format.<br />
The inventory of <strong>Martis</strong> <strong>Valley</strong> well data will be based on DWR’s CASGEM Monitoring <strong>Plan</strong><br />
Summary attached as Appendix B. The set of data fields used for each well will require a<br />
decision on its need based on Appendix B requirements.<br />
6-2
Recording of Monitoring Data, Data <strong>Management</strong> and the CASGEM Requirements<br />
FIGURE 6-1. CASGEM’S WELL INVENTORY INPUT FORM<br />
6-3
Appendix A<br />
CASGEM Guidelines
Department of <strong>Water</strong> Resources<br />
<strong>Groundwater</strong> Elevation Monitoring<br />
DWR <strong>Groundwater</strong> Elevation Monitoring Guidelines<br />
Guidelines<br />
December 2010
TABLE OF CONTENTS<br />
Introduction to the CASGEM Program .......................................................................................................... 1<br />
Purpose of Guidelines for DWR Monitoring ................................................................................................. 1<br />
Network Design Concepts ............................................................................................................................. 2<br />
Selection of Monitoring Wells for Monitoring <strong>Plan</strong>s ................................................................................ 2<br />
Frequency of <strong>Water</strong>‐Level Measurements ............................................................................................... 5<br />
Field Guidelines for CASGEM <strong>Water</strong>‐Level Measurements .......................................................................... 8<br />
Introduction .............................................................................................................................................. 8<br />
Establishing the Reference Point .............................................................................................................. 9<br />
Guidelines for Measuring <strong>Water</strong> Levels .................................................................................................. 14<br />
Glossary of Terms .................................................................................................................................... 29<br />
References .............................................................................................................................................. 33<br />
DWR <strong>Groundwater</strong> Elevation Monitoring Guidelines ii
INTRODUCTION TO THE CASGEM PROGRAM<br />
On November 4, 2009 the state legislature amended the <strong>Water</strong> Code with SB 6, which<br />
mandates a statewide, locally-managed groundwater elevation monitoring program to<br />
track seasonal and long-term trends in groundwater elevations in California’s<br />
groundwater basins. To achieve that goal the amendment requires collaboration<br />
between local Monitoring Entities and the Department of <strong>Water</strong> Resources (DWR) to<br />
collect groundwater elevation data. In accordance with the amendment, DWR<br />
developed the California Statewide <strong>Groundwater</strong> Elevation Monitoring (CASGEM)<br />
program.<br />
If no local entities volunteer to monitor groundwater elevations in a basin or part of a<br />
basin, DWR may be required to develop a monitoring program for that part. If DWR<br />
takes over monitoring of a basin, certain entities in the basin may not be eligible for<br />
water grants or loans administered by the state.<br />
DWR will report findings of the CASGEM program to the Governor and the Legislature<br />
by January 1, 2012 and thereafter in years ending in 5 or 0.<br />
PURPOSE OF GUIDELINES FOR DWR MONITORING<br />
The following Guidelines were developed to assist DWR by establishing criteria for the<br />
selection and measurement of monitoring wells in the event that DWR is required to<br />
perform the groundwater monitoring functions in lieu of a local monitoring agency<br />
pursuant to <strong>Water</strong> Code Section 10933.5(a).<br />
The primary objective of the CASGEM monitoring program is to define the seasonal and<br />
long-term trends in groundwater elevations in California’s groundwater basins. The<br />
scale for this evaluation should be the static, regional groundwater table or<br />
potentiometric surface. A secondary objective is to provide sufficient data to draw<br />
representative contour maps of the elevations. These maps could be used to estimate<br />
changes in groundwater storage and to evaluate potential areas of overdraft and<br />
subsidence.<br />
Although it is not an objective of the CASGEM program, it would be valuable to include<br />
monitoring wells near localized features that impact more dynamic groundwater<br />
elevations. These features would include wells near aquifer storage and recovery<br />
projects, near high volume pumping wells, and near rivers.<br />
DWR <strong>Groundwater</strong> Elevation Monitoring Guidelines 1
NETWORK DESIGN CONCEPTS<br />
SELECTION OF MONITORING WELLS FOR MONITORING PLANS<br />
The number of groundwater wells that need to be monitored in a basin to adequately<br />
represent static water levels (and corresponding elevations) depends on several factors,<br />
some of which include: the known hydrogeology of the basin, the slope of the<br />
groundwater table or potentiometric surface, the existence of high volume production<br />
wells and the frequency of their use, and the availability of easily-accessible monitoring<br />
wells. Dedicated groundwater monitoring wells with known construction information are<br />
preferred over production wells to determine static water levels, and monitoring wells<br />
near rivers or aquifer storage and recovery projects should be avoided due to the<br />
potential for rapidly fluctuating water levels and engineered groundwater systems. The<br />
selection of wells should be aquifer-specific and wells which are screened across more<br />
than one aquifer should not be candidates for selection.<br />
Heath (1976) suggested a density of groundwater monitoring wells ranging from 2 wells<br />
per 1,000 square miles (mi 2 ) for a large area in which only major features are to be<br />
mapped, to 100 wells per 1,000 mi 2 for a complex area to be mapped in considerable<br />
detail. The objective of the Heath (1976) design was to evaluate the status of<br />
groundwater storage and the areal extent of aquifers.<br />
Sophocleous (1983) proposed a redesign of a water-level monitoring program for the<br />
state of Kansas based on efficiency, economics, statistical analysis, comparison of<br />
water-level hydrographs, and consistency across the state. The Sophocleous study<br />
recommended a “square well network” with a density of 1 observation well per 16 mi 2 .<br />
The Texas <strong>Water</strong> Development Board proposed varying well network densities for<br />
counties according to the amount of groundwater pumpage. These densities range<br />
from 0.7 wells per 100 mi 2 for counties with 1,000-2,500 acre-feet per year (AF/yr) of<br />
pumpage to 4 wells per 100 mi 2 for counties with over 100,000 AF/yr of pumpage<br />
(Hopkins, 1994). These densities were converted to pumpage per 100 mi 2 area by<br />
dividing by the size of an average county in Texas of about 1,000 mi 2 (Table 2)<br />
Most designs of water-level monitoring programs rely on a probabilistic approach. Alley<br />
(1993) discussed four probabilistic designs: (1) simple random sampling throughout an<br />
aquifer; (2) stratified random sampling within different strata of an aquifer; (3) systematic<br />
grid sampling (e.g., at the midpoint of each section within an aquifer); and (4) random<br />
sampling within blocks (e.g., randomly selected wells within each section of an aquifer).<br />
The Sophocleous (1983) program used the third approach, systematic grid sampling.<br />
The guidelines on well density from the programs mentioned above are summarized in<br />
Table 2.<br />
Based on the few referenced studies with specific recommendations, the consensus<br />
appears to fall between 2 and 10 groundwater monitoring wells per 100 mi 2 . The<br />
DWR <strong>Groundwater</strong> Elevation Monitoring Guidelines 2
exceptions to this density range include the lower end of the Heath (1976) range and<br />
the low-use counties in Texas.<br />
There will always be a tradeoff between the improved spatial (and temporal)<br />
representation of water levels in an aquifer and the expense of monitoring. A higherresolution<br />
contour map would be warranted in an area with a greater reliance upon<br />
groundwater in order to anticipate potential problems, such as supply and groundwater<br />
contamination concerns, while a lower-resolution contour map might be sufficient in an<br />
area with few people or a low reliance upon groundwater. Ideally, areas with relatively<br />
steep groundwater gradients or areas of high recharge or discharge would have a<br />
greater density of monitoring wells.<br />
The illustrations in Figure 1 show a local groundwater elevation contour map developed<br />
with different numbers of wells. The examples cover the same area and use the same<br />
dataset, with wells randomly deleted by grid area from the full dataset to create a less<br />
dense network of wells. The resulting range of plotting density is 2 to 20 groundwater<br />
monitoring wells per 100 mi 2 . The contours in Figure 1 show how the accuracy and<br />
resolution of the contour map increases with the density of wells used for plotting. To<br />
avoid presenting misleading contour maps, only wells with the best possible elevation<br />
accuracies should be used. These accuracies are a combination of the accuracies in<br />
the water-level measurement and the reference point (RP) measurement. Unless the<br />
RP elevation has been surveyed, it will be the limiting factor on elevation accuracy.<br />
Density of monitoring wells<br />
Program and(or) Reference<br />
(wells per 100 mi 2 )<br />
Heath (1976) 0.2 – 10<br />
Sophocleous (1983) 6.3<br />
Hopkins (1994)<br />
(a) Basins with >10,000 AF/yr groundwater pumping per 100<br />
mi 2 4.0<br />
area<br />
(b) Basins with 1,000‐10,000 AF/yr groundwater pumping<br />
per 100 mi 2 2.0<br />
area<br />
(c) Basins with 250‐1,000 AF/yr groundwater pumping per<br />
100 mi 2 1.0<br />
area<br />
(d) Basins with 100‐‐250 AF/yr groundwater pumping per<br />
100 mi 2 0.7<br />
area<br />
Table 1. Recommended density of monitoring wells for groundwater-level monitoring<br />
programs.<br />
DWR <strong>Groundwater</strong> Elevation Monitoring Guidelines 3
Figure 11.<br />
Contour<br />
per 100 mi 2 maps – Coontours<br />
of a very high-density<br />
weell<br />
network ( (about 20 w<br />
) compa ared to a loow-density<br />
wwell<br />
networrk<br />
(about 2 wells per 100<br />
mi 2 wells<br />
).<br />
DWR <strong>Groundwater</strong> Ele evation Monittoring<br />
Guideliines<br />
4
FREQUENCY OF WATER‐LEVEL MEASUREMENTS<br />
To determine and define seasonal and long-term trends in groundwater levels a<br />
consistent measurement frequency must be established. At minimum, semi-annual<br />
monitoring of the designated wells in each basin or subbasin should be conducted to<br />
coincide with the high and low water-level times of year for each basin. However,<br />
quarterly- or monthly-monitoring of wells provides a better understanding of<br />
groundwater fluctuations. The DWR office responsible for monitoring a particular basin<br />
should use independent judgment to determine when the high and low water-level times<br />
occur in a groundwater basin, and to provide a justification for measurement rationale.<br />
The semi-annual frequency is a compromise between more frequent measurements<br />
(continuous, daily, monthly, or quarterly) and less frequent measurements (annual). A<br />
good discussion of water level measurement frequency and other issues related to the<br />
design of water-level monitoring programs can be found in the USGS Circular 1217<br />
(Taylor and Alley, 2001).<br />
An example of the effect of different measurement frequencies on the water-level<br />
hydrographs in a Northern California well is shown in Figure 2. The data shows that<br />
higher-frequency monitoring (e.g., daily or monthly) best captures the seasonal<br />
fluctuations in the groundwater levels, quarterly monitoring identifies some of the<br />
elevation change, but semi-annual measurements often miss the true seasonal highs<br />
and lows.<br />
Figure 2. <strong>Groundwater</strong> Hydrographs – <strong>Groundwater</strong> elevation changes in a monitoring<br />
well over time comparing various measurement frequencies.<br />
DWR <strong>Groundwater</strong> Elevation Monitoring Guidelines 5
The Subcommittee on Ground <strong>Water</strong> of the Advisory Committee on <strong>Water</strong> Information<br />
generally recommends more frequent measurements than are being required by the<br />
CASGEM program; quarterly to annually for aquifers with very few groundwater<br />
withdrawals, monthly to quarterly for aquifers with moderate groundwater withdrawals,<br />
and daily to monthly for aquifers with many groundwater withdrawals (Table 2). The<br />
general effect of environmental factors on the recommended measurement frequency is<br />
illustrated in Figure 3.<br />
Measurement<br />
Type<br />
Baseline<br />
Measurements<br />
Surveillance<br />
Measurements<br />
Data made<br />
available to<br />
NGWMN<br />
Aquifer Type<br />
All aquifer types<br />
All aquifer types:<br />
“low” hydraulic<br />
conductivity<br />
(5 in/yr)<br />
All aquifer types,<br />
throughout range of<br />
hydraulic conductivity<br />
Nearby Long‐Term Aquifer Withdrawals<br />
Very Few Moderate Many<br />
Withdrawals Withdrawals Withdrawals<br />
Once per<br />
month<br />
Once per day Once per hour<br />
Once per year<br />
Once per<br />
quarter<br />
As stored in<br />
local<br />
database, but<br />
at least<br />
annually<br />
Once per<br />
quarter<br />
Once per<br />
month<br />
As stored in<br />
local<br />
database, but<br />
at least<br />
annually<br />
Once per<br />
month<br />
Once per day<br />
As stored in<br />
local<br />
database, but<br />
at least<br />
annually<br />
Table 2. Information on recommended minimum water-level measurement frequency<br />
from the Subcommittee on Ground <strong>Water</strong> of the Advisory Committee on <strong>Water</strong><br />
Information (2009) (abbreviations: ft/d, feet per day; in/yr, inches per year; NGWMN,<br />
National Ground <strong>Water</strong> Monitoring Network). NOTE: These are not recommendations of<br />
the CASGEM program.<br />
DWR <strong>Groundwater</strong> Elevation Monitoring Guidelines 6
Figure 3. Common environmental factors that influence the choice of frequency of<br />
water-level measurements (from Taylor and Alley, 2001).<br />
DWR <strong>Groundwater</strong> Elevation Monitoring Guidelines 7
FIELD GUIDELINES<br />
FOR CASGEM WATER-LEVEL MEASUREMENTS<br />
INTRODUCTION<br />
This document presents guidelines for measuring groundwater levels in wells for the<br />
CASGEM program to ensure consistency between DWR offices. Following these<br />
guidelines will help ensure that groundwater level measurements are accurate and<br />
consistent in both unconfined and confined aquifers. Although a well network comprised<br />
entirely of dedicated monitoring wells (hereafter referred to as monitoring wells) is<br />
preferred, by necessity active production wells used for irrigation or domestic purposes<br />
and abandoned production wells that were used for domestic, irrigation, and public<br />
supply purposes will also need to be included. The portions of these guidelines that<br />
apply to only production wells will be shown in bold throughout. DWR does not<br />
currently plan to include public supply wells in the CASGEM well networks due to<br />
security concerns of the California Department of Public Health.<br />
The main reference used for these guidelines is the United States Geological Survey<br />
(USGS) National Field Manual (NFM) (U.S. Geological Survey, 2006). The final report<br />
of the Subcommittee on <strong>Groundwater</strong> (SOGW) of the Advisory Committee on <strong>Water</strong><br />
Information was also used as a main reference, although in general it relied on the<br />
USGS guidelines (Subcommittee on Ground <strong>Water</strong> of the Advisory Committee on <strong>Water</strong><br />
Information, 2009). The water-level measurement portion of the USGS guidelines were<br />
written for monitoring wells and not for production wells (Taylor and Alley, 2001; U.S.<br />
Geological Survey, 2006). Thus, although the USGS guidelines have been adopted with<br />
only minor modifications for the monitoring well guidelines of the CASGEM program,<br />
additional modifications have been incorporated in the guidelines for production wells.<br />
The most significant changes made to the USGS guidelines for production wells<br />
are: (1) reducing the required precision for consecutive depth to water<br />
measurements, (2) checking for obstructions in the well, and (3) not attaching<br />
weights to the steel tape so as not to hang up on obstructions.<br />
The guidelines presented in this document are for the use of steel tape, electric<br />
sounding tape, sonic water-level meters, or pressure transducers. Although the semiannual<br />
measurements required by the CASGEM program can be satisfied with the use<br />
of a steel or electric sounding tape or sonic meter, a pressure transducer with a data<br />
logger provides a much better picture of what is happening with water levels over time.<br />
The use of the air-line or flowing-well methods should not be needed in most basins.<br />
However, if they are, guidelines for these methods are available in sections A4-B-4<br />
(pages B17-B20) and A4-B-5 (pages B21-B24), respectively of the NFM (U.S.<br />
Geological Survey, 2006).<br />
DWR <strong>Groundwater</strong> Elevation Monitoring Guidelines 8
ESTABLISHING THE REFERENCE POINT<br />
<strong>Water</strong>-level measurements from a given well must be referenced to the same datum<br />
(the reference point, or RP) to ensure data comparability (see Figure 4). For monitoring<br />
wells, the RP should be marked on the top of the well casing. For production wells, the<br />
RP will most likely be the top of the access tube or hole to the well casing. The RP must<br />
be as permanent as possible and be clearly visible and easily located. It can be marked<br />
with a permanent marker, paint, imprinting a mark with a chisel or punch, or by cutting a<br />
slot in the top of the casing. In any case, the location of the RP should be clearly<br />
described on DWR Form 429 (see Table 3). A photograph of the RP, with clear labeling,<br />
should be included in the well folder. In some cases, it may be valuable to establish<br />
multiple RPs for a well, depending on the consistent accessibility of the primary RP. In<br />
this case, each RP should be clearly described on DWR Form 429 and labeled in the<br />
field. The RP should be established with the following coordinate system: horizontal<br />
location (decimal latitude and longitude referenced to the North American Datum of<br />
1983; NAD83) and vertical elevation (referenced to the North American Vertical Datum<br />
of 1988; NAVD88, in feet).<br />
The land-surface datum (LSD) is established by the person making the initial water-level<br />
measurement at the well. The LSD is chosen to represent the average elevation of the<br />
ground around the well. Because LSD around a well may change over time, the<br />
distance between the RP and LSD should be checked every 3 to 5 years. If appropriate,<br />
a concrete well pad or well vault may be chosen as the LSD, since they will be more<br />
permanent than the surrounding ground surface.<br />
The elevation of the RP can be determined in several ways: (1) surveying to a<br />
benchmark, (2) using a USGS 7.5’ quadrangle map, (3) using a digital elevation model<br />
(DEM), or (4) using a global positioning system (GPS). While surveying is the most<br />
accurate (± 0.1 ft), it is also the most expensive. Depending on the distance to the<br />
nearest benchmark, the cost can be prohibitive. The latitude and longitude of the well<br />
can be established accurately using a handheld GPS. From this information, the LSD<br />
can be located on a USGS quadrangle and the elevation estimated. However, the<br />
accuracy is only about ± one half of the contour interval. Thus, for a contour interval of 5<br />
feet, the accuracy of the elevation estimate would be about ± 2.5 feet. The contour<br />
interval of high quality DEMs is currently about 30 feet. Therefore, the accuracy of using<br />
DWR <strong>Groundwater</strong> Elevation Monitoring Guidelines 9
Reference Point<br />
(RP)<br />
Tape at<br />
<strong>Water</strong> Surface<br />
Well Casing<br />
16'<br />
15'<br />
14'<br />
1' 13'<br />
12'<br />
11'<br />
10'<br />
9'<br />
8'<br />
7'<br />
6'<br />
5'<br />
4'<br />
3'<br />
2'<br />
1'<br />
15.00' (Tape at RP)<br />
12.10' (RP to WS)<br />
2.9' (Tape at WS)<br />
1.07'<br />
11.03' (LSD to WS)<br />
Land Surface Datum (LSD)<br />
Calculation of Depth to <strong>Water</strong><br />
Tape at RP 15.00'<br />
- Tape at WS -2.90'<br />
= RP to WS 12.10'<br />
- LSD to RP -1.07'<br />
= LSD to WS 11.03'<br />
<strong>Water</strong> Surface (WS)<br />
Figure 4. <strong>Groundwater</strong>-level measurements using a graduated steel tape (modified from<br />
U.S.<br />
Geological Survey, 2006).<br />
DWR <strong>Groundwater</strong> Elevation Monitoring Guidelines 10
Table<br />
3. General well data form (DWR Form 429).<br />
DWR <strong>Groundwater</strong> Elevation Monitoring Guidelines 11
DEMs to determine the elevation of the LSD is about ± 15 feet. While a handheld GPS<br />
unit is not very accurate for determining elevation, more expensive units with the Wide<br />
Area Augmentation System can be more accurate. However, GPS readings are subject<br />
to environmental conditions, such as weather conditions, overhead vegetative cover,<br />
topography, interfering structures, and location. Thus, the most common method of<br />
determining the elevation will probably be the use of USGS quadrangles. The method<br />
used needs to be identified on DWR Form 429 (Table 3). The important matter is that all<br />
measurements at a well use the same RP, as the elevation of that point can be more<br />
accurately established at a later date. The equipment and supplies needed for<br />
establishing the RP are shown in Table 4.<br />
If possible, establish a clearly displayed reference mark (RM) in a location near the well;<br />
for example, a lag bolt set into a nearby telephone pole or set in concrete in the ground.<br />
The RM is an arbitrary datum established by permanent marks and is used to check the<br />
RP or to re-establish an RP should the original RP be destroyed or need to be changed.<br />
Clearly locate the RP and RM on a site sketch that goes into the well folder (see Table<br />
3). Include the distance and bearing between the RP and the RM and the height of the<br />
lag bolt above the ground surface. Photograph the site, including the RP and RM<br />
locations; draw an arrow to the RP and RM on the photograph(s) using an indelible<br />
marker, and place the photos in the well file.<br />
Table 4. Equipment and Supply List<br />
Equipment and supplies needed for (a) all measurements, (b) establishing permanent RP, (c) steel tape<br />
method, (d) electric sounding tape method, (e) sonic water-level meter, and (f) automated measurements<br />
with pressure transducer.<br />
(a) All measurements<br />
GPS instrument, digital camera, watch, calculator, and maps<br />
General well data form (DWR Form 429; see Table 3)<br />
Pens, ballpoint with non-erasable blue or black ink, for writing on field forms and equipment log books<br />
Well file with previous measurements<br />
Measuring tape, graduated in feet, tenths, and hundredths of feet<br />
Two wrenches with adjustable jaws and other tools for removing well cap<br />
Key(s) for opening locks and clean rags<br />
(b) Establishing a permanent reference point<br />
Steel tape, graduated in feet, tenths, and hundredths of feet<br />
Calibration and maintenance log book for steel tape<br />
Paint (bright color), permanent marker, chisel, punch, and(or) casing-notching tool<br />
DWR <strong>Groundwater</strong> Elevation Monitoring Guidelines 12
Table 4. Equipment and Supply List (continued)<br />
(c) Steel tape method<br />
DWR field form 1213 (see Table 5)<br />
Steel tape, graduated in feet, tenths, and hundredths of feet<br />
Calibration and maintenance log book for steel tape<br />
Weight (stainless steel, iron, or other noncontaminating material – do not use lead)<br />
Strong ring and wire, for attaching weight to end of tape. Wire should be strong enough to hold weight securely, but<br />
not as strong as the tape, so that if the weight becomes lodged in the well the tape can still be pulled free.<br />
Carpenters’ chalk (blue) or sidewalk chalk<br />
Disinfectant wipes, and deionized or tap water for cleaning tape.<br />
(d) Electric sounding tape method<br />
DWR field form 1213 (see Table 5)<br />
Steel tape, graduated in feet, tenths, and hundredths of feet<br />
An electric tape, double-wired and graduated in feet, tenths, and hundredths of feet, accurate to 0.01 ft. Electric<br />
sounding tapes commonly are mounted on a hand-cranked and powered supply reel that contains space for the<br />
batteries and some device (“indicator”) for signaling when the circuit is closed.<br />
Electric-tape calibration and maintenance log book; manufacturer’s instructions.<br />
Disinfectant wipes, and deionized or tap water for cleaning tape.<br />
Replacement batteries, charged.<br />
(e) Sonic water-level meter method<br />
DWR field form 1213 (see Table 5)<br />
Temperature probe with readout and cable<br />
Sonic water-level meter with factory cover plate<br />
Custom sized cover plates for larger well diameters<br />
Replacement batteries<br />
(f) Automated measurements with pressure transducer<br />
Transducer field form (see Figures 1 and 2 in Drost, 2005: http://pubs.usgs.gov/of/2005/1126/pdf/ofr20051126.pdf )<br />
Transducer, data logger, cables, suspension system, and power supply.<br />
Data readout device (i.e., laptop computer loaded with correct software) and data storage modules.<br />
Spare desiccant, and replacement batteries.<br />
Well cover or recorder shelter with key.<br />
Steel tape (with blue carpenters’ chalk or sidewalk chalk) or electric sounding tape, both graduated in hundredths of<br />
feet.<br />
Tools,<br />
including high-impedance (digital) multimeter, connectors, crimping tool, and contact-burnishing tool or artist’s<br />
eraser.<br />
DWR <strong>Groundwater</strong> Elevation Monitoring Guidelines 13
GUIDELINES FOR MEASURING WATER LEVELS<br />
Monitoring wells typically have a cap on the wellhead. After the cap is removed, the<br />
open top of the well is easily accessible for sampling water levels and water quality. If<br />
the well is to be sampled for water quality in addition to water level, the water-level<br />
measurement should be made before the well is purged. Before discussing the detailed<br />
measurement steps for different methods, some guidance is provided on the common<br />
issues of well caps, recovery time after pumping, and cascading water in a well.<br />
Well caps are commonly used in monitoring wells to prevent the introduction of foreign<br />
materials to the well casing. There are two general types of well caps, vented and<br />
unvented. Vented well caps allow air movement between the atmosphere and the well<br />
casing. Unvented well caps provide an airtight seal between the atmosphere and the<br />
well casing.<br />
In most cases it is preferred to use vented well caps because the movement of air<br />
between the atmosphere and the well casing is necessary for normal water level<br />
fluctuation in the well. If the cap is not vented the fluctuation of groundwater levels in<br />
the well will cause increased or decreased air pressure in the column of air trapped<br />
above the water in the casing. The trapped air can prevent free movement of the water<br />
in the casing and potentially impact the water level that is measured. Vented caps will<br />
allow both air and liquids into the casing so they should not be used for wells where<br />
flooding with surface water is anticipated or contamination is likely from surface sources<br />
near the well.<br />
Unvented well caps seal the top of the well casing and prevent both air and liquid from<br />
getting into the well. They are necessary in areas where it is anticipated that the well<br />
will be flooded from surface water sources or where contamination is likely if the casing<br />
is not sealed. Because the air above the water in the casing is trapped in the casing<br />
and cannot equalize with the atmospheric pressure, normal water level fluctuation may<br />
be impeded. When measuring a well with an unvented cap it is necessary to remove<br />
the cap and wait for the water level to stabilize. The wait time will vary with many<br />
different factors, but if several sequential water-level measurements yield the same<br />
value it can be assumed the water level has stabilized.<br />
Unlike monitoring wells, production wells have obstructions in the well unless it<br />
is an abandoned production well and the pump has been removed. In addition,<br />
the wellhead is not always easily accessible for monitoring water levels. Since<br />
pumping from the production wells will create a non-static water level, the waterlevel<br />
measurement should ideally not be made until the water level has returned<br />
to static level. However, this recovery time will vary from site to site. Some wells<br />
will recover from pumping level to static level within a few hours, while many<br />
wells will take much longer to recover. Some wells will recover from pumping<br />
level to static level within a few hours, while many wells will take much longer to<br />
recover. Thus, as a general recommendation, measurements should not be<br />
collected until 24 hours after pumping has ceased, however, site specific<br />
DWR <strong>Groundwater</strong> Elevation Monitoring Guidelines 14
conditions may require deviating from this. The time since pumping should be<br />
noted on the field form.<br />
<strong>Water</strong> may enter a well above the water level, drip or cascade down the inside of the<br />
well, and lead to false water level measurements. Sometimes cascading water can be<br />
heard dripping or flowing down the well and other times it is discovered when water<br />
levels are abnormally shallow and/or difficult to determine. Both steel tapes and electric<br />
sounding tapes can give false readings. A steel tape may be wet from the point where<br />
water is entering the well making it hard to see the water mark where the tape intersects<br />
the water level in the well. An electric sounding tape signal may start and then stop as it<br />
is lowered down the well. If this happens, you can lightly shake the tape. The signal<br />
often becomes intermittent when water is running down the tape, but remains constant<br />
in standing water. On most electric sounding tapes, the sensitivity can be turned down<br />
to minimize false readings. It should be noted when a water level measurement is<br />
taken from a well with cascading water.<br />
(1) Steel Tape Method<br />
The graduated steel-tape (wetted-tape) procedure is considered to be the most<br />
accurate method for measuring water levels in nonflowing wells. A graduated steel tape<br />
is commonly marked to 0.01 foot. When measuring deep water levels (>500 ft), thermal<br />
expansion and stretch of the steel tape starts to become significant (Garber and<br />
Koopman, 1968). The method is most accurate for water levels less than 200 feet below<br />
land surface. The equipment and supplies needed for this method are shown in Table 4.<br />
The following issues should be considered with this method:<br />
• It may be difficult or impossible to get reliable results if water is dripping into the<br />
well or condensing on the well casing.<br />
• If the well casing is angled, instead of vertical, the depth to water should be<br />
corrected, if possible. This correction should be recorded in the field folder.<br />
• Check that the tape is not hung up on obstructions.<br />
Before making a measurement:<br />
1. Maintain the tape in good working condition by periodically checking the tape for rust,<br />
breaks, kinks, and possible stretch. Record all calibration and maintenance data<br />
associated with the steel tape in a calibration and maintenance log book.<br />
2. If the steel tape is new, be sure that the black sheen on the tape has been dulled so<br />
that the tape will retain the chalk.<br />
3. Prepare the field forms (DWR Form 1213; see Table 5). Place any previous<br />
measured water-level data for the well into the field folder.<br />
DWR <strong>Groundwater</strong> Elevation Monitoring Guidelines 15
4. Check that the RP is clearly marked on the well and accurately described in the well<br />
file or field folder. If a new RP needs to be established, follow the procedures above.<br />
5. In the field, wipe off the lower 5 to 10 feet of the tape with a disinfectant wipe, rinse<br />
with de-ionized or tap water, and dry the tape.<br />
6. If possible, attach a weight to the tape that is constructed of stainless steel or other<br />
noncontaminating material to protect groundwater quality in the event that the weight is<br />
lost in the well. Do not attach a weight for production wells.<br />
Making a measurement:<br />
1. If the water level was measured previously at the well, use the previous<br />
measurement(s) to estimate the length of tape that should be lowered into the well.<br />
Preferably, use measurements that were obtained during the same season of the year.<br />
2. Chalk the lower few feet of the tape by pulling the tape across a piece of blue<br />
carpenter’s chalk or sidewalk chalk (the wetted chalk mark identifies that part of the tape<br />
that was submerged).<br />
3. Slowly lower the weight (for monitoring wells only) and tape into the well to avoid<br />
splashing when the bottom end of the tape reaches the water. Develop a feel for the<br />
weight of the tape as it is being lowered into the well. A change in this weight will<br />
indicate that either the tape is sticking to the side of the casing or has reached the water<br />
surface. Continue to lower the end of the tape into the well until the next graduation (a<br />
whole foot mark) is at the RP and record this number on DWR Form 1213 (Table 5)<br />
next to “Tape at RP” as illustrated on Figure 4.<br />
4. Rapidly bring the tape to the surface before the wetted chalk mark dries and<br />
becomes difficult to read. Record the number to the nearest 0.01 foot in the column<br />
labeled as “Tape at WS.”<br />
5. If an oil layer is present, read the tape at the top of the oil mark to the nearest<br />
0.01 foot and use this value for the “Tape at WS” instead of the wetted chalk<br />
mark. Mark an “8” in the QM column of DWR Form 1213 (see Table 5) to indicate a<br />
questionable measurement due to oil in the well casing. There are methods to<br />
correct for oil, such as the use of a relatively inexpensive water-finding paste. The<br />
paste is applied to the lower end of the steel tape and the top of the oil shows as<br />
a wet line and the top of the water shows as a distinct color change. Since oil<br />
density is about three-quarters that of water, the water level can be estimated by<br />
adding three-quarters of the thickness of the oil layer to the oil-water interface<br />
elevation (U.S. Geological Survey, 2006).<br />
DWR <strong>Groundwater</strong> Elevation Monitoring Guidelines 16
6. Subtract the “Tape at WS” number from the “Tape at RP” number and record the<br />
difference (to the nearest 0.01 ft) as “RP to WS”. This reading is the depth to water<br />
below the RP.<br />
7. Wipe and dry off the tape and re-chalk based on the first measurement.<br />
8. Make a second measurement by repeating steps 3 through 5, recording the time of<br />
the second measurement on the line below the first measurement (Table 5). The<br />
second measurement should be made using a different “Tape at RP” than that used for<br />
the first measurement. If the second measurement does not agree with the original<br />
within 0.02 of a foot (0.2 of a foot for production wells), make a third measurement,<br />
recording this measurement and time on the row below the second measurement with a<br />
new time. If more than two readings are taken, record the average of all reasonable<br />
readings.<br />
After making a measurement:<br />
1. Clean the exposed portion of the tape using a disinfectant wipe, rinse with de-ionized<br />
or tap water, and dry the tape. Do not store a steel tape while dirty or wet.<br />
DWR <strong>Groundwater</strong> Elevation Monitoring Guidelines 17
Table 5. <strong>Groundwater</strong> level data form for manual measurements (DWR Form 1213).<br />
DWR <strong>Groundwater</strong> Elevation Monitoring Guidelines 18
(2) Electric Sounding Tape Method<br />
The electric sounding tape procedure for measuring depth to the water surface is<br />
especially useful in wells with dripping water or condensation, although there are still<br />
precautions needed as noted in the beginning of this section. Other benefits of this<br />
method include:<br />
• Easier and quicker than steel tapes, especially with consecutive measurements<br />
in deeper wells.<br />
• Better than steel tapes for making measurements in the rain.<br />
• Less chance for cross-contamination of well water than with steel tapes, as there<br />
is less tape submerged.<br />
The accuracy of electric sounding tape measurements depends on the type of tape<br />
used and whether or not the tape has been stretched out of calibration after use. Tapes<br />
that are marked the entire length with feet, tenths, and hundredths of a foot should be<br />
read to 0.01 ft. Electric sounding tapes are harder to keep calibrated than are steel<br />
tapes. As with steel tapes, electric sounding tapes are most accurate for water levels<br />
less than 200 ft below land surface, and thermal expansion and stretch start to become<br />
significant factors when measuring deep water levels (>500 ft) (see Garber and<br />
Koopman, 1968). Equipment and supplies needed for this method are shown in Table 4.<br />
The following issues should be considered with this method:<br />
• If the well casing is angled, instead of vertical, the depth to water will have to be<br />
corrected, if possible. This correction should be recorded in the field folder.<br />
• Check that the electric sounding tape is not hung up on an obstruction in<br />
the well.<br />
• The electric sounding tape should be calibrated annually against a steel tape in<br />
the field (using monitoring wells only) as follows: Compare water-level<br />
measurements made with the electric sounding tape to those made with a steel<br />
tape in several wells that span the range of depths to water encountered in the<br />
field. The measurements should agree to within ± 0.02 ft. If this accuracy is not<br />
met, a correction factor should be applied. All calibration and maintenance data<br />
should be recorded in a calibration and maintenance log book for the electric<br />
sounding tape.<br />
• Oil on the surface of the water may interfere with obtaining consistent<br />
readings and could damage the electrode probe. If oil is present, switch to<br />
a steel tape for the water-level measurement.<br />
• If using a repaired/spliced tape: see section A4-B-3(b) (page B16) of the NFM<br />
(U.S. Geological Survey, 2006).<br />
Before making a measurement:<br />
1. Inspect the electric sounding tape and electrode probe before using it in the field.<br />
Check the tape for wear, kinks, frayed electrical connections and possible stretch; the<br />
DWR <strong>Groundwater</strong> Elevation Monitoring Guidelines 19
cable jacket tends to be subject to wear and tear. Test that the battery and replacement<br />
batteries are fully charged.<br />
2. Check the distance from the electrode probe’s sensor to the nearest foot marker on<br />
the tape, to ensure that this distance puts the sensor at the zero foot point for the tape.<br />
If it does not, a correction must be applied to all depth-to-water measurements. Record<br />
this in an equipment log book and on the field form.<br />
3. Prepare the field forms (DWR Form 1213; see Table 5) and place any previous<br />
measured water-level data for the well into the field folder.<br />
4. After reaching the field site, check that the RP is clearly marked on the well and is<br />
accurately described in the well file or field folder. If a new RP needs to be established,<br />
follow the procedures above.<br />
5. Check the circuitry of the electric sounding tape before lowering the electrode probe<br />
into the well. To determine proper functioning of the tape mechanism, dip the electrode<br />
probe into tap water and observe whether the indicator needle, light, and/or beeper<br />
(collectively termed the “indicator” in this document) indicate a closed circuit. For an<br />
electric sounding tape with multiple indicators (sound and light, for instance), confirm<br />
that the indicators operate simultaneously. If they do not operate simultaneously,<br />
determine which is the most accurate and use that one.<br />
6. Wipe off the electrode probe and the lower 5 to 10 feet of the tape with a disinfectant<br />
wipe, rinse with de-ionized or tap water, and dry.<br />
Making a measurement:<br />
1. If the water level was measured previously at the well, use the previous<br />
measurement(s) to estimate the length of tape that should be lowered into the well.<br />
Preferably, use measurements that were obtained during the same season of the year.<br />
2. Lower the electrode probe slowly into the well until the indicator shows that the circuit<br />
is closed and contact with the water surface is made. Avoid letting the tape rub across<br />
the top of the well casing. Place the tip or nail of the index finger on the insulated wire at<br />
the RP and read the depth to water to the nearest 0.01 foot. Record this value in the<br />
column labeled “Tape at RP”, with the appropriate measurement method code and the<br />
date and time of the measurement (see Table 5).<br />
3. Lift the electrode probe slowly up a few feet and make a second measurement by<br />
repeating step 2 and record the second measurement with the time in the row below the<br />
first measurement in Table 5. Make all readings using the same deflection point on the<br />
indicator scale, light intensity, or sound so that water levels will be consistent between<br />
measurements. If the second measurement does not agree with the first measurement<br />
within 0.02 of a foot (0.2 of a foot for production wells), make a third measurement,<br />
DWR <strong>Groundwater</strong> Elevation Monitoring Guidelines 20
ecording this measurement with the time in the row below the second measurement. If<br />
more than two readings are taken, record the average of all reasonable readings.<br />
After making a measurement:<br />
1. Wipe down the electrode probe and the section of the tape that was submerged<br />
in the well water, using a disinfectant wipe and rinse thoroughly with de-ionized<br />
or tap water. Dry the tape and probe and rewind the tape onto the tape reel. Do<br />
not rewind or otherwise store a dirty or wet tape.<br />
(3) Sonic <strong>Water</strong>-Level Meter Method<br />
This meter uses sound waves to measure water levels. It requires an access port that is<br />
5/8 – inch or greater in diameter and measurement of the average air temperature in the<br />
well casing. The meter can be used to quickly measure water levels in both monitoring<br />
wells and production wells. Also, since this method does not involve contact of a probe<br />
with the water, there is no concern over cross contamination between wells. However,<br />
the method is not as accurate as the other methods, with a typical accuracy of 0.2 ft for<br />
water levels less than 100 ft or 0.2% for water levels greater than 100 ft. Equipment and<br />
supplies needed for this method are shown in Table 4.<br />
The following issues should be considered with this method:<br />
• The accuracy of the meter decreases with well diameter and should not be used<br />
with well diameters greater than 10 inches.<br />
• An accurate air temperature inside the well casing is necessary so that the<br />
variation of sound velocity with air temperature can be accounted for.<br />
• Obstructions in the well casing can cause erroneous readings, especially if<br />
the obstruction is close to half the well diameter or more.<br />
Before making a measurement:<br />
1. Check the condition of the meter, especially the batteries. Take extra batteries to the<br />
field.<br />
2. Take a temperature probe with a readout and 50-ft cable.<br />
3. If open wellheads with diameter greater than the factory cover plate and less than 10<br />
inches will be monitored, fabricate appropriately-sized cover plates using plastic or<br />
sheet metal.<br />
DWR <strong>Groundwater</strong> Elevation Monitoring Guidelines 21
4. Prepare the field forms (DWR Form 1213; see Table 5). Place any previous<br />
measured water-level data for the well into the field folder.<br />
5. Check that the RP is clearly marked on the well and accurately described in the well<br />
file or field folder. If a new RP needs to be established, follow the procedures above.<br />
Making a measurement:<br />
1. If the water level was measured previously at the well, lower the temperature probe to<br />
about half that distance in the well casing. Preferably, use measurements that were<br />
obtained during the same season of the year.<br />
2. Record this temperature in the comments column of DWR form 1213 (see Table 5).<br />
Use this temperature reading to adjust the temperature toggle switch on the sonic<br />
meter.<br />
3. Select the appropriate depth range on the sonic meter.<br />
4. For a covered wellhead, insert the meter duct into the access port and push the<br />
power-on switch. Record the depth from the readout.<br />
5. For an open wellhead, slip the provided cover plate onto the wellhead to provide a<br />
seal. If the cover plate is not large enough, use a fabricated cover plate for diameters up<br />
to 10 inches. Record the depth from the readout.<br />
After making a measurement:<br />
1. Make sure the temperature probe and the sonic meter are turned off and put away in<br />
their cases.<br />
(4) Pressure Transducer Method<br />
Automated water-level measurements can be made with a pressure transducer<br />
attached to a data logger. Care should be taken to choose a pressure transducer that<br />
accurately measures the expected range of groundwater levels in a well. Pressuretransducer<br />
accuracy decreases linearly with increases in the depth range (also known<br />
as pressure rating). A pressure transducer with a depth range of 0 to 10 ft (0 to 4.3 psi)<br />
has an accuracy of 0.01 ft while a pressure transducer with a depth range of 0 to 100 ft<br />
(0 to 43 psi) has an accuracy of 0.1 ft. But if the measurement range exceeds the depth<br />
range of a pressure transducer, it can be damaged. So it is important to have a good<br />
DWR <strong>Groundwater</strong> Elevation Monitoring Guidelines 22
idea of the expected range of groundwater levels in a well, and then refer to the<br />
manufacturer’s specification when selecting a pressure transducer for that well.<br />
Some of the advantages of automated monitoring include:<br />
• No correction is required for angled wells, as pressure transducers only measure<br />
vertical water levels.<br />
• A data logger can be left unattended for prolonged periods until data can be<br />
downloaded in the field.<br />
• Downloaded data can be imported directly into a spreadsheet or database.<br />
Some of the disadvantages of automated monitoring include:<br />
• It may be necessary to correct the data for instrument drift, hysteresis,<br />
temperature effects, and offsets. Most pressure transducers have temperature<br />
compensation built-in.<br />
• Pressure transducers operate only in a limited depth range. The unit must be<br />
installed in a well in which the water level will not fluctuate outside the operable<br />
depth range for the specific pressure transducer selected. Wells with widely<br />
fluctuating water levels may be monitored with reduced resolution or may require<br />
frequent resetting of the depth of the pressure transducer.<br />
• With some data loggers, previous water-level measurements may be lost if the<br />
power fails.<br />
There are two types of pressure transducers available for measuring groundwater<br />
levels; non-vented (absolute) and vented (gauged). A non-vented pressure transducer<br />
measures absolute pressure, is relative to zero pressure, and responds to atmospheric<br />
pressure plus pressure head in a well (see Figure 5). A vented pressure transducer<br />
measures gauge pressure, is relative to atmospheric pressure, and only responds to<br />
pressure head in a well.<br />
Non-vented pressure transducer data require post processing. Barometric pressure<br />
data must be collected at the same time as the absolute pressure data at the well, and<br />
subtracted from each absolute pressure data record before the data can be used to<br />
calculate groundwater levels. Thus, if a non-vented pressure transducer is used, a<br />
barometric pressure transducer will also be needed near the well. This subject is usually<br />
covered in more detail by the manufacturer of the pressure transducer. In an area with<br />
little topographic relief, a barometer at one site should be sufficient for use by other sites<br />
within a certain radius (9 miles reported by<br />
Schlumberger http://www.swstechnology.com/ groundwater-monitoring/groundwaterdataloggers/baro-diver<br />
and 100 miles reported by Global<br />
<strong>Water</strong> http://www.globalw.com/support/barocomp.html). In an area of significant<br />
topographic relief, it would be advisable to have a barometer at each site.<br />
DWR <strong>Groundwater</strong> Elevation Monitoring Guidelines 23
Vented pressure transducers can be programmed so no post processing of the data is<br />
necessary. The vent is usually a small tube in the communication cable that runs from<br />
the back of the pressure transducer to the top of the well. This vent enables the<br />
pressure transducer to cancel the effect of atmospheric pressure and record<br />
groundwater level as the distance from the RP to the WS (see Figure 5). However, if the<br />
vent is exposed to excessive moisture or submerged in water it can cause failure and<br />
damage to the pressure transducer.<br />
The existing well conditions should be considered when deciding which type of pressure<br />
transducer to use. Non-vented pressure transducers should be used when the top of a<br />
well or its enclosure may at any time be submerged in water. This can happen when<br />
artesian conditions have been observed or are likely, the well is completed at or below<br />
the LSD, or the well or its enclosure are susceptible to periods of high water.<br />
Otherwise, it is advisable to use a vented pressure transducer.<br />
The following guidelines are USGS guidelines from Drost (2005) and Freeman and<br />
others (2004) for the use of pressure transducers. These USGS guidelines have not<br />
been incorporated as yet in the NFM. The equipment and supplies needed for<br />
automated measurements of water level using a pressure transducer are shown in<br />
Table 4.<br />
DWR <strong>Groundwater</strong> Elevation Monitoring Guidelines 24
Top of Casing<br />
(RP)<br />
Hanging Point<br />
Barometer<br />
(P baro )<br />
Suspension Cable<br />
Pressure Transducer<br />
Well Casing<br />
Hanging Depth<br />
RP to WS<br />
Pressure Head<br />
LSD to WS<br />
(P meas)<br />
Land Surface Datum (LSD)<br />
<strong>Water</strong> Surface (WS) (Pw)<br />
Figure 5. <strong>Groundwater</strong>-level measurements using a pressure transducer (vented or non-vented)<br />
(modified from Drost, 2005).<br />
DWR <strong>Groundwater</strong> Elevation Monitoring Guidelines 25
Before making a measurement:<br />
1. Keep the pressure transducer packaged in its original shipping container until it is<br />
installed.<br />
2. Fill out the DWR field form (Table 6), including the type, serial number, and range of<br />
measurement device; and what units are being measured (ft, psi).<br />
3. Take a reading from the pressure transducer before placing into the well. For a<br />
vented pressure transducer the reading should be zero. For a non-vented pressure<br />
transducer the reading should be a positive number equivalent to atmospheric pressure.<br />
Configure the units (ft, psi) on a barometric pressure transducer the same as the nonvented<br />
pressure transducer. A reading from the barometric pressure transducer should<br />
be the same as the non-vented pressure transducer reading.<br />
4. Lower the pressure transducer into the well slowly. Conduct a field calibration of the<br />
pressure transducer by raising and lowering it over the anticipated range of water-level<br />
fluctuations. Take two readings at each of five intervals, once during the raising and<br />
once during the lowering of the pressure transducer. Record the data on the DWR field<br />
form (see Table 6). If using a non-vented pressure transducer, take a reading from the<br />
barometric pressure transducer at the same time as the other readings.<br />
5. Lower the pressure transducer to the desired depth below the water level (caution: do<br />
not exceed the depth range of the pressure transducer).<br />
6. Fasten the cable or suspension system to the well head using tie wraps or a<br />
weatherproof strain-relief system. If the vent tube is incorporated in the cable, make<br />
sure not to pinch the cable too tightly or the vent tube may be obstructed.<br />
7. Make a permanent mark on the cable at the hanging point, so future slippage, if any,<br />
can be determined.<br />
8. Measure the static water level in the well with a steel tape or electric sounding tape.<br />
Repeat if measurements are not consistent within 0.02 ft (0.2 ft for production wells).<br />
9. Record the well and RP configuration, with a sketch. Include the RP height above the<br />
LSD, the hanging point, and the hanging depth (see Figure 5).<br />
DWR <strong>Groundwater</strong> Elevation Monitoring Guidelines 26
Table 6. <strong>Groundwater</strong> level data form for vented or non-vented pressure transducer with data<br />
logger.<br />
DWR <strong>Groundwater</strong> Elevation Monitoring Guidelines 27
10. Connect the data logger, power supply, and ancillary equipment. Configure the data<br />
logger to ensure the channel, scan intervals, units, etc., selected are correct. Activate<br />
the data logger. Most data loggers will require a negative slope in order to invert water<br />
levels for ground-water applications (i.e., distance from the RP to the WS). If using a<br />
non-vented pressure transducer the data logger will not require a negative slope, but<br />
atmospheric pressure data will need to be collected by a barometric pressure<br />
transducer.<br />
Making a measurement:<br />
1. Retrieve water-level data (to 0.01 ft) using instrument or data logger software. If using<br />
a non-vented pressure transducer, retrieve barometric pressure data.<br />
2. Measure the water level with a steel tape or electric sounding tape (to 0.01 ft) and<br />
compare the reading with the value recorded by the pressure transducer and data<br />
logger. Record the reading and time in the file folder. If using a non-vented pressure<br />
transducer, subtract the barometric pressure value from the transducer pressure value<br />
to obtain the water level pressure value. The water level pressure can then be multiplied<br />
by 2.3067 to convert from psi of pressure to feet of water (Freeman and others, 2004).<br />
Report the calculated water level to the nearest 0.01 ft.<br />
3. If the tape and pressure transducer readings differ by more than (the greater of 0.2<br />
ft or) two times the accuracy of the specific pressure transducer, raise the pressure<br />
transducer out of the water and take a reading to determine if the cable has slipped, or<br />
whether the difference is due to drift. The accuracy of a pressure transducer is typically<br />
defined as 0.001 times the full scale of the pressure transducer (e.g., a 0 to 100 ft<br />
pressure transducer has a full scale of 100 ft). The accuracy of a specific pressure<br />
transducer should be specified by the manufacturer’s specifications.<br />
4. If drift is significant, recalibrate the pressure transducer as described using a steel<br />
tape. If using a non-vented pressure transducer, keep the pressure transducer out of<br />
the water and calibrate to the barometric pressure transducer value. If field calibration is<br />
not successful, retrieve the transducer and send back to the manufacturer for recalibration.<br />
5. Use the multimeter (see Table 4) to check the charge on the battery, and the<br />
charging current supply to the battery. Check connections to the data logger, and<br />
tighten as necessary. Burnish contacts if corrosion is occurring.<br />
6. Replace the desiccant, battery (if necessary), and data module. Verify the data logger<br />
channel and scan intervals, document any changes to the data logger program and<br />
activate the data logger.<br />
7. If possible, wait until data logger has logged a value, and then check for<br />
reasonableness of data.<br />
DWR <strong>Groundwater</strong> Elevation Monitoring Guidelines 28
GLOSSARY OF TERMS<br />
The following terms are used in this document. Although many are commonly used in<br />
the groundwater- and data-management fields, they are defined here to avoid<br />
confusion.<br />
Aquifer – A geologic formation from which useable quantities of groundwater can be<br />
extracted. A confined aquifer is bounded above and below by a confining bed of<br />
distinctly less permeable material. The water level in a well installed in a confined<br />
aquifer stands above the top of the confined aquifer and can be higher or lower than the<br />
water table that may be present in the material above it. In some cases, the water level<br />
can rise above the ground surface, yielding a flowing well. An unconfined aquifer is one<br />
with no confining beds between the saturated zone and the ground surface. The water<br />
level in a well installed in an unconfined aquifer stands at the same level as the<br />
groundwater outside of the well and represents the water table. An alternative and<br />
equivalent definition for an unconfined aquifer is an aquifer in which the groundwater<br />
surface is at atmospheric pressure.<br />
Atmospheric or barometric pressure – The force per unit area exerted against a<br />
surface by the weight of the air above that surface at any given point in the Earth’s<br />
atmosphere. At sea level, the atmospheric pressure is 14.7 psi. As elevation increases,<br />
atmospheric pressure decreases as there are fewer air molecules above the ground<br />
surface. The atmospheric pressure is measured by a barometer. This pressure reading<br />
is called the barometric pressure. Weather conditions can increase or decrease<br />
barometric pressure.<br />
Blue carpenter’s chalk – A primarily calcium carbonate chalk with some silica. It is<br />
primarily used to make chalk-lines for long lasting bright marks. Some other<br />
formulations of chalk (e.g., sidewalk chalk) substitute different ingredients such as rice<br />
starch for silica.<br />
Data logger – A microprocessor-based data acquisition system designed specifically to<br />
acquire, process, and store data. Data usually are downloaded from onsite data loggers<br />
for entry into office data systems. The storage device within a data logger is called the<br />
data module. A desiccant, such as, silica gel, calcium sulfate, or calcium chloride, is<br />
used to absorb and keep moisture away from the data module.<br />
Dedicated monitoring well – A well designed for the sole purpose of long-term<br />
monitoring.<br />
DWR <strong>Groundwater</strong> Elevation Monitoring Guidelines 29
Domestic well – A water well used to supply water for the domestic needs of an<br />
individual residence or systems of four or fewer service connections.<br />
DWR Bulletin 118 – DWR publication on the status of California’s groundwater. Prior to<br />
this 2003 update, the latest Bulletin 118 was published in 1980. This publication defines<br />
the 515 basins to be monitored in the SB 6 monitoring program. The report reference is:<br />
California Department of <strong>Water</strong> Resources, 2003, California’s groundwater: Bulletin<br />
118, 246 p., available online<br />
at: http://www.water.ca.gov/pubs/groundwater/bulletin_118/california's_groundwater__b<br />
ulletin_118_-_update_2003_/bulletin118_entire.pdf<br />
Electric sounding tape – This term is used in this document to mean both the electric<br />
tape and the electrode probe attached to the end of the tape. This water-level<br />
measuring device is also known by many other names, including a sounder, an electric<br />
tape, an E tape, an electric sounder, an electric well sounder, a depth sounder, etc.<br />
Electrode probe – This is the electronic sensor in the electronic sounder attached to<br />
the end of the electric tape. It senses water based on the electrical conductivity and<br />
triggers an alert.<br />
GPS – This stands for global positioning system. These devices come in many sizes<br />
and costs. The handheld devices are capable of very accurate locations in the xy plane<br />
(latitude longitude). However, only very expensive and large GPS units are currently<br />
capable of accurate readings for the altitude (z direction).<br />
<strong>Groundwater</strong> – <strong>Water</strong> occurring beneath the ground surface in the zone of saturation.<br />
<strong>Groundwater</strong> basin – An alluvial aquifer or a stacked series of alluvial aquifers with<br />
reasonably well-defined boundaries in a lateral direction and having a definable bottom.<br />
<strong>Groundwater</strong> elevation – The elevation (generally referenced to mean sea level as the<br />
datum) to which water in a tightly cased well screened at a given location will rise.<br />
Other terms that may be used include groundwater level, hydraulic head, piezometric<br />
head, and potentiometric head.<br />
<strong>Groundwater</strong> surface – The highest elevation at which groundwater physically occurs<br />
in a given location in an aquifer (i.e., top of aquifer formation in a confined aquifer and<br />
the groundwater level or water table in an unconfined aquifer). Also referred to as a<br />
water surface in this document.<br />
DWR <strong>Groundwater</strong> Elevation Monitoring Guidelines 30
<strong>Groundwater</strong> subbasin – A subdivision of a groundwater basin created by dividing the<br />
basin using geologic and hydrologic conditions or institutional boundaries.<br />
Hysteresis – The maximum difference in output, at any measured value within the<br />
specified range, when the value is approached first with an increasing and then a<br />
decreasing measured property. Hysteresis is expressed in percent of the full-scale<br />
output.<br />
Instrument Drift – A change in instrument output over a period of time that is not a<br />
function of the measured property. Drift is normally specified as a change in zero (zero<br />
drift) over time and a change in sensitivity (sensitivity drift) over time.<br />
Irrigation well – A well used to irrigate farmland. The water from the well is not<br />
intended for domestic purposes.<br />
Metadata – “data about data”; it is the data describing context, content and structure of<br />
records and their management through time.<br />
NFM – This stands for National Field Manual. This is a living, online, document of the<br />
USGS. It is the protocol document for USGS methods of surface water, groundwater,<br />
and water quality field activities. The portion of the NFM that related to the field methods<br />
of collecting groundwater levels is in the following reference: U.S. Geological Survey,<br />
2006, Collection of water samples (ver. 2.0): U.S. Geological Survey Techniques of<br />
<strong>Water</strong>-Resources Investigations, book 9, chap. A4, September, accessed 12/30/09<br />
at: http://pubs.water.usgs.gov/twri9A4/<br />
Nonflowing well – A well in which the water level is below the land surface.<br />
Pressure head – The height of a column of groundwater above a point that is<br />
supported by pressure at that point.<br />
Pressure transducer – A type of measurement device that converts pressure-induced<br />
mechanical changes into an electrical signal.<br />
Production well – A well with a pump installed that is used to bring groundwater to the<br />
land surface. This is a general term that can be applied to a domestic well, irrigation<br />
well, or public-supply well.<br />
DWR <strong>Groundwater</strong> Elevation Monitoring Guidelines 31
Public-supply well – A well that pumps groundwater from a relatively extensive<br />
saturated area and is used as part of a public water system, supplying water for human<br />
consumption to at least 3,300 people.<br />
SOGW – This stands for Subcommittee on <strong>Groundwater</strong>. This is a subcommittee of the<br />
Advisory Committee on <strong>Water</strong> Information, which is developing a national framework for<br />
groundwater in the United States. The reference for the SOGW work is: Subcommittee<br />
on Ground <strong>Water</strong> of the Advisory Committee on <strong>Water</strong> Information, 2009, A national<br />
framework for ground-water monitoring in the United States: final version approved by<br />
the Advisory Committee on <strong>Water</strong> Information, June 2009, 78 p., accessed 1/11/10<br />
at: http://acwi.gov/sogw/pubs/tr/index.html<br />
Static water level – <strong>Groundwater</strong> level in a well during non-pumping conditions.<br />
Vent tube – A tube in the cable which connects to the pressure transducer, allowing<br />
atmospheric pressure to be in contact with one side of the strain gauge in the pressure<br />
sensor. It cancels out the barometric effects in the readings.<br />
Well casing – The metal or plastic pipe separating the well from the surrounding<br />
geologic material.<br />
Wellhead – The top of the well containing the casing hanger and the point at which the<br />
motor is attached for a vertical line shaft turbine pump or where the seal is secured for a<br />
submersible pump.<br />
Well purging – Pumping out standing groundwater from a monitoring well. This is done<br />
prior to water quality sampling of wells, but not before taking a water-level<br />
measurement.<br />
DWR <strong>Groundwater</strong> Elevation Monitoring Guidelines 32
REFERENCES<br />
Alley, W.M., ed., 1993, Regional ground-water quality: New York, Van Nostrand<br />
Reinhold, 634 p.<br />
Department of <strong>Water</strong> Resources, 2003, California’s groundwater: Bulletin 118, 246 p.,<br />
available online<br />
at: http://www.water.ca.gov/pubs/groundwater/bulletin_118/california's_groundwater__b<br />
ulletin_118_-_update_2003_/bulletin118_entire.pdf<br />
Drost, B.W., 2005, Quality-assurance plan for ground-water activities, U.S. Geological<br />
Survey, Washington <strong>Water</strong> Science Center: U.S. Geological Survey Open-File Report<br />
2005-1126, 27 p., available online<br />
at: http://pubs.usgs.gov/of/2005/1126/pdf/ofr20051126.pdf<br />
Freeman, L.A., Carpenter, M.C., Rosenberry, D.O., Rousseau, J.P., Unger, R., and<br />
McLean, J.S., 2004, Use of submersible pressure transducers in water-resources<br />
investigations: U.S. Geological Survey Techniques of <strong>Water</strong>-Resources Investigations,<br />
book 8, chapter A3, 52 p., available online at:<br />
http://pubs.usgs.gov/twri/twri8a3/pdf/twri8-a3.pdf<br />
Garber, M.S., and Koopman, F.C., 1968, Methods of measuring water levels in deep<br />
wells: U.S. Geological Survey Techniques of <strong>Water</strong>-Resources Investigations, book 8,<br />
chap. A1, 23 p., available online at: http://pubs.usgs.gov/twri/twri8a1/pdf/twri_8-<br />
A1_a.pdf<br />
Heath, R.C., 1976, Design of ground-water level observation-well programs: Ground<br />
<strong>Water</strong>, v. 14, no. 2, p. 71–77.<br />
Hopkins, J., 1994, Explanation of the Texas <strong>Water</strong> Development Board groundwater<br />
level monitoring program and water-level measuring manual: UM-52, 53 p., available<br />
online at: http://www.twdb.state.tx.us/publications/manuals/UM-52/Um-52.pdf<br />
Sophocleous, M., 1983, <strong>Groundwater</strong> observation network design for the Kansas<br />
groundwater management districts, U.S.A.: Journal of Hydrology, vol. 61, pp. 371-389.<br />
Subcommittee on Ground <strong>Water</strong> of the Advisory Committee on <strong>Water</strong> Information,<br />
2009, A national framework for ground-water monitoring in the United States: final<br />
version approved by the Advisory Committee on <strong>Water</strong> Information, June 2009, 78 p.,<br />
accessed 1/11/10 at: http://acwi.gov/sogw/pubs/tr/index.html<br />
DWR <strong>Groundwater</strong> Elevation Monitoring Guidelines 33
Taylor, C.J., and Alley, W.M., 2001, Ground-water-level monitoring and the importance<br />
of long-term water-level data: U.S. Geological Survey Circular 1217, 68 p., available<br />
online at: http://pubs.usgs.gov/circ/circ1217/pdf/circ1217_final.pdf<br />
U.S. Geological Survey, 2006, Collection of water samples (ver. 2.0): U.S. Geological<br />
Survey Techniques of <strong>Water</strong>-Resources Investigations, book 9, chap. A4, September,<br />
accessed 12/30/09 at: http://pubs.water.usgs.gov/twri9A4/<br />
DWR <strong>Groundwater</strong> Elevation Monitoring Guidelines 34
Appendix B<br />
CASGEM Monitoring <strong>Plan</strong> Summary
CASGEM Monitoring <strong>Plan</strong> Summary<br />
The goal of the CASGEM program is to regularly and systematically monitor<br />
groundwater elevations that demonstrate seasonal and long-term trends in California’s<br />
groundwater basins and to make this information readily and widely available to the<br />
public. The CASGEM program will rely and build on the many, established local longterm<br />
groundwater monitoring and management programs.<br />
In determining what information should be reported to DWR, the department will defer to<br />
existing monitoring programs if those programs result in information that demonstrates<br />
seasonal and long-term trends in groundwater elevations. Monitoring Entities may<br />
submit an existing groundwater monitoring plan that is part of a groundwater<br />
adjudication program, an AB3030 program, an IRWM program, or any other<br />
groundwater management program that satisfies the goals of CASGEM. If there are<br />
future changes in a monitoring plan that is already established with CASGEM, the<br />
Monitoring Entity should provide an update to DWR at that time.<br />
Monitoring <strong>Plan</strong> Overview<br />
Phase 2 of the CASGEM Online Submittal System will be available on May 18, 2011 for<br />
prospective Monitoring Entities to submit their groundwater elevation monitoring plans<br />
and detailed well information. Each CASGEM monitoring plan should describe the<br />
monitoring network and the monitoring plan rationale. The description of the well<br />
network should allow users of the CASGEM database to understand well coverage<br />
within the basin or subbasin. The monitoring plan rationale explains how the proposed<br />
monitoring is designed to capture the seasonal highs and lows and long-term<br />
groundwater elevation trends.<br />
The basic components of a CASGEM monitoring plan include the following:<br />
• discussion of the well network,<br />
• map(s) of the well network,<br />
• monitoring schedule,<br />
• description of field methods,<br />
• discussion of the role of cooperating agencies, if applicable, and<br />
• description of the monitoring plan rationale.<br />
The monitoring rationale, which explains how the plan will result in groundwater<br />
elevation data that demonstrates seasonal and long-term trends, may discuss any or all<br />
of the following information:<br />
• history of groundwater monitoring in the basin,<br />
• principal aquifer features of the basin (for example, multiple aquifers),<br />
1
• groundwater conditions in the basin (for example, types, locations and timing of<br />
recharge and discharge),<br />
• selection of wells for the CASGEM monitoring program (number, depths and<br />
distribution of the wells), and<br />
• selection of the monitoring schedule.<br />
If the well network contains any data gaps, the monitoring plan should also discuss the<br />
following:<br />
Maps<br />
• location and reason for gaps in the well monitoring network,<br />
• local issues and circumstances that limit or prevent groundwater monitoring, and<br />
• recommendations for future well locations (assuming funding for new wells or<br />
permission for access to existing wells becomes available).<br />
The monitoring plan can include maps that show well locations, the boundaries of the<br />
area to be monitored and, ideally, the Monitoring Entity’s jurisdictional boundary. The<br />
optimal density of monitoring locations will depend on the complexity of the basin. If<br />
multiple aquifers are present in a basin, maps depicting how each of the aquifers is<br />
monitored are useful. The location of gaps in the monitoring network and the location of<br />
potential future monitoring wells can also be identified on each map. A table that<br />
provides a list of wells could also be used to identify the wells in the network.<br />
Schedule<br />
The monitoring schedule should provide a clear description of the frequency and timing<br />
of monitoring. To demonstrate seasonal and long-term trends in groundwater<br />
elevations, basin-wide monitoring should be conducted at least twice a year to measure<br />
the seasonal high and seasonal low groundwater elevations for the basin. The<br />
seasonal high and low groundwater elevations typically occur in early spring and in<br />
summer or fall, respectively, but may vary from basin to basin. Monitoring data<br />
collected in more frequent intervals can also be submitted to CASGEM. The online<br />
system will be designed to accept a maximum frequency of daily measurements for<br />
each well. To ensure that each round of monitoring represents a snapshot in time for<br />
conditions in the basin or subbasin, it will be important to schedule each round of<br />
measurements for all the wells in the network within the narrowest possible window of<br />
time. To provide the details of the monitoring schedule, the plan should contain a table<br />
detailing the time and frequency of monitoring for each of the wells in the monitoring<br />
network.<br />
Field Methods<br />
Field methods are the standard procedures for the collection and documentation of<br />
groundwater elevation data. A description of field methods provides an indicator of the<br />
2
quality, consistency and reliability of monitoring data to the users of the CASGEM<br />
database. Many Monitoring Entities already have established field methods for their<br />
groundwater monitoring programs that meet the following basic requirements:<br />
• step-by-step instructions to establish the Reference Point,<br />
• methods for recording measurements,<br />
• methods to ensure the measurement of static (non-pumping) groundwater<br />
conditions,<br />
• step-by-step instructions to measure depth to water, and<br />
• forms for recording measurements.<br />
Each Monitoring Entity will develop and implement monitoring protocols appropriate for<br />
the local groundwater basin conditions. Monitoring Entities who do not have<br />
established monitoring protocols can request assistance from DWR Region Offices to<br />
help develop appropriate protocols.<br />
Well Information<br />
In addition to the monitoring plan, each Monitoring Entity will also input the following<br />
detailed well information into the CASGEM Online Submittal System:<br />
• Local well ID and/or State Well Number<br />
• Reference Point Elevation (feet, NAVD88)<br />
• Reference Point description<br />
• Ground Surface Elevation (feet NAVD88)<br />
• Method of determining elevation<br />
• Accuracy of elevation method<br />
• Well Use<br />
• Well Status (active or inactive)<br />
• Well coordinates (decimal lat/long, NAD83)<br />
• Method of determining coordinates<br />
• Accuracy of coordinate method<br />
• Well Completion type (single or multi-completion)<br />
• Total depth (feet)<br />
• Top and bottom of screened intervals (up to 10 intervals)<br />
• Well Completion Report number<br />
• <strong>Groundwater</strong> basin of well (or subbasin or portion)<br />
• Written description of well location<br />
• Any additional comments<br />
<strong>Groundwater</strong> Elevation Information (to be developed under Phase 3)<br />
Phase 3 development of the CASGEM Online Submittal System will be available in late<br />
fall 2011. Phase 3 will enable Monitoring Entities to submit their groundwater elevation<br />
data and will provide public access to view the CASGEM database.<br />
3
Monitoring Entities will submit the following groundwater elevation information for each<br />
well during each round of monitoring:<br />
• Well identification number<br />
• Measurement date<br />
• Reference point elevation of the well (feet) using NAVD88 vertical datum<br />
• Elevation of land surface datum at the well (feet) using NAVD88 vertical datum<br />
• Depth to water below reference point (feet) (unless no measurement was taken)<br />
• Method of measuring water depth<br />
• Measurement Quality Codes<br />
o If no measurement is taken, a specified “no measurement” code, must be<br />
recorded. Standard codes will be provided by the online system. If a<br />
measurement is taken, a “no measurement” code is not recorded.)<br />
o If the quality of a measurement is uncertain, a “questionable<br />
measurement” code can be recorded. Standard codes will be provided by<br />
the online system. If no measurement is taken, a “questionable<br />
measurement” code is not recorded.)<br />
• Measuring agency identification<br />
• Measurement time (PST/PDT with military time/24 hour format)<br />
• Comments about measurement, if applicable<br />
4
<strong>Martis</strong> <strong>Valley</strong> <strong>Groundwater</strong> <strong>Management</strong> <strong>Plan</strong><br />
Appendix E: <strong>Groundwater</strong> Quality Reports<br />
DRAFT for review purposes only. Use of contents on this sheet is subject to the limitations specified at the end of this document.<br />
P:\40000\140691 - PCWA <strong>Martis</strong> <strong>Valley</strong> GWP\GMP\Report\3rd Draft\<strong>Martis</strong> <strong>Valley</strong> GMP Draft 01-09-13.docx<br />
E
IN THIS ISSUE: WATER QUALITY REPORT<br />
MARTIS VALLEY WATER SYSTEM for 2011 (Reported in 2012)<br />
PCWA <strong>Water</strong> is Safe and Healthy<br />
<strong>Placer</strong> <strong>County</strong> <strong>Water</strong> Agency is<br />
proud to supply safe and<br />
healthy water. We are pleased<br />
to report that the drinking water supplied<br />
to you meets or exceeds state<br />
and federal public health standards<br />
for drinking water quality and safety.<br />
California water retailers, including<br />
PCWA, are required by law to<br />
inform customers about the quality<br />
of their drinking water. The results<br />
of PCWA’s testing and monitoring<br />
programs of 2011 are reported in<br />
this newsletter.<br />
If you have any questions about<br />
this report, please contact the PCWA<br />
Customer Services Center at (530)<br />
823-4850 or (800) 464-0030.<br />
About Your<br />
Drinking <strong>Water</strong><br />
Drinking water, including bottled<br />
water, may reasonably be<br />
expected to contain at least<br />
small amounts of some contaminants.<br />
The presence of contaminants does<br />
not necessarily indicate that water poses<br />
a health risk. More information about<br />
contaminants and potential health<br />
effects can be obtained by calling the<br />
U.S. Environmental Protection<br />
Agency's Safe Drinking <strong>Water</strong><br />
Hotline:<br />
1-800-426-4791<br />
UPDATE<br />
PLACER COUNTY WATER AGENCY VOL 26 NO 2 APRIL-MAY 2012<br />
<strong>Martis</strong> <strong>Valley</strong> Service Area<br />
<strong>Groundwater</strong> Supply<br />
The Source of Your <strong>Water</strong> Supply<br />
<strong>Water</strong> for the PCWA <strong>Martis</strong> <strong>Valley</strong> service area in eastern <strong>Placer</strong> <strong>County</strong> is<br />
pumped from the <strong>Martis</strong> <strong>Valley</strong> aquifer. <strong>Groundwater</strong> is drawn from two<br />
wells, approximately 900 feet in depth, located adjacent to Lahontan Drive<br />
and Schaffer Mill Road. <strong>Water</strong> is distributed to customers via pipeline.<br />
Ensuring The Safety of<br />
Your Drinking <strong>Water</strong> Supply<br />
In order to ensure that tap water is safe to drink, the U.S. Environmental<br />
Protection Agency (USEPA) and the state Department of Public Health prescribe<br />
regulations which limit the amount of certain contaminants in water<br />
provided by public water systems. State regulations also establish limits for<br />
contaminants in bottled water that must provide the same protection for public<br />
health.
PAGE 2 • PCWA UPDATE<br />
<strong>Placer</strong> <strong>County</strong> <strong>Water</strong> Agency<br />
Consumer Confidence Report for 2011 (Reported in 2012)<br />
MARTIS VALLEY <strong>Water</strong> System<br />
Primary Drinking <strong>Water</strong> Standards<br />
Constituent No. of 90th Percentile No. of Sites AL PHG Typical Source<br />
Samples Level Detected exceeding AL of Contaminant<br />
Collected<br />
Copper (mg/L) 5 0.14 0 1.3 0.3 Internal corrosion of household<br />
water plumbing systems; erosion<br />
of natural deposits; leaching from<br />
wood preservatives<br />
Constituent Units State MCL PHG (MCLG) Range and Typical Source<br />
or {MRDL} or {MRDLG} Average of Contaminant<br />
or (HRAA)<br />
Chlorine mg/L {4} {4} 0.4-1.17 Drinking water disinfectant<br />
(0.89) added for treatment<br />
Arsenic ug/L 10 0.004 0-2 Erosion of natural deposits; runoff<br />
1 from orchards, glass and electronics<br />
production wastes<br />
Secondary Drinking <strong>Water</strong> Standards<br />
Total Dissolved Solids mg/L 1000 None 120-130 Runoff, leaching<br />
125 from natural deposits<br />
Specific Conductance uS/cm 1600 None 180-190 Substances that form<br />
185 Ions when in water<br />
Chloride mg/L 500 None 1.3-1.8 Runoff, leaching<br />
1.55 from natural deposits<br />
Sulfate mg/L 500 None 0.93-1.3 Runoff, leaching<br />
1.12 from natural deposits<br />
STATEMENT ON LEAD (None found in this system), If present, elevated levels of lead can cause serious health problems, especially for pregnant<br />
women and young children. Lead in drinking water is primarily from materials and components associated with service lines and home plumbing. PCWA<br />
is responsible for providing high quality drinking water, but cannot control the variety of materials used in plumbing components. When your water has<br />
been sitting for several hours, you can minimize the potential for lead exposure by flushing your tap for 30 seconds to 2 minutes before using water for<br />
drinking or cooking. If you are concerned about lead in your water, you may wish to have your water tested. Information on lead in drinking water, testing<br />
methods, and steps you can take to minimize exposure is available from the Safe Drinking <strong>Water</strong> Hotline or at http://www.epa.gov/safewater/lead.<br />
DEFINITIONS: Understanding Your <strong>Water</strong> Quality Report<br />
MCL: Maximum Contaminant Level. The highest level of a contaminant<br />
that is allowed in drinking water. Primary MCL’s are set as close to the<br />
PHG’s (or MCLG’s) as is economically and technologically feasible.<br />
Secondary MCL's are set to protect the odor, taste and appearance of<br />
drinking water.<br />
MCLG: Maximum Contaminant Level Goal. The level of a contaminant<br />
in drinking water below which there is no known or expected risk to health.<br />
Set by the U.S. Environmental Protection Agency.<br />
MRDL: Maximum Residual Disinfectant Level. The highest level of a<br />
disinfectant allowed in drinking water. There is convincing evidence that<br />
addition of a disinfectant is necessary for control of microbial contaminants.<br />
MRDLG: Maximum Residual Disinfectant Level Goal. The level of a<br />
drinking water disinfectant below which there is no known or expected risk<br />
to health. MRDLG’s do not reflect the benefits of the use of disinfectants to<br />
control microbial contaminants.<br />
Primary Drinking <strong>Water</strong> Standard. MCL's and MRDL’s for contaminants<br />
that affect health along with their monitoring and reporting requirements,<br />
and water treatment requirements.<br />
PHG: Public Health Goal. The level of a contaminant in drinking water<br />
below which there is no known or expected risk to health. PHG's are set<br />
by the California Environmental Protection Agency.<br />
AL: Action Level. The concentration of a contaminant, which if exceeded,<br />
triggers treatment or other requirements which a water system must follow.<br />
NTU: Nephelometric Turbidity Units. A measure of the clarity of water.<br />
Turbidity is monitored because it is a good indicator of water quality. High<br />
turbidity can hinder the effectiveness of disinfectants.<br />
TT: Treatment Technique. A required process intended to reduce the<br />
level of a contaminant in drinking water.<br />
pCi/L: picocuries per liter. A measure of radiation.<br />
mg/L: milligrams per liter or parts per million (ppm)<br />
ug/L: micrograms per liter or parts per billion (ppb)<br />
uS/cm: MicroSiemens per centimeter.<br />
HRAA: Highest Running Annual Average<br />
Monitoring of Unregulated Substances<br />
Constituent Units State MCL PHG (MCLG) Range Typical Source<br />
(or MRDL) (or MRDLG) (Average) of Contaminant<br />
Sodium mg/L None None 7.9-8.7 Runoff, leaching from<br />
(8.3) natural deposits<br />
Hardness mg/L None None 75-80 Runoff, leaching from<br />
(77.5) natural deposits<br />
Radon 222 pCi/L None None 930-1600 Erosion of<br />
(1198) natural deposits<br />
Radon samples were last collected in 2001. There is no current requirement to monitor for Radon in drinking water. See below.<br />
FOR INFORMATION on water quality or questions about this report,<br />
customers are invited to contact the <strong>Placer</strong> <strong>County</strong> <strong>Water</strong> Agency Customer Services Center at<br />
(530) 823-4850 or (800) 464-0030.<br />
Environmental Influences on Drinking <strong>Water</strong><br />
The sources of drinking water (both tap and bottled<br />
water) include rivers, lakes, streams, ponds, reservoirs,<br />
springs and wells. As water travels over the<br />
surface of the land or through the ground, it dissolves<br />
naturally-occurring minerals and, in some<br />
cases, radioactive material, and can pick up substances resulting<br />
from the presence of animals or from human activity.<br />
Contaminants that may be present in source water include:<br />
• Microbial contaminants, such as viruses and bacteria, which<br />
may come from sewage treatment plants, septic systems, agricultural<br />
livestock operations, and wildlife.<br />
• Inorganic contaminants, such as salt and metals, which can<br />
Note to At-Risk <strong>Water</strong> Users<br />
Some people may be more vulnerable to contaminants in<br />
drinking water than the general population. Immunocompromised<br />
persons such as persons with cancer undergoing<br />
chemotherapy, persons who have undergone organ transplants,<br />
people with HIV/AIDS or other immune system disorders,<br />
some elderly, and infants can be particularly at risk from<br />
infections. These people should seek advice about drinking water<br />
from their health care providers. USEPA/Centers for Disease<br />
Control (CDC) guidelines on appropriate means to lessen the risk<br />
of infection by Cryptosporidium and other microbial contaminants<br />
are available from the Safe Drinking <strong>Water</strong> Hotline at (800)<br />
426-4791.<br />
2011 Testing Results<br />
Measurements reported here were collected in 2011 (unless<br />
otherwise noted). In accordance with federal regulations, data is<br />
from the most recent tests. We are allowed to monitor for some<br />
contaminants less than once per year because concentrations of<br />
these contaminants do not change frequently.<br />
Este informe contiene información muy<br />
importante sobre su agua potable.<br />
Tradúzcalo o hable con alguien que lo<br />
entienda bien.<br />
be naturally-occurring or result from urban storm water runoff,<br />
industrial or domestic wastewater discharges, oil and gas production,<br />
mining or farming.<br />
• Pesticides and herbicides, that may come from a variety of<br />
sources such as agriculture, urban storm water runoff and residential<br />
uses.<br />
• Organic chemical contaminants, including synthetic and<br />
volatile organic chemicals, which are by-products of industrial<br />
processes and petroleum production, and can also come from gas<br />
stations, urban storm water runoff, agricultural application and<br />
septic systems.<br />
• Radioactive contaminants, that can be naturally-occurring or<br />
be the result of oil and gas production and mining activities.<br />
<strong>Martis</strong> <strong>Valley</strong> System<br />
About Your <strong>Water</strong> Supply<br />
Note on Radon<br />
Radon is a radioactive gas that you can’t see, smell, or<br />
taste. It is found throughout the U.S. Radon can move<br />
up through the ground and into a home through cracks<br />
and holes in the foundation. Radon can build up to high<br />
levels in all types of homes. Radon can also get into<br />
indoor air when released from tap water from showering,<br />
washing dishes, and other household activites. Compared<br />
to radon entering a home through soil, radon entering<br />
through tap water will in most cases be a small source of<br />
radon in indoor air. Radon is a known human carcinogen.<br />
Breathing air containing radon can lead to lung cancer.<br />
Drinking water containing radon may also cause<br />
increased risk of stomach cancer. If you are concerned<br />
about radon in your home, test the air. Testing is inexpensive<br />
and easy. Fix your home if the level of radon is<br />
4 pCi/L or higher. There are simple ways to fix a radon<br />
problem that aren’t too costly.<br />
For additional information, call your State radon program<br />
(800-745-7236), the EPA Safe Drinking <strong>Water</strong> Act<br />
Hotline (800-426-4791) or the National Safe Council<br />
Radon Hotline (1-800-SOS-RADON).<br />
PAGE 3 • PCWA UPDATE
PLACER COUNTY WATER AGENCY<br />
144 Ferguson Road (P.O. Box 6570)<br />
Auburn, California 95604<br />
Annual <strong>Water</strong> Quality Report<br />
to PCWA Customers (For 2011)<br />
<strong>Martis</strong> <strong>Valley</strong><br />
Treated <strong>Water</strong> System<br />
Public Meetings<br />
The <strong>Placer</strong> <strong>County</strong> <strong>Water</strong> Agency Board of Directors meets<br />
regularly the first and third Thursdays of each month at 2 p.m.<br />
at the <strong>Placer</strong> <strong>County</strong> <strong>Water</strong> Agency Business Center, 144<br />
Ferguson Road, in Auburn.<br />
The public is welcome.<br />
Contacting Your Elected Directors<br />
DISTRICT 1: Gray Allen<br />
DISTRICT 2: Alex Ferreira<br />
DISTRICT 3: Lowell Jarvis<br />
DISTRICT 4 & 2012 Board Chair: Mike Lee<br />
DISTRICT 5 & 2012 Vice Chair: Ben Mavy<br />
If you would like to contact a member of the board, please call the PCWA<br />
Customer Service Center at (530) 823-4850 or (800) 464-0030. We will be<br />
pleased to put you in touch with the elected representative from your area.<br />
This newsletter is published as a public service of the<br />
PLACER COUNTY WATER AGENCY<br />
144 Ferguson Road (P.O. Box 6570)<br />
Auburn, California 95604<br />
(530) 823-4850 • (800) 464-0030<br />
General Manager: David A. Breninger<br />
Newsletter Editor: Dave Carter<br />
www.pcwa.net
Primary Business Address<br />
Your Address Line 2<br />
Your Address Line 3<br />
Your Address Line 4<br />
Truckee Donner Public Utility District<br />
2011 <strong>Water</strong> Quality Report<br />
Truckee Main <strong>Water</strong> System #2910003<br />
Truckee Donner Public Utility District (TDPUD) vigilantly safeguards its mountain groundwater supplies<br />
Last year, your tap water met all EPA and State drinking water health standards. This brochure is a snapshot of the quality of water provided<br />
to customers for the 2011 calendar year. Included in this pamphlet are details about where your water comes from, what it contains, and how<br />
it compares to State and USEPA Standards.<br />
TDPUD is committed to providing you with the information about your water supply because customers who are well informed are the District’s<br />
best allies in supporting improvements that are necessary to maintain the highest drinking water standards.<br />
For More Information<br />
About this report or the water treatment process, contact Truckee Donner Public Utility District’s Senior <strong>Water</strong> Quality Tech, Paul Rose at<br />
(530) 582-3926.<br />
About a group or class presentation, contact the Truckee Donner Public Utility District at (530) 587-3896.<br />
About water conservation and efficiency, the TDPUD has new water conservation programs that will help customers save water and<br />
save money. Information can be found on the TDPUD’s website at www.tdpud.org or by calling (530) 582-3931.<br />
Customer Views Are Welcome<br />
If you are interested in participating in the decision-making process of the Truckee Donner Public Utility District, you are welcome to attend<br />
Board meetings. The Board of Directors meet at 6:00 PM on the first and third Wednesday of each month in the TDPUD Board room located<br />
at 11570 Donner Pass Road, Truckee, California. Agendas for upcoming meetings may be obtained on our website at www.tdpud.org or<br />
from the Deputy District Clerk’s office, (530) 582-3909.<br />
Este informe contiene información muy importante sobre su agua<br />
potable. Tradúzcalo ó hable con alguien que lo entienda bien.<br />
Truckee Donner Public Utility District<br />
11570 Donner Pass Road<br />
Truckee, CA 96161<br />
Where Does Our <strong>Water</strong><br />
Come From?<br />
The drinking water served<br />
to Truckee Donner Public Utility<br />
District customers in the<br />
Truckee system is groundwater<br />
coming from 12 deep<br />
wells.<br />
Each week the system is<br />
sampled for microbial quality.<br />
Because of natural filtration,<br />
the groundwater aquifer is<br />
protected from surface contamination.<br />
This gives us<br />
high quality water.<br />
Source <strong>Water</strong><br />
Assessment<br />
A source water assessment<br />
was prepared in 2002<br />
for the wells serving the<br />
Truckee area. The wells are<br />
considered most vulnerable to<br />
the following activities not<br />
associated with any detected<br />
contaminants: sewer collection<br />
systems, utility stations,<br />
railroads, and herbicide use.<br />
A copy of the complete assessment<br />
may be viewed at<br />
the Truckee Donner Public<br />
Utility District office located at<br />
11570 Donner Pass Road,<br />
Truckee, CA or by calling<br />
Mark Thomas at (530) 582-<br />
3957.<br />
Some people may be<br />
more vulnerable to contaminants<br />
in drinking water than<br />
the general population. Immuno-compromised<br />
persons<br />
such as persons with cancer<br />
undergoing chemotherapy,<br />
people who have undergone<br />
organ transplants, people with<br />
HIV/AIDS or other immune<br />
system disorders, some elderly,<br />
and infants can be particularly<br />
at risk from infections.<br />
These people should<br />
seek advice about drinking<br />
water from their health care<br />
providers. USEPA/Centers<br />
for Disease Control (CDC)<br />
guidelines on appropriate<br />
means to lessen the risk of<br />
infection by Cryptosporidium<br />
and other microbial contaminants<br />
are available from the<br />
Safe Drinking <strong>Water</strong> Hotline<br />
at 1-800-426-4791.<br />
Radon<br />
Radon is a radioactive gas that you cannot see, taste, or smell. It is found throughout<br />
the U.S. Radon can move up through the ground and into a home through cracks and<br />
holes in the foundation. Radon can build up to high levels in all types of homes. Radon<br />
can also get into indoor air when released from tap water from showering, washing<br />
dishes, and other household activities. Compared to radon entering the home<br />
through soil, radon entering the home through tap water will in most cases be a small<br />
source of radon in indoor air. Radon is a known human carcinogen. Breathing air<br />
containing radon can lead to lung cancer. Drinking water containing radon may also<br />
cause increased risk of stomach cancer. If you are concerned about radon in your<br />
home, test the air in your home. Testing is inexpensive and easy. You should pursue<br />
radon removal for your home if the level of radon in your air is 4 picocuries per liter of<br />
air (pCi/L) or higher. There are simple ways to fix a radon problem that are not too<br />
costly. For additional information, call your State radon program (1-800-745-7236),<br />
the EPA Safe Drinking <strong>Water</strong> Hotline (1-800-426-4791), or the National Safety Council<br />
Radon Hotline (1-800-SOS-RADON).<br />
Lead<br />
If present, elevated levels of lead can cause serious health problems, especially for<br />
pregnant women and young children. Lead in drinking water is primarily from materials<br />
and components associated with service lines and home plumbing. Truckee Donner<br />
Public Utility District is responsible for providing high quality water, but cannot control<br />
the variety of materials used in plumbing components. When your water has been<br />
sitting for several hours, you can minimize the potential for lead exposure by flushing<br />
your tap for 30 seconds to 2 minutes before using water for drinking or cooking. If you<br />
are concerned about lead in your water, you may wish to have your water tested. Information<br />
on lead in drinking water, testing methods, and steps you can take to minimize<br />
exposure is available from the Safe Drinking <strong>Water</strong> Hotline or at http://<br />
www.epa.gov/safewater/lead.<br />
No Cryptosporidium or Giardia in District <strong>Water</strong><br />
You may have seen or heard news reports about Cryptosporidium and Giardia,<br />
microscopic organisms that can enter surface waters from run-off containing animal<br />
wastes. If ingested, Cryptospridium and Giardia can cause diarrhea, fever and other<br />
gastro-intestinal symptoms. Because the Truckee Donner Public Utility District’s water<br />
comes from deep wells rather than surface water, it is almost impossible to have these<br />
contaminants in the District’s water supply.
DETECTED<br />
COMPOUNDS<br />
Primary<br />
Contaminants<br />
(PDWS)<br />
MCL PHG<br />
(MCLG)<br />
Airport<br />
Well<br />
Northside<br />
Well<br />
<strong>Martis</strong><br />
<strong>Valley</strong><br />
Well<br />
Southside<br />
Well # 2<br />
“A”<br />
Well<br />
Glenshire<br />
Dr Well<br />
Sanders<br />
Well<br />
Prosser<br />
Annex<br />
Well<br />
Prosser<br />
Heights<br />
Well<br />
Well<br />
20<br />
Prosser<br />
Village<br />
Well<br />
Old<br />
Greenwood<br />
Well<br />
Arsenic (ppb) 10 0.004 9.8 N/D 8 N/D N/D 9.4 8.9 N/D N/D N/D N/D 2.4 NO<br />
Fluoride (ppm) 2 1 N/D 0.011 N/D N/D N/D N/D N/D 0.05 N/D N/D 0.11 N/D NO<br />
Violation Major Origins in<br />
Drinking <strong>Water</strong><br />
Erosion of<br />
natural deposits<br />
Nitrate (asNO3) (ppm) 45 45 2.9 N/D 1.9 3.7 N/D 2 N/D N/D N/D 1.2 2.1 N/D NO Leaching of natural<br />
deposits, sewage,<br />
Nitrite (ppm) 1 1 N/D N/D N/D N/D N/D N/D N/D N/D N/D N/D N/D 0.79 NO runoff from fertilizer<br />
use.<br />
Radionuclides<br />
Radon (pCi/L) N/A N/A 1600 990 N/T 885 540 765 1050 740 N/D 293 560 530 N/A Erosion of natural<br />
deposits<br />
Regulated Contaminants with Secondary MCLs (a) (SDWS)<br />
Color (ACU) 15 15 N/D N/D N/D N/D N/D N/D N/D N/D 3 N/D 5 N/D NO<br />
Odor 3 3 2 1 N/D 1 1 N/D 1 1 1 1 N/D 1 NO<br />
Iron (ppb) 300 300 N/D N/D 6 N/D N/D N/D N/D N/D N/D N/D N/D N/D NO<br />
Chloride (ppm) 500 500 5.5 17 7.1 5.7 N/D 12 53 N/D N/D N/D 6.4 2.2 NO<br />
Copper (ppm) 1 1 N/D N/D 87 0.04 N/D N/D 0.28 0.02 N/D N/D N/D N/D NO<br />
Manganese (ppb) 50 50 N/D N/D 6.4 N/D N/D N/D N/D N/D N/D N/D N/D 26 NO<br />
Total Dissolved Solids (ppm) 1000 1000 126 170 120 112 68 140 230 112 110 110 108 110 NO<br />
Sulfate (ppm) 500 500 4.1 8.9 3.5 1.3 N/D 6.7 16 N/D N/D N/D 1.4 1.1 NO<br />
Specific Conductance<br />
(μS/cm)<br />
Natural-occurring<br />
organic materials<br />
Leaching from<br />
natural<br />
deposits<br />
1600 1600 187 241 160 160 107 200 360 166 166 166 180 160 NO Substances that form<br />
ions when in water<br />
pH N/A N/A 8.1 8.3 8.1 7.1 7.4 8.3 8 8.1 8.3 8.1 8.2 8 N/A Leaching of natural<br />
deposits<br />
Unregulated General Minerals<br />
Hardness (ppm) N/A N/A 67 77 57 92 44 72 97 41 72 56 55 62 N/A<br />
Sodium (ppm) N/A N/A 10 32 9.3 4.9 3.5 12 29 15 6.4 12 16 8.5 N/A<br />
Microbial<br />
Contaminants<br />
MCL<br />
Total Coliform Bacteria > Than 2 positive samples or more than<br />
5% positive samples per month<br />
TDPUD System Highest Month<br />
Copper/Lead AL MCLG TDPUD <strong>Water</strong> System 90th Percentile Value # of Sites<br />
Sampled<br />
0.0 % NO<br />
# of Sites that Exceeded Action Level<br />
Copper (ppm) 1.3 0.3 0.074 30 0 NO<br />
Lead (ppb) 15 2 2 30 0 NO<br />
Disinfection<br />
Residual<br />
Chlorine (ppm)<br />
Disinfection<br />
Byproducts<br />
Total Trihalomethanes (ppb)<br />
MRDL MRDLG Average Range for TDPUD <strong>Water</strong> System<br />
4<br />
4<br />
MCL PHG<br />
(MCLG)<br />
80<br />
N/A<br />
The data presented in this table is from the most recent monitoring done in compliance with regulations. Some data is more than a year old.<br />
0.35<br />
0.32 - 0.47<br />
Average Range for TDPUD <strong>Water</strong> System Sample Date<br />
3.8<br />
N/D - 6.2 08/04/2011<br />
NO<br />
NO<br />
Leaching of<br />
natural deposits<br />
Naturally present in<br />
the<br />
environment<br />
Corrosion of<br />
household<br />
plumbing systems.<br />
Flushing prior to use<br />
recommended<br />
Drinking <strong>Water</strong><br />
Disinfectant added for<br />
treatment<br />
By-product of<br />
drinking water<br />
disinfection<br />
Arsenic above 5 ppb up to 10 ppb: While your drinking water meets the current Federal and State standards for<br />
arsenic, it does contain low levels of arsenic. The standard balances the current understanding of arsenic’s possible<br />
health effects against the costs of removing arsenic from drinking water. The USEPA continues to research the<br />
health effects of low levels of arsenic, which is a mineral known to cause cancer in humans at high concentrations<br />
and is linked to other health effects such as skin damage and circulatory problems.<br />
GENERAL INFORMATION<br />
The sources of drinking water (both tap water and bottled water) include rivers, lakes, streams, ponds, reservoirs,<br />
springs and wells. As water travels over the surface of the land or through the ground, it dissolves naturallyoccurring<br />
minerals and, in some cases, radioactive material, and can pick up substances resulting from the presence<br />
of animals or from human activity.<br />
Contaminants that may be present in source water include:<br />
Microbial contaminants, such as viruses and bacteria, that may come from sewage treatment plants, septic<br />
systems, agricultural livestock operations and wildlife.<br />
Inorganic contaminants, such as salts and metals, that can be naturally-occurring or result from urban stormwater<br />
runoff, industrial or domestic wastewater discharges, oil and gas production, mining, or farming.<br />
Pesticides and herbicides, that may come from a variety of sources such as agricultural, urban storm-water<br />
runoff and residential uses.<br />
Organic chemical contaminants, including synthetic and volatile organic chemicals, that are by-products of<br />
industrial processes and petroleum production, and can also come from gas stations, urban<br />
storm-water runoff, agricultural application, and septic systems.<br />
Radioactive contaminants, that can be naturally-occurring or be the result of oil and gas production and mining<br />
activities.<br />
In order to ensure that tap water is safe to drink, the U.S. Environmental Protection Agency (USEPA) and the State<br />
Department of Public Health (Department) prescribe regulations that limit the amount of certain contaminants in<br />
water provided by public water systems. Department regulations also establish limits for contaminants in bottled<br />
water that must provide the same protection for public health.<br />
Drinking water, including bottled water, may reasonably be expected to contain at least small amounts of some<br />
contaminants. The presence of contaminants does not necessarily indicate that water poses a health risk. More<br />
information about contaminants and potential health effects can be obtained by calling the USEPA’s Safe Drinking<br />
<strong>Water</strong> Hotline at 1-800-426-4791 or at http://water.epa.gov/drink/index.cfm.<br />
TERMS USED IN THIS REPORT<br />
Detected Compounds: The State allows us to monitor for some contaminants less than once per year because the<br />
concentrations of these contaminants do not change frequently. Some of our data, though representative, are more<br />
than one year old. Not listed are the hundreds of other compounds for which we tested that were not detected.<br />
Regulated Contaminants with Secondary MCLs (a): There are no PHGs, MCLGs, or mandatory standard health<br />
effects language for these constituents because secondary MCLs are set on the basis of aesthetics.<br />
Maximum Contaminant Level (MCL): The highest level of a contaminant that is allowed in drinking water. Primary<br />
MCLs are set as close to the PHGs (or MCLGs) as is economically and technologically feasible. Secondary MCLs<br />
are set to protect the odor, taste and appearance of drinking water.<br />
Maximum Contaminant Level Goal (MCLG): The level of a contaminant in drinking water below which there is no<br />
known or expected risk to health. MCLGs are set by the U.S. Environmental Protection Agency.<br />
Public Health Goal (PHG): The level of a contaminate in drinking water below which there is no known or expected<br />
risk to health. PHGs are set by the California Environmental Protection Agency.<br />
Primary Drinking <strong>Water</strong> Standards (PDWS): MCLs and MRDLs for contaminants that affect health along with their<br />
monitoring and reporting requirements, and water treatment requirements.<br />
Maximum Residual Disinfectant Level (MRDL): The highest level of a disinfectant allowed in drinking water.<br />
There is convincing evidence that addition of a disinfectant is necessary for control of microbial contaminants.<br />
Maximum Residual Disinfectant Level Goal (MRDLG): The level of a drinking water disinfectant below which<br />
there is no known or expected risk of health. MRDLGs do not reflect the benefits of the use of disinfectants to control<br />
microbial contaminants.<br />
Secondary Drinking <strong>Water</strong> Standards (SDWS): MCLs for contaminants that affect taste, odor, or appearance of<br />
the drinking water. Contaminants with SDWSs do not affect the health a the MCL levels.<br />
Regulatory Action Level (AL) : The concentration of a contaminant which, if exceeded, triggers treatment or other<br />
requirements which a water system must follow.<br />
Radiochemical Parameters—Compounds found in drinking water which emit radiation.<br />
Microbial Parameters—Disease-causing organisms that, at certain levels, may be harmful. Additional information<br />
about Cryptosporidium and Giardia is supplied in this report.<br />
Unregulated Compounds Analyzed—Unregulated Compounds Analyzed— Unregulated compounds that the<br />
Truckee Donner Public Utility District has tested for. These compounds are not known to be associated with adverse<br />
health effects.<br />
N/D– not detectable at testing limit<br />
ppm—Parts per million, or milligrams per liter (mg/L)<br />
ppb—Parts per billion, or micrograms per liter (ug/L)<br />
μS/cm—Micro Siemens per centimeter<br />
> - Greater than<br />
pCi/L (Picocuries per Liter) - A measure of radioactivity.<br />
N/T– not tested<br />
N/A—Not Applicable<br />
ACU (Apparent Color Unit) - A measure of color in<br />
drinking water.
Drinking water, including bottled water, may reasonably be expected to contain at least small amounts of some contaminants. The presence<br />
of contaminants does not necessarily indicate that the water poses a health risk. More information about contaminants and potential<br />
health effects can be obtained by calling the USEPA’s Safe Drinking <strong>Water</strong> Hotline (1-800-426-4791).<br />
Some people may be more vulnerable to contaminants in drinking water than the general population. Immuno-compromised persons<br />
such as persons with cancer undergoing chemotherapy, persons who have undergone organ transplants, people with HIV/AIDS or other<br />
immune system disorders, some elderly, and infants can be particularly at risk from infections. These people should seek advice about<br />
drinking water from their health care providers. USEPA/Centers for Disease Control (CDC) guidelines on appropriate means to lessen the<br />
risk of infection by Cryptosporidium and other microbial contaminants are available from the Safe Drinking <strong>Water</strong> Hotline (1-800-426-<br />
4791).<br />
The sources of drinking water (both tap water and bottled water) include rivers, lakes, streams, ponds, reservoirs, springs, and wells. As<br />
water travels over the surface of the land or through the ground, it dissolves naturally-occurring minerals and, in some cases, radioactive<br />
material, and can pick up substances resulting from the presence of animals or from human activity.<br />
In 2003, the NCSD conducted a source water assessment on the Big Springs source. The source is considered most vulnerable to the<br />
following activities: recreational areas, sewer collection systems, automobile repair shops, chemical/petroleum pipelines, and machine<br />
shops. These activities are not associated with any detected contaminants.<br />
In order to ensure that tap water is safe to drink, the USEPA and the State Department of Public Health (Department) prescribe regulations<br />
that limit the amount of certain contaminants in water provided by public water systems. Department regulations also establish<br />
limits for contaminants in bottled water that provide the same protection for public health.<br />
Contaminants that may be present in source water include:<br />
Microbial contaminants, such as viruses and bacteria, that may come from sewage treatment plants, septic systems, agricultural livestock<br />
operations, pets and wildlife.<br />
Inorganic contaminants, such as salts and metals that can be naturally-occurring or result from urban stormwater runoff, industrial or<br />
domestic wastewater discharges, oil and gas production, mining, or farming.<br />
Pesticides and herbicides that may come from a variety of sources such as agriculture, urban stormwater runoff, and residential uses.<br />
Organic chemical contaminants, including synthetic and volatile organic chemicals, that are byproducts of industrial processes and<br />
petroleum production, and can also come from gas stations, urban stormwater runoff, agricultural application, and septic systems.<br />
Radioactive contaminants that can be naturally-occurring or be the result of oil and gas production and mining activities.<br />
If present, elevated levels of lead can cause serious health problems, especially for pregnant women and young children. Lead in drinking<br />
water is primarily from materials and components associated with service lines and home plumbing. The NCSD is responsible for<br />
providing high quality drinking water, but cannot control the variety of materials used in plumbing components. When your water has<br />
been sitting for several hours, you can minimize the potential for lead exposure by flushing your tap for 30 seconds to 2 minutes before<br />
using water for drinking or cooking. If you are concerned about lead in your water, you may wish to have your water tested. Information<br />
on lead in drinking water, testing methods, and steps you can take to minimize exposure is available from the Safe Drinking <strong>Water</strong> Hotline<br />
or at http://www.epa.gov/safewater/lead.<br />
<br />
<br />
Northstar Community Services District<br />
Annual <strong>Water</strong> Quality Report<br />
2011 <br />
This state-mandated annual report contains important<br />
information about the quality of your drinking water.<br />
Northstar Community Services District<br />
Northstar, Calif. 96161<br />
908 Northstar Drive
Dear Customer:<br />
The Northstar Community Services District (NCSD) is proud to provide<br />
some of the nation’s cleanest drinking water. In 2011, as in<br />
years past, our water met or exceeded federal and state standards<br />
for drinking water. The State of California mandates that we send<br />
this Annual <strong>Water</strong> Quality Report to you, which includes important<br />
information about your drinking water.<br />
The NCSD draws its source water from two locations. The first<br />
source is a natural mountain spring located in the mid-mountain<br />
region of the Northstar-at-Tahoe Resort. The water is collected in<br />
the Big Springs collection system and then treated at the District’s<br />
state-of-the-art <strong>Water</strong> Treatment Facility prior to being delivered<br />
to the customers’ tap. The second source is a well (TH-2) located<br />
in the <strong>Martis</strong> <strong>Valley</strong> that was developed in 2007 to help meet future<br />
water demands as the community continues to expand.<br />
We are committed to delivering the highest quality drinking water,<br />
ensuring that our customers receive clean, safe water from their<br />
taps.<br />
In 2011 the District delivered over 182 million gallons of drinking<br />
water through 30 miles of pipeline to over 1,800 residential and<br />
commercial services throughout the Northstar community.<br />
Should you have any questions or would like to obtain additional<br />
information, please contact the Northstar Community Services District:<br />
Phone: (530) 562-0747<br />
Fax: (530) 562-1505<br />
www.northstarcsd.com<br />
In case of a water or sewer emergency, please call<br />
530-562-0747<br />
KEY WATER QUALITY TERMS<br />
AL—Regulatory Action Level: The<br />
concentration of a contaminant which, if<br />
exceeded, triggers treatment or other<br />
requirements which a water system<br />
must follow.<br />
MCL—Maximum Contaminant Level:<br />
The highest level of a contaminant that<br />
is allowed in drinking water. Primary<br />
MCLs are set as close to the MCLGs as<br />
is economically and technologically feasible.<br />
Secondary MCLs are set to protect<br />
the odor, taste, and appearance of<br />
drinking water.<br />
MCLG—Maximum Contaminant Level<br />
Goal: The level of a contaminant in<br />
drinking water below which there is no<br />
known or expected risk to health.<br />
MCLGs are set by the U.S. Environmental<br />
Protection Agency (USEPA).<br />
MRDL—Maximum Residual Disinfectant<br />
Level: The level of a disinfectant<br />
added for water treatment that may not<br />
be exceeded at the consumer’s tap.<br />
ND: Not Detectable at testing limit.<br />
PHG—Public Health Goal: The level of<br />
a contaminant in drinking water below<br />
which there is no known or expected<br />
risk to health. PHGs are set by the California<br />
Environmental Protection Agency.<br />
ppm: parts per million or milligrams per<br />
liter (mg/L)<br />
ppb: parts per billion or micrograms per<br />
liter (ųg/L)<br />
TT—Treatment Technique: A required<br />
process intended to reduce the level of<br />
a contaminant in drinking water.<br />
Want More Information? The NCSD<br />
Board of Directors meets regularly each<br />
month. Please feel free to participate in these<br />
meetings. For meeting dates, times and<br />
locations please contact our main office at<br />
(530) 562-0747. You may also find more<br />
information by visiting our website:<br />
www.northstarcsd.org.<br />
Este informe contiene información muy<br />
importante sobre su agua potable.<br />
Tradúzcalo ó hablcon alguien que lo<br />
entienda bien.<br />
Tables 1, 2, 3, 4, and 5 list all of the drinking water contaminants that were detected during the most recent sampling<br />
for the constituent. The presence of these contaminants in the water does not necessarily indicate that the water poses<br />
a health risk. The Department allows us to monitor for certain contaminants less than once per year because the<br />
concentrations of these contaminants do not change frequently. Some of the data, though representative of the water<br />
quality, are more than one year old.
U.S. Geological Survey and the California State <strong>Water</strong> Resources Control Board<br />
<strong>Groundwater</strong> Quality in the Tahoe and <strong>Martis</strong><br />
Basins, California<br />
<strong>Groundwater</strong> provides more than 40 percent of California’s drinking water. To protect this vital resource, the<br />
State of California created the <strong>Groundwater</strong> Ambient Monitoring and Assessment (GAMA) Program. The<br />
Priority Basin Project of the GAMA Program provides a comprehensive assessment of the State’s groundwater<br />
quality and increases public access to groundwater-quality information. The Tahoe and <strong>Martis</strong> Basins and surrounding<br />
watersheds constitute one of the study units being evaluated.<br />
The Tahoe-<strong>Martis</strong> Study Unit<br />
The Tahoe-<strong>Martis</strong> study unit is approximately 460 square miles and includes the<br />
groundwater basins on the south, north, and west shores of Lake Tahoe, and the <strong>Martis</strong> <strong>Valley</strong><br />
groundwater basin (California Department of <strong>Water</strong> Resources, 2003). The study unit was<br />
divided into three study areas based primarily on geography: the Tahoe study area composed<br />
of the three Tahoe <strong>Valley</strong> basins, the <strong>Martis</strong> study area, and the Hard Rock study area composed<br />
of the parts of the watersheds surrounding the basins (Fram and others, 2009).<br />
The primary aquifers in the Tahoe study area consist of glacial outwash sediments (mixtures<br />
of sand, silt, clay, gravel, cobbles, and boulders), interbedded with lake sediments. The<br />
primary aquifers in the <strong>Martis</strong> study area are interbedded volcanic lavas, volcanic sediments,<br />
and glacial outwash sediments. In the Hard Rock study area, groundwater is present in fractured<br />
granitic rocks in the south and fractured volcanic rocks in the north. Aquifers composed<br />
of different materials commonly contain ground-<br />
water with different chemical compositions.<br />
The primary aquifers in the study unit are<br />
defined as those parts of the aquifers corresponding<br />
to the screened or open intervals of wells<br />
listed in the California Department of Public<br />
Health database. In the Tahoe study area, these<br />
wells typically are drilled to depths between 175<br />
and 375 feet, consist of solid casing from land<br />
surface to a depth of about 75 to 125 feet, and are<br />
screened or open below the solid casing. In the<br />
<strong>Martis</strong> study area, these wells typically are 200<br />
to 900 feet deep, and are screened or open below<br />
75 to 300 feet. <strong>Water</strong> quality in the shallower and<br />
deeper parts of the aquifer system may differ from<br />
that in the primary aquifers.The Hard Rock study<br />
area includes wells and developed springs.<br />
The Tahoe-<strong>Martis</strong> study unit has warm, dry<br />
summers and cold, wet winters. Average annual<br />
precipitation ranges from 30 inches at Lake Tahoe<br />
to 80 inches in the surrounding mountains, and<br />
the majority of precipitation falls as snow. Land<br />
use in the study unit is approximately 88 percent<br />
(%) undeveloped (forests, grasslands, and bare<br />
U.S. Department of the Interior<br />
U.S. Geological Survey<br />
Nevada<br />
<strong>County</strong><br />
<strong>Placer</strong><br />
<strong>County</strong><br />
El Dorado<br />
<strong>County</strong><br />
Hard Rock<br />
study area<br />
rock), and 12% urban. The undeveloped lands are used mostly for recreation. The largest<br />
urban areas are the cities of South Lake Tahoe and Truckee.<br />
Municipal and community water supply accounts for nearly all of the total water use in<br />
the study unit, with most of the remainder used for recreation, including landscape irrigation<br />
and snow-making. <strong>Groundwater</strong> provides nearly all of the water supply in the study unit,<br />
with limited use of surface water in some areas. Recharge to the groundwater flow system is<br />
mainly from mountain-front recharge at the margins of the basins, stream-channel infiltration,<br />
and direct infiltration of precipitation. <strong>Groundwater</strong> leaves the aquifer system when it is<br />
pumped for water supply or flows into streams and lakes.<br />
Truckee<br />
0 4 8 Miles<br />
0 4 8 Kilometers<br />
<strong>Water</strong>shed boundary<br />
River<br />
Truckee<br />
LAKE<br />
TAHOE<br />
NEVADA<br />
CALIFORNIA<br />
Truck e River<br />
Upper<br />
Printed on recycled paper<br />
<strong>Martis</strong> study area<br />
Tahoe study area<br />
South Lake<br />
Tahoe<br />
Alpine<br />
<strong>County</strong><br />
Overview of <strong>Water</strong> Quality<br />
Inorganic<br />
constituents<br />
67<br />
20<br />
13<br />
Organic<br />
constituents<br />
1 1<br />
CONSTITUENT CONCENTRATIONS<br />
High Moderate Low or not detected<br />
Values are a percentage of the area of the primary aquifers<br />
with concentrations in the three specified categories. Values<br />
on pie chart may not equal 100 due to rounding of percentages.<br />
GAMA’s Priority Basin Project<br />
evaluates the quality of untreated<br />
groundwater. However, for context,<br />
benchmarks established for drinkingwater<br />
quality are used for comparison.<br />
Benchmarks and definitions of high,<br />
moderate, and low concentrations are<br />
discussed in the inset box on page 3.<br />
Many inorganic constituents occur<br />
naturally in groundwater. The concentrations<br />
of the inorganic constituents can<br />
be affected by natural processes as well<br />
as by human activities. In the Tahoe-<br />
<strong>Martis</strong> study unit, one or more inorganic<br />
constituents were present at high concentrations<br />
in about 20% of the primary<br />
aquifers and at moderate concentrations<br />
in 13%.<br />
Human-made organic constituents<br />
are found in products used in the home,<br />
business, industry, and agriculture.<br />
Organic constituents can enter the environment<br />
through normal usage, spills,<br />
or improper disposal. In this study unit,<br />
one or more organic constituents were<br />
present at high concentrations in about<br />
1% of the primary aquifers and at moderate<br />
concentrations in about 1%.<br />
98<br />
Fact Sheet 2011–3143<br />
April 2012
RESULTS: <strong>Groundwater</strong> Quality in the Tahoe-<strong>Martis</strong> Study Unit<br />
INORGANIC CONSTITUENTS<br />
77<br />
3<br />
86<br />
85<br />
100<br />
92<br />
8<br />
Trace<br />
elements<br />
Radioactive<br />
constituents<br />
Nutrients<br />
Total<br />
dissolved<br />
solids<br />
Manganese<br />
INORGANIC CONSTITUENTS<br />
SPECIAL-INTEREST CONSTITUENTS<br />
100<br />
19<br />
4<br />
12<br />
14<br />
Perchlorate<br />
Inorganic Constituents with Human-Health Benchmarks<br />
Trace and minor elements are naturally present in the minerals in rocks and<br />
soils, and in the water that comes into contact with those materials. In the Tahoe-<br />
<strong>Martis</strong> study unit, trace elements were present at high concentrations in about 19%<br />
of the primary aquifers, and in moderate concentrations in about 4%. Arsenic was<br />
the trace element that most frequently occurred at high and moderate concentrations.<br />
Three trace elements with non-regulatory health-based benchmarks, boron,<br />
molybdenum, and strontium, also were detected at high concentrations.<br />
Radioactivity is the emission of energy or particles during spontaneous decay<br />
of unstable atoms. Humans are exposed to small amounts of natural radioactivity<br />
every day. Most of the radioactivity in groundwater comes from decay of naturally<br />
occurring uranium and thorium in minerals in the rocks or sediments of the aquifers.<br />
Radioactive constituents occurred at high levels in about 3% of the primary<br />
aquifers, and at moderate levels in about 12%. Gross alpha particle and radon-222<br />
activities were the radioactive constituents that most frequently occurred at high<br />
and moderate levels.<br />
Nutrients, such as nitrogen, are naturally present at low concentrations in<br />
groundwater. High and moderate concentrations generally occur as a result of<br />
human activities. Common sources of nutrients include fertilizer applied to crops<br />
and landscaping, seepage from septic systems, and human and animal waste. In the<br />
Tahoe-<strong>Martis</strong> study unit, nutrients were not detected at high or moderate concentrations<br />
in the primary aquifers.<br />
Inorganic Constituents with Non-Health Benchmarks<br />
(Not included in water-quality overview charts shown on the front page)<br />
Some constituents affect the aesthetic properties of water, such as taste, color,<br />
and odor, or may create nuisance problems, such as staining and scaling. The State<br />
of California has a recommended and an upper limit for total dissolved solids<br />
(TDS). All water naturally contains TDS as a result of the weathering and dissolution<br />
of minerals in soils and rocks. Iron and manganese are naturally occurring<br />
constituents that commonly occur together in groundwater. Anoxic conditions in<br />
groundwater (low amounts of dissolved oxygen) may result in release of manganese<br />
and iron from minerals into groundwater.<br />
In the Tahoe-<strong>Martis</strong> study unit, TDS was present at high concentrations<br />
(greater than the upper limit) in about 8% of the primary aquifers, and at low concentrations<br />
(less than the recommended limit) in about 92% of the primary aquifers.<br />
Manganese, with or without iron, was present at high concentrations in about 14%<br />
of the primary aquifers.<br />
Perchlorate<br />
(Not included in water-quality overview charts shown on the front page)<br />
Perchlorate is an inorganic constituent that has been regulated in California<br />
drinking water since 2007. It is an ingredient in rocket fuel, fireworks, safety flares,<br />
and other products, may be present in some fertilizers, and occurs naturally at low<br />
concentrations in groundwater. Perchlorate was not detected in the primary aquifers.
RESULTS: <strong>Groundwater</strong> Quality in the Tahoe-<strong>Martis</strong> Study Unit<br />
ORGANIC CONSTITUENTS<br />
Solvents<br />
Other volatile<br />
organic<br />
compounds<br />
Pesticides<br />
1
Factors that Affect <strong>Groundwater</strong> Quality<br />
In the Tahoe-<strong>Martis</strong> study unit, arsenic was the constituent that most frequently<br />
occurred at high concentrations. About 18% of the primary aquifers had arsenic concentrations<br />
greater than the human-health regulatory benchmark Federal MCL) of 10 µg/L<br />
(micrograms per liter). Natural sources of arsenic to groundwater include dissolution of<br />
arsenic-bearing sulfide minerals, desorption of arsenic from the surfaces of manganese-<br />
or iron-oxide minerals (or dissolution of those oxide minerals), and mixing with geothermal<br />
waters (Welch and others, 2000).<br />
10<br />
1<br />
ARSENIC, IN MICROGRAMS PER LITER 100<br />
0.1<br />
6 7 8 9<br />
pH, IN STANDARD UNITS<br />
By Miranda S. Fram and Kenneth Belitz<br />
EXPLANATION<br />
Aquifer rock type<br />
granitic rock<br />
sedimentary<br />
anoxic oxic<br />
volcanic rock<br />
Relative-<br />
Concentration<br />
High<br />
Moderate<br />
Low<br />
In the Tahoe-<strong>Martis</strong> study unit, elevated arsenic concentrations likely are caused<br />
by two different processes (Fram and Belitz, 2012). In aquifers composed of sediments<br />
or volcanic rocks, high and moderate arsenic concentrations were found in groundwater<br />
that was oxic (high dissolved oxygen concentration) and alkaline (pH values greater<br />
than about 8). The elevated arsenic concentration in oxic, alkaline groundwater likely is<br />
due to desorption of arsenic from the surfaces of manganese- and iron-oxide minerals<br />
(Smedley and Kinniburgh, 2002). Oxic, alkaline conditions increase arsenic solubility<br />
in groundwater by inhibiting arsenic from adhering to mineral surfaces (sorption). In<br />
aquifers composed of granitic and volcanic rocks, high arsenic concentrations also were<br />
found in anoxic (low dissolved oxygen concentration) groundwater with low pH values.<br />
Dissolution of manganese- and iron-oxide minerals under anoxic conditions likely<br />
results in release of arsenic associated with these minerals.<br />
SELECTED REFERENCES<br />
California Department of <strong>Water</strong> Resources, 2003, California’s groundwater: California Department of<br />
<strong>Water</strong> Resources Bulletin 118, 246 p. http://www.water.ca.gov/groundwater/bulletin118/update2003.<br />
cfm.<br />
Fram, M.S., Munday, Cathy, and Belitz, Kenneth, 2009, <strong>Groundwater</strong> quality data for the Tahoe-<strong>Martis</strong><br />
study unit, 2007—Results from the California GAMA Program: U.S. Geological Survey Data Series<br />
432, 87 p. (Also available at http://pubs.usgs.gov/ds/432/.)<br />
Fram, M.S., and Belitz, Kenneth, 2012, Status and understanding of groundwater quality in the Tahoe-<br />
<strong>Martis</strong>, Central Sierra, and Southern Sierra study units,2006–2007—California GAMA Program<br />
Priority Basin Project: U.S. Geological Survey Scientific Investigations Report 2011-5216, 222 p.<br />
(Also available at http://pubs.usgs.gov/sir/2011/5216.)<br />
Smedley, P.L., and Kinniburgh, D.G., 2002, A review of the source, behavior, and distribution of arsenic<br />
in natural waters: Applied Geochemistry, v. 17, p. 517–568.<br />
Welch, A.H., Westjohn, D.B., Helsel, D.R., and Wanty, R.B., 2000, Arsenic in ground water of the<br />
United States—occurrence and geochemistry: Ground <strong>Water</strong>, v. 38, no. 4, p. 589–604.<br />
Priority Basin Assessments<br />
GAMA’s Priority Basin Project<br />
(PBP) assesses water quality in that<br />
part of the aquifer system used for<br />
drinking water, primarily public supply.<br />
<strong>Water</strong> quality in the primary aquifers,<br />
assessed by the PBP, may differ from<br />
that in the deeper parts of the aquifer,<br />
or from the shallower parts, which are<br />
being assessed by GAMA’s Domestic<br />
Well Project. Ongoing assessments<br />
are being conducted in more than 120<br />
basins throughout California.<br />
The PBP assessments are based<br />
on a comparison of constituent concentrations<br />
in untreated groundwater with<br />
benchmarks established for protection<br />
of human health and for aesthetic<br />
concerns. The PBP does not evaluate<br />
the quality of drinking water delivered<br />
to consumers.<br />
The PBP uses two scientific<br />
approaches for assessing groundwater<br />
quality. The first approach uses a<br />
network of wells to statistically assess<br />
the status of groundwater quality. The<br />
second approach combines waterquality,<br />
hydrologic, geographic, and<br />
other data to help assess the factors<br />
that affect water quality. In the Tahoe-<br />
<strong>Martis</strong> study unit, data were collected<br />
by the PBP in 2007, and from the<br />
CDPH database for 2004–2007. The<br />
PBP includes chemical analyses generally<br />
not available as part of regulatory<br />
compliance monitoring, including<br />
measurements at concentrations much<br />
lower than human-health benchmarks,<br />
and measurement of constituents that<br />
can be used to trace the sources and<br />
movement of groundwater.<br />
For more information<br />
Technical reports and hydrologic<br />
data collected for the GAMA PBP Program<br />
may be obtained from:<br />
GAMA Project Chief<br />
U.S. Geological Survey<br />
California <strong>Water</strong> Science Center<br />
4165 Spruance Road, Suite 200<br />
San Diego, CA 92101<br />
Telephone number: (619) 225-6100<br />
WEB: http://ca.water.usgs.gov/gama<br />
GAMA Program Unit<br />
State <strong>Water</strong> Resources Control Board<br />
Division of <strong>Water</strong> Quality<br />
PO Box 2231, Sacramento, CA 95812<br />
Telephone number: (916) 341-5779<br />
WEB: http://www.waterboards.ca.gov/gama
<strong>Martis</strong> <strong>Valley</strong> <strong>Groundwater</strong> <strong>Management</strong> <strong>Plan</strong><br />
Appendix F: DRI Technical Note<br />
DRAFT for review purposes only. Use of contents on this sheet is subject to the limitations specified at the end of this document.<br />
P:\40000\140691 - PCWA <strong>Martis</strong> <strong>Valley</strong> GWP\GMP\Report\3rd Draft\<strong>Martis</strong> <strong>Valley</strong> GMP Draft 01-09-13.docx<br />
F
2215 Raggio Parkway, Reno, Nevada 89512-1095<br />
Phone (775) 673-7300 Fax (775) 673-7363<br />
Technical Note<br />
SCIENCE • ENVIRONMENT • SOLUTIONS<br />
Division of Hydrologic Sciences<br />
To: Tony Firenzi, <strong>Placer</strong> <strong>County</strong> <strong>Water</strong> Agency; Tina Bauer, Brown and Caldwell<br />
From: Seshadri Rajagopal, Donald M. Reeves, Justin Huntington, Greg Pohll (Desert<br />
Research Institute)<br />
Date: September 10, 2012<br />
Re: Estimates of Ground <strong>Water</strong> Recharge in the <strong>Martis</strong> <strong>Valley</strong> Ground <strong>Water</strong> Basin<br />
Purpose and Scope<br />
This technical note provides spatially-distributed estimates of annual ground water recharge in the<br />
<strong>Martis</strong> <strong>Valley</strong> Ground <strong>Water</strong> Basin using a physically-based hydrologic model: Precipitation Runoff<br />
Modeling System (PRMS). PRMS simulates land surface hydrologic processes of evapotranspiration,<br />
runoff, infiltration, and interflow by balancing energy and mass budgets of the plant canopy, snowpack,<br />
and soil zone on the basis of distributed climate information (Leavesley et al., 1983), and has been used in<br />
several other basins to estimate ground water recharge (e.g., Lichty and McKinley, 1995; Vaccaro and<br />
Olsen, 2007; Cherkauer and Ansari, 2005; Cherkauer, 2004). Recharge in the current study is defined as<br />
the infiltration of water to the subsurface beyond the root zone (where present) or the soil zone, in case of<br />
bare soil absent of vegetation (Figure 1). Thus, the recharge estimates contained within this report<br />
represent total annual recharge within the delineated <strong>Martis</strong> <strong>Valley</strong> Ground <strong>Water</strong> Basin. The <strong>Martis</strong><br />
<strong>Valley</strong> Ground <strong>Water</strong> Basin was first delineated by Hydro-Search, Inc. and was later adopted by the<br />
California DWR as the official ground water basin. In this report we refer to this region as the HSI ground<br />
water basin or <strong>Martis</strong> <strong>Valley</strong> Ground <strong>Water</strong> Basin (Figure 2). Total recharge consists of both recharge to<br />
the deep ground water system and shallow recharge that ultimately discharges into streams. The technical<br />
note describes the use of climate data in PRMS, the PRMS method used to compute recharge, and<br />
recharge estimates. Recharge estimates from previous studies and an additional method are provided to<br />
place the PRMS computed results in the context of other estimates.<br />
Previous Estimates of Recharge for <strong>Martis</strong> <strong>Valley</strong><br />
Past studies primarily relied on empirical and water balance methods to estimate recharge within<br />
the <strong>Martis</strong> <strong>Valley</strong> Ground <strong>Water</strong> Basin (Figure 2). One of the earliest recharge studies was conducted by<br />
Hydro-Search, Inc. (1974) which was subsequently updated in 1980 and 1995. Hydro-Search Inc. (HSI)<br />
755 E. Flamingo Road, Las Vegas, Nevada 89119-7363<br />
Phone (702) 862-5400 Fax (702) 862-5427
utilized a water balance method to estimate ground water recharge to the <strong>Martis</strong> <strong>Valley</strong> Ground <strong>Water</strong><br />
Basin of approximately 18,000 ac-ft/yr. In 2001 Nimbus Engineers used a water balance approach to<br />
compute a recharge value of 24,700 ac-ft/yr to the ground water basin. Kennedy/Jenks Consultants in<br />
2001 published a report titled “Independent Appraisal of <strong>Martis</strong> <strong>Valley</strong> Ground <strong>Water</strong> Availability,<br />
Nevada and <strong>Placer</strong> Counties, California” where they concluded that the earlier studies by Hydro-Search,<br />
Inc (1974 and updates) and Nimbus Engineers (2001) were conservative, as the total amount of ground<br />
water discharge to streams was considered under predicted; however, updated recharge estimates were not<br />
provided in this report. Interflow Hydrology, Inc. and Cordilleran Hydrology, Inc. prepared a 2003 report<br />
indicating that ground water discharge to tributary Truckee River streams in the <strong>Martis</strong> <strong>Valley</strong> Ground<br />
<strong>Water</strong> Basin is 34,560 ac-ft/yr, of which approximately 24,240 ac-ft/yr is contributed by high altitude<br />
areas of the basin (e.g., in the vicinity of Northstar) and the remaining 10,320 ac-ft/yr occurs in lower<br />
elevation areas. In summary, previous recharge estimates based on water balance approaches range from<br />
18,000 to 34,560 ac-ft/yr.<br />
Description of PRMS Recharge Method<br />
The PRMS model (Leavesley et al., 1983) is driven by daily values of precipitation and<br />
maximum and minimum air temperature, and simulates snow accumulation, ablation, canopy<br />
interception, evapotranspiration, surface runoff, infiltration, water storage in the soil zone and deep<br />
percolation through the bottom of the root or soil zone – PRMS recharge is defined as the model<br />
computed excess water leaving the root or soil zone after abstractions for surface runoff and<br />
evapotranspiration are accounted for (Figure 1). The system is modeled in its natural transient state from<br />
1981 to 2011. Reservoir operations, irrigation within the basin, septic drainfields, and diversion of effluent<br />
to the Truckee Tahoe Sanitation Agency and subsequent release of treated effluent to the Truckee River<br />
are not explicitly simulated in the model. However, the <strong>Martis</strong> <strong>Valley</strong> PRMS model utilizes naturalized<br />
flows that remove the effects of reservoir operations during model calibration.<br />
The current PRMS model developed for <strong>Martis</strong> <strong>Valley</strong> encompasses the entire <strong>Martis</strong> <strong>Valley</strong><br />
hydrologic basin (Figure 2), and is subdivided into 14 watersheds for model calibration to internal stream<br />
gauges. Computation of recharge for the <strong>Martis</strong> <strong>Valley</strong> Ground <strong>Water</strong> Basin requires aggregation of the<br />
PRMS results for all cells within the delineated ground water basin (Figure 3). The model domain was<br />
discretized into square grid cells of 300 m resolution; each of these cells represents a hydrologic response<br />
unit (HRU). The model is parameterized from the National Elevation Dataset (NED), STATSGO soils<br />
database, and USGS land use land cover (LULC) dataset. The depth of the root or soil zone is determined<br />
by the LULC of the HRU. Five categories of LULC are used to assign these depths viz. bare soils,<br />
grasses, shrubs, trees, and water. For the category water, recharge is assumed zero.<br />
Daily weather data from the Truckee #2 SNOTEL site is used to drive the PRMS model. This<br />
station is used to develop monthly ratios based on PRISM maps to distribute precipitation over the entire<br />
basin. To account for days when temperature inversions within the valley occur, an additional weather<br />
station, Mt. Rose SNOTEL, is implemented.<br />
PRMS Recharge Estimates<br />
The estimated mean annual ground water recharge for the <strong>Martis</strong> <strong>Valley</strong> Ground <strong>Water</strong> Basin<br />
computed from PRMS is presented in Figure 4. PRMS simulated recharge varies from year to year based<br />
Page 2 of 11
on annual cycles of precipitation (Figure 5). The annual average recharge estimate from the PRMS model<br />
is 32,745 ac-ft, which is slightly lower than the Interflow Hydrology 2003 estimate of 34,560 ac-ft.<br />
We also applied a modified Maxey-Eakin (1949) method to estimate recharge which relates mean<br />
annual precipitation to recharge using recharge coefficients applied to precipitation amounts (Figure 3)<br />
(Epstein et al., 2010). Epstein et al., 2010 computed revised Maxey-Eakin coefficients that are based on<br />
the PRISM precipitation distribution (Daly et al., 1994), which was used in this study. As shown in<br />
Figure 3, the modified Maxey-Eakin estimate of 35,168 ac-ft/yr is very close to the Interflow Hydrology<br />
estimate. Figure 6 shows the ratio of recharge computed by the PRMS model to annual precipitation. This<br />
ratio, which we term as ‘recharge efficiency’, can be used to describe the fraction (or percentage) of<br />
precipitation that is converted to recharge. Computed recharge efficiencies for the <strong>Martis</strong> <strong>Valley</strong> ground<br />
water basin varies annually within a range of 18-26%.<br />
Discussion of Recharge Estimates<br />
PRMS computed recharge presented in Figures 4, 6 and 8 show that recharge to the <strong>Martis</strong> <strong>Valley</strong><br />
Ground <strong>Water</strong> Basin varies both spatially and temporally. The spatial variability in recharge is primarily<br />
driven by precipitation trends (Figures 7 and 8). This is clearly observed in Figure 7 where the higher<br />
elevation areas, in general, receive greater amounts of precipitation than the rest of the basin. Note that<br />
the PRMS recharge shown in Figure 8 represents infiltrated water given the processes presented in Figure<br />
1. The PRMS model neglects the influence of low permeable bedrock areas on the potential reduced rate<br />
of infiltration of precipitation. For example, the highest infiltration rates correspond to areas with the most<br />
precipitation. In reality, the highest elevation areas within the basin that receive the greatest amount of<br />
precipitation are located in the low-permeability mountain block. The low-permeability of the mountain<br />
block restricts the amount of infiltrating water, and forces water to redistribute as run-off and infiltrate<br />
downslope near the ‘bench’ areas of the slope with deposits of higher permeability alluvium. This<br />
redistribution has been simulated in integrated models (e.g., Huntington et al. 2012, in press) and inferred<br />
from ground water isotopes (Singleton et al., 2010). Thus, the spatial distribution of recharge, as shown in<br />
Figure 8, will change once the PRMS modeled recharge is combined with MODFLOW. This spatial<br />
redistribution will primarily change the pattern of recharge in the mountain block watersheds with only<br />
minimal changes to the lower elevation areas, and minimal changes in the total volume of recharge.<br />
Previous recharge estimates by Interflow Hydrology (34,560 ac-ft/yr), the Maxey-Eakin method<br />
(35,168 ac-ft/yr), and mean annual PRMS (32,745 ac-ft/yr) estimates are very similar and in agreement.<br />
Only the PRMS estimates provide insight as to annual variability in recharge with a range between 12,143<br />
and 56,792 ac-ft/yr (Figure 4). These fluctuations in annual ground water recharge estimates are natural<br />
and primarily based on fluctuations in annual precipitation (Figure 5). Perhaps most importantly are the<br />
water years when the amount of recharge is lower than the mean (~33,000 ac-ft). As shown in Figure 4,<br />
this variability can be significant with ‘wet’ and ‘dry’ year-end members. Pumpage during dry years may<br />
deplete the ground water basin as water is extracted from storage, whereas wet years increase the storage<br />
of water in the basin. If the number of wet and dry years and the amount of recharge oscillates evenly,<br />
then the mean recharge estimates from Interflow, modified Maxey-Eakin and PRMS methods are suitable<br />
for mean annual water budget analysis. However, future changes in temperature and/or precipitation (both<br />
timing and annual quantity) can disrupt the balance between pumping and basin storage.<br />
The PRMS computed recharge consists of the sum of shallow infiltrated water that discharges<br />
into the Truckee River and its tributaries as well as deep percolation of ground water to deeper aquifers<br />
Page 3 of 11
with water supply wells. Perennial basin yield, defined by the State of Nevada as the maximum amount of<br />
groundwater that can be salvaged each year over the long term without depleting the ground water<br />
reservoir, is not an appropriate metric to determine sustainable basin pumpage as values of perennial yield<br />
for a basin are usually limited to the maximum amount of natural discharge. Natural discharge from<br />
<strong>Martis</strong> <strong>Valley</strong> Basin consists of groundwater evapotranspiration, groundwater discharge to the Truckee<br />
River, along with a small quantity of groundwater outflow. As an alternative, we suggest that an analysis<br />
that utilizes the <strong>Martis</strong> <strong>Valley</strong> ground water model to define the ‘capturable’ amount of streamflow by<br />
pumping within the basin (e.g., Leake and Haney, 2010) would better quantify the relationship between<br />
sustainable pumpage and natural discharge.<br />
Evapotranspiration<br />
Evaporation<br />
Sublimation<br />
Sublimation<br />
Evaporation<br />
Transpiration<br />
Transpiration<br />
Air<br />
Temperature<br />
Rain<br />
Ground-water<br />
recharge<br />
Precipitation<br />
Interception<br />
Through fall<br />
Snowpack<br />
Snowmelt<br />
Impervious-zone<br />
reservoir<br />
Recharge zone Soil-zone<br />
Lower zone reservoir<br />
Soil-zone<br />
Subsurface<br />
recharge<br />
Ground-water<br />
recharge<br />
Ground-water<br />
reservoir<br />
Ground-water sink<br />
Subsurface<br />
reservoir<br />
Solar<br />
Radiation<br />
Figure 1. PRMS conceptual model schematic highlighting all simulated hydrologic processes and how<br />
ground water recharge is computed in the model (based on Leavesley et al., 1983).<br />
Page 4 of 11<br />
Rain Evaporation<br />
PRECIPITATION-<br />
RUNOFF<br />
MODELING SYSTEM<br />
Surface runoff<br />
Surface runoff<br />
Subsurface flow<br />
Ground-water flow Streamflow
Figure 2. PRMS model domain with 14 sub-watersheds denoted by color. Stream gauges used in the<br />
PRMS calibration are denoted by triangles.<br />
Page 5 of 11
Figure 3. PRMS model domain with a portion of the sub-watersheds combined to adhere to the<br />
delineated <strong>Martis</strong> <strong>Valley</strong> Ground <strong>Water</strong> Basin inset (blue). All recharge estimates in this study<br />
are computed over the blue area. The <strong>Martis</strong> <strong>Valley</strong> Ground <strong>Water</strong> Basin area was delineated<br />
by Hydro Search Inc. (HSI).<br />
Page 6 of 11
Figure 4. Annual recharge volumes computed by PRMS with comparison to recharge estimates from<br />
other methods and past studies.<br />
Figure 5. Annual precipitation volume over the <strong>Martis</strong> <strong>Valley</strong> Ground <strong>Water</strong> Basin<br />
Page 7 of 11
Figure 6. Value of recharge efficiency computed as the ratio of annual recharge to annual precipitation.<br />
The mean recharge efficiency value is 23%.<br />
Page 8 of 11
Figure 7. Mean annual precipitation (inches) in the <strong>Martis</strong> <strong>Valley</strong> PRMS model domain from PRISM<br />
(Daly et al., 1994).<br />
Page 9 of 11
Figure 8. Mean annual recharge (inches) in the <strong>Martis</strong> <strong>Valley</strong> PRMS model domain. Note that the<br />
greatest quantities of recharge occurs in the high elevation areas which receive more<br />
precipitation (Figure 7).<br />
Page 10 of 11
References<br />
Cherkauer, D. S., and S.A. Ansari, 2005. Estimating ground water recharge from topography,<br />
hydrogeology and land cover, Ground <strong>Water</strong>, 43(1), 102-112<br />
Cherkauer, D. S., 2004. Quantifying ground water recharge at multiple scales using PRMS and GIS,<br />
Ground <strong>Water</strong>, 42(1), 97-110.<br />
Daly, C., R. P. Neilson, and D. L. Phillips, 1994. A statistical-topographic model for mapping<br />
climatological precipitation over mountainous terrain. Journal of Applied Meteorology 33, 140-<br />
158<br />
Epstein, B.J., G.M. Pohll, J. Huntington, and R.W.H. Carroll, 2010. Development and uncertainty<br />
analysis of an empirical recharge prediction model for Nevada’s desert basins, Journal of the<br />
Nevada <strong>Water</strong> Resources Association 5(1).<br />
Hardman, G., 1936. Precipitation map of Nevada. Nevada Agricultural Experiment Station.<br />
Huntington, J.L. and R.G. Niswonger, 2012. Role of surface water and groundwater interactions on<br />
projected baseflows in snow dominated regions: an integrated modeling approach. <strong>Water</strong><br />
Resources Research, in press.<br />
Hydro-Search, Inc., 1995. Ground <strong>Water</strong> <strong>Management</strong> <strong>Plan</strong> Phase 1 <strong>Martis</strong> <strong>Valley</strong> Ground-<strong>Water</strong> Basin<br />
No. 6-67 Nevada and <strong>Placer</strong> counties, California. Prepared for Truckee Donner Public Utility<br />
District January 31, 1995.<br />
Interflow Hydrology, Inc. and Cordilleran Hydrology, Inc., 2003. Measurement of Ground <strong>Water</strong><br />
Discharge to Streams Tributary to the Truckee River in <strong>Martis</strong> <strong>Valley</strong>, <strong>Placer</strong> and Nevada<br />
Counties, California. IFH Report 2003-02, April 2003.<br />
Kennedy/Jenks Consultants, 2002. Independent Appraisal of <strong>Martis</strong> <strong>Valley</strong> Ground <strong>Water</strong> Availability<br />
Nevada and <strong>Placer</strong> Counties, California, December 2002.<br />
Leake, S.A. and J. Haney, 2010. Possible effects of groundwater pumping on surface water in the Verde<br />
<strong>Valley</strong>, Arizona, U.S. Geological Survey Fact Sheet 2010-3108.<br />
Leavesley, G.H., R.W. Lichty, B.M. Troutman, and L.G. Saindon, 1983. Precipitation-runoff modeling<br />
system—user’s manual. U.S. Geological Survey <strong>Water</strong>-Resources Investigations Report 83-4238,<br />
207 p., accessed Aug 2012, at http://pubs.er.usgs.gov/usgspubs/wri/wri834238.<br />
Lichty, R. W. and P.W. McKinley, 1995. Estimates of ground water recharge rates for two small basins in<br />
central Nevada. U.S. Geological Survey <strong>Water</strong> Resources Investigations Report 94-4104<br />
Maxey, G.B., and T.E. Eakin, 1949. Ground water in White River <strong>Valley</strong>, White Pine, Nye, and Lincoln<br />
counties, Nevada. State of Nevada, Office of the State Engineer, <strong>Water</strong> Resources Bulletin 8.<br />
Nimbus Engineers, 2001. Ground <strong>Water</strong> Availability in the <strong>Martis</strong> <strong>Valley</strong> Ground <strong>Water</strong> Basin. Nimbus<br />
Job No. 0043.<br />
Singleton, M.J. and J.E. Moran, 2010. Dissolved noble gas and isotopic tracers reveal vulnerability of<br />
groundwater in a small, high-elevation catchment to predicted climate changes. <strong>Water</strong> Resources<br />
Research, 46, W00F06, doi:10.1029/2009WR008718.<br />
Vaccaro, J.J. and T.D. Olsen, 2007. Estimates of ground-water recharge to the Yakima River Basin<br />
aquifer system, Washington, for predevelopment and current land-use and land-cover conditions.<br />
U.S. Geological Survey Scientific Investigations Report 2007-5007, 30 p.<br />
Page 11 of 11