SLAC-PUB-1706 - SLAC - Stanford University
SLAC-PUB-1706 - SLAC - Stanford University
SLAC-PUB-1706 - SLAC - Stanford University

You also want an ePaper? Increase the reach of your titles
YUMPU automatically turns print PDFs into web optimized ePapers that Google loves.
.-<br />
- 13 -<br />
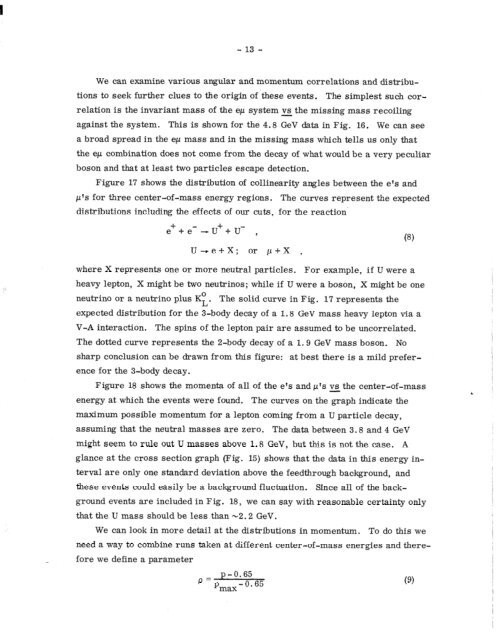
We can examine various angular and momentum correlations and distribu-<br />
tions to seek further clues to the origin of these events. The simplest such cor-<br />
relation is the invariant mass of the ep system vs the missing mass recoiling<br />
-<br />
against the system. This is shown for the 4.8 GeV data in Fig. 16. We can see<br />
a broad spread in the ep mass and in the missing mass which tells us only that<br />
the ep combination does not come from the decay of what would be a very peculiar<br />
boson and that at least two particles escape detection.<br />
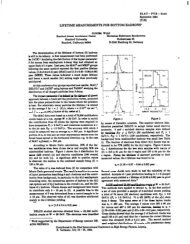
Figure 17 shows the distribution of collinearity angles between the e’s and<br />
p”‘s for three center-of-mass energy regions. The curves represent the expected<br />
distributions including the effects of our cuts, for the reaction-<br />
e+ + e- -u++ u- ,<br />
U-e+X; or p+X ,<br />
where X represents one or more neutral particles. For example, if U were a<br />
heavy lepton, X might be two neutrinos; while if U were a boson, X might be one<br />
neutrino or a neutrino plus KL. The solid curve in Fig. 17 represents the<br />
expected distribution for the 3-body decay of a 1.8 GeV mass heavy lepton via a<br />
V-A interaction. The spins of the lepton pair are assumed to be uncorrelated.<br />
The dotted curve represents the 2-body decay of a 1.9 GeV mass boson. No<br />
sharp conclusion can be drawn from this figure: -at best there is a mild prefer-<br />
ence for the 3-body decay.<br />
Figure 18 shows the momenta of all of the e’s and p’s vs the center-of-mass<br />
-<br />
energy at which the events were found. The curves on the graph indicate the<br />
maximum possible momentum for a lepton coming from a U particle decay,<br />
assuming that the neutral masses are zero. The data between 3.8 and 4 GeV<br />
might seem to rule out U masses above 1.8 GeV, but this is not the case. A<br />
glance at the cross section graph (Fig. 15) shows that the data in this energy in-<br />
terval are only one standard deviation above the feedthrough background, and<br />
these events could easily be a background fluctuation. Since all of the back-<br />
ground events are included in Fig. 18, we can say with reasonable certainty only<br />
that the U mass should be less than -2.2 GeV.<br />
We can look in more detail at the distributions in momentum. To do this we<br />
need a way to combine runs taken at different center-of-mass energies and there-<br />
fore we define a parameter<br />
P=<br />
p-O.65<br />
P max-0.65<br />
(8)<br />
(9)