SLAC-PUB-1706 - SLAC - Stanford University
SLAC-PUB-1706 - SLAC - Stanford University
SLAC-PUB-1706 - SLAC - Stanford University

Create successful ePaper yourself
Turn your PDF publications into a flip-book with our unique Google optimized e-Paper software.
-7-<br />
an e+e- pair is detected coming from the conversion of one of the two -y-rays in<br />
the beam pipe or the first trigger counters. This gives a very good energy reso-<br />
lution and hence a more accurate mass of the intermediate state. The statistical<br />
accuracy is low, however. In the third method, no y-ray is detected. The mis-<br />
sing mass distribution recoiling against the dimuon system is measured and cor-<br />
rected for processes such as those in Eq. (3b) and (3~). This method gives the<br />
best branching fraction.<br />
In the first method, the y-rays are detected by the shower counters that lie<br />
in a circle of -1.8-meter radius just outside the aluminum coil of the magnet.<br />
The y-ray position in the counter is determined to an accuracy of 20 cm (cr)<br />
from the relative pulse heights measured at each end of the counter and the known<br />
optical attenuation length along the counter. From the measurement of the p mo-<br />
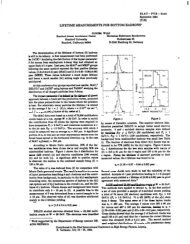
mentum and the y-ray directions, a 2C fit can be made. Figure 10 shows the<br />
resulting mass distributions of the ~lr/ system. Two solutions exist for each<br />
event, for one does not know a priori which y-ray comes from the decay of the<br />
intermediate state. The two peaks in the graph come from this ambiguity and do<br />
not indicate the existence of two states. The solid curve shows the distribution<br />
expected from a single narrow state with a mass of roughly 3.5 or 3.27 GeV.<br />
The dotted curve shows the expected contribution from the 27r” decay mode of the<br />
z,9’ to the Z/J where only two of the four y-rays from T’ decay are detected. The<br />
dashed curve shows the expected mass distribution if two photons are emitted by<br />
the z$’ distributed according to invariant phase space with no narrow state present.<br />
Figure 10 demonstrates the existence of at least one state with a mass of<br />
3.5 or 3.27 GeV. The width is consistent with the resolution, which for this<br />
method is about 80 MeV full-width half-maximum (FWHM). If a state exists at<br />
3.4 GeV, it does not show up strongly in this decay mode.<br />
Figure 11 shows the y$ mass when one of the two y-rays converts in the beam<br />
pipe or first counter. The resolution is much improved (30 MeV FWHM). The<br />
events cluster around a mass of 3.5 or 3.28 GeV.<br />
Figure 12 shows the missing mass spectrum recoiling against the z/ (unshaded).<br />
The shaded region shows the distribution after subtracting half of the acceptance-<br />
corrected mass distribution from the reaction (3a). This removes the ?r” contri-<br />
bution to the spectrum from (3b) for the $’ has I spin= 0. This can be done accur-<br />
ately for the dimuon acceptance of the reactions (3a) and (3b) are identical. The<br />
dashed line in the figure shows the contribution of the direct radiative p-pair