SLAC-PUB-1706 - SLAC - Stanford University
SLAC-PUB-1706 - SLAC - Stanford University
SLAC-PUB-1706 - SLAC - Stanford University

You also want an ePaper? Increase the reach of your titles
YUMPU automatically turns print PDFs into web optimized ePapers that Google loves.
-3-<br />
to zero. Any particle coupled to the photon with these quantum numbers can be<br />
observed as an enhancement in the total annihilation cross section when the en-<br />
ergy in the e+e- system equals the mass of the state. The state is detected, of<br />
course, by observing its decay products.<br />
Figure 3 shows the total observed hadron prodnction cross section as a<br />
function of energy. The only features that stand out when the data are plotted on<br />
this scale are enormous peaks at the mass of the q(3.1) $(3.1) E $ and $(3.7)<br />
G(3.7) = $1 which were discovered last November. The peak cross section<br />
observed is not the true peak cross section for the 9 and $* have widths much<br />
narrower than the energy spread of the e’e- system:<br />
Equation (1) gives the rough relation between the observed and true peak heights<br />
for a resonance with a width lYR which is much narrower than the energy spread<br />
aEy in the beams. For the + , for example, lYR is about 70 keV while my is<br />
about 2 MeV.<br />
We have now completed a search for other narrow resonances over almost<br />
all of the mass region accessible to SPEAR.5 The technique used is to slowly<br />
sweep the energy of the ring and look for enhancements in the yield of hadrons.<br />
In practice, the ring energy is held constant for a minute or two while data are<br />
taken. The e+ and e- beam energies are then increased by about 1 MeV each,<br />
and data are taken again for one-two minutes, etc. The data are analyzed by the<br />
<strong>SLAC</strong> 370/168 computer system in real time and the cross section for one step<br />
is sent back to us while the machine is being changed to the next step. This<br />
technique is most sensitive to narrow resonances.<br />
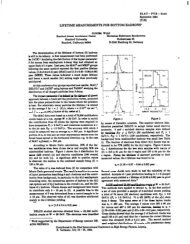
Figure 4 shows the result of the scan from the $ mass to 7.7 GeV. The only<br />
statistically significant structure seen is the 9’ at 3.7 GeV (this technique was<br />
used to find the $‘). The sensitivity of the scan depends on the width of a reso-<br />
nance and on its mass for the energy spread in the electron-positron system<br />
depends on the beam energy. The limit on the area of a resonance less than about<br />
10 MeV wide (90% confidence) is given as a function of the resonance mass in<br />
Table I. (For comparison, the area under the $ is about lo4 nb-MeV). These<br />
limits increase as the width increases above 10 MeV and other techniques are<br />
better used to search for states wider than about 20-30 MeV. As we shall see,<br />
states of width 30-60 MeV exist with areas less than the limits of Table I, and<br />
this search will therefore have to be redone with increased sensitivity.