Fabrics of pre- and syntectonic granite plutons and ... - CPRM
Fabrics of pre- and syntectonic granite plutons and ... - CPRM
Fabrics of pre- and syntectonic granite plutons and ... - CPRM

Create successful ePaper yourself
Turn your PDF publications into a flip-book with our unique Google optimized e-Paper software.
Table 2 (continued)<br />
Site Km (mSI) P T Kl K3<br />
136 0.137 1.069 0.64 340,8 (18.8) 239,50 (13.4)<br />
Cacimbas<br />
91 13.765 1.151 0.57 258,12 (4.5) 002,50 (5.4)<br />
92 4.063 1.071 0.17 104,14 (2.6) 000,44 (9.6)<br />
93 13.443 1.310 0.03 078,14 (4.2) 335,42 (2.1)<br />
94 0.336 1.086 0.09 255,5 (9.0) 350,51 (12.0)<br />
95 8.027 1.121 0.17 091,8 (3.8) 357,23 (4.8)<br />
96 9.704 1.692 0.03 078,8 (6.0) 343,30 (8.0)<br />
106 6.685 1.056 0.13 074,1 (17.9) 164,22 (28.6)<br />
107 16.465 1.138 0.06 283,15 (11.4) 178,45 (4.0)<br />
108 2.125 1.306 0.03 260,15 (6.1) 160,34 (5.0)<br />
109 4.227 1.099 0.54 086,23 (3.4) 343,29 (6.0)<br />
110 0.893 1.040 0.18 090,41 (32.6) 203,18 (31.8)<br />
111 8.655 1.076 0.33 288,2 (11.2) 018,4 (26.8)<br />
112 0.140 1.068 0.47 095,12 (7.3) 185,1 (14.6)<br />
113 6.041 1.083 0.04 096,16 (3.6) 258,73 (7.7)<br />
122 0.498 1.027 0.03 113,11 (16.4) 012,47 (20.1)<br />
123 0.708 1.058 0.08 065,38 (22.0) 334,3 (21.8)<br />
124 0.102 1.060 0.46 069,4 (19.4) 336,28 (12.9)<br />
Km, mean-site susceptibility (10 1 SI); P, degree <strong>of</strong> anisotropy; T, shape parameter; K1 <strong>and</strong> K3, respectively, mean-site maximum <strong>and</strong> minimum susceptibility<br />
directions (azimuth <strong>and</strong> dip). In parentheses the angular dispersion (1.5-sigma) about the AMS principal directions is given.<br />
such as isolated pixels or one-pixel-thick lines <strong>and</strong> shapes <strong>of</strong><br />
B > C) <strong>of</strong> 64 ellipsoids calculated<br />
after dividing each ‘‘full’’ image in four sub-images<br />
frequency<br />
30<br />
20<br />
10<br />
0<br />
0.1<br />
0.3<br />
0.25<br />
0.5<br />
0.5<br />
> 1<br />
70<br />
50<br />
30<br />
10<br />
0.1<br />
1.0<br />
0.25<br />
0.5<br />
1.0 2.5<br />
Tendó<br />
C.J. Archanjo et al. / Journal <strong>of</strong> Structural Geology 30 (2008) 310e326<br />
0.3<br />
0.5<br />
1.0<br />
0.5<br />
> 1<br />
1.0<br />
0.5<br />
60<br />
40<br />
20<br />
0.25 0.25<br />
0.1<br />
1.0<br />
0.3<br />
0.5<br />
5.0<br />
2.5<br />
0.5<br />
> 1<br />
(Fig. 11). Solid symbols are for the ‘‘bulk’’ ellipsoid found<br />
by combining SPO parameters <strong>of</strong> each full image (single set,<br />
combination 3 1 ). If the tensor principal directions <strong>of</strong> the<br />
‘‘bulk’’ ellipsoid fall inside the 1.5s cone interval, the counting<br />
window data are considered enough <strong>and</strong> the fitted ellipsoid<br />
has high bulk compatibility. Moreover, a ‘‘compatibility<br />
index’’ between the sought ellipsoid <strong>and</strong> the respective<br />
sectional ellipses is given by the OF parameter. The ellipsoid<br />
fit is considered well defined for OF ¼ 0% <strong>and</strong> poorly defined<br />
when OF > 10% (Robin, 2002; Launeau <strong>and</strong> Robin, 2005).<br />
3.4.1. Results<br />
The SPO parameters <strong>of</strong> the 3-D distribution <strong>of</strong> the mafic<br />
phase for the Jabre <strong>and</strong> Teixeira cross-sections are summarized<br />
1.0<br />
0.25<br />
1.0<br />
0.5<br />
5.0<br />
0.1<br />
5.0<br />
7.5<br />
1.0<br />
0.3<br />
7.5<br />
2.5<br />
0.5<br />
> 1<br />
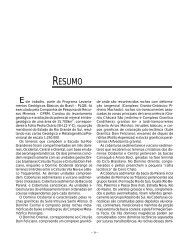
shear zone<br />
5.0<br />
5.0 10 km<br />
Fig. 9. Magnetic susceptibility <strong>of</strong> the Teixeira batholith. The frequency histograms correspond to the different domains <strong>of</strong> the batholith (see text).<br />
frequency<br />
60<br />
40<br />
20<br />
0<br />
35<br />
25<br />
15<br />
5<br />
0.1<br />
0.3<br />
0.5<br />
> 1<br />
321