Fabrics of pre- and syntectonic granite plutons and ... - CPRM
Fabrics of pre- and syntectonic granite plutons and ... - CPRM
Fabrics of pre- and syntectonic granite plutons and ... - CPRM

Create successful ePaper yourself
Turn your PDF publications into a flip-book with our unique Google optimized e-Paper software.
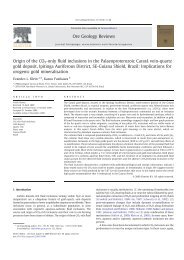
Fig. 7. Wetheril U/Pb concordia diagram for a hornblende leuco<strong>granite</strong> from<br />
the Teixeira batholith (A) <strong>and</strong> for a porphyritic syeno<strong>granite</strong> from the Serra<br />
Redonda pluton (B; see localization on Figs. 3 <strong>and</strong> 5). The discordant data re<strong>pre</strong>sented<br />
by unshaded ellipses were not included in the concordia age calculations.<br />
For the diagrams, the data-point error ellipses are plotted with 1s errors.<br />
cluster near the Concordia curve, with just one older, probably<br />
inherited grain (spot #4), with a relatively high 206 *Pb/ 238 Pb<br />
ratio. A weighted 206 */Pb/ 238 Pb mean date for fifteen zircons,<br />
after excluding three discordant analyses (spots #4, #17, #18),<br />
yielded an age <strong>of</strong> 575.4 2.1 Ma (MSWD ¼ 1.45; probability<br />
¼ 0.12). This age is indistinguishable from the Concordia<br />
age <strong>of</strong> 576 3.1 Ma calculated without spots #4 <strong>and</strong> #18<br />
(Fig. 7).<br />
3. Anisotropy <strong>of</strong> magnetic susceptibility <strong>of</strong> the<br />
Teixeira batholith<br />
3.1. Sampling <strong>and</strong> AMS determination<br />
AMS was applied only in the Teixeira batholith as its massive,<br />
equigranular microstructure made it extremely difficult to<br />
C.J. Archanjo et al. / Journal <strong>of</strong> Structural Geology 30 (2008) 310e326<br />
determine its magmatic fabric using st<strong>and</strong>ard field measurements.<br />
The technique consists <strong>of</strong> measuring the magnetic<br />
susceptibility (k) <strong>of</strong> a rock in different directions <strong>and</strong> defining<br />
the magnitude (intensity <strong>and</strong> orientation) <strong>of</strong> the three principal<br />
axes k1 k2 k3. We measured the AMS <strong>of</strong> 554 specimens<br />
from 129 sites from the M~ae D’Agua pluton to the Itapetim<br />
shear zone (Fig. 8). Some regions to the west <strong>and</strong> south <strong>of</strong><br />
M~ae D’Agua were not sampled due to problems with access.<br />
In M~ae D’Agua, Jabre <strong>and</strong> Teixeira, we studied 49 (12 sites),<br />
108 (33 sites) <strong>and</strong> 172 (36 sites) specimens, respectively. In<br />
the S~ao Sebasti~ao domain, which includes the aegirine-augite<br />
quartz syenite, we studied a total <strong>of</strong> 225 specimens (48 sites)<br />
<strong>of</strong> which 55 (14 sites) were <strong>of</strong> the quartz syenite. Included in<br />
the S~ao Sebasti~ao domain are 24 specimens (6 sites) just to the<br />
east <strong>of</strong> the Itapetim shear zone. At each site, we extracted two<br />
or three cylindrical cores nearly 7 cm <strong>of</strong> length <strong>and</strong> 2.5 cm <strong>of</strong><br />
diameter with a portable gasoline-powered rock drill. The<br />
cores were oriented in place with a magnetic compass. In<br />
the laboratory, each cylindrical core was cut to produce two<br />
2.2-cm-long specimens, so the AMS parameters (tensor magnitudes<br />
<strong>and</strong> directions) <strong>of</strong> each site are characterized by four to<br />
five specimens. Low-field AMS was measured in a KLY-2<br />
Kappabridge device (AGICO) in the Laboratório de Propriedades<br />
Físicas de Materiais Geológicos (Natal, UFRN).<br />
Specimen susceptibility <strong>and</strong> its normalized tensor principal<br />
directions were calculated using the Jelinek (1981) protocol.<br />
Table 2 shows the average-site AMS parameters<br />
(K1 K2 K3) <strong>of</strong> the batholith (small caps symbols designate<br />
AMS specimen parameters). The symmetry <strong>of</strong> the magnetic<br />
fabric is re<strong>pre</strong>sented by the T factor ex<strong>pre</strong>ssed by<br />
T ¼ [2(lnK2 lnK3)/(lnK1 lnK3] 1. T ¼ 1 are for<br />
prolate ellipsoids (K1 > K2 ¼ K3) <strong>and</strong> T ¼ 1 are for oblate<br />
ellipsoids (K 1 ¼ K 2 > K 3). Neutral or triaxial ellipsoids have<br />
T ¼ 0(K 1 > K 2 > K 3). The degree <strong>of</strong> anisotropy is indicated<br />
by P ¼ K 1/K 3, which ranges from one (isotropic) to higher<br />
values.<br />
3.2. Low-field magnetic susceptibility data<br />
The magnetic susceptibility (k) <strong>of</strong> the porphyritic <strong>granite</strong> <strong>of</strong><br />
M~ae D’Agua (0.11 mSI, st.dev., 0.02) <strong>and</strong> the aegirine-augite<br />
quartz syenite (6.22, st.dev, 5.92) shows a dominant unimodal<br />
distribution, while the Jabre, Teixeira <strong>and</strong> S~ao Sebasti~ao<br />
domains have a bimodal distribution (Fig. 9). The contrasting<br />
values <strong>of</strong> k in the porphyritic <strong>and</strong> aegirine-augite quartz syenite<br />
are typical <strong>of</strong> the paramagnetic <strong>and</strong> ferromagnetic <strong>granite</strong><br />
series, respectively (Ishihara, 1977). The dominant ferromagnetic<br />
mineral in <strong>granite</strong>s is usually magnetite, while in the<br />
paramagnetic <strong>granite</strong>s most <strong>of</strong> the susceptibility contribution<br />
comes from Fe/Mg silicates. This agrees with the rock content<br />
<strong>of</strong> opaque grains in the Teixeira batholith, absent in thin<br />
sections <strong>of</strong> the M~ae D’Agua porphyritic <strong>granite</strong> <strong>and</strong> common<br />
in the aegirine-augite quartz syenite. k shows a bimodal<br />
distribution in the equigranular <strong>granite</strong>s <strong>of</strong> Jabre, Teixeira<br />
<strong>and</strong> S~ao Sebasti~ao, peaking between 0.10 <strong>and</strong> 0.30 mSI <strong>and</strong><br />
between >1 <strong>and</strong> 10 mSI. The highest k values occur when<br />
opaque grains are visible in thin section. In addition, there is<br />
317