Adoption and intensity of adoption of conservation farming practices in Zambia
Adoption and intensity of adoption of conservation farming practices in Zambia
Adoption and intensity of adoption of conservation farming practices in Zambia

Create successful ePaper yourself
Turn your PDF publications into a flip-book with our unique Google optimized e-Paper software.
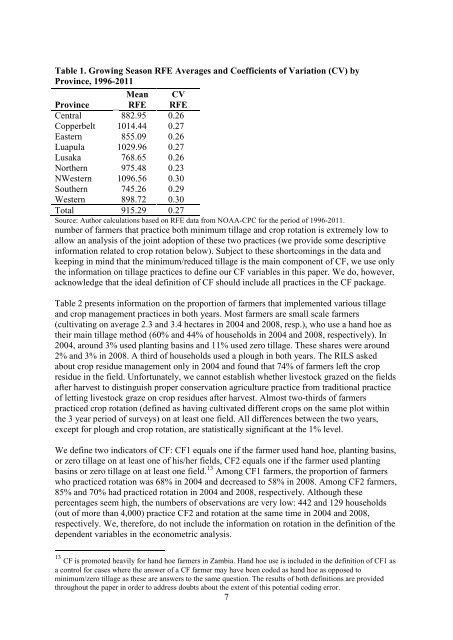
Table 1. Grow<strong>in</strong>g Season RFE Averages <strong>and</strong> Coefficients <strong>of</strong> Variation (CV) by<br />
Prov<strong>in</strong>ce, 1996-2011<br />
Mean CV<br />
Prov<strong>in</strong>ce RFE RFE<br />
Central 882.95 0.26<br />
Copperbelt 1014.44 0.27<br />
Eastern 855.09 0.26<br />
Luapula 1029.96 0.27<br />
Lusaka 768.65 0.26<br />
Northern 975.48 0.23<br />
NWestern 1096.56 0.30<br />
Southern 745.26 0.29<br />
Western 898.72 0.30<br />
Total 915.29 0.27<br />
Source: Author calculations based on RFE data from NOAA-CPC for the period <strong>of</strong> 1996-2011.<br />
number <strong>of</strong> farmers that practice both m<strong>in</strong>imum tillage <strong>and</strong> crop rotation is extremely low to<br />
allow an analysis <strong>of</strong> the jo<strong>in</strong>t <strong>adoption</strong> <strong>of</strong> these two <strong>practices</strong> (we provide some descriptive<br />
<strong>in</strong>formation related to crop rotation below). Subject to these shortcom<strong>in</strong>gs <strong>in</strong> the data <strong>and</strong><br />
keep<strong>in</strong>g <strong>in</strong> m<strong>in</strong>d that the m<strong>in</strong>imum/reduced tillage is the ma<strong>in</strong> component <strong>of</strong> CF, we use only<br />
the <strong>in</strong>formation on tillage <strong>practices</strong> to def<strong>in</strong>e our CF variables <strong>in</strong> this paper. We do, however,<br />
acknowledge that the ideal def<strong>in</strong>ition <strong>of</strong> CF should <strong>in</strong>clude all <strong>practices</strong> <strong>in</strong> the CF package.<br />
Table 2 presents <strong>in</strong>formation on the proportion <strong>of</strong> farmers that implemented various tillage<br />
<strong>and</strong> crop management <strong>practices</strong> <strong>in</strong> both years. Most farmers are small scale farmers<br />
(cultivat<strong>in</strong>g on average 2.3 <strong>and</strong> 3.4 hectares <strong>in</strong> 2004 <strong>and</strong> 2008, resp.), who use a h<strong>and</strong> hoe as<br />
their ma<strong>in</strong> tillage method (60% <strong>and</strong> 44% <strong>of</strong> households <strong>in</strong> 2004 <strong>and</strong> 2008, respectively). In<br />
2004, around 3% used plant<strong>in</strong>g bas<strong>in</strong>s <strong>and</strong> 11% used zero tillage. These shares were around<br />
2% <strong>and</strong> 3% <strong>in</strong> 2008. A third <strong>of</strong> households used a plough <strong>in</strong> both years. The RILS asked<br />
about crop residue management only <strong>in</strong> 2004 <strong>and</strong> found that 74% <strong>of</strong> farmers left the crop<br />
residue <strong>in</strong> the field. Unfortunately, we cannot establish whether livestock grazed on the fields<br />
after harvest to dist<strong>in</strong>guish proper <strong>conservation</strong> agriculture practice from traditional practice<br />
<strong>of</strong> lett<strong>in</strong>g livestock graze on crop residues after harvest. Almost two-thirds <strong>of</strong> farmers<br />
practiced crop rotation (def<strong>in</strong>ed as hav<strong>in</strong>g cultivated different crops on the same plot with<strong>in</strong><br />
the 3 year period <strong>of</strong> surveys) on at least one field. All differences between the two years,<br />
except for plough <strong>and</strong> crop rotation, are statistically significant at the 1% level.<br />
We def<strong>in</strong>e two <strong>in</strong>dicators <strong>of</strong> CF: CF1 equals one if the farmer used h<strong>and</strong> hoe, plant<strong>in</strong>g bas<strong>in</strong>s,<br />
or zero tillage on at least one <strong>of</strong> his/her fields, CF2 equals one if the farmer used plant<strong>in</strong>g<br />
bas<strong>in</strong>s or zero tillage on at least one field. 13 Among CF1 farmers, the proportion <strong>of</strong> farmers<br />
who practiced rotation was 68% <strong>in</strong> 2004 <strong>and</strong> decreased to 58% <strong>in</strong> 2008. Among CF2 farmers,<br />
85% <strong>and</strong> 70% had practiced rotation <strong>in</strong> 2004 <strong>and</strong> 2008, respectively. Although these<br />
percentages seem high, the numbers <strong>of</strong> observations are very low: 442 <strong>and</strong> 129 households<br />
(out <strong>of</strong> more than 4,000) practice CF2 <strong>and</strong> rotation at the same time <strong>in</strong> 2004 <strong>and</strong> 2008,<br />
respectively. We, therefore, do not <strong>in</strong>clude the <strong>in</strong>formation on rotation <strong>in</strong> the def<strong>in</strong>ition <strong>of</strong> the<br />
dependent variables <strong>in</strong> the econometric analysis.<br />
13<br />
CF is promoted heavily for h<strong>and</strong> hoe farmers <strong>in</strong> <strong>Zambia</strong>. H<strong>and</strong> hoe use is <strong>in</strong>cluded <strong>in</strong> the def<strong>in</strong>ition <strong>of</strong> CF1 as<br />
a control for cases where the answer <strong>of</strong> a CF farmer may have been coded as h<strong>and</strong> hoe as opposed to<br />
m<strong>in</strong>imum/zero tillage as these are answers to the same question. The results <strong>of</strong> both def<strong>in</strong>itions are provided<br />
throughout the paper <strong>in</strong> order to address doubts about the extent <strong>of</strong> this potential cod<strong>in</strong>g error.<br />
7