Adoption and intensity of adoption of conservation farming practices in Zambia
Adoption and intensity of adoption of conservation farming practices in Zambia
Adoption and intensity of adoption of conservation farming practices in Zambia

You also want an ePaper? Increase the reach of your titles
YUMPU automatically turns print PDFs into web optimized ePapers that Google loves.
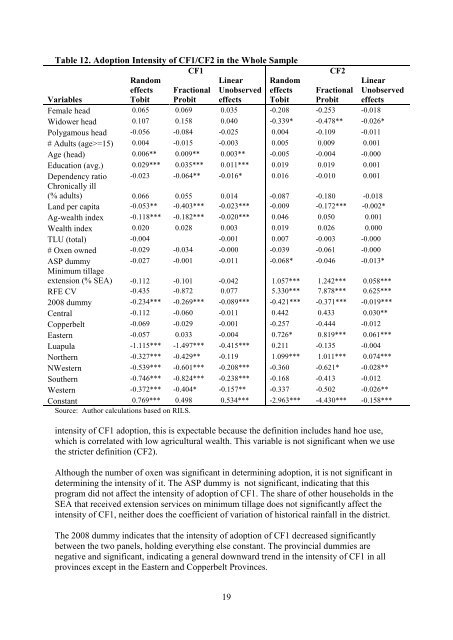
Table 12. <strong>Adoption</strong> Intensity <strong>of</strong> CF1/CF2 <strong>in</strong> the Whole Sample<br />
CF1 CF2<br />
R<strong>and</strong>om<br />
L<strong>in</strong>ear R<strong>and</strong>om<br />
L<strong>in</strong>ear<br />
effects Fractional Unobserved effects Fractional Unobserved<br />
Variables<br />
Tobit Probit effects Tobit Probit effects<br />
Female head 0.065 0.069 0.035 -0.208 -0.253 -0.018<br />
Widower head 0.107 0.158 0.040 -0.339* -0.478** -0.026*<br />
Polygamous head -0.056 -0.084 -0.025 0.004 -0.109 -0.011<br />
# Adults (age>=15) 0.004 -0.015 -0.003 0.005 0.009 0.001<br />
Age (head) 0.006** 0.009** 0.003** -0.005 -0.004 -0.000<br />
Education (avg.) 0.029*** 0.035*** 0.011*** 0.019 0.019 0.001<br />
Dependency ratio<br />
Chronically ill<br />
-0.023 -0.064** -0.016* 0.016 -0.010 0.001<br />
(% adults) 0.066 0.055 0.014 -0.087 -0.180 -0.018<br />
L<strong>and</strong> per capita -0.053** -0.403*** -0.023*** -0.009 -0.172*** -0.002*<br />
Ag-wealth <strong>in</strong>dex -0.118*** -0.182*** -0.020*** 0.046 0.050 0.001<br />
Wealth <strong>in</strong>dex 0.020 0.028 0.003 0.019 0.026 0.000<br />
TLU (total)<br />
-0.004<br />
-0.001 0.007 -0.003 -0.000<br />
# Oxen owned -0.029 -0.034 -0.000 -0.039 -0.061 -0.000<br />
ASP dummy<br />
M<strong>in</strong>imum tillage<br />
-0.027 -0.001 -0.011 -0.068* -0.046 -0.013*<br />
extension (% SEA) -0.112 -0.101 -0.042 1.057*** 1.242*** 0.058***<br />
RFE CV -0.435 -0.872 0.077 5.330*** 7.878*** 0.625***<br />
2008 dummy -0.234*** -0.269*** -0.089*** -0.421*** -0.371*** -0.019***<br />
Central -0.112 -0.060 -0.011 0.442 0.433 0.030**<br />
Copperbelt -0.069 -0.029 -0.001 -0.257 -0.444 -0.012<br />
Eastern -0.057 0.033 -0.004 0.726* 0.819*** 0.061***<br />
Luapula -1.115*** -1.497*** -0.415*** 0.211 -0.135 -0.004<br />
Northern -0.327*** -0.429** -0.119 1.099*** 1.011*** 0.074***<br />
NWestern -0.539*** -0.601*** -0.208*** -0.360 -0.621* -0.028**<br />
Southern -0.746*** -0.824*** -0.238*** -0.168 -0.413 -0.012<br />
Western -0.372*** -0.404* -0.157** -0.337 -0.502 -0.026**<br />
Constant 0.769*** 0.498 0.534*** -2.963*** -4.430*** -0.158***<br />
Source: Author calculations based on RILS.<br />
<strong><strong>in</strong>tensity</strong> <strong>of</strong> CF1 <strong>adoption</strong>, this is expectable because the def<strong>in</strong>ition <strong>in</strong>cludes h<strong>and</strong> hoe use,<br />
which is correlated with low agricultural wealth. This variable is not significant when we use<br />
the stricter def<strong>in</strong>ition (CF2).<br />
Although the number <strong>of</strong> oxen was significant <strong>in</strong> determ<strong>in</strong><strong>in</strong>g <strong>adoption</strong>, it is not significant <strong>in</strong><br />
determ<strong>in</strong><strong>in</strong>g the <strong><strong>in</strong>tensity</strong> <strong>of</strong> it. The ASP dummy is not significant, <strong>in</strong>dicat<strong>in</strong>g that this<br />
program did not affect the <strong><strong>in</strong>tensity</strong> <strong>of</strong> <strong>adoption</strong> <strong>of</strong> CF1. The share <strong>of</strong> other households <strong>in</strong> the<br />
SEA that received extension services on m<strong>in</strong>imum tillage does not significantly affect the<br />
<strong><strong>in</strong>tensity</strong> <strong>of</strong> CF1, neither does the coefficient <strong>of</strong> variation <strong>of</strong> historical ra<strong>in</strong>fall <strong>in</strong> the district.<br />
The 2008 dummy <strong>in</strong>dicates that the <strong><strong>in</strong>tensity</strong> <strong>of</strong> <strong>adoption</strong> <strong>of</strong> CF1 decreased significantly<br />
between the two panels, hold<strong>in</strong>g everyth<strong>in</strong>g else constant. The prov<strong>in</strong>cial dummies are<br />
negative <strong>and</strong> significant, <strong>in</strong>dicat<strong>in</strong>g a general downward trend <strong>in</strong> the <strong><strong>in</strong>tensity</strong> <strong>of</strong> CF1 <strong>in</strong> all<br />
prov<strong>in</strong>ces except <strong>in</strong> the Eastern <strong>and</strong> Copperbelt Prov<strong>in</strong>ces.<br />
19