Adoption and intensity of adoption of conservation farming practices in Zambia
Adoption and intensity of adoption of conservation farming practices in Zambia
Adoption and intensity of adoption of conservation farming practices in Zambia

Create successful ePaper yourself
Turn your PDF publications into a flip-book with our unique Google optimized e-Paper software.
<strong>Adoption</strong> <strong>and</strong> <strong><strong>in</strong>tensity</strong><br />
<strong>of</strong> <strong>adoption</strong> <strong>of</strong><br />
<strong>conservation</strong> <strong>farm<strong>in</strong>g</strong><br />
<strong>practices</strong> <strong>in</strong> <strong>Zambia</strong><br />
Aslihan Arslan, Nancy McCarthy, Leslie Lipper,<br />
Solomon Asfaw <strong>and</strong> Andrea Cattaneo<br />
ESA Work<strong>in</strong>g paper No. 13-01<br />
April 2013<br />
Agricultural Development Economics Division<br />
Food <strong>and</strong> Agriculture Organization <strong>of</strong> the United Nations<br />
www.fao.org/economic/esa
The designations employed <strong>and</strong> the presentation <strong>of</strong> material <strong>in</strong> this <strong>in</strong>formation product do<br />
not imply the expression <strong>of</strong> any op<strong>in</strong>ion whatsoever on the part <strong>of</strong> the Food <strong>and</strong> Agriculture<br />
Organization <strong>of</strong> the United Nations (FAO) concern<strong>in</strong>g the legal or development status <strong>of</strong> any<br />
country, territory, city or area or <strong>of</strong> its authorities, or concern<strong>in</strong>g the delimitation <strong>of</strong> its<br />
frontiers or boundaries. The mention <strong>of</strong> specific companies or products <strong>of</strong> manufacturers,<br />
whether or not these have been patented, does not imply that these have been endorsed or<br />
recommended by FAO <strong>in</strong> preference to others <strong>of</strong> a similar nature that are not mentioned. The<br />
views expressed <strong>in</strong> this <strong>in</strong>formation product are those <strong>of</strong> the author(s) <strong>and</strong> do not necessarily<br />
reflect the views or policies <strong>of</strong> FAO.<br />
© FAO 2013<br />
FAO encourages the use, reproduction <strong>and</strong> dissem<strong>in</strong>ation <strong>of</strong> material <strong>in</strong> this <strong>in</strong>formation<br />
product. Except where otherwise <strong>in</strong>dicated, material may be copied, downloaded <strong>and</strong> pr<strong>in</strong>ted<br />
for private study, research <strong>and</strong> teach<strong>in</strong>g purposes, or for use <strong>in</strong> non-commercial products or<br />
services, provided that appropriate acknowledgement <strong>of</strong> FAO as the source <strong>and</strong> copyright<br />
holder is given <strong>and</strong> that FAO’s endorsement <strong>of</strong> users’ views, products or services is not<br />
implied <strong>in</strong> any way.<br />
All requests for translation <strong>and</strong> adaptation rights, <strong>and</strong> for resale <strong>and</strong> other commercial use<br />
rights should be made via www.fao.org/contact-us/licence-request or addressed to<br />
copyright@fao.org.<br />
FAO <strong>in</strong>formation products are available on the FAO website (www.fao.org/publications) <strong>and</strong><br />
can be purchased through publications-sales@fao.org.<br />
ii
<strong>Adoption</strong> <strong>and</strong> <strong><strong>in</strong>tensity</strong> <strong>of</strong> <strong>adoption</strong> <strong>of</strong> <strong>conservation</strong> <strong>farm<strong>in</strong>g</strong><br />
<strong>practices</strong> <strong>in</strong> <strong>Zambia</strong><br />
Aslihan Arslan, Nancy McCarthy, Leslie Lipper,<br />
Solomon Asfaw <strong>and</strong> Andrea Cattaneo 1<br />
This paper analyses the determ<strong>in</strong>ants <strong>of</strong> farmer <strong>adoption</strong> <strong>of</strong> <strong>conservation</strong> <strong>farm<strong>in</strong>g</strong> <strong>practices</strong><br />
us<strong>in</strong>g panel data from two rounds <strong>of</strong> the Rural Incomes <strong>and</strong> Livelihoods Surveys that were<br />
implemented <strong>in</strong> 2004 <strong>and</strong> 2008. Conservation <strong>farm<strong>in</strong>g</strong> (CF) has been actively promoted <strong>in</strong><br />
seven <strong>of</strong> <strong>Zambia</strong>’s n<strong>in</strong>e prov<strong>in</strong>ces s<strong>in</strong>ce the 1980s. CF has the technical potential to<br />
contribute to food security <strong>and</strong> adaptation to climate change; however, rigorous analyses <strong>of</strong><br />
the determ<strong>in</strong>ants <strong>of</strong> <strong>adoption</strong>/dis-<strong>adoption</strong> <strong>of</strong> these <strong>practices</strong>, are still scarce. This paper fills<br />
this gap by comb<strong>in</strong><strong>in</strong>g rich panel data with historical ra<strong>in</strong>fall data to underst<strong>and</strong> the<br />
determ<strong>in</strong>ants <strong>of</strong> <strong>adoption</strong> <strong>and</strong> <strong><strong>in</strong>tensity</strong> <strong>of</strong> two CF <strong>practices</strong>: m<strong>in</strong>imum/zero tillage <strong>and</strong><br />
plant<strong>in</strong>g bas<strong>in</strong>s. Controll<strong>in</strong>g for the confound<strong>in</strong>g effects <strong>of</strong> household level unobservables, we<br />
f<strong>in</strong>d that extension services <strong>and</strong> ra<strong>in</strong>fall variability are the strongest determ<strong>in</strong>ants <strong>of</strong> <strong>adoption</strong>,<br />
suggest<strong>in</strong>g that farmers use these <strong>practices</strong> as an adaptation strategy to mitigate the negative<br />
effects <strong>of</strong> variable ra<strong>in</strong>fall. Eastern prov<strong>in</strong>ce shows a significantly different trend <strong>in</strong> terms <strong>of</strong><br />
both <strong>adoption</strong> <strong>and</strong> the <strong><strong>in</strong>tensity</strong> <strong>of</strong> <strong>adoption</strong>, <strong>in</strong>dicat<strong>in</strong>g that the long-established CF activities<br />
<strong>in</strong> the prov<strong>in</strong>ce have had some impact – though high dis-<strong>adoption</strong> rates are observed even <strong>in</strong><br />
this prov<strong>in</strong>ce.<br />
Key words: <strong>conservation</strong> agriculture, <strong>conservation</strong> <strong>farm<strong>in</strong>g</strong>, m<strong>in</strong>imum tillage, technology<br />
<strong>adoption</strong>, adaptation, <strong>Zambia</strong><br />
JEL Codes: Q12, Q16, Q54, O33<br />
1<br />
Arslan is a natural resource economist at the Agricultural Development Economics Division<br />
<strong>of</strong> the Food <strong>and</strong> Agriculture Organization <strong>of</strong> the United Nations; McCarthy is a pr<strong>in</strong>cipal<br />
research analyst <strong>of</strong> LEAD Analytics Inc., Wash<strong>in</strong>gton D.C.; Lipper is a senior environmental<br />
economist, Solomon Asfaw is an economist, <strong>and</strong> Andrea Cattaneo is a senior economist all<br />
are at the Agricultural Development Economics Division <strong>of</strong> the Food <strong>and</strong> Agriculture<br />
Organization <strong>of</strong> the United Nations.<br />
iii
ACKNOWLEDGEMENTS<br />
This work<strong>in</strong>g paper has been published jo<strong>in</strong>tly as Indaba Agricultural Policy Research<br />
Institute (IAPRI) Work<strong>in</strong>g Paper 71. IAPRI is a non-pr<strong>of</strong>it company limited by guarantee <strong>and</strong><br />
collaboratively works with public <strong>and</strong> private stakeholders. IAPRI exists to carry out<br />
agricultural policy research <strong>and</strong> outreach, serv<strong>in</strong>g the agricultural sector <strong>in</strong> <strong>Zambia</strong> so as to<br />
contribute to susta<strong>in</strong>able pro-poor agricultural development.<br />
The authors would like to thank the staff at the Headquarters <strong>and</strong> the <strong>Zambia</strong> <strong>of</strong>fice <strong>of</strong> FAO<br />
for their comments <strong>and</strong> suggestions dur<strong>in</strong>g the preparation <strong>of</strong> this paper.<br />
We are also grateful to Patricia Johannes for her helpful formatt<strong>in</strong>g <strong>and</strong> edit<strong>in</strong>g assistance.<br />
The authors wish to acknowledge f<strong>in</strong>ancial support from the European Commission as part <strong>of</strong><br />
a project on Climate Smart Agriculture <strong>in</strong> <strong>Zambia</strong>.<br />
Any views expressed or rema<strong>in</strong><strong>in</strong>g errors are solely the responsibility <strong>of</strong> the authors.<br />
Comments <strong>and</strong> questions should be directed to:<br />
Aslihan Arslan, PhD<br />
Natural Resource Economist<br />
Agricultural Development Economics Division<br />
Food <strong>and</strong> Agriculture Organization <strong>of</strong> the UN<br />
Viale delle Terme di Caracalla<br />
Office C599b<br />
Rome, Italy 00153<br />
aslihan.arslan@fao.org<br />
Tel: +39 06 570 52196<br />
http://www.fao.org/climatechange/epic<br />
iv
EXECUTIVE SUMMARY<br />
This paper contributes to literature on agricultural technology <strong>adoption</strong> by us<strong>in</strong>g a novel data<br />
set that comb<strong>in</strong>es data from two large-scale household surveys with historical ra<strong>in</strong>fall data to<br />
underst<strong>and</strong> the determ<strong>in</strong>ants <strong>and</strong> the <strong><strong>in</strong>tensity</strong> <strong>of</strong> <strong>adoption</strong> <strong>of</strong> Conservation Farm<strong>in</strong>g (CF)<br />
<strong>practices</strong> <strong>in</strong> <strong>Zambia</strong>. Conservation agriculture (CA), def<strong>in</strong>ed as practic<strong>in</strong>g m<strong>in</strong>imum soil<br />
disturbance, cover crops <strong>and</strong> crop rotation, has the technical potential to contribute to food<br />
security <strong>and</strong> adaptation to climate change. It has been actively promoted <strong>in</strong> seven <strong>of</strong> <strong>Zambia</strong>’s<br />
n<strong>in</strong>e prov<strong>in</strong>ces s<strong>in</strong>ce the 1980s <strong>in</strong> the form <strong>of</strong> CF <strong>in</strong>clud<strong>in</strong>g plant<strong>in</strong>g bas<strong>in</strong>s <strong>and</strong> dry season<br />
l<strong>and</strong> preparation <strong>in</strong> addition to the 3 CA <strong>practices</strong>. Rigorous analyses <strong>of</strong> the determ<strong>in</strong>ants <strong>of</strong><br />
<strong>adoption</strong>/dis-<strong>adoption</strong> <strong>of</strong> these <strong>practices</strong>, however, are still scarce. This paper fills this gap<br />
us<strong>in</strong>g panel data from two rounds <strong>of</strong> the Rural Incomes <strong>and</strong> Livelihoods Surveys that were<br />
implemented <strong>in</strong> 2004 <strong>and</strong> 2008 as well as (district level) historical ra<strong>in</strong>fall estimate (RFE)<br />
data obta<strong>in</strong>ed from the National Oceanic <strong>and</strong> Atmospheric Adm<strong>in</strong>istration’s Climate<br />
Prediction Center (NOAA-CPC) for the period <strong>of</strong> 1996-2011. We specifically analyse the<br />
<strong>adoption</strong> <strong>and</strong> dis-<strong>adoption</strong> <strong>of</strong> two ma<strong>in</strong> components <strong>of</strong> CF: m<strong>in</strong>imum soil disturbance <strong>and</strong><br />
plant<strong>in</strong>g bas<strong>in</strong>s. Consider<strong>in</strong>g that the Eastern Prov<strong>in</strong>ce has historically received the bulk <strong>of</strong><br />
the CF support activities, we also do our analyses separately for this prov<strong>in</strong>ce to assess the<br />
effectiveness <strong>of</strong> these activities. We document high levels <strong>of</strong> dis-<strong>adoption</strong> (around 95%) <strong>of</strong><br />
these <strong>practices</strong> <strong>in</strong> the whole country, while dis-<strong>adoption</strong> <strong>in</strong> the Eastern prov<strong>in</strong>ce – the hub <strong>of</strong><br />
CF projects <strong>in</strong> <strong>Zambia</strong> – is significantly lower. Nationwide only 5% <strong>of</strong> the households<br />
practiced m<strong>in</strong>imum soil disturbance/plant<strong>in</strong>g bas<strong>in</strong>s <strong>in</strong> 2008, down from 13% <strong>in</strong> 2004, which<br />
raises the question <strong>of</strong> the widespread suitability <strong>of</strong> this practice. Eastern prov<strong>in</strong>ce is the only<br />
prov<strong>in</strong>ce with a significant <strong>in</strong>crease <strong>in</strong> <strong>adoption</strong> rates between the survey years: 14% <strong>in</strong> 2008,<br />
up from 8%.<br />
Our econometric analyses based on panel data methods that control for time-<strong>in</strong>variant<br />
household characteristics fail to provide evidence for the <strong>of</strong>t mentioned determ<strong>in</strong>ants <strong>of</strong><br />
<strong>adoption</strong> <strong>in</strong> the literature. We f<strong>in</strong>d no evidence for the role <strong>of</strong> labor constra<strong>in</strong>ts, age or<br />
education <strong>in</strong> <strong>adoption</strong> decisions. These results suggest that most socio-economic variables are<br />
correlated with household level un-observables (e.g. farmer ability or openness to <strong>in</strong>novation)<br />
<strong>in</strong> cross-sectional studies confound<strong>in</strong>g the effects <strong>of</strong> variables <strong>in</strong>cluded <strong>in</strong> analyses. We do,<br />
however, f<strong>in</strong>d that the <strong><strong>in</strong>tensity</strong> <strong>of</strong> <strong>adoption</strong> is negatively affected by l<strong>and</strong> per capita – another<br />
<strong>in</strong>dicator <strong>of</strong> labor constra<strong>in</strong>t.<br />
We f<strong>in</strong>d a very strong <strong>and</strong> robust relationship between the district level variation <strong>in</strong> historical<br />
ra<strong>in</strong>fall dur<strong>in</strong>g the grow<strong>in</strong>g season <strong>and</strong> <strong>adoption</strong> as well as the <strong><strong>in</strong>tensity</strong> <strong>of</strong> <strong>adoption</strong> <strong>of</strong> the CF<br />
<strong>practices</strong> <strong>in</strong> question <strong>in</strong> <strong>Zambia</strong>. This f<strong>in</strong>d<strong>in</strong>g suggests that farmers are us<strong>in</strong>g m<strong>in</strong>imum<br />
tillage/plant<strong>in</strong>g bas<strong>in</strong>s as a strategy to mitigate the risk <strong>of</strong> ra<strong>in</strong>fall variability, provid<strong>in</strong>g<br />
evidence – albeit <strong>in</strong>directly – <strong>of</strong> a synergy between these <strong>practices</strong> <strong>and</strong> adaptation to climate<br />
variability. Inasmuch as the <strong>practices</strong> analysed here are essential to the CF package, the<br />
results are <strong>in</strong>dicative for the <strong>adoption</strong> <strong>of</strong> the whole CF package as promoted. Further research<br />
is needed to directly assess whether CF decreases yield variability over time as suggested by<br />
these f<strong>in</strong>d<strong>in</strong>gs.<br />
Another robust f<strong>in</strong>d<strong>in</strong>g is that the reach <strong>of</strong> extension services <strong>in</strong> a village (i.e. the proportion<br />
<strong>of</strong> households that received <strong>in</strong>formation on m<strong>in</strong>imum tillage) positively affects both <strong>adoption</strong><br />
<strong>and</strong> the <strong><strong>in</strong>tensity</strong> <strong>of</strong> <strong>adoption</strong>. A key outst<strong>and</strong><strong>in</strong>g question however, is the degree to which<br />
extension services <strong>in</strong>cluded the provision <strong>of</strong> subsidized <strong>in</strong>puts, which is not possible to<br />
dist<strong>in</strong>guish <strong>in</strong> this dataset. Underst<strong>and</strong><strong>in</strong>g the respective importance <strong>of</strong> <strong>in</strong>formation <strong>and</strong><br />
v
subsidized <strong>in</strong>put provision is essential to design future programs for CF promotion –<br />
especially <strong>in</strong> locations with highly variable ra<strong>in</strong>fall.<br />
Eastern prov<strong>in</strong>ce demonstrates a different trend than the rest <strong>of</strong> the country <strong>in</strong> that there was<br />
an upward trend <strong>in</strong> the probability <strong>of</strong> <strong>adoption</strong> for an average household <strong>and</strong> no significant<br />
downward trend <strong>in</strong> the <strong><strong>in</strong>tensity</strong> <strong>of</strong> <strong>adoption</strong>. This suggests that the long history <strong>of</strong> CF<br />
activities <strong>in</strong> the prov<strong>in</strong>ce (comb<strong>in</strong>ed with its specific agro-ecological conditions suitable for<br />
CF) may have had an effect on <strong>adoption</strong> rates there. Given the still high dis-<strong>adoption</strong> rates <strong>in</strong><br />
this prov<strong>in</strong>ce, however, further research is needed to underst<strong>and</strong> the <strong>in</strong>stitutional sett<strong>in</strong>gs <strong>of</strong><br />
various projects <strong>and</strong> how they affect the <strong>adoption</strong> <strong>of</strong> CF <strong>practices</strong>.<br />
To summarize: CF as practiced <strong>in</strong> <strong>Zambia</strong> seems well-suited to respond to the key agroecological<br />
constra<strong>in</strong>t <strong>of</strong> highly variable ra<strong>in</strong>fall patterns. The provision <strong>of</strong> extension services<br />
is another consistent <strong>and</strong> powerful explanatory variable <strong>in</strong> determ<strong>in</strong><strong>in</strong>g <strong>adoption</strong> patterns.<br />
Better <strong>in</strong>formation on what exactly these extension services <strong>in</strong>cluded, <strong>and</strong> particularly the<br />
degree to which they <strong>in</strong>volved subsidized <strong>in</strong>puts, is needed before an assessment <strong>of</strong> the<br />
potential effectiveness <strong>and</strong> susta<strong>in</strong>ability <strong>of</strong> further extension efforts for promot<strong>in</strong>g CF can be<br />
made.<br />
vi
CONTENTS<br />
ACKNOWLEDGEMENTS ................................................................................................. IV<br />
EXECUTIVE SUMMARY .................................................................................................... V<br />
LIST OF TABLES ............................................................................................................. VIII<br />
LIST OF FIGURES ........................................................................................................... VIII<br />
ACRONYMS ......................................................................................................................... IX<br />
1. INTRODUCTION................................................................................................................ 1<br />
2. BACKGROUND .................................................................................................................. 2<br />
2.1. History <strong>of</strong> CA <strong>in</strong> the World <strong>and</strong> <strong>in</strong> <strong>Zambia</strong> ............................................................... 2<br />
2.2. <strong>Adoption</strong> <strong>of</strong> CA <strong>in</strong> the Literature ............................................................................... 3<br />
2.3. <strong>Adoption</strong> <strong>of</strong> CF <strong>in</strong> <strong>Zambia</strong> ........................................................................................... 5<br />
3. DATA AND DESCRIPTIVE STATISTICS ...................................................................... 6<br />
4. METHODOLOGY ............................................................................................................ 14<br />
4.1. <strong>Adoption</strong> <strong>of</strong> CA ........................................................................................................... 14<br />
4.2. Intensity <strong>of</strong> CA <strong>Adoption</strong> ........................................................................................... 14<br />
5. RESULTS ........................................................................................................................... 17<br />
5.1. <strong>Adoption</strong> ...................................................................................................................... 17<br />
5.2. Intensity <strong>of</strong> <strong>Adoption</strong> ................................................................................................. 18<br />
5.3. <strong>Adoption</strong> <strong>and</strong> Intensity <strong>of</strong> <strong>Adoption</strong> <strong>in</strong> the 2008 Cross-section.............................. 21<br />
6. CONCLUSIONS ................................................................................................................ 25<br />
REFERENCES ....................................................................................................................... 27<br />
vii
LIST OF TABLES<br />
PAGE<br />
1. Grow<strong>in</strong>g Season RFE Averages <strong>and</strong> Coefficients <strong>of</strong> Variation (CV) by Prov<strong>in</strong>ce,<br />
1996-2011 ...........................................................................................................................7<br />
2. Various Tillage <strong>and</strong> Crop Management Practices <strong>in</strong> RILS ................................................8<br />
3. Proportion <strong>of</strong> Farmers that Adopted <strong>and</strong> L<strong>and</strong> Cultivated with CF1/CF2 .........................9<br />
4. <strong>Adoption</strong> <strong>and</strong> Intensity <strong>of</strong> <strong>Adoption</strong> <strong>of</strong> CF1/CF2 by Prov<strong>in</strong>ce ..........................................9<br />
5. <strong>Adoption</strong> <strong>and</strong> Intensity <strong>of</strong> <strong>Adoption</strong> <strong>of</strong> CF1/CF2 by L<strong>and</strong> Size ......................................10<br />
6. National Transition Matrix, CF1 ......................................................................................11<br />
7. National Transition Matrix, CF2 ......................................................................................11<br />
8. Eastern Prov<strong>in</strong>ce Transition Matrix, CF1 .........................................................................11<br />
9. Eastern Prov<strong>in</strong>ce Transition Matrix, CF2 .........................................................................11<br />
10. Explanatory Variables by CA Status <strong>and</strong> Year ................................................................12<br />
11. Probability <strong>of</strong> <strong>Adoption</strong> <strong>of</strong> CF1/CF2 (Marg<strong>in</strong>al Effects <strong>of</strong> R<strong>and</strong>om Effects Probit<br />
Models) .............................................................................................................................17<br />
12. <strong>Adoption</strong> Intensity <strong>of</strong> CF1/CF2 <strong>in</strong> the Whole Sample .....................................................19<br />
13. <strong>Adoption</strong> Intensity CF1/CF2 <strong>in</strong> the Eastern Prov<strong>in</strong>ce ......................................................20<br />
14. Additional Household <strong>and</strong> Community Variables by CF2 Status <strong>in</strong> 2008 .......................22<br />
15. Cross-sectional Models for Probability <strong>and</strong> Intensity <strong>of</strong> CF2 <strong>Adoption</strong>, 2008 ................23<br />
FIGURE<br />
1. <strong>Zambia</strong> Adm<strong>in</strong>istrative Boundaries <strong>and</strong> Agro-ecological Regions (I, IIa, IIb, III) ............1<br />
viii
ACRONYMS<br />
ACT African Conservation Tillage Network<br />
ASP Agricultural Support Programme<br />
CA Conservation agriculture<br />
CF Conservation Farm<strong>in</strong>g<br />
CFU Conservation Farm<strong>in</strong>g Unit<br />
CV Coefficients <strong>of</strong> Variation<br />
EPTD Environment <strong>and</strong> Production Technology Division<br />
EU European Union<br />
FAO Food <strong>and</strong> Agricultural Organization <strong>of</strong> the United Nations<br />
FASAZ Farm<strong>in</strong>g Systems Association <strong>of</strong> <strong>Zambia</strong><br />
FSRP <strong>Zambia</strong> Food Security Research Project<br />
GART Golden Valley Agricultural Research Trust<br />
GLM Generalized L<strong>in</strong>ear Model<br />
GTZ GTZ German Technical Cooperation/German Development Agency<br />
HYV High Yield<strong>in</strong>g Varieties<br />
IAPRI Indaba Agricultural Policy Research Institute<br />
IFAD International Fund for Agricultural Development<br />
IIRR International Institute <strong>of</strong> Rural Reconstruction<br />
MACO M<strong>in</strong>istry <strong>of</strong> Agriculture <strong>and</strong> Cooperatives<br />
MAFF <strong>Zambia</strong> M<strong>in</strong>istry <strong>of</strong> Agriculture, Food, <strong>and</strong> Fisheries (now called MAL)<br />
MAL M<strong>in</strong>istry <strong>of</strong> Agriculture <strong>and</strong> Livestock<br />
MICCA Mitigation <strong>of</strong> Climate Change <strong>in</strong> Agriculture<br />
NOAA-CPC National Oceanic <strong>and</strong> Atmospheric Adm<strong>in</strong>istration’s Climate Prediction<br />
Center<br />
NORAD Norwegian Agency for Development Cooperation<br />
PCA Pr<strong>in</strong>cipal Component Analysis<br />
PHS Post Harvest Survey<br />
QMLE quasi-maximum likelihood estimation<br />
RFE Ra<strong>in</strong>fall Estimate data<br />
RILS Rural Incomes <strong>and</strong> Livelihoods Surveys<br />
SCAFE Soil Conservation <strong>and</strong> Fertility Project<br />
SEA St<strong>and</strong>ard Enumeration Area<br />
SIDA Swedish International Development Agency<br />
TLU Tropical Livestock Unit<br />
TÖB Tropical Ecology Support Program<br />
U.S. United States <strong>of</strong> America<br />
WFP World Food Program<br />
ZNFU <strong>Zambia</strong> National Farmers Union<br />
ix
1. INTRODUCTION<br />
Conservation Agriculture (CA), as promoted by the Food <strong>and</strong> Agricultural Organization <strong>of</strong><br />
the United Nations (FAO), aims to susta<strong>in</strong>ably improve productivity, pr<strong>of</strong>its, <strong>and</strong> food<br />
security by comb<strong>in</strong><strong>in</strong>g three pr<strong>in</strong>ciples. These three pr<strong>in</strong>ciples are: m<strong>in</strong>imum mechanical soil<br />
disturbance; permanent organic soil cover; <strong>and</strong> crop rotation (FAO 2012). CA has been<br />
promoted by many <strong>in</strong>ternational <strong>and</strong> national organizations to smallholders <strong>in</strong> Sub-Saharan<br />
Africa as a solution to soil degradation <strong>and</strong> low productivity problems (IIRR <strong>and</strong> ACT 2005;<br />
Giller et al. 2009; Mazvimavi 2011). <strong>Zambia</strong> is considered as the success story <strong>of</strong> Sub-<br />
Saharan Africa <strong>in</strong> terms <strong>of</strong> CA uptake (IFAD 2011).<br />
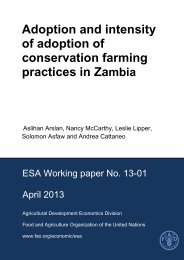
In <strong>Zambia</strong>, seven <strong>of</strong> n<strong>in</strong>e prov<strong>in</strong>ces have received active support for Conservation Farm<strong>in</strong>g<br />
(CF) (see next section for def<strong>in</strong>ition) s<strong>in</strong>ce 1980s: Eastern, Central, Lusaka <strong>and</strong> Southern<br />
Prov<strong>in</strong>ces <strong>in</strong> agroecological regions I <strong>and</strong> IIa; Northern, Luapula, <strong>and</strong> Copperbelt Prov<strong>in</strong>ces<br />
<strong>in</strong> agroecological region III (see figure 1). The promotion <strong>of</strong> CF started as a response to low<br />
agricultural productivity on degraded soils, which was thought to be caused by <strong>in</strong>tensive<br />
tillage, lack <strong>of</strong> soil cover <strong>and</strong> burn<strong>in</strong>g <strong>of</strong> crop residue (Baudron et al. 2007).<br />
The first project <strong>in</strong> <strong>Zambia</strong> on CF was the Soil Conservation <strong>and</strong> Fertility (SCAFE) Project<br />
that started <strong>in</strong> 1985 <strong>in</strong> the Eastern Prov<strong>in</strong>ce (later exp<strong>and</strong>ed to <strong>in</strong>clude Lusaka) funded by the<br />
Swedish International Development Agency (SIDA) (Baudron et al. 2007). In late 1999, the<br />
M<strong>in</strong>istry <strong>of</strong> Agriculture adopted CF as an <strong>of</strong>ficial priority, which was followed by an <strong>in</strong>crease<br />
<strong>in</strong> the number <strong>of</strong> CF projects <strong>in</strong> the country funded by various <strong>in</strong>stitutions (Chomba 2004). In<br />
addition to SIDA, Norwegian Agency for Development Cooperation (Norad), FAO, World<br />
Bank, World Food Programme (WFP) <strong>and</strong> the European Union (EU) promoted CF <strong>in</strong> <strong>Zambia</strong><br />
<strong>in</strong>vest<strong>in</strong>g millions <strong>of</strong> dollars <strong>in</strong>to the dissem<strong>in</strong>ation <strong>of</strong> <strong>conservation</strong> <strong>farm<strong>in</strong>g</strong> technologies. In<br />
spite <strong>of</strong> the scale <strong>of</strong> <strong>in</strong>vestments <strong>in</strong> CF, rigorous analyses <strong>of</strong> its <strong>adoption</strong> <strong>and</strong> impacts on<br />
productivity are still limited.<br />
Figure 1. <strong>Zambia</strong> Adm<strong>in</strong>istrative Boundaries <strong>and</strong> Agro-ecological Regions (I, IIa, IIb, III)<br />
W<br />
N<br />
E<br />
S<br />
Scale 1: 2,500,000<br />
Mw<strong>in</strong>ilunga<br />
Solwezi<br />
Kazungula Kalomo<br />
Chiengi Kaputa<br />
Mpulungu<br />
Nchelenge<br />
Kawambwa<br />
Mwense<br />
Mpika<br />
Ch<strong>in</strong>sali<br />
Kalulushi Kitwe<br />
Lufwanyama<br />
Ndola<br />
Luanshya<br />
Chavuma<br />
Kabompo<br />
Masaiti<br />
Serenje Mambwe<br />
Zambezi<br />
Mufumbwe Kasempa<br />
Mpongwe<br />
Petauke<br />
Chipata<br />
Kapiri Mposhi<br />
Mkushi<br />
Katete Chadiza<br />
Lukulu<br />
Kabwe<br />
Nyimba<br />
Kaoma<br />
Mumbwa Chibombo<br />
Kalabo<br />
Mongu<br />
Chongwe<br />
Lusaka Urban<br />
Luangwa<br />
Itezhi-Tezhi<br />
Kafue<br />
Senanga<br />
Namwala Mazabuka<br />
Monze<br />
Siavonga<br />
Shangombo<br />
Sesheke<br />
Gwembe<br />
Choma<br />
200 0 200<br />
Liv<strong>in</strong>gstone<br />
400 Kilometers<br />
Source: Soil Survey, Mt. Makulu Chilanga<br />
Agro-Ecological Regions<br />
Chililabombwe<br />
Ch<strong>in</strong>gola Mufulira<br />
S<strong>in</strong>azongwe<br />
Mansa<br />
Milenge<br />
Luw<strong>in</strong>gu<br />
Samfya<br />
Mporokoso<br />
Chilubi<br />
Kasama<br />
Mbala<br />
Mungwi<br />
Source: FAO (CFA, <strong>Zambia</strong> Branch homepage).<br />
Amount <strong>of</strong> ra<strong>in</strong>fall received per year: Less than 700mm (I); 800 – 1000mm (IIa); 800 – 1000mm (IIb); 1000 –<br />
1500mm (III).<br />
Nakonde<br />
1<br />
Chama<br />
Lundazi<br />
Isoka<br />
LEGEND<br />
Regions<br />
I<br />
IIa<br />
IIb<br />
III<br />
KEY<br />
District boundary<br />
December 2002
Exist<strong>in</strong>g empirical analyses <strong>of</strong> CF <strong>in</strong> <strong>Zambia</strong> (Haggblade <strong>and</strong> Tembo 2003; Chomba 2004;<br />
Baudron et al. 2007; Tembo et al. 2007; Haggblade, Kabwe, <strong>and</strong> Plerhoples 2011; Nyanga<br />
2012) are mostly subject to small sample sizes, cross sectional surveys, or <strong>in</strong>adequate detail<br />
<strong>in</strong> data, which prevents them from effectively captur<strong>in</strong>g the multiple factors that affect<br />
farmers’ decisions to adopt CF. Although it is sometimes acknowledged that most <strong>adoption</strong> is<br />
partial or <strong>in</strong>cremental, <strong>adoption</strong> <strong>in</strong> this literature is usually def<strong>in</strong>ed as hav<strong>in</strong>g any area under<br />
one or more CF practice due to lack <strong>of</strong> detail <strong>in</strong> data.<br />
This paper addresses these shortcom<strong>in</strong>gs by us<strong>in</strong>g data from the Rural Incomes <strong>and</strong><br />
Livelihoods Surveys that were implemented <strong>in</strong> 2004 <strong>and</strong> 2008. 2 More than 5,000 <strong>and</strong> 8,000<br />
households were <strong>in</strong>terviewed <strong>in</strong> 2004 <strong>and</strong> 2008, respectively. We merge the rich household<br />
panel data with historical Ra<strong>in</strong>fall Estimate data (RFE) at the district level to analyse the<br />
determ<strong>in</strong>ants <strong>and</strong> the <strong><strong>in</strong>tensity</strong> <strong>of</strong> <strong>adoption</strong> <strong>of</strong> one <strong>of</strong> the important pillars <strong>of</strong> CF:<br />
zero/m<strong>in</strong>imum tillage (plant<strong>in</strong>g bas<strong>in</strong>s).The Rural Incomes <strong>and</strong> Livelihoods Surveys (RILS)<br />
data provide us with the possibility to employ panel data econometric techniques to control<br />
for time-<strong>in</strong>variant household, community, <strong>and</strong> <strong>in</strong>stitutional characteristics that may affect<br />
farmers’ decisions <strong>and</strong> confound the results <strong>of</strong> cross-sectional analyses dom<strong>in</strong>ant <strong>in</strong> the<br />
literature.<br />
2. BACKGROUND<br />
2.1. History <strong>of</strong> CA <strong>in</strong> the World <strong>and</strong> <strong>in</strong> <strong>Zambia</strong><br />
Historically, CA was born out <strong>of</strong> ecological <strong>and</strong> economic hardships <strong>in</strong> the United States<br />
(U.S.) caused by catastrophic droughts dur<strong>in</strong>g the 1930s <strong>and</strong> became more popular among<br />
farmers due to ris<strong>in</strong>g fuel prices dur<strong>in</strong>g the 1970’s (Haggblade <strong>and</strong> Tembo 2003). Large<br />
commercial farmers took up m<strong>in</strong>imum tillage technologies to combat the drought-<strong>in</strong>duced<br />
soil erosion <strong>and</strong> save on fuel costs. Around 35% <strong>of</strong> total area <strong>in</strong> the U.S. was cultivated us<strong>in</strong>g<br />
m<strong>in</strong>imum tillage technologies dur<strong>in</strong>g 1980’s (Haggblade <strong>and</strong> Tembo 2003). The CA<br />
experience <strong>in</strong> the U.S. gave impetus to the CA movement <strong>in</strong> South America (ma<strong>in</strong>ly Brazil)<br />
<strong>and</strong> Southern Africa (ma<strong>in</strong>ly South Africa <strong>and</strong> Zimbabwe), where government agricultural<br />
research centers established <strong>conservation</strong> tillage programs to actively promote CA<br />
(Haggblade <strong>and</strong> Tembo 2003).<br />
CA as promoted <strong>in</strong> <strong>Zambia</strong> is called CF <strong>and</strong> consists <strong>of</strong> a package <strong>of</strong> follow<strong>in</strong>g <strong>practices</strong>: (1)<br />
reduced tillage on no more than 15% <strong>of</strong> the field area without soil <strong>in</strong>version, (2) precise<br />
digg<strong>in</strong>g <strong>of</strong> permanent plant<strong>in</strong>g bas<strong>in</strong>s or ripp<strong>in</strong>g <strong>of</strong> soil with a Magoye ripper (the latter<br />
where draft animals are available), (3) leav<strong>in</strong>g <strong>of</strong> crop residues on the field (no burn<strong>in</strong>g), (4)<br />
rotation <strong>of</strong> cereals with legumes <strong>and</strong> (5) dry season l<strong>and</strong> preparation (CFU 2007). 3 The<br />
emergence <strong>of</strong> CF <strong>in</strong> <strong>Zambia</strong> <strong>in</strong> 1990’s also accompanied ecological <strong>and</strong> economic challenges.<br />
With the abrupt end<strong>in</strong>g <strong>of</strong> subsidies for maize, fertilizer <strong>and</strong> farm mach<strong>in</strong>ery follow<strong>in</strong>g the<br />
collapse <strong>of</strong> copper prices, <strong>Zambia</strong>n farmers found themselves try<strong>in</strong>g to cultivate heavily<br />
degraded soils without the extra <strong>in</strong>puts they had been us<strong>in</strong>g for three decades. The<br />
experiences <strong>of</strong> farmers with CA <strong>in</strong> the U.S. <strong>and</strong> Zimbabwe helped commercial maize farmers<br />
<strong>in</strong> <strong>Zambia</strong> to become <strong>in</strong>terested <strong>in</strong> CA. Though the ma<strong>in</strong> motivation was to save on fuel costs,<br />
other benefits such as improved soil structure <strong>and</strong> productivity were also appreciated, hence<br />
2<br />
We thank the Indaba Agricultural Policy Research Institute (IAPRI) <strong>and</strong> the <strong>Zambia</strong> Food Security Research<br />
Project (FSRP) for provid<strong>in</strong>g the data.<br />
3<br />
Throughout the paper, we use the term CA when referr<strong>in</strong>g to the general literature, but CF for the case <strong>in</strong><br />
<strong>Zambia</strong>.<br />
2
giv<strong>in</strong>g <strong>in</strong>centives to a significant share <strong>of</strong> commercial farmers to use CA (Haggblade <strong>and</strong><br />
Tembo 2003).<br />
Follow<strong>in</strong>g the end <strong>of</strong> subsidies, maize yields for smallholders decreased due to lack <strong>of</strong><br />
fertilizer <strong>and</strong> area cultivated with maize has gone down by 20% (Haggblade <strong>and</strong> Tembo<br />
2003). Reports <strong>of</strong> six to eight tons <strong>of</strong> maize yield per hectare under CA <strong>in</strong> Zimbabwe <strong>in</strong>spired<br />
<strong>Zambia</strong> National Farmers Union (ZNFU) to develop CF for smallholders <strong>in</strong> <strong>Zambia</strong>. To this<br />
end, ZNFU established the Golden Valley Agricultural Research Trust (GART), which<br />
started develop<strong>in</strong>g CF for smallholders <strong>in</strong> 1995, <strong>and</strong> the Conservation Farm<strong>in</strong>g Unit (CFU)<br />
to lead related extension activities (Haggblade <strong>and</strong> Tembo 2003).<br />
The CFU <strong>in</strong>itially promoted the CF package ma<strong>in</strong>ly <strong>in</strong> the arid <strong>and</strong> moderate ra<strong>in</strong>fall regions<br />
I <strong>and</strong> IIa. It later exp<strong>and</strong>ed <strong>in</strong>to region IIb <strong>and</strong> currently has field <strong>of</strong>fices <strong>in</strong> 17 districts<br />
support<strong>in</strong>g 170,000 CF farmers. 4 There are no clear CF guidel<strong>in</strong>es for the high ra<strong>in</strong>fall<br />
regions (zone III) yet <strong>and</strong> some argue that CF is not suitable for this agro-ecological sett<strong>in</strong>g<br />
(Baudron et al. 2007; IFAD 2011).<br />
2.2. <strong>Adoption</strong> <strong>of</strong> CA <strong>in</strong> the Literature<br />
There is a well established literature on the <strong>adoption</strong> <strong>of</strong> new agricultural technologies that<br />
was primarily motivated by the need to underst<strong>and</strong> the <strong>adoption</strong> <strong>of</strong> Green Revolution<br />
technologies. This literature identifies the ma<strong>in</strong> constra<strong>in</strong>ts farmers face when mak<strong>in</strong>g<br />
<strong>farm<strong>in</strong>g</strong> decisions (Feder, Just, <strong>and</strong> Zilberman 1985). Early <strong>adoption</strong> studies focused on the<br />
risk <strong>and</strong> uncerta<strong>in</strong>ty about new technologies that may lead farmers to diversify their crop<br />
portfolios <strong>in</strong>stead <strong>of</strong> adopt<strong>in</strong>g new varieties on a large scale (Feder 1980; Just <strong>and</strong> Zilberman<br />
1983). Later studies identified other determ<strong>in</strong>ants <strong>of</strong> <strong>adoption</strong> such as agro-ecological<br />
constra<strong>in</strong>ts, credit constra<strong>in</strong>ts, labour market constra<strong>in</strong>ts, safety-first considerations, seed<br />
supply constra<strong>in</strong>ts, risk preferences, or traditional values (Bellon <strong>and</strong> Taylor 1993; Smale,<br />
Just, <strong>and</strong> Leathers 1994; Ajayi et al. 2003, 2007; Franzel et al. 2004; Phiri et al. 2004; Arslan<br />
<strong>and</strong> Taylor 2009).<br />
As reviewed by McCarthy, Lipper, <strong>and</strong> Branca (2011), the <strong>adoption</strong> <strong>of</strong> CA is subject to most<br />
<strong>of</strong> these traditional constra<strong>in</strong>ts found <strong>in</strong> the literature – though which constra<strong>in</strong>t will be more<br />
b<strong>in</strong>d<strong>in</strong>g is very context-specific. Like any new technology, CA may be perceived as a risky<br />
<strong>in</strong>vestment as farmers will need to learn new <strong>practices</strong> <strong>and</strong> typically do not have access to<br />
<strong>in</strong>surance. Credit constra<strong>in</strong>ts will affect <strong>adoption</strong>, especially when <strong>in</strong>itial <strong>in</strong>vestment costs are<br />
high (e.g., purchase <strong>of</strong> cover crop seeds, herbicides, sprayers), given the evidence that the<br />
benefits <strong>of</strong> CA are usually realized after around four years (Blanco <strong>and</strong> Lal 2008; Hobbs,<br />
Sayre, <strong>and</strong> Gupta (2008). 5 CA <strong>in</strong>creases labor requirements for weed<strong>in</strong>g when implemented<br />
without herbicides (as most smallholders do), therefore labor constra<strong>in</strong>ts may be b<strong>in</strong>d<strong>in</strong>g for<br />
households without access to herbicides <strong>and</strong> enough labor. Agro-ecological constra<strong>in</strong>ts such<br />
as soils (e.g., dra<strong>in</strong>age capacity) <strong>and</strong> climate (e.g., semi-arid regions with termites) are also<br />
likely to affect <strong>adoption</strong>, though there is no conclusive evidence <strong>in</strong> the literature.<br />
Ma<strong>in</strong>ta<strong>in</strong><strong>in</strong>g permanent soil cover can also be costly. Use <strong>of</strong> cover crops requires access to<br />
appropriate seeds, which are <strong>of</strong>ten not easily available <strong>in</strong> the market (Morse <strong>and</strong> McNamara<br />
4<br />
http://www.<strong>conservation</strong>agriculture.org/prog.php?id=1&position=1<br />
5<br />
The time required for the positive yield benefits to kick <strong>in</strong> is highly crop <strong>and</strong> location specific, <strong>and</strong> may be up<br />
to 10 years <strong>in</strong> some sett<strong>in</strong>gs (Giller et al. 2009).<br />
3
2003; Tarawali et al. 1999; Ste<strong>in</strong>er 1998). Incorporat<strong>in</strong>g crop residue post-harvest can also<br />
present significant opportunity costs, as residue has traditionally been used for other purposes<br />
such as livestock feed, fuel, etc (Giller et al. 2009; Bishop-Sambrook et al. 2004; McCarthy<br />
et al. 2004). Tenure rights <strong>and</strong> tenure security can also affect <strong>adoption</strong> decisions. For<br />
<strong>in</strong>stance, even where an <strong>in</strong>dividual farmer wishes to <strong>in</strong>corporate residues on her own plot,<br />
customary tenure systems <strong>of</strong>ten traditionally allow animals to graze freely on harvested fields<br />
<strong>in</strong> most parts <strong>of</strong> Africa, mak<strong>in</strong>g this practice difficult <strong>in</strong> the absence <strong>of</strong> the right (<strong>and</strong> the<br />
capacity to f<strong>in</strong>ance) fenc<strong>in</strong>g. Customary rules associated with burn<strong>in</strong>g harvested fields also<br />
makes it difficult to keep one’s own plots permanently covered, whether by crop residue or<br />
cover crops. F<strong>in</strong>ally, where there are substantial cost outlays but benefits to CA are delayed,<br />
tenure <strong>in</strong>security will reduce farmers’ <strong>in</strong>centives to adopt.<br />
Knowler <strong>and</strong> Bradshaw (2007) have conducted a review <strong>of</strong> 23 studies <strong>in</strong> a quest to identify<br />
universal variables that expla<strong>in</strong> the <strong>adoption</strong> <strong>of</strong> CA, however, they fail to f<strong>in</strong>d agreement <strong>in</strong><br />
the literature. Only six out <strong>of</strong> twenty three studies they review are from develop<strong>in</strong>g countries,<br />
<strong>and</strong> most <strong>of</strong> them have very small sample sizes. 6 Though there is no variable that<br />
consistently expla<strong>in</strong>s <strong>adoption</strong> <strong>in</strong> the aggregate study, they also conduct an analysis by region<br />
<strong>and</strong> f<strong>in</strong>d that farm size tends to be significant <strong>in</strong> studies <strong>in</strong> Africa, whereas education tends to<br />
be significant <strong>in</strong> studies <strong>in</strong> North America. The authors take this lack <strong>of</strong> universal variables<br />
that expla<strong>in</strong> <strong>adoption</strong> as an <strong>in</strong>dication <strong>of</strong> the location specificity <strong>of</strong> CA.<br />
Nkala et al. (2011) also conduct a meta-analysis <strong>of</strong> CA, focus<strong>in</strong>g ma<strong>in</strong>ly on the constra<strong>in</strong>ts to<br />
successful implementation <strong>of</strong> CA projects <strong>in</strong> Southern Africa. The authors discuss such issues<br />
as the lack <strong>of</strong> <strong>in</strong>frastructure, non-farmer driven approaches, exist<strong>in</strong>g livestock management<br />
norms, imperfect <strong>in</strong>put <strong>and</strong> credit markets <strong>and</strong> l<strong>and</strong> tenure as obstacles that limit wide-spread<br />
<strong>adoption</strong> <strong>in</strong> Southern Africa. They also highlight (based on the literature they review) that<br />
<strong>adoption</strong> <strong>in</strong> this region is mostly partial <strong>and</strong> underl<strong>in</strong>e the importance <strong>of</strong> def<strong>in</strong><strong>in</strong>g <strong>adoption</strong> <strong>in</strong><br />
this context not only as a b<strong>in</strong>ary outcome, but also as a cont<strong>in</strong>uous process.<br />
Most CA <strong>practices</strong> are regarded as improved soil water management <strong>practices</strong>. M<strong>in</strong>imum soil<br />
disturbance <strong>in</strong>creases water productivity, mulch<strong>in</strong>g <strong>and</strong> crop residues improve water<br />
<strong>in</strong>filtration <strong>and</strong> plant<strong>in</strong>g bas<strong>in</strong>s maximize soil moisture buffer capacity (Giller et al. 2009;<br />
Chikowo 2011) Therefore, CA can play an important role <strong>in</strong> mitigat<strong>in</strong>g climate risk<br />
especially <strong>in</strong> arid <strong>and</strong> semi-arid regions. In spite <strong>of</strong> the importance <strong>of</strong> the availability <strong>and</strong><br />
variability <strong>of</strong> ra<strong>in</strong>fall <strong>in</strong> affect<strong>in</strong>g farmers’ <strong>adoption</strong> decisions, no previous research on CA<br />
controls for the effects <strong>of</strong> ra<strong>in</strong>fall, to the best <strong>of</strong> our knowledge.<br />
The f<strong>in</strong>d<strong>in</strong>gs <strong>in</strong> Knowler <strong>and</strong> Bradshaw (2007) demonstrate the shortcom<strong>in</strong>gs <strong>in</strong> the literature<br />
<strong>in</strong> terms <strong>of</strong> rigorous analyses <strong>of</strong> <strong>adoption</strong> <strong>and</strong> productivity impacts <strong>of</strong> CA. Most <strong>of</strong> the<br />
econometric analyses <strong>in</strong> this literature are subject to endogeneity <strong>and</strong> small sample bias, both<br />
<strong>of</strong> which are addressed <strong>in</strong> this paper with panel data <strong>and</strong> novel econometric approaches.<br />
6<br />
The exception is the study by Clay et al. (1998) <strong>in</strong> Rw<strong>and</strong>a on the <strong>adoption</strong> <strong>of</strong> organic <strong>in</strong>puts, which is not a<br />
conventional CA technology.<br />
4
2.3. <strong>Adoption</strong> <strong>of</strong> CF <strong>in</strong> <strong>Zambia</strong><br />
Despite its promotion over the last fifteen years, <strong>adoption</strong> <strong>of</strong> CF <strong>in</strong> <strong>Zambia</strong> is relatively<br />
limited. 7 Haggblade <strong>and</strong> Tembo (2003) report that 20% <strong>of</strong> CF farmers <strong>in</strong> the 2002/3 season<br />
were spontaneous adopters, with the 80% majority practic<strong>in</strong>g CF as a condition for receiv<strong>in</strong>g<br />
subsidised <strong>in</strong>put packages. CFU reports that around 170,000 farmers had adopted CF on part<br />
or all <strong>of</strong> their l<strong>and</strong> <strong>in</strong> 2011.<br />
<strong>Adoption</strong> tends to be <strong>in</strong>cremental <strong>and</strong> partial <strong>in</strong> <strong>Zambia</strong>. Umar et al. (2011) found that almost<br />
all farmers (out <strong>of</strong> 129 <strong>in</strong>terviewed) practice both conventional <strong>and</strong> <strong>conservation</strong> <strong>farm<strong>in</strong>g</strong> on<br />
different plots. Haggblade <strong>and</strong> Tembo (2003) reported that 0.25 ha <strong>of</strong> carefully managed<br />
bas<strong>in</strong>-plant<strong>in</strong>g CF can provide a m<strong>in</strong>imal food security safety net for a family <strong>of</strong> four.<br />
Primary constra<strong>in</strong>ts to <strong>adoption</strong> <strong>in</strong> <strong>Zambia</strong> are the use <strong>of</strong> crop residues for other purposes,<br />
labor constra<strong>in</strong>ts <strong>and</strong> the limited potential to grow cover crops dur<strong>in</strong>g the dry season. Of these<br />
three constra<strong>in</strong>ts, a number <strong>of</strong> authors argue that labor constra<strong>in</strong>t is the major constra<strong>in</strong>t to CF<br />
<strong>adoption</strong> <strong>in</strong> <strong>Zambia</strong> (Umar et al. 2011; Baudron et al. 2007; Haggblade <strong>and</strong> Tembo 2003).<br />
The labor constra<strong>in</strong>t manifests itself dur<strong>in</strong>g l<strong>and</strong> preparation <strong>and</strong> weed<strong>in</strong>g. Preparation <strong>of</strong> the<br />
plant<strong>in</strong>g bas<strong>in</strong>s is highly labor <strong>in</strong>tensive <strong>and</strong> the hir<strong>in</strong>g <strong>of</strong> labor is rarely feasible due to<br />
unaffordable daily wages at peak times (also because hir<strong>in</strong>g is not widely accepted culturally)<br />
(Baudron et al. 2007; Mazvimavi 2011). Weed<strong>in</strong>g requirements tend to be higher on CF plots<br />
(<strong>in</strong> the absence <strong>of</strong> herbicide use) creat<strong>in</strong>g another labor constra<strong>in</strong>t (Umar et al. 2011).<br />
F<strong>in</strong>d<strong>in</strong>gs related to l<strong>and</strong> <strong>and</strong> labor are supported by Chomba (2004). His study, based on<br />
nationwide post-harvest (1998/99-1999/2000) <strong>and</strong> supplemental household surveys<br />
(1999/2000) cover<strong>in</strong>g 2,524 farmers <strong>in</strong> Eastern, Southern, Central <strong>and</strong> Lusaka Prov<strong>in</strong>ces,<br />
found that household size <strong>and</strong> l<strong>and</strong> size positively <strong>in</strong>fluenced <strong>adoption</strong> rates <strong>of</strong> CF dur<strong>in</strong>g the<br />
1998-2000 seasons. He also found that distance to markets <strong>and</strong> extension services were<br />
important. This may be particularly so given that this study uses data collected early <strong>in</strong> the<br />
promotion <strong>of</strong> CF <strong>in</strong> <strong>Zambia</strong>.<br />
Nyanga et al. (2011) surveyed 469 farmers <strong>in</strong> 12 districts (<strong>in</strong> Southern, Central, Western, <strong>and</strong><br />
Eastern prov<strong>in</strong>ces) <strong>in</strong> an effort to underst<strong>and</strong> their perceptions <strong>of</strong> climate change <strong>and</strong><br />
attitud<strong>in</strong>al <strong>and</strong> knowledge-based drivers <strong>of</strong> CF <strong>adoption</strong>. 8 The authors <strong>of</strong> this ma<strong>in</strong>ly<br />
qualitative study documented a widespread awareness <strong>of</strong> <strong>in</strong>creased climate variability. There<br />
was a positive correlation between perception <strong>of</strong> <strong>in</strong>creased climate variability <strong>and</strong> the use <strong>of</strong><br />
CF, but no correlation between attitudes towards climate change itself <strong>and</strong> CF. Interest<strong>in</strong>gly,<br />
the authors found a widespread expectation <strong>of</strong> subsidy, <strong>in</strong>put packages or material rewards<br />
for uptake <strong>of</strong> CF, which they argued has developed as a result <strong>of</strong> previous program’s use <strong>of</strong><br />
such <strong>in</strong>centives. This is concordant with a f<strong>in</strong>d<strong>in</strong>g <strong>of</strong> Baudron et al. (2007), who reported that<br />
50% <strong>of</strong> farmers dis-adopt CF if they no longer qualify for such <strong>in</strong>centives.<br />
Most <strong>of</strong> these studies on the <strong>adoption</strong> <strong>of</strong> CF <strong>in</strong> <strong>Zambia</strong> rely on small samples purposefully<br />
selected from regions where CF was promoted, which risks confound<strong>in</strong>g the effects <strong>of</strong><br />
various <strong>in</strong>terventions on <strong>adoption</strong>. The studies that rely on cross sectional data cannot control<br />
for potential endogeneity caused by time-<strong>in</strong>variant unobservable household characteristics<br />
that effect <strong>adoption</strong>. A limited number <strong>of</strong> studies that use multi-year data either fail to make<br />
7<br />
Throughout the paper, we use the term CA when referr<strong>in</strong>g to the general literature, but CF for the case <strong>in</strong><br />
<strong>Zambia</strong>.<br />
8<br />
Nyanga et al. (2011) use a proxy <strong>in</strong>dicator for <strong>adoption</strong> <strong>of</strong> CA <strong>and</strong> consider any farmer with some area under<br />
m<strong>in</strong>imum tillage (both plant<strong>in</strong>g bas<strong>in</strong>s <strong>and</strong> animal draft power ripp<strong>in</strong>g) as a “CA adopter.”<br />
5
use <strong>of</strong> the panel structure <strong>in</strong> their analyses (Chomba 2004; Kabwe <strong>and</strong> Donovan 2005) or<br />
have only multiple cross sections (Haggblade <strong>and</strong> Tembo 2003), hence, only provide<br />
suggestive descriptive evidence at best. 9<br />
Our paper contributes to this literature by us<strong>in</strong>g a large <strong>and</strong> rich panel data set merged with<br />
historical ra<strong>in</strong>fall data that enables us to use panel data methodologies to control for some <strong>of</strong><br />
the most common forms <strong>of</strong> endogeneity <strong>in</strong> the analyses <strong>of</strong> <strong>adoption</strong> with household data. We<br />
therefore are able to identify the variables that affect <strong>adoption</strong> <strong>and</strong> its <strong><strong>in</strong>tensity</strong> without the<br />
various confound<strong>in</strong>g factors <strong>in</strong> the literature. We present our data <strong>and</strong> descriptive statistics <strong>in</strong><br />
the next section, before we lay out our empirical methodology <strong>in</strong> section 4. We present our<br />
econometric results <strong>in</strong> section 5 <strong>and</strong> discuss policy implications <strong>in</strong> section 6.<br />
3. DATA AND DESCRIPTIVE STATISTICS<br />
Our ma<strong>in</strong> data sources are two rounds <strong>of</strong> RILS conducted <strong>in</strong> 2004 <strong>and</strong> 2008. These surveys<br />
are the second <strong>and</strong> third supplemental surveys to the nationally representative 1999/2000<br />
Post-Harvest Survey (PHS). The supplemental surveys, carried out by the Central Statistical<br />
Office <strong>in</strong> conjunction with the M<strong>in</strong>istry <strong>of</strong> Agriculture, Food, <strong>and</strong> Fisheries (MAFF) <strong>and</strong><br />
commissioned by Michigan State University’s Food Security Research Project (FSRP), were<br />
designed to study options to improve crop production, market<strong>in</strong>g, <strong>and</strong> food consumption<br />
among small scale farmers. 10 They collected detailed production <strong>and</strong> <strong>in</strong>come data for the<br />
2002/2003 <strong>and</strong> 2006/2007 cropp<strong>in</strong>g seasons, <strong>and</strong> covered around 5,400 <strong>and</strong> 8,000<br />
households, respectively. 11<br />
We merge RILS data with historical data on RFEs at the district level to control for the<br />
effects <strong>of</strong> the variation <strong>in</strong> ra<strong>in</strong>fall on farmers’ <strong>adoption</strong> decisions. RFE data are obta<strong>in</strong>ed from<br />
the National Oceanic <strong>and</strong> Atmospheric Adm<strong>in</strong>istration’s Climate Prediction Center (NOAA-<br />
CPC) for the period <strong>of</strong> 1996-2011. RFE data we use are based on the latest estimation<br />
techniques for 10-day <strong>in</strong>tervals <strong>and</strong> have a resolution <strong>of</strong> 8 km. 12 Table 1 summarizes the RFE<br />
data by prov<strong>in</strong>ce. We can see that the grow<strong>in</strong>g season RFE <strong>in</strong> our data conforms to the agroecological<br />
zon<strong>in</strong>g st<strong>and</strong>ards presented <strong>in</strong> Figure 1. Southern region (<strong>in</strong> AEZ1) receives the<br />
least ra<strong>in</strong>fall, followed by Lusaka, Eastern, <strong>and</strong> Central prov<strong>in</strong>ces (<strong>in</strong> AEZ 2a). Western<br />
region (mostly <strong>in</strong> AEZ 2b) receives higher than these prov<strong>in</strong>ces but less than the rema<strong>in</strong><strong>in</strong>g<br />
prov<strong>in</strong>ces (Northern, Copperbelt, Luapula, <strong>and</strong> Northwestern <strong>in</strong> AEZ3).<br />
The RILS asked farmers about the ma<strong>in</strong> tillage method used for each plot <strong>in</strong> both years.<br />
Unfortunately, the surveys do not allow us to analyse cover crops <strong>and</strong> residue management.<br />
The 2004 survey asked about residue management; however, this question was removed <strong>in</strong><br />
2008. In both years, we can also <strong>in</strong>fer some <strong>in</strong>formation about crop rotation – though the<br />
9<br />
Chomba (2004) uses two rounds <strong>of</strong> data that can be considered as a type <strong>of</strong> panel data. However, the follow-up<br />
supplemental survey only covers soil <strong>and</strong> water <strong>conservation</strong> <strong>practices</strong> rather than be<strong>in</strong>g a real panel survey,<br />
prevent<strong>in</strong>g the author from us<strong>in</strong>g panel data econometric techniques. CF <strong>practices</strong> analysed are specifically:<br />
Plant<strong>in</strong>g bas<strong>in</strong>s, crop rotation, leav<strong>in</strong>g crop residues on the field, other m<strong>in</strong>imum tillage <strong>practices</strong>, <strong>in</strong>tercropp<strong>in</strong>g<br />
<strong>and</strong> improved fallow.<br />
10<br />
MAFF was called M<strong>in</strong>istry <strong>of</strong> Agriculture <strong>and</strong> Cooperatives (MACO) dur<strong>in</strong>g the 2008 surveys, <strong>and</strong> is now<br />
called M<strong>in</strong>istry <strong>of</strong> Agriculture <strong>and</strong> Livestock (MAL). In 2011, Michigan State University has transformed<br />
FSRP <strong>in</strong>to a local <strong>in</strong>stitute called Indaba Agricultural Policy Research Institute (IAPRI).<br />
11<br />
For more details about the surveys, see CSO (2004, 2008).<br />
12<br />
See http://www.cpc.ncep.noaa.gov/products/fews/RFE2.0_desc.shtml for more <strong>in</strong>formation on RFE<br />
algorithms.<br />
6
Table 1. Grow<strong>in</strong>g Season RFE Averages <strong>and</strong> Coefficients <strong>of</strong> Variation (CV) by<br />
Prov<strong>in</strong>ce, 1996-2011<br />
Mean CV<br />
Prov<strong>in</strong>ce RFE RFE<br />
Central 882.95 0.26<br />
Copperbelt 1014.44 0.27<br />
Eastern 855.09 0.26<br />
Luapula 1029.96 0.27<br />
Lusaka 768.65 0.26<br />
Northern 975.48 0.23<br />
NWestern 1096.56 0.30<br />
Southern 745.26 0.29<br />
Western 898.72 0.30<br />
Total 915.29 0.27<br />
Source: Author calculations based on RFE data from NOAA-CPC for the period <strong>of</strong> 1996-2011.<br />
number <strong>of</strong> farmers that practice both m<strong>in</strong>imum tillage <strong>and</strong> crop rotation is extremely low to<br />
allow an analysis <strong>of</strong> the jo<strong>in</strong>t <strong>adoption</strong> <strong>of</strong> these two <strong>practices</strong> (we provide some descriptive<br />
<strong>in</strong>formation related to crop rotation below). Subject to these shortcom<strong>in</strong>gs <strong>in</strong> the data <strong>and</strong><br />
keep<strong>in</strong>g <strong>in</strong> m<strong>in</strong>d that the m<strong>in</strong>imum/reduced tillage is the ma<strong>in</strong> component <strong>of</strong> CF, we use only<br />
the <strong>in</strong>formation on tillage <strong>practices</strong> to def<strong>in</strong>e our CF variables <strong>in</strong> this paper. We do, however,<br />
acknowledge that the ideal def<strong>in</strong>ition <strong>of</strong> CF should <strong>in</strong>clude all <strong>practices</strong> <strong>in</strong> the CF package.<br />
Table 2 presents <strong>in</strong>formation on the proportion <strong>of</strong> farmers that implemented various tillage<br />
<strong>and</strong> crop management <strong>practices</strong> <strong>in</strong> both years. Most farmers are small scale farmers<br />
(cultivat<strong>in</strong>g on average 2.3 <strong>and</strong> 3.4 hectares <strong>in</strong> 2004 <strong>and</strong> 2008, resp.), who use a h<strong>and</strong> hoe as<br />
their ma<strong>in</strong> tillage method (60% <strong>and</strong> 44% <strong>of</strong> households <strong>in</strong> 2004 <strong>and</strong> 2008, respectively). In<br />
2004, around 3% used plant<strong>in</strong>g bas<strong>in</strong>s <strong>and</strong> 11% used zero tillage. These shares were around<br />
2% <strong>and</strong> 3% <strong>in</strong> 2008. A third <strong>of</strong> households used a plough <strong>in</strong> both years. The RILS asked<br />
about crop residue management only <strong>in</strong> 2004 <strong>and</strong> found that 74% <strong>of</strong> farmers left the crop<br />
residue <strong>in</strong> the field. Unfortunately, we cannot establish whether livestock grazed on the fields<br />
after harvest to dist<strong>in</strong>guish proper <strong>conservation</strong> agriculture practice from traditional practice<br />
<strong>of</strong> lett<strong>in</strong>g livestock graze on crop residues after harvest. Almost two-thirds <strong>of</strong> farmers<br />
practiced crop rotation (def<strong>in</strong>ed as hav<strong>in</strong>g cultivated different crops on the same plot with<strong>in</strong><br />
the 3 year period <strong>of</strong> surveys) on at least one field. All differences between the two years,<br />
except for plough <strong>and</strong> crop rotation, are statistically significant at the 1% level.<br />
We def<strong>in</strong>e two <strong>in</strong>dicators <strong>of</strong> CF: CF1 equals one if the farmer used h<strong>and</strong> hoe, plant<strong>in</strong>g bas<strong>in</strong>s,<br />
or zero tillage on at least one <strong>of</strong> his/her fields, CF2 equals one if the farmer used plant<strong>in</strong>g<br />
bas<strong>in</strong>s or zero tillage on at least one field. 13 Among CF1 farmers, the proportion <strong>of</strong> farmers<br />
who practiced rotation was 68% <strong>in</strong> 2004 <strong>and</strong> decreased to 58% <strong>in</strong> 2008. Among CF2 farmers,<br />
85% <strong>and</strong> 70% had practiced rotation <strong>in</strong> 2004 <strong>and</strong> 2008, respectively. Although these<br />
percentages seem high, the numbers <strong>of</strong> observations are very low: 442 <strong>and</strong> 129 households<br />
(out <strong>of</strong> more than 4,000) practice CF2 <strong>and</strong> rotation at the same time <strong>in</strong> 2004 <strong>and</strong> 2008,<br />
respectively. We, therefore, do not <strong>in</strong>clude the <strong>in</strong>formation on rotation <strong>in</strong> the def<strong>in</strong>ition <strong>of</strong> the<br />
dependent variables <strong>in</strong> the econometric analysis.<br />
13<br />
CF is promoted heavily for h<strong>and</strong> hoe farmers <strong>in</strong> <strong>Zambia</strong>. H<strong>and</strong> hoe use is <strong>in</strong>cluded <strong>in</strong> the def<strong>in</strong>ition <strong>of</strong> CF1 as<br />
a control for cases where the answer <strong>of</strong> a CF farmer may have been coded as h<strong>and</strong> hoe as opposed to<br />
m<strong>in</strong>imum/zero tillage as these are answers to the same question. The results <strong>of</strong> both def<strong>in</strong>itions are provided<br />
throughout the paper <strong>in</strong> order to address doubts about the extent <strong>of</strong> this potential cod<strong>in</strong>g error.<br />
7
Table 2. Various Tillage <strong>and</strong> Crop Management Practices <strong>in</strong> RILS<br />
Practices 2004 2008<br />
H<strong>and</strong> hoe<strong>in</strong>g 0.60*** 0.44***<br />
Plant<strong>in</strong>g bas<strong>in</strong>s 0.03*** 0.02***<br />
No tillage 0.11*** 0.03***<br />
Plough<strong>in</strong>g 0.29* 0.31*<br />
Ripp<strong>in</strong>g 0.02*** 0.01***<br />
Ridg<strong>in</strong>g/bund<strong>in</strong>g 0.23*** 0.41***<br />
Crop residue left <strong>in</strong> the field 0.74 n.a.<br />
Rotation (diff crops for 3 years) 0.57 0.56<br />
Intercropp<strong>in</strong>g 0.18*** 0.11***<br />
Intercropp<strong>in</strong>g with legumes 0.07*** 0.03***<br />
Fruit trees 0.04*** 0.17***<br />
Source: Author calculations based on RILS.<br />
Note: *, **, <strong>and</strong> *** <strong>in</strong>dicate that the difference between the two years is<br />
significant at 10%, 5%, <strong>and</strong> 1%, respectively.<br />
Table 3. Proportion <strong>of</strong> Farmers that Adopted <strong>and</strong> L<strong>and</strong> Cultivated with CF1/CF2<br />
2004 2008 Significant<br />
CF1: H<strong>and</strong> hoe/plant<strong>in</strong>g bas<strong>in</strong>s/zero tillage<br />
Proportion <strong>of</strong> farmers 0.62 0.47 ***<br />
Proportion <strong>of</strong> l<strong>and</strong> 0.58 0.59<br />
CF2: Plant<strong>in</strong>g bas<strong>in</strong>s/zero tillage<br />
Proportion <strong>of</strong> farmers 0.13 0.05 ***<br />
Proportion <strong>of</strong> l<strong>and</strong> 0.31 0.48 ***<br />
Source: Author calculations based on RILS.<br />
The proportion <strong>of</strong> households that practiced CF (for both def<strong>in</strong>itions) has decreased<br />
significantly between 2004 <strong>and</strong> 2008 (Table 3). Forty seven percent <strong>of</strong> the households<br />
practiced CF1 <strong>in</strong> 2008 (down from 62%), but only 5% practiced CF2 (down from 13%). We<br />
def<strong>in</strong>e the <strong><strong>in</strong>tensity</strong> <strong>of</strong> <strong>adoption</strong> as the proportion <strong>of</strong> l<strong>and</strong> cultivated with the practice for those<br />
who used it. The <strong><strong>in</strong>tensity</strong> <strong>of</strong> <strong>adoption</strong> <strong>of</strong> CF1 did not change, while that <strong>of</strong> CF2 has <strong>in</strong>creased<br />
significantly from 31% to 48%.<br />
Table 4 shows the breakdown <strong>of</strong> our dependent variables by <strong>Zambia</strong>’s n<strong>in</strong>e prov<strong>in</strong>ces <strong>and</strong><br />
year. The proportion <strong>of</strong> households that practiced CF1 has decreased <strong>in</strong> almost all prov<strong>in</strong>ces<br />
(but <strong>in</strong> the Western prov<strong>in</strong>ce), whereas the <strong><strong>in</strong>tensity</strong> <strong>of</strong> <strong>adoption</strong> <strong>in</strong>creased <strong>in</strong> the Central,<br />
Luapula, Lusaka <strong>and</strong> Western prov<strong>in</strong>ces. In all other prov<strong>in</strong>ces, the <strong><strong>in</strong>tensity</strong> <strong>of</strong> <strong>adoption</strong><br />
decreased between the two panels. Us<strong>in</strong>g the stricter def<strong>in</strong>ition <strong>of</strong> CF (CF2), we see a<br />
sizeable decrease <strong>in</strong> the proportion <strong>of</strong> households that practiced CF2 <strong>in</strong> all but two prov<strong>in</strong>ces<br />
(Eastern <strong>and</strong> Southern). This decrease is most strik<strong>in</strong>g <strong>in</strong> the Northern prov<strong>in</strong>ce where 42% <strong>of</strong><br />
households <strong>in</strong> the sample practiced CF2 <strong>in</strong> 2004, but only 1% did so <strong>in</strong> 2008. This result may<br />
be expected given that CF <strong>in</strong> <strong>Zambia</strong> is suitable for agroecological regions with moisture<br />
8
stress, <strong>and</strong> northern prov<strong>in</strong>ce is <strong>in</strong> the high-ra<strong>in</strong>fall zone (Haggblade <strong>and</strong> Tembo 2003). 14 The<br />
<strong><strong>in</strong>tensity</strong> <strong>of</strong> <strong>adoption</strong> has <strong>in</strong>creased <strong>in</strong> 4 prov<strong>in</strong>ces (Central, Luapula, Lusaka <strong>and</strong> Northern),<br />
most significantly so <strong>in</strong> Lusaka, where it <strong>in</strong>creased from 32% to 80%.<br />
Table 4. The proportion <strong>of</strong> households that adopted <strong>and</strong> the proportion<br />
<strong>of</strong> l<strong>and</strong> under CF1/CF2 by prov<strong>in</strong>ce<br />
CF1 CF2<br />
Prop. hh. Prop. l<strong>and</strong> Prop. hh Prop. l<strong>and</strong><br />
Prov<strong>in</strong>ce 2004 2008 2004 2008 2004 2008 2004 2008<br />
Central 0.70 0.55 0.55 0.70 0.10 0.04 0.40 0.42<br />
Copperbelt 0.84 0.79 0.64 0.49 0.05 0.01 0.21 0.04<br />
Eastern 0.69 0.42 0.82 0.71 0.08 0.14 0.60 0.54<br />
Luapula 0.36 0.22 0.20 0.37 0.09 0.01 0.17 0.43<br />
Lusaka 0.69 0.56 0.60 0.78 0.05 0.01 0.32 0.80<br />
Northern 0.89 0.63 0.47 0.47 0.42 0.01 0.24 0.27<br />
NWestern 0.56 0.45 0.57 0.53 0.01 0.01 0.74 0.03<br />
Southern 0.27 0.17 0.59 0.43 0.01 0.02 0.34 0.30<br />
Western 0.47 0.58 0.50 0.70 0.01 0.01 0.55 0.52<br />
Source: Author calculations based on RILS.<br />
The only prov<strong>in</strong>ce where the proportion <strong>of</strong> farmers practic<strong>in</strong>g CF2 <strong>in</strong>creased significantly is<br />
the Eastern Prov<strong>in</strong>ce (from 8% to 14%). Eastern prov<strong>in</strong>ce has historically been the hub <strong>of</strong> CF<br />
activities <strong>in</strong> <strong>Zambia</strong>; therefore, this difference is to be expected. Given the different history <strong>of</strong><br />
CF <strong>in</strong> the Eastern prov<strong>in</strong>ce, we conduct all follow<strong>in</strong>g analyses at the national level, as well as<br />
for the Eastern prov<strong>in</strong>ce only, to underst<strong>and</strong> the extent to which the plethora <strong>of</strong> CF projects <strong>in</strong><br />
this prov<strong>in</strong>ce made a difference <strong>in</strong> <strong>adoption</strong> <strong>and</strong> the <strong><strong>in</strong>tensity</strong> <strong>of</strong> CF.<br />
Although CF was orig<strong>in</strong>ally developed by <strong>and</strong> for commercial farmers, it has been widely<br />
promoted to smallholders <strong>in</strong> <strong>Zambia</strong> (<strong>and</strong> <strong>in</strong> Southern Africa <strong>in</strong> general). Table 5 shows the<br />
breakdown <strong>of</strong> <strong>adoption</strong> <strong>and</strong> the <strong><strong>in</strong>tensity</strong> <strong>of</strong> <strong>adoption</strong> by cultivated l<strong>and</strong> size us<strong>in</strong>g the<br />
categorization <strong>of</strong> M<strong>in</strong>istry <strong>of</strong> Agriculture <strong>and</strong> Livestock. Households with smaller cultivated<br />
l<strong>and</strong> tend to have higher <strong>adoption</strong> rates <strong>and</strong> <strong>in</strong>tensities <strong>of</strong> <strong>adoption</strong> <strong>of</strong> CF1 <strong>in</strong> both years. This<br />
is to be expected given that the def<strong>in</strong>ition <strong>of</strong> CF1 <strong>in</strong>cludes the use <strong>of</strong> h<strong>and</strong> hoe, which is<br />
ma<strong>in</strong>ly used by smallholders. For CF2, households that cultivated between 5 <strong>and</strong> 20 hectares<br />
had the highest <strong>adoption</strong> rates (16%) <strong>in</strong> 2004, followed by households <strong>in</strong> the 1.5-5 ha.<br />
category. The decrease <strong>in</strong> <strong>adoption</strong> rates is observed for all l<strong>and</strong> size categories, especially for<br />
those <strong>in</strong> the 5-20 ha. category which had the lowest <strong>adoption</strong> rate <strong>of</strong> CF2 <strong>in</strong> 2008. The<br />
<strong><strong>in</strong>tensity</strong> <strong>of</strong> CF2 <strong>adoption</strong> was the highest <strong>in</strong> the smallest l<strong>and</strong> size categories <strong>in</strong> both years<br />
<strong>and</strong> it <strong>in</strong>creased for all categories except the 5-20 ha category between the two years.<br />
14<br />
It has been mentioned that <strong>in</strong> surveys managed by CSO may have coded the practice <strong>of</strong> shift<strong>in</strong>g cultivation<br />
(“chitemene” which is mostly practiced <strong>in</strong> the northern region) as zero tillage prior to 2011 (anonymous<br />
reviewer). 198 households <strong>in</strong> the sample practiced chitemene <strong>in</strong> 2008 (85% <strong>in</strong> the Northern region). If we<br />
assume that these households had erroneously <strong>in</strong>dicated that they practiced zero tillage <strong>in</strong> 2004, the share <strong>of</strong><br />
households with CF2 <strong>in</strong> 2004 <strong>in</strong> the Northern region decreases to 26%. This adjustment does not significantly<br />
affect the results that follow.<br />
9
Table 5. <strong>Adoption</strong> <strong>and</strong> Intensity <strong>of</strong> <strong>Adoption</strong> <strong>of</strong> CF1/CF2 by L<strong>and</strong> Size<br />
L<strong>and</strong><br />
cultivated<br />
(ha)<br />
CF1 CF2<br />
% hh % l<strong>and</strong> % hh % l<strong>and</strong><br />
2004 2008 2004 2008 2004 2008 2004 2008<br />
20 0.25 0.43 0.04 0.05 0.05 0.05 0.03 0.06<br />
Source: Author calculations based on RILS.<br />
Tables 6 <strong>and</strong> 7 present national transition matrices for both def<strong>in</strong>itions <strong>of</strong> CA. Twenty six<br />
percent <strong>of</strong> farmers who did not practice CF1 <strong>in</strong> 2004, had adopted it by 2008, while around<br />
43% <strong>of</strong> adopters <strong>in</strong> 2004 had dis-adopted the practice by 2008. 15 When we use the stricter<br />
def<strong>in</strong>ition <strong>of</strong> CF exclud<strong>in</strong>g h<strong>and</strong> hoe use (CF2), the share <strong>of</strong> new adopters decreases to 5%<br />
<strong>and</strong> that <strong>of</strong> dis-adopters <strong>in</strong>creases to 96%. 16 Fifty eight percent <strong>of</strong> adopters <strong>of</strong> CF1 <strong>in</strong> 2004<br />
were still practic<strong>in</strong>g CF1, whereas this percentage <strong>of</strong> cont<strong>in</strong>u<strong>in</strong>g adopters was only 4% for<br />
CF2. 17<br />
Tables 8 <strong>and</strong> 9 present transition matrices for the Eastern prov<strong>in</strong>ce only. Based on the stricter<br />
def<strong>in</strong>ition <strong>of</strong> CA, a higher proportion <strong>of</strong> farmers became new adopters <strong>and</strong> a smaller<br />
proportion became dis-adopters between 2004 <strong>and</strong> 2008 <strong>in</strong> the Eastern prov<strong>in</strong>ce compared to<br />
the rest <strong>of</strong> the country. The percentage <strong>of</strong> cont<strong>in</strong>u<strong>in</strong>g adopters <strong>of</strong> CF2 are also higher <strong>in</strong> the<br />
Eastern prov<strong>in</strong>ce (12%, though only n<strong>in</strong>e farmers).<br />
Table 6. National Transition Matrix,<br />
CF1<br />
2008<br />
2004 No Yes Total<br />
No # 1,189 424 1,613<br />
% 73.7 26.3 100<br />
Yes # 1,095 1,479 2,574<br />
% 42.5 57.5 100<br />
Table 8. Eastern Prov<strong>in</strong>ce Transition<br />
Matrix, CF1<br />
2008<br />
2004 No Yes Total<br />
No # 231 61 292<br />
% 79.1 20.9 100<br />
Yes # 303 328 631<br />
% 48.1 51.9 100<br />
Source for Tables 6-9: Author calculations based on RILS.<br />
10<br />
Table 7. National Transition Matrix,<br />
CF2<br />
2008<br />
2004 No Yes Total<br />
No # 3,498 165 3,663<br />
% 95.5 4.5 100<br />
Yes # 505 19 524<br />
% 96.4 3.6 100<br />
Table 9. Eastern Prov<strong>in</strong>ce Transition<br />
Matrix, CF2<br />
2008<br />
2004 No Yes Total<br />
No # 725 122 847<br />
% 85.6 14.4 100<br />
Yes # 67 9 76<br />
% 88.2 11.8 100<br />
15<br />
Dis-adopters are def<strong>in</strong>ed as farmers who used a practice <strong>in</strong> 2004 but did not use the same practice <strong>in</strong> 2008.<br />
16<br />
The adjustment for chitemene as expla<strong>in</strong>ed above decreases the nationwide dis-<strong>adoption</strong> rate only to 95%.<br />
17<br />
Kabwe <strong>and</strong> Donovan (2005) report similar dis-<strong>adoption</strong> rates for various CA <strong>practices</strong> <strong>in</strong> their descriptive<br />
study based on the 2000/01 <strong>and</strong> 2002/03 supplemental surveys conducted by the CSO. Chomba (2004),<br />
however, reports much lower <strong>adoption</strong> rates us<strong>in</strong>g the 1999/2000 <strong>and</strong> 2000/01 supplemental surveys. Both <strong>of</strong><br />
these studies are only descriptive.
Although the transition matrices pa<strong>in</strong>t a strik<strong>in</strong>g picture <strong>of</strong> dis-<strong>adoption</strong>, they do not provide<br />
<strong>in</strong>formation on the drivers <strong>of</strong> <strong>adoption</strong> <strong>and</strong> the <strong><strong>in</strong>tensity</strong> <strong>of</strong> it. To address these questions <strong>in</strong><br />
our econometric analysis, we draw on the rich literature on technology <strong>adoption</strong> to select a<br />
comprehensive set <strong>of</strong> explanatory variables that are known to affect farmers’ decisions to<br />
adopt an agricultural technology. These variables <strong>in</strong>clude both production <strong>and</strong> consumption<br />
variables given the fact that most smallholders operate under imperfect market conditions that<br />
make consumption <strong>and</strong> production decisions non-separable (de Janvry, Fafchamps, <strong>and</strong><br />
Sadoulet 1991). Table 10 summarizes our explanatory variables by CF status <strong>and</strong> year.<br />
Adopters <strong>of</strong> CF (by both def<strong>in</strong>itions) tend to come from households with significantly smaller<br />
number <strong>of</strong> adults, lower wealth <strong>in</strong>dices, <strong>and</strong> less livestock <strong>in</strong> both years. 18,19 They also tend to<br />
cultivate significantly smaller l<strong>and</strong>. The share <strong>of</strong> adopters that use plough on at least one field<br />
is significantly lower than that <strong>of</strong> non-adopters <strong>in</strong> both years <strong>and</strong> under both def<strong>in</strong>itions <strong>of</strong><br />
CF. Three quarters <strong>of</strong> both adopters <strong>and</strong> non-adopters <strong>of</strong> CF1 left the crop residues on the<br />
field <strong>in</strong> 2004. Based on the stricter def<strong>in</strong>ition <strong>of</strong> CF, the share <strong>of</strong> adopters that left the crop<br />
residues on the field is significantly higher than that <strong>of</strong> non-adopters <strong>of</strong> CF2 <strong>in</strong> 2004.<br />
A significantly higher share <strong>of</strong> CF1 adopters practiced crop rotation <strong>in</strong> 2004, whereas the<br />
difference was not significant <strong>in</strong> 2008. This difference <strong>in</strong> rotation practice between adopters<br />
<strong>and</strong> non-adopters <strong>of</strong> CF2 is, however, significant <strong>in</strong> both years. The share <strong>of</strong> CF1 adopters<br />
that practiced <strong>in</strong>tercropp<strong>in</strong>g <strong>and</strong> <strong>in</strong>tercropp<strong>in</strong>g with legumes was significantly higher than that<br />
<strong>of</strong> non-adopters <strong>in</strong> 2004. In 2008, the difference was not significant for CF1 <strong>and</strong> switched<br />
sign for CF2.<br />
18<br />
The agricultural wealth <strong>in</strong>dex is created us<strong>in</strong>g Pr<strong>in</strong>cipal Component Analysis (PCA) us<strong>in</strong>g the number <strong>of</strong><br />
ploughs, harrows, cultivators, rippers, tractors, h<strong>and</strong> tractors, carts, pumps, mills, expellers, sprayers <strong>and</strong> shellers<br />
owned by the household. The non-agricultural wealth <strong>in</strong>dex is created us<strong>in</strong>g PCA based on the number <strong>of</strong> bikes,<br />
motorcycles, cars, lorries, trucks, televisions <strong>and</strong> wells owned by the household.<br />
19<br />
Tropical Livestock Unit (TLU) is calculated us<strong>in</strong>g the numbers <strong>of</strong> livestock owned by the household as:<br />
TLU=(cattle+oxen)*0.5 + pigs*0.2 + (goats+sheep+chickens)*0.1.<br />
11
Table 10. Explanatory Variables by CF Status <strong>and</strong> Year<br />
2004 2008 2004 2008<br />
CF1 NoCF1 CF1 NoCF1 CF2 NoCF2 CF2 NoCF2<br />
Socio-economic variables<br />
Female head 0.22 0.19 ** 0.25 0.22 ** 0.2 0.21 0.26 0.24<br />
Widow head 0.01 0.01 0.02 0.02 0.01 0.01 0.02 0.02<br />
Polygamous head 0.11 0.16 *** 0.09 0.15 *** 0.1 0.13 ** 0.16 0.12<br />
# adults (age>=15) 4.12 4.55 *** 3.44 3.76 *** 4.01 4.32 *** 3.55 3.61<br />
Age head 49.80 49.05 52.68 52.43 49.89 49.46 52.29 52.55<br />
Education (average) 4.94 5.10 ** 5.04 5.32 *** 5.22 4.97 ** 4.75 5.21 ***<br />
Dependency ratio 0.94 0.94 1.18 1.17 0.98 0.94 1.11 1.18<br />
Chronically ill (% adults) 0.07 0.06 * 0.02 0.02 0.06 0.07 0.02 0.02<br />
Ag-wealth <strong>in</strong>dex -0.10 0.65 *** -0.16 0.6 *** -0.09 0.23 *** 0.04 0.26 ***<br />
Wealth <strong>in</strong>dex 0.03 0.26 *** -0.06 0.15 *** 0.09 0.12 -0.04 0.05 *<br />
TLU (total) 1.40 4.58 *** 1.1 4.28 *** 1.57 2.75 *** 1.65 2.85 ***<br />
# oxen owned 0.20 1.13 *** 0.17 1.13 *** 0.13 0.61 *** 0.37 0.69 ***<br />
L<strong>and</strong> cultivated (ha) 2.17 2.82 *** 2.98 4.34 *** 2.46 2.41 3.01 3.74 **<br />
L<strong>and</strong> title dummy<br />
Tillage/cropp<strong>in</strong>g <strong>practices</strong><br />
n.a. n.a. 0.04 0.03 n.a. n.a. 0.02 0.04<br />
H<strong>and</strong>-hoe 0.92 n.a. 0.93 n.a 0.61 0.6 0.31 0.44 ***<br />
Plough 0.09 0.65 *** 0.09 0.51 *** 0.06 0.33 *** 0.12 0.32 ***<br />
Ripp<strong>in</strong>g/ridg<strong>in</strong>g/bund<strong>in</strong>g 0.20 0.30 *** 0.36 0.54 *** 0.33 0.22 *** 0.48 0.45<br />
Crop residue left on field 0.74 0.74<br />
0.75 0.73 0.81 0.73 *** 0.75 0.74<br />
Rotation 0.64 0.46 *** 0.56 0.57 0.84 0.53 *** 0.7 0.56 ***<br />
Intercropp<strong>in</strong>g 0.22 0.12 *** 0.11 0.11 0.46 0.14 *** 0.07 0.11 **<br />
Intercropp<strong>in</strong>g with legumes 0.09 0.03 *** 0.04 0.03 0.22 0.04 *** 0.02 0.03 *<br />
Hybrid seeds (% l<strong>and</strong>) 0.23 0.39 *** 0.22 0.35 *** 0.16 0.31 *** 0.28 0.29<br />
Average # weed<strong>in</strong>gs per field<br />
Policy variables<br />
1.63 1.47 *** 1.7 1.56 *** 1.39 1.6 *** 1.84 1.61 ***<br />
ASP district dummy<br />
Received m<strong>in</strong>imum tillage<br />
0.47 0.43 *** 0.43 0.5 *** 0.52 0.45 *** 0.52 0.46<br />
extension (% <strong>in</strong> the SEA) 0.29 0.30<br />
0.32 0.36 *** 0.23 0.3 *** 0.54 0.33 ***<br />
Weather variables<br />
RFE (grow<strong>in</strong>g season av.) 922.05 884.48 *** 927.5 888.49 *** 953.4 901.25 *** 850.8 909.3 ***<br />
RFE CV (1996-2011) 0.26 0.28 *** 0.26 0.27 *** 0.24 0.27 *** 0.27 0.26 ***<br />
Observations 2571 1560 1903 2179 524 3607 184 3898<br />
Source: Author calculations based on RILS.<br />
12
It has been mentioned <strong>in</strong> the literature that the effects <strong>of</strong> CA on production is usually<br />
confounded by the fact that adopters are also more likely to use hybrid seeds (Baudron et al.<br />
2007). The adopters <strong>of</strong> CF1 <strong>and</strong> CF2 <strong>in</strong> the RILS data, however, are significantly less likely<br />
to use hybrid seeds <strong>in</strong> both years. One <strong>of</strong> the <strong>of</strong>t-mentioned constra<strong>in</strong>ts <strong>in</strong> front <strong>of</strong> <strong>adoption</strong> <strong>of</strong><br />
CA <strong>and</strong> successful realization <strong>of</strong> yield benefits from CA is that weed pressure <strong>in</strong>creases with<br />
CA dur<strong>in</strong>g the early years <strong>of</strong> transition (due to reduced tillage <strong>and</strong> cover crops), which is<br />
especially problematic when households do not have access to herbicides. The number <strong>of</strong><br />
weed<strong>in</strong>gs per field for adopters <strong>of</strong> CF1 was significantly higher than that <strong>of</strong> non-adopters <strong>in</strong><br />
both years. Adopters <strong>of</strong> CF2, on the other h<strong>and</strong>, did significantly less weed<strong>in</strong>g per field <strong>in</strong><br />
2004, but more so <strong>in</strong> 2008.<br />
Two policy variables are relevant for the <strong>adoption</strong> <strong>of</strong> CF: a dummy variable that <strong>in</strong>dicates the<br />
districts where the Agricultural Support Programme (ASP) was implemented <strong>and</strong> the share <strong>of</strong><br />
households <strong>in</strong> each st<strong>and</strong>ard enumeration area (SEA) that received extension <strong>in</strong>formation<br />
regard<strong>in</strong>g m<strong>in</strong>imum tillage. The ASP was a SIDA-funded project <strong>in</strong> Eastern, Northern,<br />
Central, <strong>and</strong> Southern Prov<strong>in</strong>ces <strong>of</strong> <strong>Zambia</strong> between 2003 <strong>and</strong> 2008, which facilitated<br />
participatory agricultural development <strong>in</strong> five broad areas: entrepreneurship <strong>and</strong> bus<strong>in</strong>ess<br />
development; l<strong>and</strong>, seed, crops, <strong>and</strong> livestock development (<strong>in</strong>clud<strong>in</strong>g CF); <strong>in</strong>frastructure;<br />
improved service delivery <strong>of</strong> support entities; <strong>and</strong> management <strong>in</strong>formation <strong>and</strong> learn<strong>in</strong>g<br />
systems. The <strong>adoption</strong> <strong>of</strong> CF (def<strong>in</strong>ed as us<strong>in</strong>g plant<strong>in</strong>g bas<strong>in</strong>s) is regarded as one <strong>of</strong> the<br />
successes <strong>of</strong> the ASP, which by its end had around 44,000 beneficiaries (Tembo et al. 2007).<br />
The ASP dummy we use equals one for all 20 districts where the programme operated. A<br />
significantly higher proportion <strong>of</strong> CF1 <strong>and</strong> CF2 adopters lived <strong>in</strong> an ASP district <strong>in</strong> 2004. In<br />
2008, this relationship between adopters <strong>and</strong> non-adopters was reversed for CF1 <strong>and</strong> it was<br />
not significant for CF2. Paradoxically, the share <strong>of</strong> households <strong>in</strong> the same SEA that had<br />
received extension <strong>in</strong>formation on m<strong>in</strong>imum tillage was higher (<strong>and</strong> significantly so) for nonadopters<br />
<strong>of</strong> CF1 <strong>in</strong> 2008 <strong>and</strong> <strong>of</strong> CF2 <strong>in</strong> 2004. In 2008, a significantly higher proportion <strong>of</strong><br />
households had received m<strong>in</strong>imum tillage extension <strong>in</strong> SEAs <strong>of</strong> CF2 adopters, as expected.<br />
The average grow<strong>in</strong>g season RFE over 16 years (1996-2011) is significantly higher <strong>and</strong> its<br />
coefficient <strong>of</strong> variation (CV) significantly lower for adopters than non-adopters <strong>of</strong> CF1 <strong>in</strong><br />
both years <strong>and</strong> <strong>of</strong> CF2 <strong>in</strong> 2004. 20 On the other h<strong>and</strong>, the average RFE was lower <strong>and</strong> its CV<br />
was higher for the adopters <strong>of</strong> CF2 <strong>in</strong> 2008. This suggests that the cont<strong>in</strong>u<strong>in</strong>g adopters <strong>of</strong> CF2<br />
tend to live <strong>in</strong> districts with lower ra<strong>in</strong>fall <strong>and</strong> higher variability there<strong>of</strong>, provid<strong>in</strong>g descriptive<br />
evidence for the argument that plant<strong>in</strong>g bas<strong>in</strong>s <strong>and</strong> reduced tillage are considered as<br />
technologies that help farmers manage soil water more efficiently – especially <strong>in</strong> areas <strong>of</strong><br />
high ra<strong>in</strong>fall variability.<br />
The unconditional statistics above pa<strong>in</strong>t a picture where adopters <strong>of</strong> CF <strong>practices</strong> are poorer<br />
<strong>and</strong> smaller households with smaller amounts <strong>of</strong> l<strong>and</strong> <strong>and</strong> livestock. They are more likely to<br />
practice crop rotation, less likely to use hybrid seeds <strong>and</strong> live <strong>in</strong> districts with lower <strong>and</strong> more<br />
variable ra<strong>in</strong>fall. In the next section, we discuss the panel data models employed <strong>in</strong> this paper<br />
to analyse the conditional decisions to adopt <strong>and</strong> the <strong><strong>in</strong>tensity</strong> <strong>of</strong> <strong>adoption</strong> <strong>of</strong> CF.<br />
20 The grow<strong>in</strong>g season is def<strong>in</strong>ed as the period between the beg<strong>in</strong>n<strong>in</strong>g <strong>of</strong> October <strong>and</strong> end <strong>of</strong> April.<br />
13
4.1. <strong>Adoption</strong> <strong>of</strong> CA<br />
4. METHODOLOGY<br />
We model the decision <strong>of</strong> a farmer whether to adopt a practice or not us<strong>in</strong>g the latent variable<br />
approach, where the farmer will adopt the practice that maximizes the returns. The return<br />
function will be based on both production <strong>and</strong> consumption characteristics, because most<br />
farmers operate under various market imperfections that make the consumption <strong>and</strong><br />
production decisions <strong>in</strong>terdependent (non-separable) (de Janvry, Fafchamps, <strong>and</strong> Sadoulet<br />
1991).<br />
Let the latent variable<br />
*<br />
C it be def<strong>in</strong>ed as:<br />
*<br />
Cit = Xitβ + uit + vi<br />
(1)<br />
where X it is a 1 x K vector (with first element equal to unity), β is a K x 1 vector <strong>of</strong><br />
parameters, it u is normally distributed error term <strong>in</strong>dependent <strong>of</strong> it X , <strong>and</strong> vi are time <strong>in</strong>variant<br />
unobserved effects (Wooldridge, 2002, Ch. 15). We only observe an <strong>in</strong>dicator variable it C<br />
that represents farmer i’s decision at time t to adopt CA:<br />
C = C > .<br />
*<br />
it 1[ it 0]<br />
We can express the distribution <strong>of</strong> it C given it X <strong>and</strong> the unobserved effect v i as follows:<br />
PC ( = 1 | X , v) = φ( X β + v), t= 1,..., T<br />
it it i it i<br />
Estimat<strong>in</strong>g the parameters <strong>of</strong> <strong>in</strong>terest us<strong>in</strong>g fixed effects probit analysis treats the unobserved<br />
effects ( v i ) as parameters to be estimated, is computationally difficult <strong>and</strong> subject to<br />
<strong>in</strong>cidental parameters problem. 21 Traditional r<strong>and</strong>om effects probit model requires an<br />
assumption that i v <strong>and</strong> i X are <strong>in</strong>dependent <strong>and</strong> that vi has a normal distribution, i.e.,<br />
v X N σ<br />
2<br />
i | i ~ (0, v)<br />
We can consistently estimate the partial effects <strong>of</strong> the elements <strong>of</strong> X t on the response<br />
probability at the average value <strong>of</strong> i v ( v i =0) us<strong>in</strong>g a conditional maximum likelihood<br />
approach. We use this approach <strong>in</strong> model<strong>in</strong>g the <strong>adoption</strong> decisions.<br />
4.2. Intensity <strong>of</strong> CA <strong>Adoption</strong><br />
We also model the <strong><strong>in</strong>tensity</strong> <strong>of</strong> <strong>adoption</strong> given the fact that most farmers adopt CF only<br />
partially <strong>and</strong> variables that may <strong>in</strong>crease the <strong><strong>in</strong>tensity</strong> <strong>of</strong> <strong>adoption</strong> are relevant for policy<br />
makers. The <strong><strong>in</strong>tensity</strong> <strong>of</strong> <strong>adoption</strong> is def<strong>in</strong>ed as the proportion <strong>of</strong> total cultivated l<strong>and</strong> that is<br />
under the CF <strong>practices</strong> as def<strong>in</strong>ed <strong>in</strong> this paper, hence the dependent variable is bounded by<br />
21<br />
Estimat<strong>in</strong>g v i (N <strong>of</strong> them) along with β leads to <strong>in</strong>consistent estimation <strong>of</strong> β when T is fixed <strong>and</strong> N →∞<br />
(Wooldridge, 2002, p. 484).<br />
14
the [0,1] <strong>in</strong>terval. We use three different models to analyse the <strong><strong>in</strong>tensity</strong> <strong>of</strong> <strong>adoption</strong> to ensure<br />
the robustness <strong>of</strong> our results: r<strong>and</strong>om effects tobit, pooled fractional probit, <strong>and</strong> unobserved<br />
l<strong>in</strong>ear fixed effects models (Papke <strong>and</strong> Wooldridge 2008).<br />
Correlated R<strong>and</strong>om Effects Tobit Model: Let the share <strong>of</strong> l<strong>and</strong> that is allocated to CF by<br />
farmer i at time t be it S . The two-limit r<strong>and</strong>om effects tobit model for Sit can be specified as<br />
follows:<br />
*<br />
S = X β + u + v<br />
it it it i<br />
⎧ ≤<br />
*<br />
0 if Sit<br />
0<br />
⎪ * *<br />
it ⎨ it it<br />
⎪<br />
*<br />
1 if Sit<br />
≥ 1<br />
S = S if 0< S < 1<br />
⎩<br />
where the dependent variable takes the values <strong>of</strong> 0 <strong>and</strong> 1 with positive probabilities (i.e., the<br />
choices to allocate all or no l<strong>and</strong> to CF are legitimate corner solutions). We allow i v <strong>and</strong> i X<br />
to be correlated us<strong>in</strong>g a Chamberla<strong>in</strong>-like model by assum<strong>in</strong>g<br />
v X N X<br />
2<br />
i | i ~ ( ψ+ iξσ , a)<br />
where<br />
2<br />
σ a is the variance <strong>of</strong> i<br />
T<br />
−1<br />
i it<br />
t=<br />
1<br />
a <strong>in</strong> the equation vi = ψ + Xiξ + ai,<br />
<strong>and</strong> X ≡ T ∑ X is the<br />
1xK vector <strong>of</strong> time averages (Chamberla<strong>in</strong> 1980). We can write Sit <strong>in</strong> the [0,1] <strong>in</strong>terval as:<br />
S = ψ + X β + X ξ + a + u<br />
it it i i it<br />
it | i, i ~<br />
2<br />
(0, σ u )<br />
i | i ~<br />
2<br />
(0, σ a)<br />
u X a N<br />
a X N<br />
The addition <strong>of</strong> X i on the right h<strong>and</strong> side <strong>of</strong> the r<strong>and</strong>om effects tobit model takes care <strong>of</strong> the<br />
unobserved heterogeneity problem <strong>and</strong> allows us to estimate N -consistent estimates <strong>of</strong><br />
2 2<br />
ψ, βξσ , , , <strong>and</strong> σ (Wooldridge, 2002, Ch. 16).<br />
u a<br />
Pooled Fractional Probit Model: The share <strong>of</strong> l<strong>and</strong> cultivated with CF is by def<strong>in</strong>ition a<br />
fractional response variable, whose properties are not fully taken <strong>in</strong>to account by the r<strong>and</strong>om<br />
effects tobit model described above. Papke <strong>and</strong> Wooldridge (1996) used a quasi-maximum<br />
likelihood estimation (QMLE) to obta<strong>in</strong> robust <strong>and</strong> efficient estimators <strong>in</strong> their sem<strong>in</strong>al<br />
contribution to the empirical literature on fractional response variables. Similar to the tobit<br />
model described above, this model allows for corner solutions. We use pooled QMLE<br />
suggested by Papke <strong>and</strong> Wooldridge (2008) for panel data applications. More specifically, we<br />
assume,<br />
ES ( | X, v) =Φ ( Xβ + v), t= 1,..., T<br />
it it i it i<br />
where Φ (.) is the st<strong>and</strong>ard normal cumulative distribution function (that leads to<br />
computationally simple estimators with unobserved heterogeneity). In order to consistently<br />
estimate the β <strong>and</strong> the average partial effects (APE) we need to assume that conditional on v i ,<br />
X it is strictly exogenous <strong>and</strong> that i<br />
15<br />
v , conditional on X it is distributed normally:
v X X X N X<br />
2<br />
i | ( i1, i2,..., iT ) ~ ( ψ+ iξσ , a )<br />
We can consistently estimate the β (up to a scale parameter) <strong>and</strong> the APE, provided that<br />
there are no perfect l<strong>in</strong>ear relationships among X it <strong>and</strong> that there is time variation <strong>in</strong> all<br />
elements <strong>of</strong> it. 22 We use the pooled Bernoulli quasi-MLE estimator obta<strong>in</strong>ed from the pooled<br />
probit log-likelihood, which is called the pooled fractional probit estimator. The estimat<strong>in</strong>g<br />
equation is given by:<br />
S = f(1, X , X )<br />
it it i<br />
<strong>and</strong> is estimated us<strong>in</strong>g a Generalized L<strong>in</strong>ear Models (GLM) approach, with adjustments to the<br />
st<strong>and</strong>ard errors to allow for arbitrary serial dependence across t.<br />
L<strong>in</strong>ear Unobserved Fixed Effects Model: We compare the results <strong>of</strong> the previous two<br />
specifications to the results <strong>of</strong> a simple l<strong>in</strong>ear unobserved fixed effects model. This model is<br />
equivalent to us<strong>in</strong>g pooled OLS to estimate the same equation as <strong>in</strong> the pooled fractional<br />
probit model above. The results <strong>of</strong> this model are directly comparable to those <strong>of</strong> the QMLE<br />
as long as the APE are adjusted by the scale parameter. The model predictions do not<br />
necessarily fall <strong>in</strong> the [0,1] <strong>in</strong>terval, which is a similar problem to the one caused by us<strong>in</strong>g an<br />
OLS for a b<strong>in</strong>ary dependent variable. We, therefore, present the results <strong>of</strong> this specification<br />
for comparison purposes only.<br />
22<br />
The coefficients need to be adjusted us<strong>in</strong>g the scale parameter after estimation to make them comparable with<br />
the coefficients <strong>of</strong> the r<strong>and</strong>om effects tobit <strong>and</strong> l<strong>in</strong>ear unobserved FE models (Papke <strong>and</strong> Wooldridge 2008).<br />
16
5.1. <strong>Adoption</strong><br />
5. RESULTS<br />
Table 11 presents the results <strong>of</strong> the r<strong>and</strong>om effects probit models described above for four<br />
different specifications: two different CF def<strong>in</strong>itions each for the whole sample <strong>and</strong> for the<br />
Eastern prov<strong>in</strong>ce. Most socio-economic variables are not significant <strong>in</strong> determ<strong>in</strong><strong>in</strong>g the<br />
<strong>adoption</strong> <strong>of</strong> CF1. The number <strong>of</strong> adults (older than 15 years <strong>of</strong> age) is positive <strong>and</strong> only<br />
weakly significant <strong>in</strong> the whole sample. Other variables that are <strong>in</strong>dicators <strong>of</strong> labor<br />
availability (i.e., dependency ratio <strong>and</strong> the percentage <strong>of</strong> adults that were chronically ill <strong>in</strong><br />
previous 3 months) are not significant, fail<strong>in</strong>g to provide evidence for labor constra<strong>in</strong>ts <strong>in</strong><br />
front <strong>of</strong> <strong>adoption</strong> <strong>in</strong> our sample.<br />
Table 11. Probability <strong>of</strong> <strong>Adoption</strong> <strong>of</strong> CF1/CF2 (Marg<strong>in</strong>al Effects <strong>of</strong> R<strong>and</strong>om Effects<br />
Probit Models)<br />
Whole Sample Eastern Prov<strong>in</strong>ce<br />
Variables CF1 CF2 CF1 CF2<br />
Female head 0.027 -0.011 0.164* 0.153<br />
Widower head 0.092 -0.109 0.493* -0.088<br />
Polygamous head -0.059 -0.057 -0.053 -0.194<br />
# Adults (age>=15) 0.017* -0.006 0.027 0.039<br />
Age (head) 0.002 0.001 0.003 0.001<br />
Education (average) 0.001 0.009 -0.022 0.006<br />
Dependency ratio 0.013 0.002 0.010 -0.024<br />
Chronically ill (% adults) 0.148 0.011 0.378 0.455<br />
L<strong>and</strong> per capita -0.005 0.018 -0.161** -0.024<br />
Ag-wealth <strong>in</strong>dex -0.231*** -0.020 -0.193 0.051<br />
Wealth <strong>in</strong>dex 0.040* 0.012 0.076*** -0.192<br />
TLU (total) 0.009 0.014*** -0.015 -0.018<br />
# Oxen owned -0.154*** -0.115*** -0.269*** -0.137**<br />
ASP district dummy<br />
Received m<strong>in</strong>imum tillage<br />
-0.123*** -0.067 0.099 -0.096<br />
extension (% SEA) 0.097 0.940*** 0.780*** 0.311<br />
RFE CV (1996-2011) -0.292 7.002*** 7.079*** 9.105***<br />
2008 dummy -0.446*** -0.661*** -0.883*** 0.314***<br />
Central 0.158 0.477**<br />
Copperbelt 0.385*** -0.146<br />
Eastern -0.130 0.798***<br />
Luapula -1.117*** 0.418**<br />
Northern 0.256** 1.670***<br />
NWestern -0.509*** -0.461*<br />
Southern -0.929*** -0.357*<br />
Western -0.370*** -0.428*<br />
Constant 0.600** -3.967*** -1.538** -3.993***<br />
Number <strong>of</strong> observations 8,208 8,208 1,835 1,835<br />
Source: Author calculations based on RILS.<br />
17
The coefficient <strong>of</strong> the agricultural wealth <strong>in</strong>dex is negative <strong>and</strong> significant, whereas that <strong>of</strong><br />
other wealth <strong>in</strong>dex is positive <strong>and</strong> significant. This suggests that while mostly households<br />
with little agricultural mach<strong>in</strong>ery adopt CF1 (keep<strong>in</strong>g <strong>in</strong> m<strong>in</strong>d that h<strong>and</strong> hoe is <strong>in</strong>cluded <strong>in</strong> the<br />
def<strong>in</strong>ition <strong>of</strong> CF1), otherwise better <strong>of</strong>f households with higher wealth <strong>in</strong>dices (i.e., more<br />
household durables) are more likely to adopt.<br />
Number <strong>of</strong> oxen owned is the only variable that is consistently significant: households with<br />
more oxen are significantly less likely to adopt CF <strong>in</strong> all specifications. Households <strong>in</strong> ASP<br />
districts are significantly less likely to adopt CF1, but this variable is not significant <strong>in</strong> all<br />
other specifications, fail<strong>in</strong>g to support the claim that ASP successfully promoted CF <strong>in</strong> the<br />
districts it operated <strong>in</strong>. The proportion <strong>of</strong> households <strong>in</strong> an SEA that received extension<br />
<strong>in</strong>formation on m<strong>in</strong>imum tillage significantly <strong>in</strong>creases the <strong>adoption</strong> <strong>of</strong> CF2 <strong>in</strong> the whole<br />
sample <strong>and</strong> CF1 <strong>in</strong> the Eastern prov<strong>in</strong>ce, underl<strong>in</strong><strong>in</strong>g the importance <strong>of</strong> extension <strong>in</strong><br />
promot<strong>in</strong>g <strong>adoption</strong>.<br />
We f<strong>in</strong>d that the higher the coefficient <strong>of</strong> variation <strong>of</strong> ra<strong>in</strong>fall <strong>in</strong> the district, the more likely<br />
that households will adopt CF <strong>in</strong> all specifications but CF1 <strong>in</strong> the whole sample. This<br />
supports the hypothesis that farmers perceive CF as a technology that can mitigate the effects<br />
<strong>of</strong> variable ra<strong>in</strong>fall <strong>and</strong> improve the efficiency <strong>of</strong> soil water management. Although we<br />
cannot establish directly that CF decreases the yield variability due to water stress over time,<br />
our f<strong>in</strong>d<strong>in</strong>g that <strong>adoption</strong> is significantly higher <strong>in</strong> areas <strong>of</strong> high ra<strong>in</strong>fall variability provides<br />
evidence for a synergy between CF <strong>and</strong> adaptation to climate variability. This f<strong>in</strong>d<strong>in</strong>g is<br />
strongly robust to various specifications.<br />
The probability <strong>of</strong> <strong>adoption</strong> for CF1 has significantly decreased between 2004 <strong>and</strong> 2008 <strong>in</strong><br />
the whole sample <strong>and</strong> the Eastern prov<strong>in</strong>ce as <strong>in</strong>dicated by the significant <strong>and</strong> negative<br />
coefficient on the 2008 dummy variable. This variable <strong>in</strong>dicates a similar trend <strong>in</strong> the<br />
<strong>adoption</strong> <strong>of</strong> CF2 <strong>in</strong> the whole sample, but an opposite trend <strong>in</strong> the Eastern prov<strong>in</strong>ce, where<br />
the probability <strong>of</strong> <strong>adoption</strong> <strong>of</strong> CF2 has <strong>in</strong>creased significantly between the two panels. The<br />
prov<strong>in</strong>cial dummy variables also show that households <strong>in</strong> the Eastern prov<strong>in</strong>ce are<br />
significantly more likely to adopt CF2 compared to households <strong>in</strong> the reference prov<strong>in</strong>ce <strong>of</strong><br />
Lusaka. These f<strong>in</strong>d<strong>in</strong>gs support our approach <strong>of</strong> model<strong>in</strong>g the Eastern prov<strong>in</strong>ce separately <strong>in</strong><br />
our analysis.<br />
5.2. Intensity <strong>of</strong> <strong>Adoption</strong><br />
Although most applied literature on CA tends to def<strong>in</strong>e <strong>adoption</strong> as a b<strong>in</strong>ary outcome (e.g.,<br />
hav<strong>in</strong>g some area under m<strong>in</strong>imum tillage), it has been accepted that <strong>adoption</strong> is not a b<strong>in</strong>ary<br />
process <strong>and</strong> tends to be partial <strong>and</strong> <strong>in</strong>cremental (Baudron et al. 2007; Umar et al. 2011). In<br />
this section, we present the results <strong>of</strong> our analysis <strong>of</strong> the <strong><strong>in</strong>tensity</strong> <strong>of</strong> <strong>adoption</strong> us<strong>in</strong>g the three<br />
different econometric models as described <strong>in</strong> section 4 above to ensure the consistency <strong>of</strong><br />
results.<br />
Interest<strong>in</strong>gly, most <strong>of</strong> the socio-economic variables that were not significant <strong>in</strong> determ<strong>in</strong><strong>in</strong>g<br />
<strong>adoption</strong> <strong>of</strong> CF1 are significant <strong>in</strong> determ<strong>in</strong><strong>in</strong>g the <strong><strong>in</strong>tensity</strong> <strong>of</strong> CF1 (Table 12). Household<br />
head’s age <strong>and</strong> average education significantly <strong>in</strong>crease the <strong><strong>in</strong>tensity</strong> <strong>of</strong> <strong>adoption</strong> <strong>in</strong> all<br />
specifications. Cultivated l<strong>and</strong> per capita decreases the <strong><strong>in</strong>tensity</strong> <strong>of</strong> <strong>adoption</strong>, <strong>in</strong>dicat<strong>in</strong>g that<br />
labor constra<strong>in</strong>ts play a role <strong>in</strong> farmers’ decisions on how much l<strong>and</strong> to allocate to CF1. The<br />
coefficient on the dependency ratio also supports this argument, though it is not significant <strong>in</strong><br />
the r<strong>and</strong>om effects tobit specification. Agricultural wealth <strong>in</strong>dex negatively affects the<br />
18
Table 12. <strong>Adoption</strong> Intensity <strong>of</strong> CF1/CF2 <strong>in</strong> the Whole Sample<br />
CF1 CF2<br />
R<strong>and</strong>om<br />
L<strong>in</strong>ear R<strong>and</strong>om<br />
L<strong>in</strong>ear<br />
effects Fractional Unobserved effects Fractional Unobserved<br />
Variables<br />
Tobit Probit effects Tobit Probit effects<br />
Female head 0.065 0.069 0.035 -0.208 -0.253 -0.018<br />
Widower head 0.107 0.158 0.040 -0.339* -0.478** -0.026*<br />
Polygamous head -0.056 -0.084 -0.025 0.004 -0.109 -0.011<br />
# Adults (age>=15) 0.004 -0.015 -0.003 0.005 0.009 0.001<br />
Age (head) 0.006** 0.009** 0.003** -0.005 -0.004 -0.000<br />
Education (avg.) 0.029*** 0.035*** 0.011*** 0.019 0.019 0.001<br />
Dependency ratio<br />
Chronically ill<br />
-0.023 -0.064** -0.016* 0.016 -0.010 0.001<br />
(% adults) 0.066 0.055 0.014 -0.087 -0.180 -0.018<br />
L<strong>and</strong> per capita -0.053** -0.403*** -0.023*** -0.009 -0.172*** -0.002*<br />
Ag-wealth <strong>in</strong>dex -0.118*** -0.182*** -0.020*** 0.046 0.050 0.001<br />
Wealth <strong>in</strong>dex 0.020 0.028 0.003 0.019 0.026 0.000<br />
TLU (total)<br />
-0.004<br />
-0.001 0.007 -0.003 -0.000<br />
# Oxen owned -0.029 -0.034 -0.000 -0.039 -0.061 -0.000<br />
ASP dummy<br />
M<strong>in</strong>imum tillage<br />
-0.027 -0.001 -0.011 -0.068* -0.046 -0.013*<br />
extension (% SEA) -0.112 -0.101 -0.042 1.057*** 1.242*** 0.058***<br />
RFE CV -0.435 -0.872 0.077 5.330*** 7.878*** 0.625***<br />
2008 dummy -0.234*** -0.269*** -0.089*** -0.421*** -0.371*** -0.019***<br />
Central -0.112 -0.060 -0.011 0.442 0.433 0.030**<br />
Copperbelt -0.069 -0.029 -0.001 -0.257 -0.444 -0.012<br />
Eastern -0.057 0.033 -0.004 0.726* 0.819*** 0.061***<br />
Luapula -1.115*** -1.497*** -0.415*** 0.211 -0.135 -0.004<br />
Northern -0.327*** -0.429** -0.119 1.099*** 1.011*** 0.074***<br />
NWestern -0.539*** -0.601*** -0.208*** -0.360 -0.621* -0.028**<br />
Southern -0.746*** -0.824*** -0.238*** -0.168 -0.413 -0.012<br />
Western -0.372*** -0.404* -0.157** -0.337 -0.502 -0.026**<br />
Constant 0.769*** 0.498 0.534*** -2.963*** -4.430*** -0.158***<br />
Source: Author calculations based on RILS.<br />
<strong><strong>in</strong>tensity</strong> <strong>of</strong> CF1 <strong>adoption</strong>, this is expectable because the def<strong>in</strong>ition <strong>in</strong>cludes h<strong>and</strong> hoe use,<br />
which is correlated with low agricultural wealth. This variable is not significant when we use<br />
the stricter def<strong>in</strong>ition (CF2).<br />
Although the number <strong>of</strong> oxen was significant <strong>in</strong> determ<strong>in</strong><strong>in</strong>g <strong>adoption</strong>, it is not significant <strong>in</strong><br />
determ<strong>in</strong><strong>in</strong>g the <strong><strong>in</strong>tensity</strong> <strong>of</strong> it. The ASP dummy is not significant, <strong>in</strong>dicat<strong>in</strong>g that this<br />
program did not affect the <strong><strong>in</strong>tensity</strong> <strong>of</strong> <strong>adoption</strong> <strong>of</strong> CF1. The share <strong>of</strong> other households <strong>in</strong> the<br />
SEA that received extension services on m<strong>in</strong>imum tillage does not significantly affect the<br />
<strong><strong>in</strong>tensity</strong> <strong>of</strong> CF1, neither does the coefficient <strong>of</strong> variation <strong>of</strong> historical ra<strong>in</strong>fall <strong>in</strong> the district.<br />
The 2008 dummy <strong>in</strong>dicates that the <strong><strong>in</strong>tensity</strong> <strong>of</strong> <strong>adoption</strong> <strong>of</strong> CF1 decreased significantly<br />
between the two panels, hold<strong>in</strong>g everyth<strong>in</strong>g else constant. The prov<strong>in</strong>cial dummies are<br />
negative <strong>and</strong> significant, <strong>in</strong>dicat<strong>in</strong>g a general downward trend <strong>in</strong> the <strong><strong>in</strong>tensity</strong> <strong>of</strong> CF1 <strong>in</strong> all<br />
prov<strong>in</strong>ces except <strong>in</strong> the Eastern <strong>and</strong> Copperbelt Prov<strong>in</strong>ces.<br />
19
With regard to CF2, the most robust <strong>and</strong> significant variables that <strong>in</strong>crease the <strong><strong>in</strong>tensity</strong> <strong>of</strong><br />
<strong>adoption</strong> are the share <strong>of</strong> households <strong>in</strong> the village that received m<strong>in</strong>imum tillage extension<br />
<strong>and</strong> the CV <strong>of</strong> RFE. Both <strong>of</strong> these variables positively affect the probability <strong>of</strong> CF2 <strong>adoption</strong><br />
as well as its <strong><strong>in</strong>tensity</strong> significantly. The RFE coefficients provide evidence for a synergy<br />
between CF <strong>and</strong> adaptation as perceived by farmers. 23<br />
Table 13 reports the results for the Eastern prov<strong>in</strong>ce only. The results are similar to the<br />
nation-wide results <strong>in</strong> that most <strong>of</strong> the socio-economic variables are not significant <strong>in</strong><br />
determ<strong>in</strong><strong>in</strong>g the <strong><strong>in</strong>tensity</strong> <strong>of</strong> <strong>adoption</strong>. L<strong>and</strong> per capita is negative <strong>and</strong> significant <strong>in</strong> almost all<br />
specifications, <strong>in</strong>dicat<strong>in</strong>g that large l<strong>and</strong>holders allocate a smaller share <strong>of</strong> their l<strong>and</strong> to CF.<br />
The ASP dummy is positive but only significant <strong>in</strong> one specification for CF1, <strong>and</strong> negative<br />
but not significant <strong>in</strong> affect<strong>in</strong>g the CF2 <strong><strong>in</strong>tensity</strong>, fail<strong>in</strong>g to provide evidence that the ASP was<br />
effective <strong>in</strong> promot<strong>in</strong>g CF <strong>in</strong> its areas <strong>of</strong> operation.<br />
As <strong>in</strong> the nation-wide results, the variables with the most robust coefficients are the m<strong>in</strong>imum<br />
tillage <strong>in</strong>formation provision for CF1 <strong>and</strong> the CV <strong>of</strong> ra<strong>in</strong>fall for CF2. The higher the share <strong>of</strong><br />
households that received extension <strong>in</strong>formation on m<strong>in</strong>imum tillage <strong>in</strong> a households SEA, the<br />
higher the <strong><strong>in</strong>tensity</strong> <strong>of</strong> <strong>adoption</strong> <strong>of</strong> CF1. This variable is significant only <strong>in</strong> the tobit<br />
specification for CF2. Households <strong>in</strong> districts with higher CV <strong>of</strong> historical ra<strong>in</strong>fall allocate<br />
Table 13. <strong>Adoption</strong> Intensity CF1/CF2 <strong>in</strong> the Eastern Prov<strong>in</strong>ce<br />
CF1 CF2<br />
R<strong>and</strong>om<br />
L<strong>in</strong>ear R<strong>and</strong>om<br />
L<strong>in</strong>ear<br />
effects Fractional Unobserved effects Fractional Unobserved<br />
Variables Tobit Probit effects Tobit Probit effects<br />
Female head 0.407 0.579 0.119* 0.042 0.006 0.000<br />
Widower head -0.153 -0.300 -0.075 -0.986 -1.120*** -0.110<br />
Polygamous head -0.261 -0.237 -0.063 -0.615* -0.586*** -0.073***<br />
# Adults (age>=15) -0.009 -0.031 -0.005 0.075 0.058 0.008<br />
Age (head) -0.003 -0.002 -0.001 0.005 0.006 0.000<br />
Education (avg.) 0.005 0.008 0.002 0.036 0.035 0.005<br />
Dependency ratio -0.132** -0.207** -0.027 -0.086 -0.038 0.001<br />
Chronically ill<br />
(% adults) -0.105 -0.227 -0.023 0.388 0.090 -0.003<br />
L<strong>and</strong> per capita -0.422*** -1.045*** -0.084** -0.182 -0.321** -0.017**<br />
Ag-wealth <strong>in</strong>dex -0.039 -0.157 0.005 0.119 0.072 0.005<br />
Wealth <strong>in</strong>dex -0.015 0.100 -0.011 -0.045 -0.028 -0.001<br />
TLU (total) -0.023 -0.079** -0.006 -0.055 -0.041 -0.002<br />
# Oxen owned -0.129* -0.186 -0.017 -0.124 -0.106* -0.005<br />
ASP dummy<br />
M<strong>in</strong>imum tillage<br />
0.237* 0.459 0.073 -0.136 -0.071 -0.016<br />
extension (% SEA) 1.436*** 2.213*** 0.365*** 1.015** 0.680 0.075<br />
RFE CV<br />
7.049*** 11.137 2.140<br />
11.240**<br />
*<br />
8.807** 1.114**<br />
2008 dummy -1.168*** -1.680*** -0.326*** 0.246 0.158 0.018<br />
Constant -1.115 -2.515 -0.014 -4.682*** -3.929*** -0.226<br />
Source: Author calculations based on RILS.<br />
significantly bigger shares <strong>of</strong> their total cultivated l<strong>and</strong> to CF2 further support<strong>in</strong>g the role <strong>of</strong><br />
CF <strong>in</strong> manag<strong>in</strong>g soil moisture <strong>in</strong> semi-arid climates.<br />
23<br />
These results are robust to the exclusion <strong>of</strong> the Northern prov<strong>in</strong>ce to accommodate the cod<strong>in</strong>g issues related to<br />
the practice <strong>of</strong> chitemene. The results without the Northern prov<strong>in</strong>ce can be provided upon request.<br />
20
We f<strong>in</strong>d that the <strong><strong>in</strong>tensity</strong> <strong>of</strong> <strong>adoption</strong> decreased significantly <strong>in</strong> the Eastern Prov<strong>in</strong>ce only for<br />
CF1 as <strong>in</strong>dicated by the coefficient <strong>of</strong> the 2008 dummy. For CF2, on the other h<strong>and</strong>, the trend<br />
was positive, though not significant. Eastern prov<strong>in</strong>ce, therefore, seems to be on a different<br />
path than the rest <strong>of</strong> the country both <strong>in</strong> terms <strong>of</strong> <strong>adoption</strong> <strong>and</strong> its <strong><strong>in</strong>tensity</strong>.<br />
5.3. <strong>Adoption</strong> <strong>and</strong> Intensity <strong>of</strong> <strong>Adoption</strong> <strong>in</strong> the 2008 Cross-section<br />
The panel data models presented above are limited to some extent <strong>in</strong> terms <strong>of</strong> explanatory<br />
variables, because they can only utilize <strong>in</strong>formation that was collected <strong>in</strong> the same way <strong>in</strong><br />
both years. The RILS <strong>in</strong> 2008 collected a richer set <strong>of</strong> household variables that may play a<br />
role <strong>in</strong> farmers’ <strong>adoption</strong> decisions, as well as a community survey that collected important<br />
<strong>in</strong>formation from village headmen. The household variables <strong>of</strong> <strong>in</strong>terest that only exist <strong>in</strong> 2008<br />
are: the ownership status <strong>of</strong> cultivated l<strong>and</strong>; household’s k<strong>in</strong>ship ties to the village chief;<br />
households’ status as a local; <strong>and</strong> access to cell phones. We would expect that households<br />
would be more likely to adopt CF on their own l<strong>and</strong> given the time delay <strong>in</strong> realiz<strong>in</strong>g most <strong>of</strong><br />
the benefits <strong>of</strong> CF. A household with k<strong>in</strong>ship ties to the village chief or one that considers<br />
itself as an established local household may have better access to extension <strong>in</strong>formation that<br />
is usually provided by lead-farmers. Access to a cell phone is also expected to improve<br />
households’ access to <strong>in</strong>formation on prices <strong>and</strong> markets as well as extension services related<br />
to CF.<br />
The 2008 community survey <strong>in</strong>cludes <strong>in</strong>formation on the share <strong>of</strong> l<strong>and</strong> that is not allocated to<br />
<strong>in</strong>dividuals also whether cultivable l<strong>and</strong> is available <strong>in</strong> the village. Both <strong>of</strong> these variables<br />
capture the scale <strong>of</strong> l<strong>and</strong> scarcity <strong>in</strong> the community, which we expect would affect <strong>adoption</strong><br />
decisions. There would be less scope for shift<strong>in</strong>g cultivation <strong>and</strong> l<strong>and</strong> expansion <strong>in</strong><br />
communities with smaller unallocated <strong>and</strong> cultivable l<strong>and</strong>, mak<strong>in</strong>g households more likely to<br />
undertake activities to improve their productivity on exist<strong>in</strong>g l<strong>and</strong>. We, therefore, expect both<br />
<strong>of</strong> these variables to negatively affect <strong>adoption</strong> <strong>and</strong> its <strong><strong>in</strong>tensity</strong>. We also have data on<br />
communities’ distances to a tarmac road <strong>and</strong> a marketplace. Access to roads <strong>and</strong> markets may<br />
make a household more likely to participate <strong>in</strong> non-farm activities, hence less likely to adopt<br />
new technologies on-farm. They may, on the other h<strong>and</strong>, improve access to seeds, open up<br />
new venues for sales, <strong>and</strong> act as centers <strong>of</strong> <strong>in</strong>formation exchange, which <strong>in</strong> turn would<br />
<strong>in</strong>crease the <strong>in</strong>centives to adopt new technologies. The expected effects <strong>of</strong> these variables are<br />
therefore ambiguous. The number <strong>of</strong> local sell<strong>in</strong>g po<strong>in</strong>ts is expected to <strong>in</strong>crease <strong>adoption</strong> by<br />
giv<strong>in</strong>g farmers <strong>in</strong>centive to <strong>in</strong>crease production that they can market. The number <strong>of</strong><br />
households <strong>in</strong> the village is also relevant to control for the effects <strong>of</strong> social networks <strong>and</strong><br />
<strong>in</strong>centives for common property management. For example, the bigger the community the<br />
harder it would be to establish or change communal norms to control livestock graz<strong>in</strong>g after<br />
harvest, which is one <strong>of</strong> the ma<strong>in</strong> impediments to leav<strong>in</strong>g crop residue on the plot as part <strong>of</strong><br />
CF. Bigger communities may also make it harder for <strong>in</strong>formation to diffuse from farmer to<br />
farmer, negatively affect<strong>in</strong>g <strong>in</strong>centives to adopt.<br />
Unconditional differences <strong>in</strong> these variables between adopters <strong>and</strong> non-adopters <strong>of</strong> CF2 are<br />
presented table 14. All household variables but the share <strong>of</strong> own l<strong>and</strong> <strong>in</strong> cultivated l<strong>and</strong> have<br />
the expected sign <strong>in</strong> unconditional differences. Community variables also show mostly<br />
expected differences between adopters <strong>and</strong> non-adopters. Adopters live <strong>in</strong> villages that have<br />
significantly smaller shares <strong>of</strong> unallocated l<strong>and</strong> <strong>and</strong> are more isolated. They also are closer to<br />
local markets <strong>and</strong> have more sell<strong>in</strong>g po<strong>in</strong>ts <strong>in</strong> the community.<br />
21
Table 14. Additional Household <strong>and</strong> Community Variables by CF2 Status <strong>in</strong> 2008<br />
Non- CF2 CF2<br />
Household variables<br />
Share <strong>of</strong> own l<strong>and</strong> <strong>in</strong> cultivated l<strong>and</strong> 0.97 0.97<br />
HH has k<strong>in</strong>ship ties to the chief 0.47*** 0.57***<br />
HH is considered local 0.81*** 0.88***<br />
HH has access to a cell phone<br />
Community variables<br />
0.44** 0.51**<br />
Unallocated l<strong>and</strong> (%) 25.77*** 20.83***<br />
Cultivable l<strong>and</strong> available 0.44 0.47<br />
Distance to tarmac road (km) 40.73** 48.65**<br />
Distance to market (km) 20.33** 17.06**<br />
# <strong>of</strong> local sell<strong>in</strong>g po<strong>in</strong>ts 1.39*** 3.52***<br />
# <strong>of</strong> households 87.05<br />
Source: Author calculations based on RILS.<br />
85.91<br />
In order to underst<strong>and</strong> the conditional effects <strong>of</strong> these variables on <strong>adoption</strong> <strong>and</strong> its <strong><strong>in</strong>tensity</strong>,<br />
we use the same model specifications as above but only for 2008, for which we have the rich<br />
set <strong>of</strong> variables as discussed above <strong>and</strong> a much larger sample than the panel sample. Although<br />
the panel data models used above have significant advantages over the more commonly<br />
found cross-sectional analyses <strong>in</strong> the literature, we can still ga<strong>in</strong> some <strong>in</strong>sights <strong>in</strong>to variables<br />
affect<strong>in</strong>g farmers’ <strong>adoption</strong> decisions us<strong>in</strong>g only the cross-sectional variation <strong>in</strong> the larger<br />
sample <strong>and</strong> the richer set <strong>of</strong> variables available <strong>in</strong> the 2008 survey.<br />
For the cross sectional analysis we only present the results <strong>of</strong> one specification for each<br />
outcome variable for the stricter def<strong>in</strong>ition <strong>of</strong> CF (CF2) <strong>in</strong> table 15: probit model for<br />
<strong>adoption</strong> probabilities, <strong>and</strong> the pooled fractional probit (GLM) model for the <strong><strong>in</strong>tensity</strong> <strong>of</strong><br />
<strong>adoption</strong>. 24<br />
We f<strong>in</strong>d that female headed households are more likely to adopt CF <strong>and</strong> allocate bigger<br />
shares <strong>of</strong> their l<strong>and</strong> to CF <strong>in</strong> the Eastern prov<strong>in</strong>ce, though this effect was muted <strong>in</strong> panel<br />
regressions that control for household fixed effects. Cross-sectional coefficients <strong>of</strong> l<strong>and</strong> per<br />
capita <strong>in</strong>dicate that although labor is not a constra<strong>in</strong>t <strong>in</strong> front <strong>of</strong> <strong>adoption</strong>, it is negatively<br />
correlated with the <strong><strong>in</strong>tensity</strong> <strong>of</strong> <strong>adoption</strong> both <strong>in</strong> the whole sample <strong>and</strong> <strong>in</strong> the Eastern<br />
prov<strong>in</strong>ce. We f<strong>in</strong>d that households with lower agricultural wealth <strong>in</strong>dices are significantly<br />
less likely to adopt <strong>and</strong> allocate less l<strong>and</strong> to CF <strong>in</strong> the whole sample, though this variable<br />
also loses significance when we control for household fixed effects, therefore only<br />
suggestive. The negative <strong>and</strong> significant effect <strong>of</strong> the number <strong>of</strong> oxen owned we found <strong>in</strong><br />
panel models <strong>of</strong> <strong>adoption</strong> stays equally significant <strong>in</strong> cross sectional models, <strong>in</strong>dicat<strong>in</strong>g that<br />
number <strong>of</strong> oxen is a very robust predictor <strong>of</strong> <strong>adoption</strong> <strong>of</strong> CF <strong>practices</strong> <strong>and</strong> their <strong><strong>in</strong>tensity</strong> <strong>in</strong><br />
<strong>Zambia</strong>. The percentage <strong>of</strong> households <strong>in</strong> the SEA that received extension <strong>in</strong>formation on<br />
m<strong>in</strong>imum tillage is another variable with similarly robust effects on <strong>adoption</strong> <strong>in</strong> both crosssectional<br />
<strong>and</strong> panel models. The higher this percentage, the more likely are households to<br />
adopt <strong>and</strong> the bigger the share <strong>of</strong> l<strong>and</strong> they devote to CF.<br />
24 The results <strong>of</strong> the other specifications for CA2 <strong>and</strong> all specifications for CA1 can be provided upon request.<br />
22
Table 15. Cross-sectional Models for Probability <strong>and</strong> Intensity <strong>of</strong> CF2 <strong>Adoption</strong>, 2008<br />
Whole Sample Eastern Prov<strong>in</strong>ce<br />
Variables <strong>Adoption</strong> Intensity <strong>Adoption</strong> Intensity<br />
Female head 0.055 0.100 0.217** 0.167*<br />
Widower head -0.217 -0.328 0.084 -0.409<br />
Polygamous head 0.043 0.041 0.013 -0.044<br />
# Adults (age>=15) 0.011 0.003 0.074* 0.036<br />
Age (head) 0.002 0.002 0.002 0.003<br />
Education (avg.) 0.004 -0.000 -0.026 -0.022<br />
Dependency ratio -0.025 -0.019 -0.007 -0.041<br />
Chronically ill (% adults) 0.208 0.325 0.620 0.635<br />
L<strong>and</strong> per capita 0.008 -0.140** 0.024 -0.251**<br />
Ag-wealth <strong>in</strong>dex -0.091** -0.076* -0.041 -0.038<br />
Wealth <strong>in</strong>dex -0.001 0.057 -0.275 -0.235<br />
TLU (total) 0.008 -0.003 -0.005 0.003<br />
# Oxen owned -0.094** -0.099** -0.228*** -0.200***<br />
ASP dummy 0.008 -0.113 -0.127 -0.188<br />
M<strong>in</strong>imum tillage extension<br />
(% SEA) 0.832*** 0.835*** 0.700* 0.649*<br />
RFE CV 6.167** 3.550 3.903 3.203<br />
Additional variables<br />
Own l<strong>and</strong> (%) -0.043 -0.257 -0.334 -0.505*<br />
K<strong>in</strong>ship ties to the chief 0.040 0.024 0.193* 0.089<br />
Local household -0.110 -0.114 -0.403 -0.310<br />
Cell phone 0.047 0.062 0.199* 0.125<br />
Village unallocated l<strong>and</strong> (%) -0.001 -0.001 0.001 -0.001<br />
Cultivable l<strong>and</strong> available 0.200* 0.210** 0.159 0.204<br />
Distance to road (km) 0.003** 0.001 0.003 0.002<br />
Distance to market (km) 0.000 0.000 0.003 0.001<br />
# <strong>of</strong> local sell<strong>in</strong>g po<strong>in</strong>ts 0.023** 0.021*** 0.023** 0.021***<br />
Number <strong>of</strong> Observations 7,343 7,343 1,478 1,478<br />
Source: Author calculations based on RILS.<br />
Note: All st<strong>and</strong>ard errors are clustered around st<strong>and</strong>ard enumeration areas to control for the error correlation<br />
across households <strong>in</strong> the same SEA. The coefficients for the number <strong>of</strong> households are not presented because it<br />
was nil <strong>and</strong> <strong>in</strong>significant <strong>in</strong> all specifications.<br />
One <strong>of</strong> our ma<strong>in</strong> f<strong>in</strong>d<strong>in</strong>gs based on panel models was that both <strong>adoption</strong> <strong>and</strong> its <strong><strong>in</strong>tensity</strong><br />
<strong>in</strong>crease with the CV <strong>in</strong> historical ra<strong>in</strong>fall. Cross sectional results presented above fail to<br />
support this hypothesis (except <strong>in</strong> the case <strong>of</strong> <strong>adoption</strong> <strong>in</strong> the whole sample) suggest<strong>in</strong>g that<br />
some unobservable time-<strong>in</strong>variant household characteristics that are correlated with both the<br />
historical ra<strong>in</strong>fall <strong>and</strong> <strong>adoption</strong> decisions (such as the ability to respond to weather shocks)<br />
confound the effect <strong>of</strong> ra<strong>in</strong>fall variation <strong>in</strong> the cross-sectional models above.<br />
The ma<strong>in</strong> po<strong>in</strong>t <strong>of</strong> this cross-sectional exercise is to create suggestive evidence for effects <strong>of</strong><br />
variables that could not be <strong>in</strong>cluded <strong>in</strong> panel models <strong>of</strong> <strong>adoption</strong> <strong>and</strong> its <strong><strong>in</strong>tensity</strong>. The<br />
proportion <strong>of</strong> owned l<strong>and</strong> <strong>in</strong> total cultivated l<strong>and</strong> was expected to affect both <strong>adoption</strong> <strong>and</strong> its<br />
<strong><strong>in</strong>tensity</strong> positively as farmers have more <strong>in</strong>centives to <strong>in</strong>vest <strong>in</strong> long term projects on their<br />
23
own l<strong>and</strong>. However, the coefficient <strong>of</strong> this variable is not significant, except <strong>in</strong> the <strong><strong>in</strong>tensity</strong><br />
model <strong>in</strong> the Eastern prov<strong>in</strong>ce, suggest<strong>in</strong>g that farmers are less likely to adopt <strong>and</strong> do so less<br />
<strong>in</strong>tensively if they own more <strong>of</strong> their cultivated l<strong>and</strong> there. Households with k<strong>in</strong>ship ties to<br />
the village chief are significantly more likely to adopt CF <strong>in</strong> the Eastern prov<strong>in</strong>ce, suggest<strong>in</strong>g<br />
that k<strong>in</strong>ship ties may help improve access to extension or equipment <strong>in</strong> this prov<strong>in</strong>ce. The<br />
<strong>in</strong>dicator variable for local households is not significant <strong>in</strong> any <strong>of</strong> the specifications.<br />
The probability <strong>of</strong> <strong>adoption</strong> <strong>and</strong> its <strong><strong>in</strong>tensity</strong> are significantly higher <strong>in</strong> communities where<br />
the headman <strong>in</strong>dicate that cultivable l<strong>and</strong> is available <strong>in</strong> the community if a new household<br />
would like to settle there. The coefficient on the distance to a tarmac road is only significant<br />
<strong>in</strong> the <strong>adoption</strong> regression <strong>in</strong> the whole sample, though the coefficient is very small. The only<br />
new variable that is strongly significant across the board is the number <strong>of</strong> sell<strong>in</strong>g po<strong>in</strong>ts <strong>in</strong> the<br />
village. The more sell<strong>in</strong>g po<strong>in</strong>ts <strong>in</strong> the village the more likely are the households to adopt <strong>and</strong><br />
on bigger portions <strong>of</strong> their l<strong>and</strong>. This f<strong>in</strong>d<strong>in</strong>g strongly <strong>in</strong>dicates that hav<strong>in</strong>g more<br />
opportunities to sell farm products gives farmers <strong>in</strong>centives to adopt <strong>practices</strong> to <strong>in</strong>crease<br />
productivity. The lack <strong>of</strong> opportunities to market the output from cover crops has been<br />
mentioned as one <strong>of</strong> the constra<strong>in</strong>ts for <strong>adoption</strong> <strong>of</strong> CA <strong>in</strong> the literature. Though we do not<br />
have data on cover crops, the f<strong>in</strong>d<strong>in</strong>g that <strong>adoption</strong> <strong>and</strong> its <strong><strong>in</strong>tensity</strong> are higher <strong>in</strong> villages with<br />
more sell<strong>in</strong>g po<strong>in</strong>ts suggests that the marketability constra<strong>in</strong>t plays a role <strong>in</strong> farmers’ <strong>adoption</strong><br />
decisions.<br />
24
6. CONCLUSIONS<br />
This paper contributes to literature on agricultural technology <strong>adoption</strong> by us<strong>in</strong>g a novel data<br />
set that comb<strong>in</strong>es data from two large-scale household surveys with historical ra<strong>in</strong>fall data to<br />
underst<strong>and</strong> the determ<strong>in</strong>ants <strong>and</strong> the <strong><strong>in</strong>tensity</strong> <strong>of</strong> <strong>adoption</strong> <strong>of</strong> two ma<strong>in</strong> components <strong>of</strong> CF <strong>in</strong><br />
<strong>Zambia</strong>: m<strong>in</strong>imum/zero tillage <strong>and</strong> plant<strong>in</strong>g bas<strong>in</strong>s. We document high levels <strong>of</strong> dis-<strong>adoption</strong><br />
(around 95%) <strong>in</strong> the whole country, while dis-<strong>adoption</strong> <strong>in</strong> the Eastern prov<strong>in</strong>ce – the hub <strong>of</strong><br />
CA projects <strong>in</strong> <strong>Zambia</strong> – is significantly lower. Nationwide only 5% <strong>of</strong> the households<br />
practiced CA <strong>in</strong> 2008, down from 13% <strong>in</strong> 2004, which raises the question <strong>of</strong> the widespread<br />
suitability <strong>of</strong> this practice. Eastern prov<strong>in</strong>ce is the only prov<strong>in</strong>ce with a significant <strong>in</strong>crease <strong>in</strong><br />
<strong>adoption</strong> rates between the survey years: 14% <strong>in</strong> 2008, up from 8%.<br />
Our econometric analyses based on panel data methods that control for time-<strong>in</strong>variant<br />
household characteristics fail to provide evidence for the <strong>of</strong>t mentioned determ<strong>in</strong>ants <strong>of</strong><br />
<strong>adoption</strong> <strong>in</strong> the literature. We f<strong>in</strong>d no evidence for the role <strong>of</strong> labor constra<strong>in</strong>ts, age, or<br />
education <strong>in</strong> <strong>adoption</strong> decisions. These results suggest that most socio-economic variables are<br />
correlated with household level un-observables (e.g., farmer ability or openness to<br />
<strong>in</strong>novation) <strong>in</strong> cross-sectional studies confound<strong>in</strong>g the effects <strong>of</strong> variables <strong>in</strong>cluded <strong>in</strong><br />
analyses. We do, however, f<strong>in</strong>d that the <strong><strong>in</strong>tensity</strong> <strong>of</strong> <strong>adoption</strong> is negatively affected by l<strong>and</strong><br />
per capita – another <strong>in</strong>dicator <strong>of</strong> labor constra<strong>in</strong>t.<br />
We f<strong>in</strong>d a very strong <strong>and</strong> robust relationship between the district level variation <strong>in</strong> historical<br />
ra<strong>in</strong>fall dur<strong>in</strong>g the grow<strong>in</strong>g season <strong>and</strong> <strong>adoption</strong> as well as the <strong><strong>in</strong>tensity</strong> <strong>of</strong> <strong>adoption</strong> <strong>of</strong> the<br />
analysed CF <strong>practices</strong> <strong>in</strong> <strong>Zambia</strong>. This f<strong>in</strong>d<strong>in</strong>g suggests that farmers are us<strong>in</strong>g m<strong>in</strong>imum<br />
tillage/plant<strong>in</strong>g bas<strong>in</strong>s as a strategy to mitigate the risk <strong>of</strong> ra<strong>in</strong>fall variability, provid<strong>in</strong>g<br />
evidence – albeit <strong>in</strong>directly – <strong>of</strong> a synergy between these <strong>practices</strong> <strong>and</strong> adaptation to climate<br />
variability. Further research is needed to directly assess whether CF decreases yield<br />
variability over time as suggested by these f<strong>in</strong>d<strong>in</strong>gs.<br />
Another robust f<strong>in</strong>d<strong>in</strong>g is that the reach <strong>of</strong> extension services <strong>in</strong> a village (i.e., the proportion<br />
<strong>of</strong> households that received <strong>in</strong>formation on m<strong>in</strong>imum tillage) positively affects both <strong>adoption</strong><br />
<strong>and</strong> the <strong><strong>in</strong>tensity</strong> <strong>of</strong> <strong>adoption</strong>. A key outst<strong>and</strong><strong>in</strong>g question however, is the degree to which<br />
extension services <strong>in</strong>cluded the provision <strong>of</strong> subsidized <strong>in</strong>puts, which is not possible to<br />
dist<strong>in</strong>guish <strong>in</strong> this dataset. Underst<strong>and</strong><strong>in</strong>g the respective importance <strong>of</strong> <strong>in</strong>formation <strong>and</strong><br />
subsidized <strong>in</strong>put provision is essential to design future programs for CF promotion –<br />
especially <strong>in</strong> locations with highly variable ra<strong>in</strong>fall.<br />
Eastern prov<strong>in</strong>ce demonstrates a different trend than the rest <strong>of</strong> the country <strong>in</strong> that there was<br />
an upward trend <strong>in</strong> the probability <strong>of</strong> <strong>adoption</strong> for an average household <strong>and</strong> no significant<br />
downward trend <strong>in</strong> the <strong><strong>in</strong>tensity</strong> <strong>of</strong> <strong>adoption</strong>. This suggests that the long history <strong>of</strong> CF<br />
activities <strong>in</strong> the prov<strong>in</strong>ce (comb<strong>in</strong>ed with its specific agro-ecological conditions suitable for<br />
CF) may have had an effect on <strong>adoption</strong> rates there. Given the still high dis-<strong>adoption</strong> rates <strong>in</strong><br />
this prov<strong>in</strong>ce, however, further research is needed to underst<strong>and</strong> the <strong>in</strong>stitutional sett<strong>in</strong>gs <strong>of</strong><br />
various projects <strong>and</strong> how they affect the <strong>adoption</strong> <strong>of</strong> CF <strong>practices</strong>.<br />
To summarize: CF as practiced <strong>in</strong> <strong>Zambia</strong> seems well-suited to respond to the key agroecological<br />
constra<strong>in</strong>t <strong>of</strong> highly variable ra<strong>in</strong>fall patterns. The provision <strong>of</strong> extension services<br />
is another consistent <strong>and</strong> powerful explanatory variable <strong>in</strong> determ<strong>in</strong><strong>in</strong>g <strong>adoption</strong> patterns.<br />
Better <strong>in</strong>formation on what exactly these extension services <strong>in</strong>cluded, <strong>and</strong> particularly the<br />
degree to which they <strong>in</strong>volved subsidized <strong>in</strong>puts, is needed before an assessment <strong>of</strong> the<br />
potential effectiveness <strong>and</strong> susta<strong>in</strong>ability <strong>of</strong> further extension efforts for promot<strong>in</strong>g CF can be<br />
made.<br />
25
The results should be <strong>in</strong>terpreted with a caveat <strong>in</strong> m<strong>in</strong>d: this paper analyses the <strong>adoption</strong> <strong>and</strong><br />
dis-<strong>adoption</strong> <strong>of</strong> two CF <strong>practices</strong>, not the whole package. Inasmuch as m<strong>in</strong>imum soil<br />
disturbance <strong>practices</strong> analysed here are an essential component <strong>of</strong> CF, results are still<br />
important for underst<strong>and</strong><strong>in</strong>g the determ<strong>in</strong>ants <strong>of</strong> farmer decisions regard<strong>in</strong>g CF. Future<br />
research will try to <strong>in</strong>corporate more CF <strong>practices</strong> as permitted by our ma<strong>in</strong> data source, use<br />
higher resolution RFE data, as well as use other geo-referenced variables such as soil nutrient<br />
availability <strong>and</strong> the historical delays <strong>in</strong> the onset <strong>of</strong> the ra<strong>in</strong>y season.<br />
26
REFERENCES<br />
Ajayi, O.C., S. Franzel, E. Kuntashula, <strong>and</strong> F. Kwesiga. 2003. <strong>Adoption</strong> <strong>of</strong> Improved Fallow<br />
Technology for Soil Fertility Management <strong>in</strong> <strong>Zambia</strong>: Empirical Studies <strong>and</strong><br />
Emerg<strong>in</strong>g Issues. Agr<strong>of</strong>orestry Systems 59: 317-26.<br />
Ajayi, O.C., F.K. Ak<strong>in</strong>nifesi, G. Sileshi, <strong>and</strong> S. Chakeredza. 2007. <strong>Adoption</strong> <strong>of</strong> Renewable<br />
Soil Fertility Replenishment Technologies <strong>in</strong> the Southern African Region: Lessons<br />
Learnt <strong>and</strong> the Way Forward. Natural Resources Forum 31.4: 306-17.<br />
Arslan, Aslihan <strong>and</strong> J. Edward Taylor. 2009. Farmers’ Subjective Valuation <strong>of</strong> Subsistence<br />
Crops: The Case <strong>of</strong> Traditional Maize <strong>in</strong> Mexico. American Journal <strong>of</strong> Agricultural<br />
Economics 91.4: 956-72.<br />
Baudron, Frédéric, Herbert M. Mwanza, Bernard Triomphe, <strong>and</strong> Mart<strong>in</strong> Bwalya. 2007.<br />
Conservation Agriculture <strong>in</strong> <strong>Zambia</strong>: A Case Study <strong>of</strong> Southern Prov<strong>in</strong>ce. Nairobi:<br />
African Conservation Tillage Network, Centre de Coopération Internationale de<br />
Recherche Agronomique pour le Développement, <strong>and</strong> Food <strong>and</strong> Agriculture<br />
Organization <strong>of</strong> the United Nations.<br />
Bellon, R.M. <strong>and</strong> J.E. Taylor. 1993. Folk Soil Taxonomy <strong>and</strong> the Partial <strong>Adoption</strong> <strong>of</strong><br />
New Seed Varieties. Economic Development <strong>and</strong> Cultural Change 41.4: 763-86.<br />
Bishop-Sambrook, C., J. Kienzle, W. Mariki, M. Owenya, <strong>and</strong> F. Ribeiro. 2004.<br />
Conservation Agriculture as a Labour Sav<strong>in</strong>g Practice for Vulnerable Households. A<br />
Study <strong>of</strong> the Suitability <strong>of</strong> Reduced Tillage <strong>and</strong> Cover Crops for Households under<br />
Labour Stress <strong>in</strong> Babati <strong>and</strong> Karatu Districts, Northern Tanzania. Rome: International<br />
Fund for Agricultural Development <strong>and</strong> FAO.<br />
Blanco, H. <strong>and</strong> R. Lal. 2008. Pr<strong>in</strong>ciples <strong>of</strong> Soil Conservation <strong>and</strong> Management. New York:<br />
Spr<strong>in</strong>ger.<br />
CFU. 2007. Conservation Farm<strong>in</strong>g <strong>and</strong> Conservation Agriculture H<strong>and</strong>book for Hoe Farmers<br />
<strong>in</strong> Agro-Ecological Regions I <strong>and</strong> IIa. Accessed on 20 August, 2012.<br />
http://www.fsnnetwork.org/sites/default/files/<strong>conservation</strong>_agriculture__cf_h<strong>and</strong>book<br />
_for_hoe_farmers_zambia.pdf<br />
Chamberla<strong>in</strong>, G. 1980. Analysis <strong>of</strong> Variance with Qualitative Data. Review <strong>of</strong> Economic<br />
Studies 47: 225-38.<br />
Chikowo, Regis. 2011. Climatic Risk Analysis <strong>in</strong> CA <strong>in</strong> Varied Biophysical <strong>and</strong> Socio-<br />
Economic Sett<strong>in</strong>gs <strong>of</strong> Southern Africa. FAO Network Paper No. 03. Johannesburg:<br />
Regional Emergency Office for Southern Africa (REOSA).<br />
Chomba, Ge<strong>of</strong>frey Ndawa. 2004. Factors Affect<strong>in</strong>g Smallholder Farmers’ <strong>Adoption</strong> <strong>of</strong> Soil<br />
<strong>and</strong> Water Conservation Practices <strong>in</strong> <strong>Zambia</strong>. M.Phil. Thesis, Michigan State<br />
University.<br />
Clay, D., T. Reardon, <strong>and</strong> J. Kangasniemi. 1998. Susta<strong>in</strong>able Intensification <strong>in</strong> the Highl<strong>and</strong><br />
Tropics: Rw<strong>and</strong>an Farmers’ Investments <strong>in</strong> L<strong>and</strong> Conservation <strong>and</strong> Soil Fertility.<br />
Economic Development <strong>and</strong> Cultural Change 45.2: 351-78.<br />
27
CSO 2004. Rural Income <strong>and</strong> Livelihoods Survey 2004. Second Supplemental Survey to the<br />
1999/00 Post Harvest Survey. Interviewers’ Instruction Manual. Lusaka, <strong>Zambia</strong>:<br />
Central Statistical Office, Republic <strong>of</strong> <strong>Zambia</strong>.<br />
CSO 2008. Rural Income <strong>and</strong> Livelihoods Survey 2008. Third Supplemental Survey to the<br />
1999/00 Post Harvest Survey. Interviewers’ Instruction Manual. Lusaka, <strong>Zambia</strong>:<br />
Central Statistical Office, Republic <strong>of</strong> <strong>Zambia</strong>.<br />
de Janvry, Ala<strong>in</strong>, M. Fafchamps, <strong>and</strong> E. Sadoulet. 1991. Peasant Household Behaviour with<br />
Miss<strong>in</strong>g Markets: Some Paradoxes Expla<strong>in</strong>ed. The Economic Journal 101: 1400-17.<br />
FAO 2012. “What is CA?” “Pr<strong>in</strong>ciples <strong>of</strong> CA.” “Benefits <strong>of</strong> CA.” Accessed on<br />
12 December, 2012. http://www.fao.org/ag/ca/<strong>in</strong>dex.html<br />
http://www.fao.org/ag/ca/1a.html;<br />
http://www.fao.org/ag/ca/1b.html; <strong>and</strong><br />
http://www.fao.org/ag/ca/1c.html<br />
Feder, G. 1980. Farm Size, Risk Aversion <strong>and</strong> the <strong>Adoption</strong> <strong>of</strong> New Technology under<br />
Uncerta<strong>in</strong>ty. Oxford Economic Papers 32: 263-83.<br />
Feder, G., R. Just, <strong>and</strong> D. Zilberman. 1985. <strong>Adoption</strong> <strong>of</strong> Agricultural Innovations <strong>in</strong><br />
Develop<strong>in</strong>g Countries: A Survey. Economic Development <strong>and</strong> Cultural Change 33.2:<br />
255-98.<br />
Franzel, S., G.L. Denn<strong>in</strong>g, J-P. Lillesø-Barnekow, <strong>and</strong> A.R. Mercado. 2004. Scal<strong>in</strong>g Up the<br />
Impact <strong>of</strong> Agr<strong>of</strong>orestry: Lessons from Three Sites <strong>in</strong> Africa <strong>and</strong> Asia. World<br />
Agr<strong>of</strong>orestry Centre, Kenya <strong>and</strong> the Philipp<strong>in</strong>es. Agr<strong>of</strong>orestry Systems 61-62.1-3:<br />
329-44.<br />
Giller, Ken E., Ernst Witter, Marc Corbeels, <strong>and</strong> Pablo Tittonell. 2009. Conservation<br />
Agriculture <strong>and</strong> Smallholder Farm<strong>in</strong>g <strong>in</strong> Africa: The Heretic’s View. Field Crops<br />
Research 114.1: 23-34.<br />
Haggblade, Steven <strong>and</strong> Gelson Tembo. 2003. Conservation Farm<strong>in</strong>g <strong>in</strong> <strong>Zambia</strong>. Environment<br />
<strong>and</strong> Production Technology Division (EPTD) Discussion Paper No. 108. Wash<strong>in</strong>gton,<br />
D.C.: International Food Policy Research Institute (IFPRI).<br />
Haggblade, S., S. Kabwe, <strong>and</strong> C. Plerhoples. 2011. Productivity Impact <strong>of</strong> Conservation<br />
Farm<strong>in</strong>g on Smallholder Cotton Farmers <strong>in</strong> <strong>Zambia</strong>. FSRP Work<strong>in</strong>g Paper No. 47.<br />
Lusaka, <strong>Zambia</strong>: Food Security Research Project.<br />
Hobbs, P.R., K. Sayre, <strong>and</strong> R. Gupta. 2008. The Role <strong>of</strong> Conservation Agriculture <strong>in</strong><br />
Susta<strong>in</strong>able Agriculture. Philosophical Transactions <strong>of</strong> the Royal Society 363.1491:<br />
543-55.<br />
IFAD 2011. Smallholder Conservation Agriculture: Rationale for IFAD Involvement <strong>and</strong><br />
Relevance to the East <strong>and</strong> Southern Africa Region. IFAD Unnumbered Work<strong>in</strong>g<br />
Paper. Rome, Italy: International Fund for Agricultural Development (IFAD).<br />
28
IIRR <strong>and</strong> ACT 2005. Conservation Agriculture: A Manual for Farmers <strong>and</strong> Extension<br />
Workers <strong>in</strong> Africa. Nairobi: International Institute <strong>of</strong> Rural Reconstruction (IIRR);<br />
Harare: African Conservation Tillage Network.<br />
Just, R. <strong>and</strong> D. Zilberman. 1983. Stochastic Structure, Farm Size <strong>and</strong> Technology <strong>Adoption</strong><br />
<strong>in</strong> Develop<strong>in</strong>g Agriculture. Oxford Economic Papers, New Series 35.2: 307-28.<br />
Kabwe, Steven <strong>and</strong> Cynthia Donovan. 2005. Susta<strong>in</strong>ed Use <strong>of</strong> Conservation Farm<strong>in</strong>g<br />
Practices among Small <strong>and</strong> Medium Scale Farmers <strong>in</strong> <strong>Zambia</strong>. Unnumbered FSRP<br />
Work<strong>in</strong>g Paper. Lusaka: FSRP.<br />
http://www.aec.msu.edu/fs2/zambia/WCCA_CF_<strong>adoption</strong>_paper_Oct_2005.pdf<br />
Knowler, Duncan <strong>and</strong> Ben Bradshaw. 2007. Farmers’ <strong>Adoption</strong> <strong>of</strong> Conservation Agriculture:<br />
A Review <strong>and</strong> Synthesis <strong>of</strong> Recent Research. Food Policy 32.1: 25- 48.<br />
Mazvimavi, Kizito. 2011. Socio-economic Analysis <strong>of</strong> Conservation Agriculture <strong>in</strong> Southern<br />
Africa. FAO Network Paper No. 2. Rome, Italy: Food <strong>and</strong> Agriculture Organization<br />
<strong>of</strong> the United Nations<br />
McCarthy, N., C. Dutilly-Diane, Drabo Boureima, A. Kamara, <strong>and</strong> J.-P. V<strong>and</strong>erl<strong>in</strong>den. 2004.<br />
Manag<strong>in</strong>g Resources <strong>in</strong> Erratic Environments: An Analysis <strong>of</strong> Pastoral Systems <strong>in</strong><br />
Ethiopia, Niger <strong>and</strong> Burk<strong>in</strong>a Faso. IFPRI Research Report No. 135. Wash<strong>in</strong>gton,<br />
D.C.: International Food Policy Research Institute.<br />
McCarthy, N., L. Lipper, <strong>and</strong> G. Branca. 2011. Climate Smart Agriculture: Smallholder<br />
<strong>Adoption</strong> <strong>and</strong> Implications for Climate Change Adaptation <strong>and</strong> Mitigation. Mitigation<br />
<strong>of</strong> Climate Change <strong>in</strong> Agriculture (MICCA) Work<strong>in</strong>g Paper No. 4. Rome, Italy: Food<br />
<strong>and</strong> Agriculture Organization <strong>of</strong> the United Nations.<br />
Morse, S. <strong>and</strong> N. McNamara. 2003. Factors Affect<strong>in</strong>g the <strong>Adoption</strong> <strong>of</strong> Legum<strong>in</strong>ous Cover<br />
Crops <strong>in</strong> Nigeria <strong>and</strong> a Comparison with the <strong>Adoption</strong> <strong>of</strong> New Crop Varieties.<br />
Experimental Agriculture 39: 81-97.<br />
National Oceanic <strong>and</strong> Atmospheric Adm<strong>in</strong>istration’s Climate Prediction Center.<br />
(NOAA/CPC). College Park, Maryl<strong>and</strong>. Accessed on 14 September, 2012.<br />
http://www.cpc.ncep.noaa.gov/<br />
Nkala, Peter, Nelson Mango, Marc Corbeels, Gert Jan Veldwisch, <strong>and</strong> Jeoroen Huis<strong>in</strong>g.<br />
2011. The Conundrum <strong>of</strong> Conservation Agriculture <strong>and</strong> Livelihoods <strong>in</strong> Southern<br />
Africa. African Journal <strong>of</strong> Agricultural Research 6.24: 5520-28.<br />
Nyanga, P, F. Johnsen, J. Aune, <strong>and</strong> T. Kal<strong>in</strong>da. 2011. Smallholder Farmers’ Perceptions <strong>of</strong><br />
Climate Change <strong>and</strong> Conservation Agriculture: Evidence from <strong>Zambia</strong>. Journal <strong>of</strong><br />
Susta<strong>in</strong>able Development 4.4: 73-85.<br />
Nyanga, P. 2012. Food Security, Conservation Agriculture <strong>and</strong> Pulses: Evidence from<br />
Smallholder Farmers <strong>in</strong> <strong>Zambia</strong>. Journal <strong>of</strong> Food Research 1.2: 120-38.<br />
Papke, Leslie E. <strong>and</strong> Jeffrey M. Wooldridge. 1996. Econometric Methods for Fractional<br />
Response Variables with an Application to 401(K) Plan Participation Rates. Journal<br />
<strong>of</strong> Applied Econometrics 11.6: 619-32.<br />
29
Papke, Leslie E. <strong>and</strong> Jeffrey M. Wooldridge. 2008. Panel Data Methods for Fractional<br />
Response Variables with an Application to Test Pass Rates. Journal <strong>of</strong> Econometrics<br />
145.1-2: 121-33.<br />
Phiri, D., S. Franzel, P. Mafongoya, I. Jere, R. Katanga, <strong>and</strong> S. Phiri. 2004. Who Is Us<strong>in</strong>g the<br />
New Technology? A Case Study <strong>of</strong> the Association <strong>of</strong> Wealth Status <strong>and</strong> Gender with<br />
the Plant<strong>in</strong>g <strong>of</strong> Improved Tree Fallows <strong>in</strong> Eastern Prov<strong>in</strong>ce, <strong>Zambia</strong>. Agricultural<br />
Systems 79: 131-44.<br />
Smale, M., R. Just, <strong>and</strong> H. Leathers. 1994. L<strong>and</strong> Allocation <strong>in</strong> HYV* <strong>Adoption</strong> Models: An<br />
Investigation <strong>of</strong> Alternative Explanations. American Journal <strong>of</strong> Agricultural<br />
Economics, 76: 535-546. Can be accessed at http://www.jstor.org/stable/1243664<br />
(*High Yield<strong>in</strong>g Varieties)<br />
Ste<strong>in</strong>er, K.G. 1998. Conserv<strong>in</strong>g Natural Resources <strong>and</strong> Enhanc<strong>in</strong>g Food-Security by<br />
Adopt<strong>in</strong>g No-Tillage: An Assessment <strong>of</strong> the Potential for Soil-Conserv<strong>in</strong>g Production<br />
Systems <strong>in</strong> Various Agro-Ecological Zones <strong>of</strong> Africa. Tropical Ecology Support<br />
Program (TÖB) publication number TÖB F-5/e. Eschborn: TÖB/GTZ.<br />
Tarawali, G., V.M. Manyong, R.J. Carsky, P.V. Vissoh, P. Osei-Bonsu, <strong>and</strong> M. Galiba. 1999.<br />
Agr<strong>of</strong>orestry Systems 47.1-3: 93-122.<br />
Tembo, Gelson, Mukelabai Ndiyoi, Elias Kuntashula, <strong>and</strong> Pia Chuzu. 2007. Impact <strong>of</strong><br />
Productivity-enhanc<strong>in</strong>g Interventions on Household Income among ASP Target<br />
Groups. F<strong>in</strong>al Report for the ASP Programme. Lusaka: Farm<strong>in</strong>g Systems Association<br />
<strong>of</strong> <strong>Zambia</strong>.<br />
Umar, Bridget B., Jens B. Aune, Fred H. Johnsen, <strong>and</strong> Obed Lungu. I. 2011. Options for<br />
Improv<strong>in</strong>g Smallholder Conservation Agriculture <strong>in</strong> <strong>Zambia</strong>. Journal <strong>of</strong> Agricultural<br />
Science 3.3: 50–62.<br />
30
WORKING PAPERS<br />
ESA Work<strong>in</strong>g Papers<br />
The ESA Work<strong>in</strong>g Papers are produced by the Agricultural Development Economics<br />
Division (ESA) <strong>of</strong> the Economic <strong>and</strong> Social Development Department <strong>of</strong> the Food<br />
<strong>and</strong> Agriculture Organization <strong>of</strong> the United Nations (FAO). The series presents ESA’s<br />
ongo<strong>in</strong>g research. Work<strong>in</strong>g papers are circulated to stimulate discussion<br />
<strong>and</strong> comments. They are made available to the public through the Division’s website.<br />
The analysis <strong>and</strong> conclusions are those <strong>of</strong> the authors <strong>and</strong> do not <strong>in</strong>dicate<br />
concurrence by FAO.<br />
AGRICULTURAL DEVELOPMENT ECONOMICS<br />
Agricultural Development Economics (ESA) is FAO’s focal po<strong>in</strong>t for economic<br />
research <strong>and</strong> policy analysis on issues relat<strong>in</strong>g to world food security <strong>and</strong> susta<strong>in</strong>able<br />
development. ESA contributes to the generation <strong>of</strong> knowledge <strong>and</strong> evolution <strong>of</strong><br />
scientific thought on hunger <strong>and</strong> poverty alleviation through its economic studies<br />
publications which <strong>in</strong>clude this work<strong>in</strong>g paper series as well as periodic <strong>and</strong><br />
occasional publications.<br />
Agricultural Development Economics (ESA)<br />
The Food <strong>and</strong> Agriculture Organization <strong>of</strong> the United Nations<br />
Viale delle Terme di Caracalla<br />
00153 Rome, Italy<br />
Contact:<br />
Office <strong>of</strong> the Director<br />
Telephone: +39 06 57054368<br />
Facsimile: + 39 06 57055522<br />
Website: www.fao.org/economic/esa<br />
e-mail: ESA@fao.org