Adoption and intensity of adoption of conservation farming practices in Zambia
Adoption and intensity of adoption of conservation farming practices in Zambia
Adoption and intensity of adoption of conservation farming practices in Zambia

You also want an ePaper? Increase the reach of your titles
YUMPU automatically turns print PDFs into web optimized ePapers that Google loves.
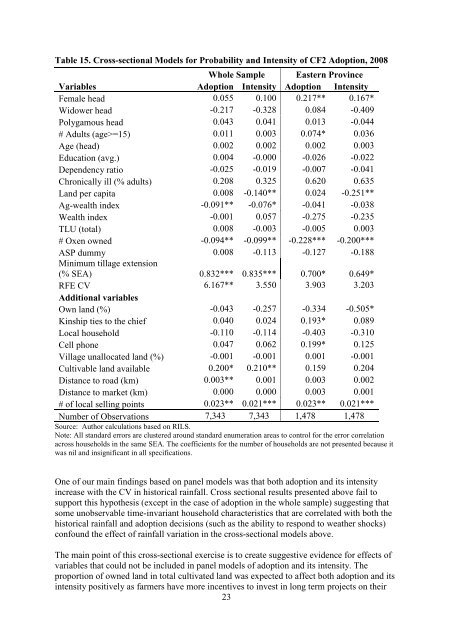
Table 15. Cross-sectional Models for Probability <strong>and</strong> Intensity <strong>of</strong> CF2 <strong>Adoption</strong>, 2008<br />
Whole Sample Eastern Prov<strong>in</strong>ce<br />
Variables <strong>Adoption</strong> Intensity <strong>Adoption</strong> Intensity<br />
Female head 0.055 0.100 0.217** 0.167*<br />
Widower head -0.217 -0.328 0.084 -0.409<br />
Polygamous head 0.043 0.041 0.013 -0.044<br />
# Adults (age>=15) 0.011 0.003 0.074* 0.036<br />
Age (head) 0.002 0.002 0.002 0.003<br />
Education (avg.) 0.004 -0.000 -0.026 -0.022<br />
Dependency ratio -0.025 -0.019 -0.007 -0.041<br />
Chronically ill (% adults) 0.208 0.325 0.620 0.635<br />
L<strong>and</strong> per capita 0.008 -0.140** 0.024 -0.251**<br />
Ag-wealth <strong>in</strong>dex -0.091** -0.076* -0.041 -0.038<br />
Wealth <strong>in</strong>dex -0.001 0.057 -0.275 -0.235<br />
TLU (total) 0.008 -0.003 -0.005 0.003<br />
# Oxen owned -0.094** -0.099** -0.228*** -0.200***<br />
ASP dummy 0.008 -0.113 -0.127 -0.188<br />
M<strong>in</strong>imum tillage extension<br />
(% SEA) 0.832*** 0.835*** 0.700* 0.649*<br />
RFE CV 6.167** 3.550 3.903 3.203<br />
Additional variables<br />
Own l<strong>and</strong> (%) -0.043 -0.257 -0.334 -0.505*<br />
K<strong>in</strong>ship ties to the chief 0.040 0.024 0.193* 0.089<br />
Local household -0.110 -0.114 -0.403 -0.310<br />
Cell phone 0.047 0.062 0.199* 0.125<br />
Village unallocated l<strong>and</strong> (%) -0.001 -0.001 0.001 -0.001<br />
Cultivable l<strong>and</strong> available 0.200* 0.210** 0.159 0.204<br />
Distance to road (km) 0.003** 0.001 0.003 0.002<br />
Distance to market (km) 0.000 0.000 0.003 0.001<br />
# <strong>of</strong> local sell<strong>in</strong>g po<strong>in</strong>ts 0.023** 0.021*** 0.023** 0.021***<br />
Number <strong>of</strong> Observations 7,343 7,343 1,478 1,478<br />
Source: Author calculations based on RILS.<br />
Note: All st<strong>and</strong>ard errors are clustered around st<strong>and</strong>ard enumeration areas to control for the error correlation<br />
across households <strong>in</strong> the same SEA. The coefficients for the number <strong>of</strong> households are not presented because it<br />
was nil <strong>and</strong> <strong>in</strong>significant <strong>in</strong> all specifications.<br />
One <strong>of</strong> our ma<strong>in</strong> f<strong>in</strong>d<strong>in</strong>gs based on panel models was that both <strong>adoption</strong> <strong>and</strong> its <strong><strong>in</strong>tensity</strong><br />
<strong>in</strong>crease with the CV <strong>in</strong> historical ra<strong>in</strong>fall. Cross sectional results presented above fail to<br />
support this hypothesis (except <strong>in</strong> the case <strong>of</strong> <strong>adoption</strong> <strong>in</strong> the whole sample) suggest<strong>in</strong>g that<br />
some unobservable time-<strong>in</strong>variant household characteristics that are correlated with both the<br />
historical ra<strong>in</strong>fall <strong>and</strong> <strong>adoption</strong> decisions (such as the ability to respond to weather shocks)<br />
confound the effect <strong>of</strong> ra<strong>in</strong>fall variation <strong>in</strong> the cross-sectional models above.<br />
The ma<strong>in</strong> po<strong>in</strong>t <strong>of</strong> this cross-sectional exercise is to create suggestive evidence for effects <strong>of</strong><br />
variables that could not be <strong>in</strong>cluded <strong>in</strong> panel models <strong>of</strong> <strong>adoption</strong> <strong>and</strong> its <strong><strong>in</strong>tensity</strong>. The<br />
proportion <strong>of</strong> owned l<strong>and</strong> <strong>in</strong> total cultivated l<strong>and</strong> was expected to affect both <strong>adoption</strong> <strong>and</strong> its<br />
<strong><strong>in</strong>tensity</strong> positively as farmers have more <strong>in</strong>centives to <strong>in</strong>vest <strong>in</strong> long term projects on their<br />
23