Adoption and intensity of adoption of conservation farming practices in Zambia
Adoption and intensity of adoption of conservation farming practices in Zambia
Adoption and intensity of adoption of conservation farming practices in Zambia

You also want an ePaper? Increase the reach of your titles
YUMPU automatically turns print PDFs into web optimized ePapers that Google loves.
5.1. <strong>Adoption</strong><br />
5. RESULTS<br />
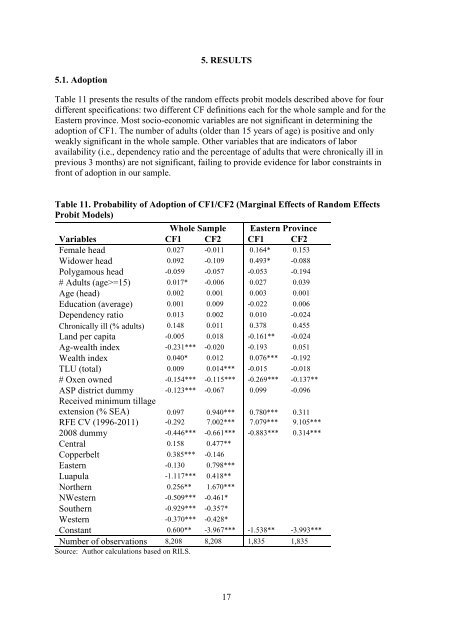
Table 11 presents the results <strong>of</strong> the r<strong>and</strong>om effects probit models described above for four<br />
different specifications: two different CF def<strong>in</strong>itions each for the whole sample <strong>and</strong> for the<br />
Eastern prov<strong>in</strong>ce. Most socio-economic variables are not significant <strong>in</strong> determ<strong>in</strong><strong>in</strong>g the<br />
<strong>adoption</strong> <strong>of</strong> CF1. The number <strong>of</strong> adults (older than 15 years <strong>of</strong> age) is positive <strong>and</strong> only<br />
weakly significant <strong>in</strong> the whole sample. Other variables that are <strong>in</strong>dicators <strong>of</strong> labor<br />
availability (i.e., dependency ratio <strong>and</strong> the percentage <strong>of</strong> adults that were chronically ill <strong>in</strong><br />
previous 3 months) are not significant, fail<strong>in</strong>g to provide evidence for labor constra<strong>in</strong>ts <strong>in</strong><br />
front <strong>of</strong> <strong>adoption</strong> <strong>in</strong> our sample.<br />
Table 11. Probability <strong>of</strong> <strong>Adoption</strong> <strong>of</strong> CF1/CF2 (Marg<strong>in</strong>al Effects <strong>of</strong> R<strong>and</strong>om Effects<br />
Probit Models)<br />
Whole Sample Eastern Prov<strong>in</strong>ce<br />
Variables CF1 CF2 CF1 CF2<br />
Female head 0.027 -0.011 0.164* 0.153<br />
Widower head 0.092 -0.109 0.493* -0.088<br />
Polygamous head -0.059 -0.057 -0.053 -0.194<br />
# Adults (age>=15) 0.017* -0.006 0.027 0.039<br />
Age (head) 0.002 0.001 0.003 0.001<br />
Education (average) 0.001 0.009 -0.022 0.006<br />
Dependency ratio 0.013 0.002 0.010 -0.024<br />
Chronically ill (% adults) 0.148 0.011 0.378 0.455<br />
L<strong>and</strong> per capita -0.005 0.018 -0.161** -0.024<br />
Ag-wealth <strong>in</strong>dex -0.231*** -0.020 -0.193 0.051<br />
Wealth <strong>in</strong>dex 0.040* 0.012 0.076*** -0.192<br />
TLU (total) 0.009 0.014*** -0.015 -0.018<br />
# Oxen owned -0.154*** -0.115*** -0.269*** -0.137**<br />
ASP district dummy<br />
Received m<strong>in</strong>imum tillage<br />
-0.123*** -0.067 0.099 -0.096<br />
extension (% SEA) 0.097 0.940*** 0.780*** 0.311<br />
RFE CV (1996-2011) -0.292 7.002*** 7.079*** 9.105***<br />
2008 dummy -0.446*** -0.661*** -0.883*** 0.314***<br />
Central 0.158 0.477**<br />
Copperbelt 0.385*** -0.146<br />
Eastern -0.130 0.798***<br />
Luapula -1.117*** 0.418**<br />
Northern 0.256** 1.670***<br />
NWestern -0.509*** -0.461*<br />
Southern -0.929*** -0.357*<br />
Western -0.370*** -0.428*<br />
Constant 0.600** -3.967*** -1.538** -3.993***<br />
Number <strong>of</strong> observations 8,208 8,208 1,835 1,835<br />
Source: Author calculations based on RILS.<br />
17