Adoption and intensity of adoption of conservation farming practices in Zambia
Adoption and intensity of adoption of conservation farming practices in Zambia
Adoption and intensity of adoption of conservation farming practices in Zambia
Create successful ePaper yourself
Turn your PDF publications into a flip-book with our unique Google optimized e-Paper software.
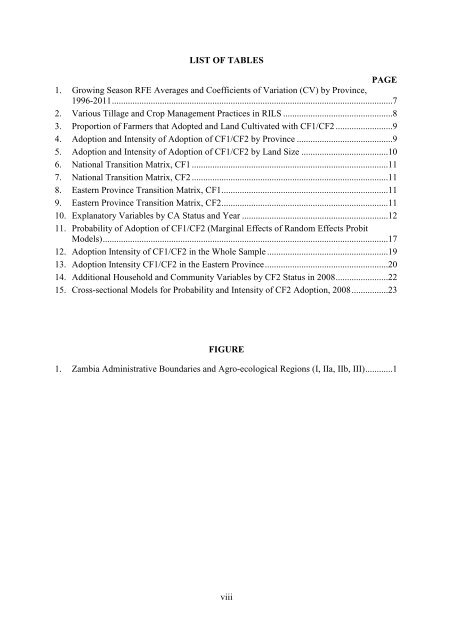
LIST OF TABLES<br />
PAGE<br />
1. Grow<strong>in</strong>g Season RFE Averages <strong>and</strong> Coefficients <strong>of</strong> Variation (CV) by Prov<strong>in</strong>ce,<br />
1996-2011 ...........................................................................................................................7<br />
2. Various Tillage <strong>and</strong> Crop Management Practices <strong>in</strong> RILS ................................................8<br />
3. Proportion <strong>of</strong> Farmers that Adopted <strong>and</strong> L<strong>and</strong> Cultivated with CF1/CF2 .........................9<br />
4. <strong>Adoption</strong> <strong>and</strong> Intensity <strong>of</strong> <strong>Adoption</strong> <strong>of</strong> CF1/CF2 by Prov<strong>in</strong>ce ..........................................9<br />
5. <strong>Adoption</strong> <strong>and</strong> Intensity <strong>of</strong> <strong>Adoption</strong> <strong>of</strong> CF1/CF2 by L<strong>and</strong> Size ......................................10<br />
6. National Transition Matrix, CF1 ......................................................................................11<br />
7. National Transition Matrix, CF2 ......................................................................................11<br />
8. Eastern Prov<strong>in</strong>ce Transition Matrix, CF1 .........................................................................11<br />
9. Eastern Prov<strong>in</strong>ce Transition Matrix, CF2 .........................................................................11<br />
10. Explanatory Variables by CA Status <strong>and</strong> Year ................................................................12<br />
11. Probability <strong>of</strong> <strong>Adoption</strong> <strong>of</strong> CF1/CF2 (Marg<strong>in</strong>al Effects <strong>of</strong> R<strong>and</strong>om Effects Probit<br />
Models) .............................................................................................................................17<br />
12. <strong>Adoption</strong> Intensity <strong>of</strong> CF1/CF2 <strong>in</strong> the Whole Sample .....................................................19<br />
13. <strong>Adoption</strong> Intensity CF1/CF2 <strong>in</strong> the Eastern Prov<strong>in</strong>ce ......................................................20<br />
14. Additional Household <strong>and</strong> Community Variables by CF2 Status <strong>in</strong> 2008 .......................22<br />
15. Cross-sectional Models for Probability <strong>and</strong> Intensity <strong>of</strong> CF2 <strong>Adoption</strong>, 2008 ................23<br />
FIGURE<br />
1. <strong>Zambia</strong> Adm<strong>in</strong>istrative Boundaries <strong>and</strong> Agro-ecological Regions (I, IIa, IIb, III) ............1<br />
viii


