download vol 5, no 3&4, year 2012 - IARIA Journals
download vol 5, no 3&4, year 2012 - IARIA Journals
download vol 5, no 3&4, year 2012 - IARIA Journals

You also want an ePaper? Increase the reach of your titles
YUMPU automatically turns print PDFs into web optimized ePapers that Google loves.
International Journal on Advances in Telecommunications, <strong>vol</strong> 5 <strong>no</strong> 3 & 4, <strong>year</strong> <strong>2012</strong>, http://www.iariajournals.org/telecommunications/<br />
time of 11 seconds. The resulting throughput value is 127.4<br />
bps, considerable improvement over the previous case.<br />
D. Covertness Analysis<br />
By evaluating the impact our proposed channel has in an<br />
operating wireless network, we can work to reduce its<br />
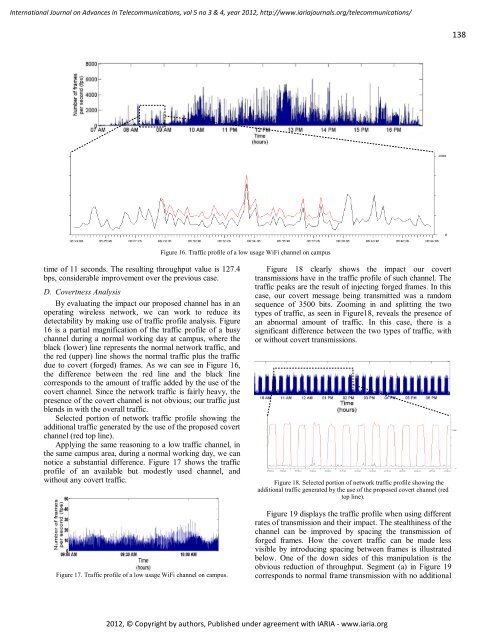
detectability by making use of traffic profile analysis. Figure<br />
16 is a partial magnification of the traffic profile of a busy<br />
channel during a <strong>no</strong>rmal working day at campus, where the<br />
black (lower) line represents the <strong>no</strong>rmal network traffic, and<br />
the red (upper) line shows the <strong>no</strong>rmal traffic plus the traffic<br />
due to covert (forged) frames. As we can see in Figure 16,<br />
the difference between the red line and the black line<br />
corresponds to the amount of traffic added by the use of the<br />
covert channel. Since the network traffic is fairly heavy, the<br />
presence of the covert channel is <strong>no</strong>t obvious; our traffic just<br />
blends in with the overall traffic.<br />
Selected portion of network traffic profile showing the<br />
additional traffic generated by the use of the proposed covert<br />
channel (red top line).<br />
Applying the same reasoning to a low traffic channel, in<br />
the same campus area, during a <strong>no</strong>rmal working day, we can<br />
<strong>no</strong>tice a substantial difference. Figure 17 shows the traffic<br />
profile of an available but modestly used channel, and<br />
without any covert traffic.<br />
Figure 17. Traffic profile of a low usage WiFi channel on campus.<br />
Figure 16. Traffic profile of a low usage WiFi channel on campus<br />
Figure 18 clearly shows the impact our covert<br />
transmissions have in the traffic profile of such channel. The<br />
traffic peaks are the result of injecting forged frames. In this<br />
case, our covert message being transmitted was a random<br />
sequence of 3500 bits. Zooming in and splitting the two<br />
types of traffic, as seen in Figure18, reveals the presence of<br />
an ab<strong>no</strong>rmal amount of traffic. In this case, there is a<br />
significant difference between the two types of traffic, with<br />
or without covert transmissions.<br />
Figure 18. Selected portion of network traffic profile showing the<br />
additional traffic generated by the use of the proposed covert channel (red<br />
top line).<br />
Figure 19 displays the traffic profile when using different<br />
rates of transmission and their impact. The stealthiness of the<br />
channel can be improved by spacing the transmission of<br />
forged frames. How the covert traffic can be made less<br />
visible by introducing spacing between frames is illustrated<br />
below. One of the down sides of this manipulation is the<br />
obvious reduction of throughput. Segment (a) in Figure 19<br />
corresponds to <strong>no</strong>rmal frame transmission with <strong>no</strong> additional<br />
<strong>2012</strong>, © Copyright by authors, Published under agreement with <strong>IARIA</strong> - www.iaria.org<br />
138