2011 PHFA Annual Report - Pennsylvania Housing Finance Agency
2011 PHFA Annual Report - Pennsylvania Housing Finance Agency
2011 PHFA Annual Report - Pennsylvania Housing Finance Agency

You also want an ePaper? Increase the reach of your titles
YUMPU automatically turns print PDFs into web optimized ePapers that Google loves.
notes to<br />
pennsylvania housing finance agency<br />
financial state ments<br />
Years Ended June 30, <strong>2011</strong> and 2010<br />
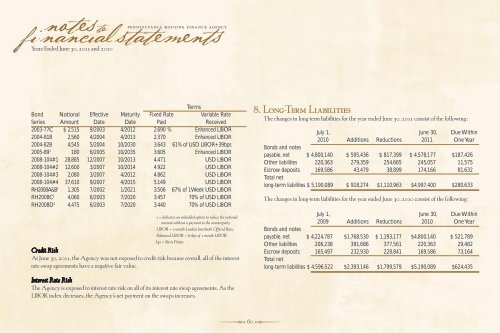
Terms<br />
Bond Notional Effective Maturity Fixed Rate Variable Rate<br />
Series Amount Date Date Paid Received<br />
2003-77C $ 2,515 9/2003 4/2012 2.690 % Enhanced LIBOR<br />
2004-81B 2,560 4/2004 4/2013 2.370 Enhanced LIBOR<br />
2004-82B 4,545 5/2004 10/2030 3.643 61% of USD LIBOR+39bps<br />
2005-89 1 180 6/2005 10/2035 3.605 Enhanced LIBOR<br />
2008-104#1 28,885 12/2007 10/2013 4.471 USD LIBOR<br />
2008-104#2 12,600 3/2007 10/2014 4.922 USD LIBOR<br />
2008-104#3 2,080 3/2007 4/2012 4.862 USD LIBOR<br />
2008-104#4 37,610 9/2007 4/2015 5.149 USD LIBOR<br />
RH2008A&B 1 1,305 7/2002 1/2021 3.506 67% of 1Week USD LIBOR<br />
RH2008C 1 4,060 6/2003 7/2020 3.457 70% of USD LIBOR<br />
RH2008D 1 4,475 6/2003 7/2020 3.440 70% of USD LIBOR<br />
1 = Indicates an embedded option to reduce the notional<br />
amount without a payment to the counterparty<br />
LIBOR = 1-month London Interbank Offered Rate .<br />
Enhanced LIBOR = 67bps of 1-month LIBOR<br />
bps = Basis Points<br />
Credit Risk<br />
At June 30, <strong>2011</strong>, the <strong>Agency</strong> was not exposed to credit risk because overall, all of the interest<br />
rate swap agreements have a negative fair value.<br />
Interest Rate Risk<br />
The <strong>Agency</strong> is exposed to interest rate risk on all of its interest rate swap agreements. As the<br />
LIBOR index decreases, the <strong>Agency</strong>’s net payment on the swaps increases.<br />
60<br />
8. Long-Term Liabilities<br />
The changes in long-term liabilities for the year ended June 30, <strong>2011</strong> consist of the following:<br />
July 1, June 30, Due Within<br />
2010 Additions Reductions <strong>2011</strong> One Year<br />
Bonds and notes<br />
payable, net $ 4,800,140 $ 595,436 $ 817,399 $ 4,578,177 $187,426<br />
Other liabilities 220,363 279,359 254,665 245,057 11,575<br />
Escrow deposits<br />
Total net<br />
169,586 43,479 38,899 174,166 81,632<br />
long-term liabilities $ 5,190,089 $ 918,274 $1,110,963 $4,997,400 $280,633<br />
The changes in long-term liabilities for the year ended June 30, 2010 consist of the following:<br />
July 1, June 30, Due Within<br />
2009 Additions Reductions 2010 One Year<br />
Bonds and notes<br />
payable, net $ 4,224,787 $1,768,530 $ 1,193,177 $4,800,140 $ 521,789<br />
Other liabilities 206,238 391,686 377,561 220,363 29,482<br />
Escrow deposits<br />
Total net<br />
165,497 232,930 228,841 169,586 73,164<br />
long-term liabilities $ 4,596,522 $2,393,146 $1,799,579 $5,190,089 $624,435