V - ResearchSpace
V - ResearchSpace
V - ResearchSpace

Create successful ePaper yourself
Turn your PDF publications into a flip-book with our unique Google optimized e-Paper software.
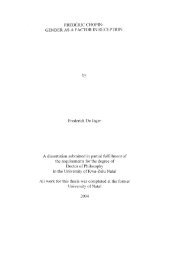
Pl. 6.?<br />
Pl. 63<br />
400<br />
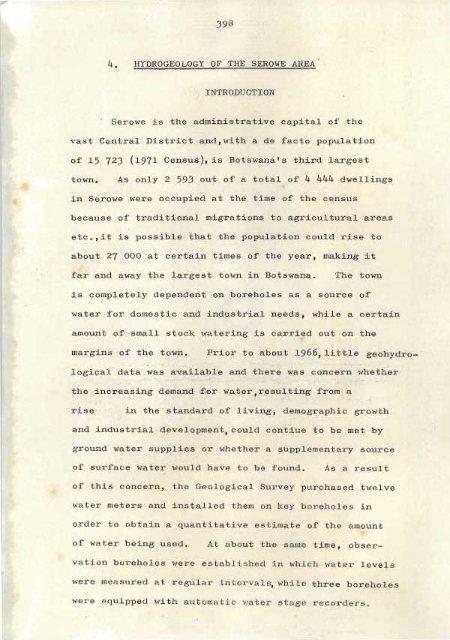
Serowe - Cave sandstone in foreground.<br />
Dyke forms hills in distance.<br />
Well point - Motloutse Sand River.<br />
I I
411<br />
TABLE 52<br />
ESTIMATED AVERAGE MONTHLY<br />
WATER CONSUMPTION IN SEROWE (JENNINGS, 1967)<br />
Gallons<br />
Tribal boreholes 1017 200 4623<br />
Government camp 473 000 2150<br />
Hospi tal and Ne'v Look Township 472 000 2145<br />
Teachers Training College 599 000 2723<br />
Swaneng Hill School 108 000 491<br />
N.I.D.C.O. Factory 105 000 477<br />
Private boreholes (estimated) 400 000 1818<br />
Unmetered tribal boreholes (estimated) 501 000 2277<br />
Serowe Hotel (estimated) 100 000 455<br />
TOTAL: 3 775 000 17159<br />
Robins (1972) estimated that current usage,<br />
allowing for industrial expansion, had risen to 30 000m3<br />
per month by that year, i.e. an average of 1 000 mJ per<br />
day.<br />
It is interesting to note that 73 per<br />
cent of the water in Serowe is consumed by an estimated<br />
3 per cent of the population. This 3 per cent of the<br />
population (government and District Council offiCials,<br />
teachers, traders etc.) enjoy a considerably higher<br />
. ' .<br />
. .' 1
413<br />
thirteen boreholes were fitted with automatic water<br />
stage recorders.<br />
At about the same time regular sam-<br />
pIing of water from unused and pumped boreholes was<br />
commenced for tritium and chemical analysis.<br />
GROUND-WATER LEVELS, STORAGE AND REPLENISHMENT<br />
No aquifer evaluation tests have been carried out<br />
in Serowe because of the continuous pumping taking place<br />
at present to keep the village supplied with water. If,<br />
however, the values for the coefficient of storage ob-<br />
tained for the same aquifer at Orapa are applied to Serowe,<br />
then for every square kilometer of aquifer, a total of<br />
6 3 63.<br />
between 5 x 10 m and 26 x 10 m of water wlll be present<br />
in storage.<br />
A study of the hydrographs of all boreholes in<br />
Serowe shows that marked seasonal fluctuations take<br />
place which directly reflect the amount of recharge that<br />
has taken place. In the vicinity of boreholes 670 and<br />
1510 (Figs. 93, 95) little recharge took place in the<br />
1967/6 8 season and again jn the 1969/70 season. In the<br />
1966/67, 1968/69 and 1971/72 seasons major recharge took<br />
place, while less recharge occurred in the 1970/71 season.<br />
These fluctuations are generally of the order of three to<br />
five metres but, in the case of borehole 670 (Fig. 93),<br />
may be up to 60 metres.<br />
Borehole 489 (Fig 96) is a low yielding borehole<br />
sited in the lower Cave Sandstone stage and consequently<br />
penetrated less than 30m of sandstone before going into
425<br />
in this case, not apparently along the contact zone<br />
with the overlying basalt) and then mixes slowly with<br />
the main body of water present throughout the lower<br />
portions of the sandstone aquifer. This mechanism<br />
of downward mixing provides important evidence of the<br />
nature of recharge and also belies the statement made<br />
by Anon (1969) that water is probably<br />
only present in the upper portion of the Cave Sandstone<br />
aquifer.<br />
A very high value of 22 TU was obtained for<br />
borehole 1538, situated alongside a concrete walled<br />
dam 6m high across the ephemeral Metsemasweu River,<br />
which is now completely filled with sand. This acts<br />
as an articifical recharge medium and assists direct<br />
and rapid recharge to the shallow aquifer tapped by<br />
Borehole 1538.<br />
Carbon Fourteen<br />
Table belo1.:-<br />
Swaneng .<br />
R-esults of carbon -14 datings are given in the<br />
TABLE 55<br />
SEROWE ISOTOPE DATA (After Mazor et al 1974)<br />
Leitho spring<br />
Serowe Hotel (2850)<br />
Borehole 2162<br />
Borehole 1378<br />
14<br />
Cp.m.c. 8 l3 C
It<br />
427<br />
THE SITING OF BOREHOLES IN SERmm<br />
The relatively simple geology in Serowe makes<br />
the siting of boreholes west of the Serowe fault / a<br />
simple matter as virtually all boreholes are likely<br />
to be successful. Boreholes sited in the basalt should<br />
be drilled to a sufficient depth to penetrate the basalt<br />
and, where possible, should be continued to the base<br />
of the Cave Sandstone. Drilling in the area east of<br />
the fault should be avoided,except where boreholes can<br />
be sited to intersect the east-west dolerite dyke or<br />
where it is planned to intersect the deep-seated Ecca<br />
Group aquifer. Drilling north of the east-west dyke<br />
should be avoided,as boreholes sited in the lower Cave<br />
Sandstone Subgroup aquifer are likely to be low<br />
yielding and of poor quality and are ,furthermore ,<br />
likely to penetrate into 1vaterherg Supergroup shales and<br />
siltstones,which are extremely poor water bearers.<br />
Where the depth of the Stormberg lavas is unknown,<br />
electrical resistivity methods can be successfully used<br />
to determine their thickness. (See Fig. 101 ).<br />
An attempt was made to site a borehole on joints<br />
in the basalts (shown up on aerial photographs by<br />
prominent vegetation lines),but this proved to be no<br />
higher yielding than average.
429<br />
HYDROCHEHISTRY<br />
In 1969 a research programme was commenced in<br />
Serowe in which 'fa ter from a number of boreholes was<br />
sampled at regular (bi-monthly) intervals from both<br />
pumping and unused boreholes.<br />
The unused boreholes<br />
were sampled at different depths using a sampler of<br />
the type described in the Chapter on Environmental<br />
Isotopes.<br />
The water quality encountered in boreholes pene<br />
trating the basalt/Cave Sandstone contact is generally of<br />
excellent quality (of fresh sodium bicarbonate type).<br />
An example representative of this type of water is<br />
given in Table 56 *<br />
Boreholes drilled in the unconfined Cave Sand-<br />
stone aquifer are of much poorer quality than that of<br />
the confined aquifer. This water is of 'feak1y saline,<br />
ca1cium-magnesium-bicarbonate-chloride-sulphate type<br />
(Table 56.)<br />
TABLE 56<br />
SH01fING 1fATER TYPES IN UNCONFINED AND CONFINED AQUIFERS<br />
Unconfined ag,uifer Confined aquifer<br />
Bh number 14 489 1378<br />
Date sampled 7.12·71 15.5.69 15 . . 2.71<br />
pH 7,65 7,10 7,70<br />
C0 3<br />
HC0 3<br />
26 13<br />
361 323 102<br />
C1 270 116 36<br />
-- 144 461 15<br />
S04<br />
/
,<br />
440<br />
mixes slowly downwards through the aquifer resulting in<br />
some chemical mixing but nevethe1ess retaining some<br />
stratification. ($ee Table 53<br />
stratification in tritium concentration.)<br />
TABLE 59<br />
which shows a similar<br />
SHOWING CHE:r.1ICAL STRATIFICATION IN BH 1510<br />
(Total dissolved solids in ppm)<br />
Depth: 50 1 150 1 250 1<br />
23.3.69<br />
+ +<br />
+<br />
0,8-0,3 180<br />
1,1-0,3 471 0,7-0,3<br />
15.5.69 0,6 185 '. ',185<br />
13.3.70<br />
+<br />
+<br />
0,4-0,2 479 0,2-0,2<br />
+<br />
175 3,0-0,6 153<br />
478<br />
17.6.70 166 170 494<br />
8.10.70<br />
+<br />
+<br />
+<br />
+<br />
0,5-0,3 175 0,2-0,2 175 0,5-0,3 490 0,8-0,3<br />
19.10.70 187 186 454<br />
17.2.71 6;3 188 0,5 196 (1,9) 352<br />
25.4.71 0,4 201 0,3 191 0,6 454 0,9<br />
15.6.71 203 194 493<br />
23.8.71<br />
186<br />
20.10.71 203 208 213<br />
13.12.71 203 233 567<br />
16.4.72 245 248 440<br />
11.6.72 367<br />
10.8.72 278 258 476<br />
Average tds 198 212 470<br />
350 1<br />
462<br />
480<br />
501<br />
505<br />
453<br />
356<br />
486<br />
540<br />
474<br />
261<br />
503<br />
399<br />
398<br />
L,·61
446<br />
SAND RIVER STORAGE<br />
INTRODUCTION<br />
A glance at Fig. 3 shows that the eastern por-<br />
tion of Botswana is apparently well drained with numer-<br />
ous rivers having a combined catchment area of 179 020<br />
2<br />
km •<br />
These rivers are, however, in actuality broad<br />
sandy river beds which flow only fO.r a short period each<br />
year and, in rare years, not at all. Because of the<br />
intense thunderstorms that fall, with a consequent high<br />
rate of run-off, these rivers can, on occasions, carry<br />
immense quantities of water (Plate 31), a large amount<br />
of which rapidly percolates through the sandy bottom and<br />
sides to replenish the ground water aquifers lying in<br />
proximity to the river course (see section on Recharge<br />
and Ground Water Fluctuations). Very often, however,<br />
the bottom of the river bed may be an impermeable base<br />
and, where there is a reasonable depth of sand, consi-<br />
derable amounts of water are held in this important<br />
aquifer. Appreciable sub-surface flow often takes place<br />
in this aquifer. This aquifer has traditionally formed<br />
a most valuable source of 'vater for the cattle industry<br />
and is often exploited by digging shallow wells in the<br />
river bed and manually hoisting the water to a nearby<br />
drinking trough or by allowing the cattle to have direct<br />
access to this water. (See Plates 3, 7).
Pl. 64<br />
Pl. 65<br />
448<br />
Dolerite dyke on edge of Notloutse Sand<br />
River. Some surface water remaining after<br />
re cent flo1{.<br />
Dense network of rootlets on edge or
•<br />
467<br />
GROUND 1"rATER MOVEMENT, \"rELL HYDRAULICS<br />
AND AQUIFER EVALUATION TESTS IN BOTS1"rANA<br />
INTRODUCTION<br />
Pump testing of boreholes in Southern Africa is<br />
generally carried out with the sole objective of<br />
obtaining information on the performance and<br />
efficiency of the borehole)whi1e from the drawdown,<br />
yield and calculated specific capacity suitable<br />
equipment can be ordered for long term use on the<br />
borehole.<br />
More sophisticated testing of boreholes for the<br />
determination of the main aquifer characteristics<br />
such as coefficients of storage and transmissivity<br />
is seldom carried out, largely because the require-<br />
ments of homogeneous aquifers of infinite extent do<br />
not generally pertain in South Africa (Enslin, 1956).<br />
However, recent detailed aquifer testing of bore-<br />
holes in Botswana by the writer and other workers<br />
has shown that valuable data can be obtained by<br />
detailed aquifer tests even where ostensible geo-<br />
logical indications are that th0 aquifer is of a<br />
heterogeneous nature. Venter (1969) has indepen-<br />
dent1y come to a similar conclusion that "the non-<br />
equilibrium formula may be applied with success to<br />
aquifers consisting of fissures in impermeable rocks."<br />
PREVIOUS \VORK<br />
In South Africa , pump tests have been described<br />
by Enslin (1956), Venter (1969), Boehmer (1970),
· 473<br />
tics of the aquifer determined. These characteris-<br />
tics can serve as an extremely valuable aid in<br />
practical ground water investigations.<br />
Among the usual hydraulic characteristics which<br />
can be calculated are the average permeability, the<br />
coefficients of storage and transmissivity, the<br />
interference between boreholes at different spacings<br />
and for different pumping rates or the expected<br />
drawdown in the pumped borehole at various distances<br />
from the pumped borehole after any desired period of'<br />
time. Other parameters which can be determined<br />
are the existence of impermeable boundaries limiting<br />
the extent of the aquifer or the existence of unsus<br />
pected sources of recharge to the aquifer.<br />
Flow from Aquifer into Borehole<br />
When a borehole is pumped, water is derived from<br />
storage in .the aquifer immediately surrounding the<br />
borehole. As pumping continues, more water must be<br />
derived from storage from greater distances and a<br />
circular-shaped cone of depression expands outwards<br />
around the borehole so that water. can move from greater<br />
distances to the borehole. In other words, the<br />
radius of influence of the borehole increases as the<br />
cone continues to expand. The drawdown also increases<br />
as the cone deepens at a decreasing rate as with each<br />
metre of horizontal expansion a larger volume of stored
478<br />
The coefficient of transmissibility T is<br />
calculated from T = 264 Q where AS = slope of<br />
AS<br />
time-drawdown graph expressed as the change in<br />
drawdown bet"ween any two values of time on the log<br />
scale whose ratio is 10.<br />
Once T has been calculated, S may be obtained<br />
from S = 0,3 T to where to = intercept of the<br />
r 2<br />
straight line at zero d ra"\ .. d own , in days and r =<br />
distance, in feet, from pumped well to observation<br />
well.<br />
This time-drawdown diagram, in addition to<br />
its use for calculating T and S, is particularly<br />
useful for predicting future drawdo"\.,rn at any time<br />
in the future for a constant pumping rate.
Geology<br />
481<br />
The Western Lobatse ground-water basin is<br />
underlain by a thick development (up to 30m) of<br />
colluvial soil and gravel overlying decomposed,<br />
waddy dolomite (Transvaal Supergroup) of variable<br />
thickness_ This, in turn, overlies fresh, hard<br />
dolomite with interbedded chert horizons.<br />
The aquifer test<br />
Prior to the detailed aquifer evaluation<br />
test measurement of fluctuations in boreholes<br />
caused by barometric changes and tidal effects<br />
were noted, Slight barometric fluctuations were<br />
noted on boreholes A4, AIO and A7. In borehole<br />
A4 these fluctuations amounted to a maximum of<br />
0.05 ft (15mm). The excellent correlation between<br />
the daily pressure maximum and the greatest<br />
depression of the piezometric water surface for<br />
borehole A4 can be seen in Fig.117.<br />
Unfortunately no measurements could be made<br />
for boreholes A2 and A5, but as the water level<br />
fluctuations caused by pumping in the two boreholes<br />
far exceeds any possible barometric fluctuation,<br />
this should make no difference to the calculated<br />
results.
-_ .. -__ 1
.,<br />
,<br />
I<br />
r·<br />
r<br />
1<br />
I<br />
I<br />
i ,<br />
i<br />
r
500 -
501
502
.:",<br />
507
508<br />
TABLE 65<br />
VALUES FOR T AND S PUMP TEST D.C. 's OFFICE BOREHOLES<br />
BOREHOLE NO. r<br />
T<br />
2<br />
g .. p .. d./ft m /day<br />
D.C. 1 (Of no 1368) 3465 43 .' -<br />
D.C. 2 (622) l4,83ft 5906 73 0,01677<br />
D.C. 3 ( ? ) 20,0 ft 27163 337,3 0,49<br />
D.C. 4 (1276) 5l,83ft 3618 44,9 0,00314<br />
Average: 10038 124,55 0,009955<br />
All boreholes showed an increase in the gradient<br />
on the time-drawdown graph and hence less. permeable<br />
zones in the dolomite are present in the vicinity<br />
of all four boreholes.<br />
Lobatse Estates Southern Basin<br />
The Lobatse Estates southern ground-water basin<br />
represents one of three basins on Lobatse Estates<br />
which, prior to the completion of the Nuane Dam,<br />
formed the mainstay of Lobatse water supply.<br />
Geology<br />
Boreholes in this basin penetrate black shale<br />
and shaly siltstone overlying Daspoort Subgroup<br />
ferruginous quartzite of the Pretoria Group<br />
(Transvaal .supergroup) •.<br />
S
512
519<br />
These are largely unexploited at present and a<br />
quantitative assessment of the water stored in<br />
'them should greatly assist long-term future socio<br />
economic planning in Botswana.<br />
Geology<br />
The recent unconsolidated sediments consist<br />
mainly of coarse sands with some clay, silt, gravel<br />
and boulder beds. The depth of these recent<br />
deposits is extremely variable and is generally<br />
less than 5m in thickness. The sand basins in<br />
the river beds are often separated by rock bars and<br />
hence a longitudinal section along a sand river<br />
consists of a series of sand basins separated by<br />
rock bars cropping out in the river bed. The<br />
margins of the sand rivers generally comprise<br />
impermeable banks and levees with a high clay<br />
content and hence the lateral extent of the sand<br />
aquifers is limited. Lund (personal communication)<br />
informed the writer that he drilled numerous dry<br />
shallmv wagon drill holes along the banks of the<br />
Motloutse River opposite areas containing large<br />
quantities of water in the river bed.<br />
A typical longitudinal section obtained by<br />
probing dm'ffi the Motloutse River is shown in Fig. 142<br />
while a cross section at the site of pump test . (40 3)
Data on pump test<br />
1.<br />
2.<br />
3.<br />
Pump discharge<br />
Pumping rate<br />
Measuring<br />
equipment<br />
4. 1
I<br />
I<br />
_ _ . ____ . ___ ... _ _ . _. __ . ______ . _ _ • ________ .r_ _ _ _ . ____ _______ ---- - --- - -<br />
';3('<br />
P.por Nr. IOlaR 23 of A Ott Kempten (Sav.ri.l S<br />
: : ::-<br />
.... - .., -- ..<br />
•• j.. .. -
the formation and well loss constants Band C<br />
may be calculated using the values of SW and SW/Q<br />
,for each step of the test 1350 minutes after start-<br />
ing to pump at each respective rate i.e. after<br />
1350 minutes the drawdown pumping at 29,2 gpm<br />
"Was 37,11.<br />
Following the increase in pumping to<br />
41 gpm the additional drawdown was 20,3 feet after<br />
1350 minutes and fol1o"Wing a further increase to<br />
62,5 gpm , the projected increase in dra"Wdown after<br />
a further 1350 minutes "Was 31,7 feet. Care was<br />
taken to measure the drawdo"Wn from the projected<br />
drawdown after 1350 minutes at the previous rate<br />
and not from the last measured drawdown at the<br />
previous rate.<br />
TABLE 69<br />
SUMMARY OF STEP-DRA1mm{N ANALYSIS, BH 2184<br />
Q gpm Q<br />
S1-l for each<br />
step, -x- feet<br />
Sum of SW Specific<br />
Steps, feet drawdown<br />
ft per gpm<br />
Specific<br />
capacity<br />
gpm per ft<br />
29,2 37,11 37,11 1,27 0,78<br />
41,0 20,3 57,41 J-,40 0,71<br />
62,5 31,7 89,11 1,42 0,70<br />
* Each value is for 1350 minutes of pumping<br />
Table 69 shows a summary of the results of the step-<br />
dra"\vdown t est. It can be seen that a progressive
decline in efficiency takes place with increastng<br />
discharge from the borehole.<br />
Now SW = BQ + CQ2 SW = B + CQ<br />
By plotting S1v versus Q (Figure 64 ) values<br />
Q<br />
for B ( the intercept on the vertical axis ) can be<br />
used and hence C can be calculated e . g . F o r B = 1 , 18.<br />
Boundary Effects<br />
The presence of impermeable barriers will<br />
result in an increase in the slope of a time-<br />
drawdown curve as shown in Fig s . 130, l32 (D. C. ' s<br />
Office and Borehole 665, 2135) "\vhile more permeable<br />
zones encountered by the expanding cone of depres-<br />
sion around a pumping borehole will result in a<br />
decrease in the slope of the curve direction<br />
(Fig. l39Annandale pump test). Ferris (1948)<br />
described the use of image wells to determine the<br />
distance to a permeable or impermeable boundary.<br />
SUMMARY AND CONCLUSIONS<br />
Aquifer evaluation tests on a variety of<br />
aquifers have been successfully carried out in<br />
Botswana and have shown that the conventional methods<br />
of analysing the data can be successfully applied.<br />
The fact that the shape of plotted time-drawdown Curves<br />
generally conform with those expected from theore t i-
547<br />
Once the samples arrive in Lobatse, they are removed from<br />
the bags and are stored in small glass bottles which, in<br />
turn, are stored on a wooden board which has had holes bored<br />
into it of sufficient diameter to enable the bottles to fit<br />
into the holes. By arranging the bottles in increasing depth<br />
order, it is possible to have a visual picture of the geolo<br />
gical section and the hole can thus be easily logged. This<br />
logging is always carried out by a geologist and is recorded<br />
on a special card giving the borehole number and its locality.<br />
private boreholes were originally given the prefix "P" before<br />
the borehole number. This was later discontinued and all<br />
privately drilled boreholes are given a liZ" prefix to distin-<br />
. guish them from Government drilled boreholes.<br />
The writer has personally examined the vast majority of samples<br />
from boreholes drilled in Botswana. This has involved the<br />
examination .'.of approximately 70 000 individual samples. The<br />
writer gratefully acknowledges the work carried out by collea<br />
gues who have also assisted in the tedious job of logging of<br />
boreholes. Among those who carried out logging of consider<br />
able numbers of boreholes are M.T. Jones, O.J. van Straten,<br />
I. Gerrard and N.S. Robins. Where difficulty is experienced<br />
in making a positive visual identification of the ruck type<br />
encountered, the writer has found that several cuttings (sludge)<br />
from the percussion drilled holes can be successfully sectioned<br />
and examined under a microscope even where the rock type has<br />
been broken into very small cuttings. A typical example of a<br />
log of a percussion borehole from which sections have been made,<br />
is given below:-
552<br />
PI.68 Air Drilling...;; Letlakhane Fault; Zone Phik1/e.<br />
Pl.6q
.:>ou<br />
TAB L E 73<br />
ANALYSIS OF BOREHOLE YIELDS 1929 - 1968<br />
Boreholes with yields between 50 and 100 g.p.h. (3,8':"'7,6t/min) 7,23%<br />
"<br />
II II II<br />
II<br />
II II II 100 and 500 g.p.h. (7,6- 19-1/min) 27,81%<br />
"<br />
" 500 and 1000 g.p.h. ( 19- 76f/min) 23,65%<br />
II II 1000 and 2000 g.p.h. ( 76-152(/min 23,87%<br />
" " " over 2000 g.p.h. 17,44%
TABLE 74<br />
BOREHOLES SHOWING REDUCED YIELDS WITH TIME<br />
(Yields in 1itres/minute)<br />
Date of Original Final<br />
Bh. No. Date drilled cleaning yield yield<br />
93 11.3.38 10.5.40, 53,2 13,7<br />
24.3.48, 13,7<br />
11.6.59 9,1<br />
169 4.9.40 24.11.54 57,0 17,5<br />
271 4.2.51 1.10.52, 38,0 9,1<br />
18.4.56 30,4<br />
286 31.3.50 20.10.64 82,1 Dry<br />
299 20.8.50 18.7.53 57,0 27,3<br />
348 19.7.51 19.10.52 228,0 95,8<br />
401 29.3.52 26.3.65 54,7 7,6<br />
416 8.8.52 20.1.54 45,6 7,6<br />
422 10.10.52 18.1.54 53,2 6,8<br />
513 20.3.54 16.1.69 121,6 53,2<br />
626 6.7.55 3.12.64 30,4 4,6<br />
670 16.3.56 24.11.58, 228,0 38,0<br />
24.6.66, 63,8<br />
23.6.70 91,2<br />
679 11.6.56 19.9.59 197,6 11,4<br />
854 10.7.57 22.12.64, 12,2 Dry<br />
12.2.65 7,6<br />
891 19.2.58 26.9.63 68,4 19,0<br />
893 31.10.58 16.3.65, 68,4 11,4<br />
16.6.72 13,7<br />
936 .58 11.6.71 57,0 5,7<br />
989 23.9.58 5.1. 60 76,0 9,1<br />
1000 15.10.58 18.8.70 4,6 0,8<br />
1344 21.6.61 16.4.68 114,0 64,6
development prograwme. In Botswana geological and geophysi-<br />
cal aids have thus resulte d in an increase in the success ratio<br />
of boreholes by 25 per cent (Table 75 ).
TAB L E 75<br />
GENERAL BOREHOLE STATISTICS - BOTSWANA<br />
GOVERNMENT BOREHOLES DRILLED WITHOUT GEOLOGICAL/GEOPHYSICAL AIDS 1929 - 1958:<br />
TOTAL NUMBER 674<br />
TOTAL SUCCESSFUL 214<br />
% " 46,7 %<br />
GOVERNMENT BOREHOLES DRILLED USING GEOLOGICALLGEOPHYSICAL AIDS 1953 - 1971:<br />
\.0 TOTAL NUMBER 1641<br />
\ 0<br />
)1"\ TOTAL SUCCESSFUL 1168<br />
% " 71,2 %<br />
i.e. Geological/Geophysical aids have resulted in an increase of 24,5% in<br />
the success ratio. Furthermore yields of properly sited boreholes<br />
increased by 26,6 L/min over unsited boreholes.
570<br />
and the whole configuration is moved along a traverse.<br />
Readings are taken at regular intervals and results Rre<br />
plotted at a "station lt taken as the point midway between<br />
the two potential electrodes.<br />
The Schlumberger configuration is shown diagrammatically<br />
in Fig.155. 1Hth this configuration,vertical profiling<br />
is carried out by initially expanding only the outer<br />
current electrodes,and expanding the inner potential<br />
electrodes Ms Ns,only once every 5 changes of the outer<br />
electrodes . The major advantage ' of the Schlumberger<br />
configuration is that it is less sensitive to unknow'n<br />
lateral inhomogeneities. On the other hand far more<br />
sensitive equipment is required to measure the extremely<br />
small potential differences.<br />
Instrumentation<br />
A standard wiring diagram for a direct current potentiometer<br />
electrical resistivity instrument ,.,as finally evolved<br />
following the design and building of series of prototype<br />
instruments at the Geological Survey. This type of'<br />
instrument was found to operate satisfactorily in the<br />
arid regions of the country where high contact resistances<br />
were encountered. A direct current instrument was favoured<br />
because it '''as not limited in regard to the amount of high<br />
tension current which could be used to overcome high contact<br />
resistances. A battery box consisting of 25 x 45 volt dry<br />
cell batteries was generally used but on occasions 2<br />
battery boxes each of' 1500 volts were coupled together<br />
for use in areas of thick dry Kalahari sand.
582<br />
formations for yielding water are dolomite (Dolomite<br />
Subgroup) and quartzite of the Pretoria Subgroup (Trans<br />
vaal Supergroup) together with partly calcretect. gravel<br />
and sandstone forming part of the Kalahari Group. Deep<br />
depth probes to depths of up to 300 m are of considerabl9<br />
use in determining the thickness of the Kalahari Beds<br />
and also in distinguishing between mafic and ultramafic<br />
intrusives and sedimentary types.<br />
Plate 70 shows a typical resistivity survey in progress.
\,<br />
591<br />
Conclusions<br />
The self-potential method has been used in<br />
Botswana with varying success, but has been shown to<br />
be capable of giving excellent results for detecting<br />
permeable zones in areas of shallow water table especially<br />
when surveys are conducted after prolonged or very<br />
heavy rains. The method should also yield good results<br />
along major river courses situated in Basement Complex<br />
terrain after flooding down the river has taken place.
Kweneng District. Following the delineation of the fault<br />
using the magnetic method, a successful borehole (No. 1883,<br />
yield 304 l/min., F6), was sited in the basalt. This<br />
followed the drilling, by private individuals, of three<br />
blank b,oreholes in the thick impermeable shale south of<br />
the fault.<br />
A similar survey was carried out in a sand covered area in<br />
the Kgatleng District where a fault separates 1vaterberg<br />
Supergroup sediments, forming a very poor aquifer, from<br />
Stormberg lavas • .<br />
After the basalt boundary had been<br />
outlined by magnetics a successful borehole was sited in<br />
the lavas.<br />
Use of Regional Airborne Magnetics<br />
The regional airborne magnetic intensity map of the area<br />
north of the Molopo River, was used on a number of occasions<br />
to help elucidate the structure of the Transvaal Supergroup<br />
lying beneath a thick cover of Kalahari Beds.<br />
A number of magnetic markers, such as the banded ironstone<br />
at the top of the Dolomite Formation and the Ongeluk lavas,<br />
were used, together with data from existing holes drilled<br />
in the area, to help site further boreholes in the more<br />
favourable water bearers of the Transvaal Supergroup. By<br />
doing this the poorer aquifers, 'vhich are concealed by up to<br />
130 metres of Kalahari Beds,can be avoided.<br />
ELECTROMAGNETIC METHODS<br />
Electromagnetic methods are based on the principle that a<br />
signal from a transmitter, which is picked up by a receiver,<br />
is considered in phase with the transmitter. When a conducting<br />
body is present, a shift in phase of frequency may be detected
606<br />
These two boreholes (2199 and 2206) constitute the Orapa<br />
wellfield number three,<br />
mainstays of the mine water supply.<br />
which is at present one of the<br />
SEISMIC .METHODS<br />
Introduction<br />
In the seismic method an elastic pulse is generated at<br />
or near the ground surface and the resultant motion of<br />
the ground at nearby points on the surface is detected<br />
by geophones. Measurement ; of the time intervals between<br />
the generation of the pulse and _ its reception at various<br />
distances gives the velocity of propogation of the pulse<br />
in the ground. The ground is generally not homogeneous<br />
in it1s elastic properties and velocities may vary both<br />
with depth and laterally. Thus ,in areas with a relatively<br />
simple structure ,the values of elastic wave velocity and<br />
the positions of boundaries between regions of differing<br />
velocity can be calculated from the measured time intervals.<br />
These velocity boundaries usually coincide1v-i th geological<br />
boundaries and a cross-section,on which velocity inter<br />
faces are plotted ,may resemble the geological cross-section.<br />
Two main seismic methods are used in ground-water surveys:<br />
the refraction and reflection methods.<br />
A. Refraction Method<br />
In the seismic refraction method, the travel time of<br />
shock waves, generated by a hammer blow or an explosion,<br />
to a number of detectors (geophones) is recorded and<br />
the first-arrival time T is plotted against the shot<br />
detector distance X for different separations of source
608<br />
Instrumentation<br />
Originally a commercially manufactured seismic instrument<br />
the F.S.-2 (made by Huntec Limited of Toronto, Canada)<br />
'vas used for shallow refraction work.<br />
This is a shallow,<br />
single channel, facsimile percussion seismic instrument<br />
'vhich is a refinement of the instrument first described<br />
by Gough (1952).<br />
This instrument was subsequently<br />
modified (the Huntec F.S.-3) for use in sha1101v reflection<br />
surveys. The reflected events are separated from refractions,<br />
surface waves, and other superimposed wave types at short<br />
record times, by means of a corre1ator which discriminates<br />
against waves which are phase shifted at two geophones by<br />
more than an arbi trari'lyset amount. This has been described<br />
in detail by Meidav (1968).<br />
Practical Applications of the Seismic Method<br />
Depth of Penetration of Refraction Surveys<br />
Under favourable conditions, refracting horizons up to a<br />
depth of 30 m can easily be detected, using a steel plate<br />
and a 12 to 14 pound hammer as energy source. For greater<br />
depth penetrations the use of detonators or explosives was<br />
successfully used to detect refracting horizons at depths<br />
of 50 to 60 m. An example of a deep refraction sounding<br />
is given in Fig. 171. An example of a seismic reflection<br />
profile is given in Fig.170. (See also Plate 71).<br />
Advantages and Disadvantages of the Seismic Method<br />
The operation and interpretation of a seismic instrument<br />
is more complex and hence more expensive than the electrical<br />
resistivity method. It can nevertheless be extremely<br />
useful in interpreting data ,;here re.:H8tivi ties of dif:ferent
-'/<br />
/
611<br />
the depths to different lithological horizons to be<br />
accurately determined (See Fig. 87), and is particularly<br />
useful for delineating zones for the insertion of well<br />
screens or perforated casing, and for making correlations<br />
from borehole to borehole. Other methods used occasionally<br />
are self-potential (Fig.83 ),<br />
temperature logging (Fig.89 ).<br />
fluid resistivity and<br />
The use of fluid<br />
resistivity logs has proved extremely useful in indicating<br />
the depths of entry of water into boreholes.
l2<br />
THE USE OF ENVIRONHENTAL ISOTOPES IN BOTSW"ANA<br />
Introduction<br />
The provision of adequate water supplies for the<br />
rapidly gro1ving population in Botswana, which by the turn<br />
of the century will probably require three or four times<br />
the amount of water used at present, forms one of Botswana's<br />
most pressing problems. In common with most other<br />
developing countries, Botswana has been faced with a<br />
serious lack of adequate hydrological and hydrogeological<br />
records ,caused mainly by a lack of funds to enable these<br />
records to be built up. In addition, as available<br />
surface water resources become fully utilised, a growing<br />
need has arisen for "refined quantitative answers con<br />
cerning the country's ground-water resources. During<br />
the past fifteen years, a considerable amount of<br />
research has taken place else1vhere in the world using a<br />
variety of novel methods involving the use of isotopes<br />
in the hydrogeological field. These have proved con<br />
clusively, despite Carlston's (1964) cautiously pessi<br />
mistic warnings, that the use of isotopes can considerably<br />
aid in the solution of hydrogeological problems which<br />
could often otherwise only be solved by extremely long<br />
methods.<br />
and costly research programmes using conventional
617<br />
This preject forms a pioneering project on<br />
research using environmental isotopes in ground-water<br />
studies in Southern Africa and probably represents one<br />
of the most detailed studies of its kind undertaken.<br />
Its principal aim is to evaluate, as accurately as<br />
possible, the limits of applicability of this technique<br />
in Southern Africa. It was, furthermore, hoped that<br />
the techniques involved would be able to be applied<br />
elsew'here in areas where little long-term geohydro-<br />
logical data had been accumulated. This could be<br />
vitally important in other semi-arid and developing<br />
countries where funds are seldom available to conduct<br />
long-term ground-water research.<br />
At the same time as making an approach to the<br />
Nuclear Physics Research Unit at Witwatersrand Univer-<br />
sity to carry out tritium measurements, the writer<br />
contacted Professor J. C. Vogel, head of the Natuur-<br />
kundig Laboratorium of the Rijks-Universiteit in<br />
Groningen (Netherlands), with a view to carrying out<br />
h . B t . l4C<br />
a researc programme ln 0 swana uSlng • As 9.<br />
result, it was agreed by Dr. Vogel in a letter dated<br />
Jrd April 1965, to carry out a joint project in which<br />
approximately 15 samples per year would be analysed.<br />
Dr. Vogel remains as head of the Natuurkundig Labora-<br />
torium, but in addition is how head of the Natural<br />
Isotopes Division at the Council for Scientific and<br />
Industrial Research in Pretoria.
623<br />
The enrichment plant consists of a concentric<br />
tube column 7,2 metres in length, a hot wire column<br />
2,75 llietres long, two self-regulating magnesium reduc-<br />
tion vessels, a furnace with regulator for reduction vessels,<br />
and has a handling console, with metal vacuum line,<br />
pump and sampling vessels and an electrical control<br />
console for the columns. This whole system was developed<br />
and constructed at the N.P.R.U. (Verhagen and Sellschop,<br />
(1963, 1964, 1965, 1965a); Verhagen, (1964, 1967).<br />
Electrolytic Enrichment<br />
To cope with the increasing volume of samples<br />
that justify enrichment, it was decided to supplement<br />
the thermal diffusion system by the instalment of an<br />
electrolytic enrichment plant. All samples are now<br />
routinely enriched electrolytically and direct counting<br />
only resorted to when sample volume adequate for enrich<br />
ment is not available.<br />
Method of Measurement in the N.P; R.U. Laboratory<br />
All samples are first quantitatively distilled<br />
under vacuum. They are then enriched by electrolysis<br />
by a factor of 11 - 12 times with an accuracy of 7%.<br />
The resulting _electrolyte is then again vacuum distille d<br />
and the enriched water sample is reduced to hydrogen by<br />
reaction with magnesium turnings at 6oo o C. The hydrogen
629<br />
TABLE 76<br />
(, ' . . ;"<br />
• Lab.No • .Locality TU<br />
13.35 Bh 1379 Lobatse Estates<br />
Unbaked glass 0,6+0,31+0,5+0,3<br />
B.37 Bh 1379 Lobatse Estates<br />
+ .<br />
L"D" Polythene 0,4::0,3 0,5-0,3<br />
B.38 Bh 1379 Lobatse Estates . of!<br />
H"D. Polythene 0,5-0,3<br />
As can be seen from the above, no exchange of tritium<br />
from the higher levels of tritium in the air moisture<br />
0,2::0,2<br />
(30-70 TU) appears to have taken place through the walls<br />
of any of the containers and it
During the period November 1962 to 1958 a number<br />
of thermonuclear devices were exploded in the northern<br />
hemisphere. These were accompanied by a marked rise<br />
in tritium levels in the northern hemisphere and a<br />
concomitant, but much lower rise in the southern hemis<br />
phere.. The moratorium on atmospheric nuclear tests<br />
(1958 - 1961) led to a temporary halt in this upward<br />
trend, but following the resumption of testing in 1961<br />
and 1962, there was a dramatic rise in maxima of up<br />
to 10 000 TU being recorded ,at ''''-hi tehorse, Yukon in<br />
April 1963. In the interior of southern Africa, the<br />
tritium level (adjusted to give the input for effective<br />
recharge) also reached a peak in 1963. and was approx<br />
imately 9 times the pre-bomb level ..<br />
These thermonuclear tests thus disturbed the quasi<br />
steady-state in n atural tritium and resulted in a series<br />
of periodic pulses of tritium in the hydrological cycles<br />
which could be traced through surface and ground-water<br />
systems.<br />
Tritium in Ground-Water<br />
Water turnover times in the terrestrial part of<br />
the hydrological c y cle - e.g. lakes and ground-water<br />
systems, are generally longer than in the atmosphere and<br />
the time scale of tritium (! 50 years) has proved to<br />
be extremely useful for geohydrological studies ..
646<br />
Tritium in Southern African Rainfall<br />
,In the southern hemisphere, Taylor (1966) has<br />
shown that southern mid-latitude rain contains no signi<br />
ficant tritium contribution from spreading across the<br />
equator within the troposphere, This is due to a com-<br />
bination of the highly effective rainout by the tropical<br />
rain belts and the short tropospheric fall-out time,<br />
The increase in the HTO content of rainw'ater is due mainly<br />
to delayed stratospheric fall-out originating from<br />
higher stratospheric regions or the mesosphere caused<br />
originally by thermonuclear testing in equatorial<br />
regions and later by Soviet testing in Arctic regions.<br />
Seasonal variation is observed in the tritium<br />
concentration in rain over the whole of the southern<br />
African region .. This effect is more marked in the<br />
interior where concentrations are higher and spring<br />
rains occur, The sampling of rain water in South<br />
Africa for tritium measurements has shown clearly<br />
(Verhagen et aI, 1970) that peaks occur in tritium<br />
concentrations in spring and early summer (August _<br />
November) falling to a minimum in autumn and,when rain<br />
occurs, in winter .. Peaks may be four to five times<br />
that of the winter minima. A similar periodicity is<br />
observed in the rainfall figures, but with maxima<br />
occurring four months later. The tritium in precipi-<br />
tat ion concentration curve a nd the rainfall curve are
648<br />
uncertainties in these figures lead to the use of 'a range<br />
of pre-bomb tritium precipitation values. Taking into<br />
account the selection mechanism described above, a range<br />
of 5-l0 TU will be assumed for recharge up . to 1955,.<br />
when the first effect of bomb tritium could have been<br />
felt at these latitudes.<br />
TABLE 87<br />
EFFECTIVE RECHARGE TRITIUM CONCENTRATION AS FUNCTION<br />
OF YEARS<br />
YEAR TU<br />
Up to 1955 5 - lO<br />
1956/l957 l5<br />
1958/l960 20<br />
1961/l962 30<br />
1963 60<br />
1964 55<br />
1965/l966 50<br />
1967 40<br />
1968/l969 35<br />
1969/l970 30<br />
1970/l97l 28<br />
1971/l972 25<br />
1972/l973 20<br />
Estimates for the effective recharge concentration over<br />
the years for which figures are available "lvi th an extra-
649<br />
polation to 19S5, are given in Table 87 A conse-<br />
quence of these figures is that uncontaminated pre- bomb<br />
recharge can have a maximum concentration of about 2 TU<br />
at present.
657<br />
water in the basin, irrespective of its availability.<br />
This includes the water held in storage in the unsaturated<br />
zone.<br />
Taking the area of the valley floor over the<br />
2<br />
Western basin to be 3 km x 0,6 km = 1,8 km , ,the average<br />
depth to the water table 30 metres, the bulk density<br />
of the soil 1,6 x 10³kg m- 3 , and assuming a figure of<br />
8 per cent by weight of water in the unsaturated zone<br />
(the value obtained at the bottom of a 4,5m pit in<br />
Lobatse), the storage would be:<br />
3 000 x 600 x 30 x 1,6 x 10 3 x 0,08 = 6,9xl0 9 kg of water<br />
or 6,9 x 10 6 m 3 in the unsaturated zone.<br />
Because of the delay in the soil cover, the water<br />
infiltrating along this path will arrive at the water<br />
table w'ith an activity of about 0,1 TU (See section on<br />
infiltration in unsaturated zone). A significant part<br />
of the recharge should therefore be delayed less than<br />
that amount as the average concentration of water in<br />
the basin is about 0,8 TU. Run-off water from the hill<br />
slopes bordering Western Basin enters the coarse<br />
scree of the gravel fans at the foot of the hill during<br />
heavy do·wnpours • . It is postulated that it reaches the<br />
water table more rapidly than by normal flow infiltration<br />
through the thick soil cover on the flat ground.<br />
It has been estimated from the tritium profile<br />
that the infiltration of rainwater into the soil amounts
666<br />
Values as low as 0,8 TU have, on several 9ccasions,<br />
been observed in the basin which implies that older<br />
water is constantly drawn in. This could be derived<br />
either from other parts of the basin itself or through<br />
leaky barriers from adjoining water bodies. It is sig-<br />
nificant that such low values were observed at the<br />
bottom of Borehole 923, during an all-time high in<br />
rest level during 1969. Soon after, in 1970 on rene'ived<br />
drawdo'ivn, higher concentrations at depth were observed#<br />
Pumped water from such boreholes as 1010 and 1077<br />
shows fluctuations in tritium concentration, indicating<br />
the extreme mixing taking place in this basin. In<br />
Borehole 1041 the pronounced stratification observed in<br />
the water column in early 1968 diminished after a<br />
brief appearance, to the" point of disappearing by<br />
1971. It is possible that the stratification seen in<br />
1968 was a remnant of... the;. water level recovery and<br />
caused by recharge during the 1966/1967 season.<br />
The simple mean tritium concentration of all<br />
measurements done in this basin up to and including<br />
August 1969 is 3,6 TU (55 measurements ), Between and<br />
including September 1969 and:rvIarch 1971 (61 measure<br />
ments),it is 3,8 TU. The small increase observed<br />
shows that:<br />
a) The tritium level was well established by the<br />
time observations began - i.e. through the
670<br />
This argument is, of course, valid only if there<br />
is considerable resistance to flow between the two sections<br />
of the 'aquifer.<br />
This should be .the case, as the trans-<br />
missibility in the Southern basin itself is known to be<br />
low.<br />
To assess the lowest limit of the tritium concentra<br />
tion being fed to the basin through this mechanism, "tve<br />
calculate the maximum delay and storage in the unsaturated<br />
and saturated zones in the adjoining basin. The time<br />
constants obtained are 38 years for the unsaturated zone<br />
and 25 years for the saturated zone. At such delays, we<br />
can assume pre-bomb input, and the output should therefore<br />
minimally be 0,3 TU.<br />
The fact that the lowest values measured in<br />
Southern basin were 0,8 TU means that more recent water<br />
had admixed to these samples, either in the basin itself<br />
or from recent infiltration from the river bed.<br />
Lobatse Estates Central Basin<br />
The aquifer of this basin consists of sediments of<br />
Pretoria Subgroup quartzites with interbedded shale,<br />
calcareous and argillaceous horizons, dipping westwards.<br />
The basin has hillslopes bounding it on the south<br />
and east, is separated from the Southern basin by a prominent<br />
wrench fault and is thought to be bounded on the north by<br />
another fault south of the Peleng River course.
4.<br />
other (older ) water is being dra'\VIl in.<br />
This is the case respectively with the East<br />
ern basin and the Lobatse Estates South basin.<br />
Higher tritium concentrations have indicated<br />
areas of recharge. Such an area was found<br />
around the wells DCl (1368) and DC3 as well<br />
as AIO, which could be recharged either by<br />
the river or from a large gulley to the west.<br />
Subsequent to these findings, all the wells in<br />
the area were accurately levelled during a<br />
period in which no water was pumped. Wells<br />
1368 and AIO had markedly higher water levels<br />
than those elsewhere.<br />
was therefore discovered.<br />
A recharge area<br />
The recharge mechanism to a number of these<br />
basins was more clearly defined. The seepage<br />
through the unsaturated zone over the Western<br />
basin was sho\VIl to be supplemented by a more<br />
rapid ingress of water probably along a scree<br />
zone. The rapid recharge to Eastern and<br />
Southern basins was linked largely to the<br />
flooding of the Peleng River. (Plate 55).<br />
In the Central basin, however, tritium failed<br />
to indicate the sources of mechanism of recharge,<br />
because of the general lowness of the concentra-<br />
tions. The consistent extreme lo\vnes s of
5.<br />
679<br />
tritium concentration of Borehole 1379(<br />
mean value 0,4 TU) gives some indication o-f<br />
-flow to the southwestern part of the basin,<br />
whilst Borehole 2270, near a fault cutting<br />
the river bed and in a major gully on the<br />
hillslope, shows both higher tritium concentra-<br />
tionand water level. For the rest, con-<br />
centrations in the Central basin are quite '<br />
uniform, indicating good mixing in this<br />
highly permeable aquifer (proved by aquifer<br />
testing) *<br />
Calculating storage capacities for the different<br />
basins from tritium data provided consistently<br />
higher values than those obtained from the draw-<br />
down and pumping figures alone. However,<br />
infiltration measurements through the unsatur<br />
ated zone have underlined the importance of<br />
storage in that zone. As the turnover rate in<br />
a ground water basin, calculated on the premise<br />
of the well-mixed model, takes account of all<br />
the water, a . basis has now been found for a<br />
more reasonable correspondence between the two<br />
approaches. In addition, it now becomes clear<br />
that the "classicallf storage calculations,<br />
although still lo\ver limit estimates, are<br />
closer to a true assessment of the recoverable<br />
storage than previously believed.
686<br />
postulated ground-water flow away from the recharge area<br />
with its high water levels. Recharge through the<br />
basalt is determined by the degree of weathering, fissuring<br />
e tc • , and +he OJ hl."gher tritium concentrations in some<br />
basalt boreholes probably indicate areas of local recharge<br />
through the basalt.<br />
Sampling from unused (observation) boreholes using<br />
a depth sampler has proved to be a most fruitful technique<br />
in the environmentaJ" tritium study in Serowe. Large<br />
fluctuations in concentration were observed in two<br />
boreholes, 670 and 1929 as well as transient depth profiles.<br />
(See Tables 85, 86). These results demonstrated direct<br />
recharge through the basalt and subsequent slower mixing<br />
into the whole ground-water reservoir.<br />
In the case of Borehole 670, the high value of<br />
12 TU coincided with an extreme high in the hydrograph<br />
(see Fig. 176 ) .. The tritium concentration then dropped<br />
along with the hydro graph. Over the same period, extreme<br />
stratification was observed in Borehole 1929 which then<br />
equalised fairly rapidly and eventually vanished .. Interest-<br />
ingly, this was not accompanied by any large rest level<br />
fluctuations (less than 0,5 metres). A further point of<br />
interest is the fact that Borehole 1929 lies several kilo-<br />
metres to the east of the recharge area in which Borehole<br />
670 is situated. The presence of tritium in Borehole<br />
1929 therefore indicates that significant infiltra.tion<br />
occurs in other areas as well as in Central Serowe.
688<br />
Borehole 670 is known to be sited in a basin of<br />
decomposition in the basalt and during the period of<br />
observation described above was being used as an observation<br />
hole in the immediate vicinity of two production holes.<br />
The interpretation given to the observed tritium con<br />
centrations and the hydrograph is as follows:<br />
Tritium concentrations rise immediately on rain<br />
recharge. The tritium is fairly rapidly dissipated by<br />
both the exploitation and the mixing of the recharged<br />
water into the underlying aquifer. The uniformity of<br />
the tritium concentrations throughout the column is<br />
associated with the large rise in water level in the<br />
upper low storage capacity perched basin in the basalt.<br />
Exploitation then kept the mixture that developed between<br />
younger and older water uniform. The persistence of the<br />
higher tritium levels for some time could be associated<br />
with a much higher impedance to downward than to internal<br />
mixing. (See Table 53, p.420).<br />
In Borehole 1929, hydrological conditions are far<br />
more uniform and the tritium profile in the static water<br />
column in the hole reflects the downward ·mixing remarkably<br />
clearly. This downward mixing is taken as important<br />
evidence (See chapter on Serowe in this thesis) that the<br />
lower portions of the sandstone constitute a significant<br />
aquifer, in contrast to earlier assumptions (Anon, 1969)<br />
that water is confined to the upper (contact) zone.
715<br />
lLo<br />
History of use of rC in Botswana<br />
Following an approach by the writer to Professor<br />
J. C. Vogel, head of the Natuurkundig Laboratorium of<br />
the Rijks - Universiteit in Groningen (Netherlands),<br />
i 't "ms agreed in August 1965 to carry out a limited<br />
research programme in Botswana in which approximately<br />
15 samples per year would be analysed. Following this<br />
agreement, several visits to the southern and central<br />
Kalahari areas were made to collect water samples in<br />
1967, 1968 and 1970. Further sampling in 1971 and<br />
1972 was carried out by joint teams from the Geological<br />
Survey and from the Nuclear Physics Research Unit of the<br />
University of Witwatersrand. (Mazor et aI, 1974). '<br />
Sampling<br />
Prolonged contact of ground water with the atmos-<br />
phere results in isotopic e x change between the carbon<br />
dioxide in the air and the dissolved bicarbonate in<br />
the ground we.ter and results in the l4C content of the<br />
water being increased. Care was 'therefore taken to<br />
ensure that the borehole being sampled was pumped for a<br />
sufficient period to remove all water in the borehole<br />
column which is likely to have been in contact with the<br />
air. Care was also taken to see that the water was<br />
in an airtight container .
Apparatus and Analysis<br />
716<br />
Jnitially all water samples were collected in<br />
tightly sealed 44 gallon drums and were brought back<br />
to the Geological Survey Chemical Laboratory where the<br />
sample was concentrated and sent in dried form as barium<br />
carbonate to Holland for counting.<br />
Following the visit of Dr. J. C. Vogel to Botswana<br />
in May 1968, a much simplified version of the original<br />
laboratory apparatus was constructed and is shown in<br />
Fig. 200<br />
This consists of a 60 or 100 litre<br />
container connected by 2 tubes to a 200 ml plastic<br />
flask filled with IN Na OR solution. The acidified<br />
'va ter is circulated using a modified aquarium pump<br />
""hich runs off a 12 volt car battery which is converted<br />
to alternating current by a small electronic converter.<br />
The carbon, dioxide liberated by the acid is absorbed<br />
in the alkali within 4 to 5 hours. Samples can thus<br />
be easily concentrated in the field and it is then<br />
only necessary to send the 200 ml flasks to the labo-<br />
ratory for analysis. This is done by liberating CO 2<br />
gas which is introduced to sensitive gas counters and<br />
the concentration measured.<br />
, CARBON-FOURTEEN SANPLING IN BOTSWANA<br />
14<br />
Two areas in Botswana were sampled for Cage<br />
measurements in relatively great detail: viz. the
6.<br />
728<br />
Interpretation of the presence of very small<br />
but measurable amounts of tritium indicate that<br />
recent recharge had taken place prior to 1952.<br />
The presence of tritium combined with the cal<br />
culated flow rate of 40m per year from the l4.C<br />
data indicates that recharge is taking place by<br />
direct infiltration through the Kalahari Beds,<br />
or by infiltration in the Matsap Beds to the<br />
south,and then by gravity flow into the Karoo<br />
Beds further to the north.<br />
The stable isotope data indicates recharge having<br />
occurred during a period of intense rainfall with<br />
low evaporat ion.<br />
Molopo State Lands and<br />
1-"estern Bangwaketse Areas (Southern Botswana)<br />
Hydrogeology<br />
The greater part of the western Bangwaketse and<br />
Molopo State Lands is covered by a superficial cover up<br />
to 168 rn thick consisting predominantly of sands of<br />
Kalahari type, marl, calcrete, silcrete and minor<br />
ferricrete. Cemented fluviatile sand and gravel (cal-<br />
crp-tised) are occasionally exposed in the fossil rivers<br />
and in numerous boreholes. The bedrock underlying<br />
these relatively young superficial deposits rarely crops out.<br />
However the relatively large number of deep water
·-,<br />
, " /<br />
;<br />
. I ,<br />
I<br />
"
752<br />
(2) The storage coefficient, S#<br />
(3) The hydraulic gradient (Heath , and<br />
Trainer, 1968)<br />
Examples of natural recession curves are not commonly<br />
encountered in Botswana, probably mainly due to the lack<br />
of observation boreholes away from the influence of<br />
pumped boreholes or other compl£cating factors. !<br />
Fig. 28sho,"s a natural recession curve(before end of<br />
1960 only) for borehole 1071 in the Lobatse Estates<br />
south basin prior to the commencement of heavy pumping<br />
from the basin.<br />
Figures 72 - 75, 188 ShOlv recession hydrographs for<br />
Mahata, Makoba, Tshepe, Mashoro, Bosupswe and Serwe.<br />
Robins (1972) has noted that all curves barring Makoba<br />
and Serwe show a natural recession with a constant drop<br />
of 0, 16m per year, while the 'vater level at Makoba is<br />
dropping 1,14m per year due to local pumping.<br />
The writer feels, however, in view of the fact that all<br />
the observation boreholes quoted above are in close proxi<br />
mity to boreholes used for cattle watering purposes, that<br />
these could be pumping recession curvesJ or a recession<br />
resulting from a combination of natural loss and pump-<br />
ing. Another natural recession curve is shown in. Fig. 189<br />
Fluctuations caused by seasonal changes<br />
Because of the distinct wet and dry seasons and the great<br />
variability in rainfall with consequent seasonal and<br />
variable n a ture of recharge,hydrographs in Botswana<br />
often show marked long term seasonal fluctuations .•
1:lI'\<br />
l'-<br />
MONTH<br />
JULY<br />
AUG.<br />
SEPT.<br />
OCT.<br />
NOV.<br />
DEC.<br />
JAN.<br />
FEB.<br />
MARCH<br />
APRIL<br />
MAY<br />
JUNE<br />
T .A B L E 103<br />
CUMULATIVE DEPARTURE CURVE FROM MEAN MONTHLY PRECIPITATION I N INCHES - LoBATSE<br />
1956/7 1957/8<br />
MEAN RAINFALL (35 YRS) RAINFALL DEPARTURE FROM CUMULATIVE RAINFALL<br />
NORMAL DEPARTURE<br />
0,22 - -0,22 +7,47 3,11<br />
0,08 - -0,08 +7,39 -<br />
0,49 0,34 -0,15 +7,24 2,96<br />
1,81 2,60 +0,79 +8,03 3,31<br />
2,66 1,37 -1,29 +6,74 3,90<br />
3,80 2,18 -1,62 +5,12 4,14<br />
3,76 2,57 -1,19 +3,92 5,79<br />
3,81 5,21 +1,40 +5,33 2,43<br />
3,04 2,73 -0,31 +5,02 2,39<br />
1,87 0,24 -1,63 +3,39 2,06<br />
0,64 0,16 -0,48 +2,91 -<br />
0,14 1,89 +1,75 +4,66 -<br />
-<br />
. --<br />
DEPARTURE FROM CUMULATIVI<br />
NORMAL DEPARTURE<br />
+2,89 7,55<br />
-0,08 7,47<br />
+2,47 9,94<br />
+1,50 11,44<br />
+1,84 13,28<br />
+0,34 13,62<br />
+2,03 15,65<br />
-1,38 14,27<br />
-0,65 13,62<br />
+0,19 13,81<br />
-0,64 13,17<br />
-0,14 13,03
co<br />
U\<br />
t-<br />
MONTH<br />
JULY<br />
AUG,.<br />
SEPT.<br />
OCT.<br />
NOV.<br />
DEC.<br />
JAN.<br />
FEB.<br />
MARCH<br />
APR.<br />
MAY<br />
JUNE<br />
"<br />
TAB L E 103<br />
CUMULATIVE D(PARTURE CURVE FROM MEAN MONTHLY PRECIPITATION IN INCHES - LOBATSE<br />
-- -- -- --,----,.<br />
RAINFALL DEPARTURE FROM CUMULATIVE DEPARTURE RAINFALL DEPARTURE FROM<br />
NORMAL NORMAL<br />
- -0,22 12,81 0,21 -0,01<br />
,<br />
- -0,08 12,73 - -0,08<br />
1,10 +0,61 13,34 - -0,49<br />
1,79 -0,02 '13,32 0,69 -1,12<br />
3,12 +0,46 13,78 2,15 -0,51<br />
4,76 +0,96 14,74 5,20 +1,40<br />
5,26 +1,50 16,24 2,86 -0,90<br />
2,13 -1,68 14,56 1,89 -1,92<br />
2,39 -0,65 13,91 2,36 -0,68<br />
2,06 +0,19 14,10 1,18 -0,69<br />
- -0,64 13,46 0,09 -0,55<br />
- -0,14 13,32 0,30 +0,16<br />
-----<br />
CUMULATIVE DEPARTURE<br />
12,31<br />
12,23<br />
11,74<br />
10,62<br />
10,11<br />
11,51<br />
10,61<br />
8,69<br />
8,01<br />
7,32<br />
6,77<br />
6,93<br />
,<br />
' !
0'1<br />
l1'\<br />
t-<br />
MONTH _. -<br />
JULY<br />
AUG..<br />
SEPT.<br />
OCT.<br />
NOV.<br />
DEC.<br />
JAN.<br />
FEB.<br />
MARCH<br />
APR .<br />
r'1AY<br />
JUNE<br />
TAB L E 103<br />
CUMULATIVE DEPARTURE CURVE FROM MEAN MONTHLY PRECIPITATION IN INCHES - LOBATSE<br />
1960/1 (29,42in) 1961/2 (19,66in)<br />
RAINFALL DEPARTURE FROM CUMULATIVE DEPARTURE RAINFALL DEPARTURE FROM<br />
NORMAL NORMAL<br />
0,38 +0,16 7,09 0,63 +0,41<br />
0,15 +0,07 7,16 0,23 +0,15<br />
0,13 -0,36 6,80 - -0,49<br />
1,56 -0,25 6,55 0,76 -1,05<br />
4,03 +1,37 7,92 2,15 -0,51<br />
7,02 +3,22 11,24 1,90 -1,90<br />
1,55 -2,21 9,03 3,12 -0,64<br />
5,06 +1,25 10,28 2,51 -1,30<br />
,<br />
1,73 -1,31 8,97 3,04 0,00<br />
.<br />
7,05 +5,18 14,15 5,32 +3,45<br />
2,39 +1,75 15,90 - -0,64<br />
0,76 +0,62 16,52 - -0,14<br />
CUMULATIVE<br />
DEPARTURE<br />
16,93<br />
17,08<br />
16,59<br />
15,54<br />
15,03<br />
13,13<br />
12,49<br />
11,19<br />
11,19<br />
14,64<br />
14,00<br />
13,86
o<br />
\D<br />
r:-<br />
MONTH<br />
JULY<br />
AUG.<br />
SEPT.<br />
OCT.<br />
NOV.<br />
DEC.<br />
JAN.<br />
FEB.<br />
MARCH<br />
APR.<br />
MAY<br />
JUNE<br />
TAB L E 103<br />
CUMULATIVE DEPARTURE CURVE FROM MEAN MONTHLY PRECIPITATION IN INCHES - LOBATSE<br />
1962/3 (15,99in) 1963/4 (15,05in)<br />
RAINFALL DEPARTURE FROM CUMULATIVE DEPARTURE RAINFALL DEPARTURE FROM<br />
NORMAL NORMAL<br />
- -0,22 13,64 - -0,22<br />
0,05 -0,03 13,61 - -0,08<br />
0,11 -0,38 13,23 - -0,49<br />
0,80 -1, Dl 12,22 5,05 +3,24<br />
5,31 +2,65 14,87 3,44 +0,78<br />
0,96 -2,84 12,03 0,15 -3,65<br />
.'<br />
4,37 +0,61 12,64 3,39 -0,37<br />
0,28 -3,53 9,11 1,25 -2,56<br />
1,05 -1,99 7,12 1,61 -1,43<br />
1,18 -0,69 6,43 0,02 -1,85<br />
0,90 +0,26 6,69 - -0,64<br />
0,98 +0,84 7,53 0,14 .-0,00<br />
CUMULATIVE<br />
DEPARTURE<br />
7,31<br />
7,23<br />
6,74<br />
9,98<br />
10,76<br />
7,11<br />
6,74<br />
4,18<br />
2,75<br />
0,90<br />
0,26<br />
0,26
t'<br />
\0<br />
t'-<br />
,<br />
J<br />
F<br />
M<br />
A<br />
M<br />
J<br />
J<br />
A<br />
S<br />
0<br />
N<br />
D<br />
TAB L E . 104<br />
CUMULATIVE DEPARTURE CURVE FOR LOBATSE E. BASI N (XI.) FROM LONG TERM MEAN RECHARGE RATE OF 0,80<br />
MILLIO N GALL ONS PER MON TH<br />
-<br />
1962 1963 1964 1965<br />
0,55 - 0, 25 + 17,20 0,78 - 0,02 17,52 0,41 - 0,39 14,62 1,32<br />
0,87 +0,07 +17,27 0,78 - 0,02 17,54 0,38 - 0,42 14,20 1,16<br />
0,92 +0,12 17,39 0,85 +0,05 17,59 0,97 +0,17 14,37 1,72<br />
0,80<br />
°<br />
17,39 0,82 +0,02 17,61 . 0,82 +0,02 14,39 0,70<br />
1,10 +0,30 17,69 0,70 -0,10 17,51 0,81 +0, Dl 14,40 0,67<br />
0,89 +0,09 17,78 0,79 - 0, Dl 17,50 0,69 - 0, 11 14,29 0,61<br />
0,90 +0,10 17,88 0,71 - 0,09 17,41 0,54 . -0 , 26 14,03 0,74<br />
0,75 - 0,05 17,83 0,40 -0,40 17, Dl 0,66 -0,14 13,89 0, 59<br />
0,90 +0,10 17,93 0,24 - 0, 56 16,45 0,78 -0,02 13,87 0,55<br />
0,68 - 0, 12 17,81 0,26 - 0, 54 15,91 0,78 - 0, 02 13,85 0,84<br />
0,58 - 0, 22 17,59 0,33 - 0, 47 15,44 0,49 -0,31 13,54 0,90<br />
0,75 - 0, 05 17,54 0,37 - 0,43 15, Dl 1 , 04 +0,24 13, 78 0,60<br />
-----<br />
.-<br />
+0,52 . 14,30<br />
+0,36 14,66<br />
+0,92 15,58<br />
-0,10 15,48<br />
-0,13 15,35<br />
-0,19 15,16<br />
-0,06 15,10<br />
-0,21 14,89<br />
-0,23 14,66<br />
-0,04 14,62<br />
+0,10 14,72<br />
-0,20 14,52<br />
I
777<br />
piezometric surface in boreholes A.4, A.7 and A.lO.<br />
The mag-<br />
nitude of the water level fluctuations varied from 0,01 feet<br />
( 3 mm ) toO, 06 ( 18 , 3 mm) •<br />
Other examples of typical water level<br />
:fluctuations due to diurnal pressure fluctuations are sho1ill<br />
in Figs. 190, 193.<br />
Water Level Fluctuations caused by Earth Tides<br />
Semi-diurnal fluctuations of water level ascribed to earth<br />
tides have been described by van Ivyk (1963) and others.<br />
(1963) showed that these result from earth-tides produced by<br />
the attraction of the moon and the sun.<br />
Similar earth-tidal fluctuations in water-level have been<br />
Van Ivyk<br />
observed in numerous boreholes in Botswana. Examples of such<br />
tidal fluctuations are given in Figs .. 193, 194, 195, 196, which<br />
also coincide with the various phases of the moon. It can be<br />
clearly seen that these £luctuations attain their greatest amp-<br />
litude at new and full moon and minimum amplitude during periods<br />
coinciding with the first and last quarters of the moon.<br />
Water Level Changes due to Rapid Infiltration to the Water Table<br />
Figures 98 and 99 show typical examples of rapid rises in 11iater<br />
level following heavy rain in Serowe, Figs. 47, 49, 50, 51, C:;? J-,<br />
53, 54, 55, 56, 57, 58, show typical hydrographs reflecting<br />
rapid response to heavy rain in Lobatse. The sympathetic<br />
response in boreholes in the Western basin is clearly sho'ill in<br />
Fig. 45. Figs. 197 - 199 show an interesting, and almost<br />
immediate response) in borehole 2l24 , of the water table at about<br />
10m to flood waters flo>ving past the adjacent large,
5 6 J 8 9 10<br />
.I<br />
· 26 ! · 2.7<br />
J.;1--.1- ___
787<br />
Observation of water levels and their long and short term fluc<br />
tuations thus forms one of the most important aspects of<br />
any hydrogeological research programme.
Pl.76<br />
Pl.77<br />
790<br />
Nodular calcrete underlying Ka"lahari sand<br />
at depth of about 1 m in Central Kalahari .<br />
Nuane River (north of Lobatse) in flood.<br />
1--:<br />
I<br />
i<br />
\<br />
I
7J \<br />
the clearing of all vegetation for pineapple farming.<br />
Dixey (1960) quotes the water used by cottonwood or<br />
saltcedar trees covering 640 acres (1 square mile) as<br />
being sufficient, during the growing season, to supply<br />
the needs of a city of about 25 000 inhabitants for a<br />
year.<br />
Depths to which Tree Roots can Penetrate<br />
Meinzer (1942) records that mesquite sends it's roots to<br />
more than 15 m, while van Wyk (1963) records that tree<br />
roots were found "in a great number of boreholes at depths<br />
of up to 80 feet (24 m) below' surface".<br />
During an underground inspection of the old Bushmen Mine<br />
in 1957 numbers of fine rootlets in fissured rock on the<br />
30 metre level were noted, while similar rootlets were observed<br />
on the 45 metre level of an exploration drive at the Mat-<br />
sitama copper prospect. Both localities are east of the<br />
Makgadikgadi pans. (C.7).<br />
In 1958 the writer retrieved living rootlets from an unused<br />
borehole (No. 1028) at Phuduhudu in the central Kalahari<br />
while carrying out an electrical resistivity log of the<br />
borehole. These rootlets ,"ere brought up on the heavy<br />
weight on the end of the cable and must have come from a<br />
depth exceeding 68 metres as the borehole was cased with<br />
unperforated casing from surface to this depth. The bore-<br />
hole is uncased beyond this depth and it is possible that<br />
the roots were utilising the easy passage made by the bore-<br />
hole to obtain water from the water table at 141 m (436 feet)<br />
below the surface. The only fair sized tree in the vicinity<br />
of the borehole was a "motlopi" (boscia albitrunca) a::1.d this
Pl.80<br />
Pl.81<br />
800<br />
I<br />
Dense riverine vegetation near Okavango- S1famps \<br />
Heas uringwater level in an obseryation<br />
borehole near Thamalakane River" Haun.<br />
. ______ I
8 01<br />
rocks and hence develop a clayey soil in an otherwise<br />
hard, rocky terrain. Unf ortunately the dykes are not<br />
sufficiently 'l..-eathe red for ground water to accumulate<br />
along these features, but nevertheless, because of their<br />
greater overlying soil cover, support a denser and more<br />
luxuriant vegetation cover. The writer has also sited<br />
boreholes on linear vegetational features (undoubtedly<br />
joint planes) in terrain underlain by Stormberg lavas<br />
at Serowe and Orapa without obtaining materially greater<br />
yields than in unjointed basalt elsew·here. (Probably<br />
because the aquifer is the contact with the underlying<br />
sandstone and not in the basalt).<br />
vegetational changes, associated with changes in the<br />
underlying geology may, how·ever, give indirect evidence<br />
resulting in the obtaining of good ground water supplies<br />
e.g. marked vegetation changes occur over the "greenschist<br />
belts II in Bots'l..-ana ,..-hich invariably yield greater quan<br />
.tities of ground water than in the surrounding gneissic<br />
rocks.
809<br />
Despite this, an excellent crop was obtained and only<br />
a series of carefully controlled irrigation experiments<br />
would be able to establish the added yield and revenue<br />
that this additional irrigation would have produced.<br />
It is possible that returns to additional irrigation<br />
would be so marginal that it would be preferable to<br />
apply irrigation atsuh-optimum levels.<br />
Cropping Possibilities and ·Programme<br />
Experience from .the one year experiment indicated<br />
that, except where the farmer has special horticul<br />
tural skills and is well placed for marketing his<br />
produce, the growing of crops such as fresh vegetables,<br />
as well as the growing of winter crops, should be<br />
avoided. This need not necessarily lead to a long<br />
slack winter period as the start of the summer cropping<br />
and the completion of harvesting may leave less than<br />
a few weeks' break.<br />
It was considered that a simple system of maize<br />
and cotton be considered. On a small holding of five<br />
acres, three might be devoted to maize with several<br />
staggered plantings and harvestings and two. to cotton.<br />
A labour profile drawn up from results under sprinkler<br />
irrigation shows that the annual labour requirements<br />
of 358 man-days would be readily within the ability<br />
of a peasant family unit which could be expected to<br />
provide 500 man-days between them. On this basis,
f .<br />
811<br />
Ttie third assumption is that an existing, but<br />
under-utilised, borehole is brought into full u se<br />
to provide irrigation water. It is thought that .<br />
800 to 1000 such boreholes exist in Botswana.<br />
Assumption 1 (Water freely available from<br />
surface supply )<br />
Total capital costs for<br />
sprinkler pump etc. ( 1968) =<br />
Depreciation on above<br />
Labour SOO man-days at SOc/day<br />
Gross margin on 7,68 acre plot<br />
:. Balance management & investment<br />
income<br />
Interest on capital at 8% per<br />
annum<br />
Return on capital<br />
=<br />
=<br />
=<br />
=<br />
=<br />
=<br />
=<br />
R1200 (RIOSO fixed<br />
equipment and<br />
RlSO working<br />
capital)<br />
RIOO<br />
R2S0<br />
R922<br />
R922 -<br />
RS72<br />
R96<br />
S72 -<br />
1200<br />
= 39,66%<br />
Assumption 2 (Borehole drilled specifically<br />
for irrigation)<br />
Borehole capital costs<br />
casing to 60m<br />
drilling and<br />
6 h.p. Lister engine and mono pump<br />
Annual depreciation<br />
Drilling and casing costs<br />
depreciated over 20 years<br />
TOTAL:<br />
Total life estimated at 720 000<br />
hours or 10 years minimum at<br />
2000 hours/year<br />
(R2S0 + RIOO)<br />
96% = 476<br />
1 200<br />
R850 '<br />
RIOOO<br />
R18S0<br />
RIoa
Annual maintenance<br />
812<br />
Say 2 major overhauis during 10 year<br />
life of engine and pump at R300 each<br />
= R600, or average/year = R60<br />
Interest Charges per Annum<br />
8% on initial investment of Rl 850<br />
Total depreciation + interest +<br />
maintenance per annum<br />
Sprinkler and borehole operating costs work<br />
out at 43 cents and 60 cents per acre inch<br />
respectively_<br />
For 40 inch annual irrigation, costs<br />
for 7,68 plot per annum =<br />
Total costs =<br />
Capital costs for sprinkler<br />
pump etc.<br />
Depreciation on above (10<br />
year li.fe)<br />
Interest charges on R1200 @ 8% pa<br />
Capital cost of storage reservoir<br />
and pipe line = R550 for 10 acre<br />
plot or R422 for 7,68 . acre unit<br />
Depreciation on reservoir<br />
over 20 years<br />
Interest on R422 @ 8% per annum<br />
Labour costs '- ' 500 man-days @ 50c<br />
Total depreciation,<br />
maintenance costs<br />
interest<br />
=<br />
=<br />
=<br />
=<br />
=<br />
=<br />
=<br />
=<br />
=<br />
=<br />
R148<br />
R350<br />
. R3l6<br />
R350 + 316<br />
R666<br />
R1200<br />
RIOO<br />
R2l<br />
R34<br />
R250<br />
R666 + 196 +<br />
5 5 + 250<br />
= R919 + 250<br />
= 1169<br />
Net annual loss per 7,68 acre<br />
unit = R247
= 0,40 cents/hour<br />
Total running costs = 6,55 cents/hour<br />
qosts per unit volume of water<br />
OR<br />
6,65 cents/hour = 2,7 cents per 1000 gallons<br />
2500 gallons/hour<br />
2,7 x 22645<br />
1000<br />
= 60 cents per acre inch<br />
Upton (1969) has supplied costs for the pumping of a<br />
high yielding shallow borehole on the farm Gesond in<br />
the Tuli Block :-<br />
"1.. Capital Cost<br />
Drilling and casing<br />
Equipping<br />
2.. Annual Costs<br />
TOTAL<br />
Assuming economic life of 10 years<br />
at 8%<br />
Annual sinking fund annuity<br />
Operating costs, fuel oil and<br />
maintenance<br />
TOTAL<br />
A yield of 45000 gallons per hour,<br />
R<br />
500<br />
5000<br />
5500<br />
820<br />
1000<br />
1820<br />
10 hours per day should water 69,6 acres (27,8 ha) ..
( \<br />
819<br />
LEGAL ASPECTS OF GROUND 'vATER IN BOTSWANA<br />
INTRODUCTION<br />
Botswana is extremely fortunate that legis<br />
l ation was introduced at an early stage ensuring that<br />
the invaluable information relating to all boreholes<br />
sunk in the territory be submitted to the Geological<br />
Survey, together with samples of strata penetrated by<br />
the bore. This has proved to be of tremendous use,<br />
not only for the siting of further boreholes and for<br />
hydrogeological research purposes, but also as a valu<br />
able aid to geological mapping.<br />
BOIvS\vANA BOREHOLE PROCLAMATION NUMBER 62 OF 1956<br />
In terms of the Botswana Borehole Proclamation<br />
(No. 62 of 1956) all Drillers and Drilling Contractors,<br />
who operate in the territory, are required to submit the<br />
following to the Director of Geological Survey at<br />
Lobatse:-<br />
(a)<br />
(c)<br />
Notice in writing of the intention to<br />
sink a borehole.<br />
A record of the progress of the work<br />
which includes measurements of strata<br />
passed through, levels at which water<br />
is encountered, and the level at<br />
which the water finally rests.<br />
The results of a pumping test.
(<br />
821<br />
be referred to whenever necessary.<br />
All samples sub-<br />
mitted to the Survey are logged by a geologist and the<br />
log filed on an index card in the water record office .<br />
THE 'vATER ACT OF 1967<br />
The Water Act, 1967, came into force on 9th<br />
February 1968 and applies to the whole of Botswana.<br />
The purpose of the Act is to control the use of public<br />
water , that is water flowing over the surface of the<br />
ground in rivers, streams,springs , lakes or pans, or<br />
under river beds or underground. The Act was introduced<br />
to ensure that Botswana1s scanty water resources be<br />
used to the best advantage of the country. It was also<br />
considered necessary to protect the interests of persons<br />
who have acquired or been granted rights to use water<br />
as well as to maintain a record of rights to the use of<br />
water.<br />
Holders of existing rie;hts were given a year<br />
from 9th February 1968 to . notify the Water Apportionment<br />
Board. After investigating an existing right to satisfy<br />
themselves that the right existed, it was recorded and<br />
a certificate issued by the Board.<br />
Except under an existing right, the Act pro<br />
hibits the diversion, damming, storing, obstructing,<br />
polluting, or constructing of any water works on public<br />
water unless under a right granted in accordance with<br />
the Water Act . A person may, however, take water for
f<br />
822<br />
the immediate purpose of watering stock or drinking,<br />
washing and cooking or use in a vehicle from any public<br />
water without a water right.<br />
The owner or occupier of any land may, without<br />
a water right, sink or deepen a well or borehole on his<br />
land and abstract or rise water from it for domestic<br />
purposes up to a limited quantity a day to be prescribed<br />
by the Minister, but a borehole may not be s unk or<br />
deepened within 250 yards of any other borehole. He<br />
may also construct works on his land to conserve public<br />
water and may use it for domestic purposes, but he may<br />
not construct such works in a public stream unless the<br />
whole of the Catchment Area of the stream is not more<br />
than 2tmiles from the works.<br />
The powers of the lifa ter Apportionment Board,<br />
which administers the Water Act, includes the power to<br />
lay down conditions on which water rights are granted,<br />
and to cancel or reduce or vary water rights in certain<br />
circumstances. It may create servitudes in favour of<br />
holders of water rlghts where such servitudes are<br />
necessary to enable holders to enjoy their water rights<br />
and where servitudes cannot be obtained by agreement.<br />
Pollution of phblic water is punishable under<br />
the Act and p enalties are laid down for such infringements.
823<br />
GROUND WATER TEMPERATURES<br />
Introduction<br />
Van Wyk (1963) gave details of results of the measurement<br />
of temperatures of water in about 180 boreholes in Northern<br />
Natal and Zululand and found that the temperature of water<br />
was everywhere from 1 to 3,5 0 C higher than the mean annual<br />
air temperature and closely approached the mean summer air<br />
temperature. This accords well with findings in the United<br />
States of America where temperatures of ground water at a<br />
depth of 9 to 18m generally exceeded the mean annual air temp-<br />
o<br />
erature by 2 to 3 F (Todd, 1959). Tate, Robertson and Gray<br />
(1970) have given a valuable account of the use of temperature<br />
measurements in an investigation of fissure-flow in boreholes.<br />
Temperature Measurements in Botswana<br />
The systematic neasurement of ground-water temperatures was<br />
commenced in Botswana in 1966. Temperatures were measured<br />
with carefully calibrated mercury thermometers graduated in<br />
degrees· Fahrenheit. Temperat ure s were always taken as long<br />
as possible after the commencement of pumping so that the<br />
rising main could have no warming o r cooling effect (depending on<br />
whether measurements were taken i n summer or winter) on the<br />
water temperature. Ground water t emperatures in Botswana in<br />
general compare closely with the mean annual air temperature<br />
and become progressively warmer t owards the north.
824<br />
In-situ Water Temperature Measurements<br />
In addition to the measurement of pumped water temperatures<br />
a number of in-situ water temperature measurements were made<br />
in boreholes using a thermistor as sensor. This temperature<br />
logger was designed and built by the Geological Survey of<br />
Botswana. This instrument was later replaced by a less cum<br />
bersome commercially produced temperature logger made by the<br />
Tamron Instrument Company of Israel. This instrument has<br />
not yet been widely used but initial temperature logging of<br />
boreholes has indicated a steady increase in temperature with<br />
depth corresponding to the normal geothermal gradient. Small<br />
fluctuations in the overall temperature gradient are ascribed<br />
to points of entry or water into the borehole (Figs. 89 and 90 ).
Jans Draai<br />
Kransl)rak<br />
Kyky<br />
Grootbrak<br />
Kaspersdraai<br />
Langklass<br />
833<br />
(42579 ppm tds) , springbok, gemsbok<br />
and black-backed jackal.<br />
(38942 ppm tds), wildebeest , steenbok<br />
and secretary bird.<br />
( 26637 ppm tds), ostrich.<br />
(16403 ppm tds), hartebeest.<br />
(11611 ppm tds), lion, brown hyaena<br />
and spotted hyaena.<br />
(9 175 ppm tds) Cape fox.<br />
These authors stress that the results should be<br />
used to provide a measure of magnitude rather than as<br />
precise values partly because the relative activity of<br />
the four most common antelope near the boreholes was<br />
based on the frequency of defecations, some of which<br />
were several months old and the concentration of salts<br />
in the drinking 'vater may have changed since the animals<br />
visited it. In addition, there were also often large<br />
differences in composition between the effluent water<br />
from the borehole, the drinking trough and the overflow<br />
water (See Table 109 ) and also differences in the same<br />
borehole when sampled at different times (Table 110 ).<br />
Chemical data from fifteen boreholes along the<br />
Nossob River (Table 111) was subjected to multivariance<br />
analysis on an I.B.M. computer "No significant correla-<br />
tion emerged Letween the number of springbok, hartebeest<br />
and wildebeest defecations and the contrations of<br />
dissolved ions, either separately or as total dissolved<br />
salts . If
838<br />
The large differences in quality between the<br />
trough and the overflow (collected from pools in the<br />
floor of the dry river bed) is undoubtedly due to a<br />
combination of concentration of salts by evaporation,<br />
pollution by urine from the game animals and from<br />
solution of the alkaline salts present in the dry river<br />
bed. "<br />
Limits of tolerance in humans to mineralised ground water<br />
The World Health Organisation (1963) published<br />
international standards for drinking water, although<br />
it emphasised that rigid standards cannot be set,<br />
The following are the maximum allowable limits as set<br />
out by the W.H.O. :-<br />
Substance Maximum Allow"able<br />
Concentration ppm<br />
Total dissolved solids<br />
Iron<br />
Manganese<br />
Copper<br />
Zinc<br />
Arsenic<br />
Lead<br />
Calcium<br />
Magnesium<br />
Sulphate<br />
Chloride<br />
Magnesium + Sodium sulphate<br />
Nitrate<br />
Fluoride<br />
Cyanide<br />
1500<br />
1<br />
15<br />
200<br />
150<br />
400<br />
600<br />
1000<br />
45<br />
0,5<br />
1,5<br />
0,05<br />
0,05<br />
1,5<br />
0.2
839<br />
In practice the acceptability of water for<br />
drinking depends largely on "ivha t the individual is<br />
prepared to tolerate in regard to suspended matter,<br />
odour, colour and soluble salts while in many cases in<br />
Botswana, the total lack of any more suitable alternative<br />
source of water often results in waters, normally un<br />
acceptable by W.H.O. standards, being consumed. It<br />
is not surprising therefore that a random sample of 1200<br />
ground water analyses from Botswana showed that 17<br />
per cent would be classified as unpotable by World Health<br />
Organisation standards.<br />
In South Africa, Bond (1946) gave a detailed<br />
treatise on ground water geochemistry, while in South<br />
1vest Africa, van ivyk and Hamman (1969) and Hellwig<br />
(1969) have given details of ground water chemistry.<br />
Van Wyk and Hamman (1969) quote maximum allowable chem<br />
ical contents in water for humans of 1500 to 3000 ppm<br />
depending on whether used in towns with populations<br />
exceeding 10 000 or for farm use. Details of maximum<br />
allowable dissolved solid contents for South West Africa<br />
where conditions are very similar to Botswana are given<br />
in Table 112.
840<br />
TABLE 112<br />
Maximum permissable dissolved solid contents<br />
(After van '''''yk and Hamman .1969)<br />
Specification for A B C D<br />
pH 7,0-8,5 7,0-8,5 6,5-9,2 5,6-9,2<br />
Total dissolved salts 1500 2000 3000<br />
Sodium<br />
Calcium (as CaC0 3 )<br />
Magnesium (as MgC0 3 ) 200 600<br />
Nitrate (as N) 20 20 20<br />
Chloride<br />
Fluoride 1,5 2,0 2,0<br />
Sulphate 250 500 500<br />
ft . T0'vns with populations over 10 000<br />
B Villages, tourist camps and small state water<br />
schemes.<br />
C Limited water use such as farms<br />
5000<br />
2000<br />
2500<br />
2050<br />
90<br />
3000<br />
6,0<br />
1000<br />
D Livestock (standards laid down by Department of<br />
Agriculture and Technical Services, South Africa.)<br />
In Botswana water from the following boreholes ..<br />
or wells is used r e gula rly by humans as no alternative<br />
supplies are available:-
Sekhuma Pan 1vells<br />
Sir R. Englands borehole<br />
(windmill) Lobatse<br />
Morwamosu<br />
Nata Ranch house (BhP.201)<br />
841<br />
Bh.294l :Molopo Farms (C. Coetzee)<br />
(See Table 113).<br />
Quality of ,,;ater used by livestock<br />
T.D.S. 7328<br />
II 4416<br />
II 3856<br />
"<br />
2428<br />
II 2048<br />
In Botswana an arbitrary maximum limit of<br />
10 000 p.p.m. total dissolved solids has long been<br />
adopted with the sole proviso that the water has a<br />
predorrri..nantlysodium and chloride ionic composition. (Table 113)<br />
Comparitively little work has been done on the<br />
quality of drinking water tolerated by domestic stock<br />
apart from sheep (Pierce, 1957, 1959, 1960, 1961,<br />
1963 and 1965) and Anon. (1967) Table 113 taken<br />
from this report indicates the. upper limits recommended<br />
for livestock by State Authorities in Australia.<br />
Van Wyk and Hamman (1969) mention that an experi-<br />
mental farm had been set up in South West Africa to<br />
establish experimentally limits of tolerance of<br />
livestock to saline waters.
845<br />
1fuen assessing the safety of a water-supplY<br />
with regard to fluoride content, it is necessary to take<br />
into account a number of factors, such as the presence<br />
of fluorides in certain foods and also the total intake<br />
per day of water e.g. in hotter climates the water<br />
intake is likely to be much higher and hence more<br />
deleterious effects are likely to take place than in a<br />
colder climate.<br />
Out of several thousand boreholes and wells in<br />
Botswana on 'which chemical analyses have been carried<br />
out, no fewer than 403 contain fluoride concentrations<br />
of three or more parts per million. Fig. 201 shows a<br />
bar graph giving the distribution of supplies with varying<br />
fluoride concentrations. Concentrations in ground water<br />
range from nil to 60 ppm.<br />
It c an be seen therefore that fluoride concentra-<br />
tions occur f'requently at levels above the maximum allo1vable<br />
limit as set out by the World Health Organisation (1963)<br />
(i.e. 1.5 mg/l) and because of chronic water shortages,<br />
supplies 1"hich elsewhere in the world would normally be<br />
abandoned, have to be used often to the detriment of man<br />
and beast. There is thus an urgent need for an effective<br />
method of defluoridation of high-fluoride bearing 'vaters.<br />
Fluoride may be removed from water by ion-exchange or by<br />
absorption on various flocculent precipitates.<br />
Cillie (1955a,b) investigated the efficiencies of<br />
various defluoridising agents based on defluoridising capa-<br />
city; lowest residual fluoride concentration obtained' ,
F I<br />
, .<br />
'.
. ,<br />
850<br />
percolating through evaporite deposits often contain<br />
large quantities of potassium derived from solution of<br />
sylvite ( KCl ) and nitre ( K NO ).<br />
. 3<br />
All the abovementioned<br />
localities probably contain evaporite deposits.<br />
Waters in Botswana generally contain relatively<br />
low concentrations of potassium in most potable waters.<br />
General Remarks Concerning 1va ter Analyses in Bots1vana<br />
Remarks 'concerning water quality in general and<br />
variations in water quality with depth; with change in<br />
geological formation and with time have been given in<br />
the chapters on the Central Kalahari, Lobatse, Orapa and<br />
Serowe.<br />
The systematic analysis of ground waters has<br />
given valuable information on different types of ground<br />
water and its relationship to different geological form-<br />
ations; has assisted in determining time of recharge of<br />
boreholes while the conjunctive use of chemistry and<br />
isotopes as a tracer has enabled a picture of recharge<br />
mechanisms to be built up (e.g. Serowe Bhs 670 and 1970).
Details of ground-water chemistry and examples<br />
of fresh water overlying saline, saline water overlying<br />
fresh, chemical stratification with depth and changes in<br />
quality 1-lith time are given. The distribution of fluoride<br />
rich waters in Bbtswana is also given.<br />
This thesis has therefore attempted to outline<br />
the current status of hydrogeological research in Botswana<br />
and it is hoped that this will lay the foundation for later,<br />
more detailed and quantitative, studies. These will become<br />
even more vital than at present, as it is estimated that all<br />
readily available surface 1.;ater resources in eastern Botswana<br />
will be fully utilised by the late 1980's and the country<br />
'viII rely even more heavily on ground water than at . present.
Jennings,<br />
(1967)<br />
----- (196 9a)<br />
-------: (1970)<br />
(1971)<br />
(1973)<br />
Jennings, C.M.H#,<br />
Sellschop, J.P.F.,<br />
Verhagen, B. D.,<br />
Jones, M.T. (1974)<br />
Johnson, E.E.(1966)<br />
Jones, M.T.<br />
Geological Note on the Lebung-Serurume<br />
Areas. Rep. geol. Surv. Bech.,<br />
(Unpublished) •<br />
Report on a Survey of the Ground-Water<br />
Potential of the 1.Jestern Lobatse Groundwater<br />
Basin.<br />
The Geology of the Makhware Hills Area.<br />
(An Explanation of Quarter Degree Sheet<br />
2226D). Rec. geol. Surv. Bech. (1952-<br />
1960), 23-33.<br />
The Geology of the Serowe Area. (An<br />
Explanation of Quarter Degree Sheet 2226B).<br />
Rec. geol. Surv. Bech., (1961-1962).<br />
Serowe Water Supply : Rep. geol. Surv.<br />
Botswana, (Unpublished).<br />
An Aquifer Test on Borehole A2 at the<br />
Botswana Meat Commission, Lobatse.. Rep.<br />
geol. Surv. Botswana, (Unpublished).<br />
Groundwater in Botswana. C .. S .. I .. R. Symp.<br />
"Groundwater in Southern Africa. Pretoria,<br />
(Unpublished).<br />
Cyclic Denudational Surfaces in Botswana.<br />
Rep. geol. Surv. Botswana, (Unpublished).<br />
The Ground-Water Storage Capacity of the<br />
Lobatse Area. Rep. geol. Surv. Botswana,<br />
(Unpublished).<br />
Note on Hydrological Research in Botswana<br />
with Special Emphasis on Research in the<br />
Hydrogeological Field. S. Afr. J. Sci.,<br />
67 (1), 12-21. .<br />
Brief Notes on Recommended Drilling<br />
Programme to Supplement Orapa Water Supply.<br />
Report to AnrlO-American Corp. Ltd.,<br />
(Unpublished .<br />
Environmental Isotopes as an Aid to Investigatiori<br />
of Ground Water Problems in Botswana.<br />
Botswana Notes and Records, 5, Gaborone.<br />
Ground Ivater and Ivells, Edward E. Johnson,<br />
Inc., Saint Paul, Minnesota, 440.<br />
A Note on the Distribution of Waterberg<br />
and Loskop Formations in the Area Between<br />
Nochudi and Palla Camp and a CompaJ:'ison<br />
with Successions in Other Selected Areas .<br />
Rep. geol. Surv. Bech. , (Unpublished).