Cavitation and Hydraulic Flip in the Outward-Opening GDi ... - Delphi
Cavitation and Hydraulic Flip in the Outward-Opening GDi ... - Delphi
Cavitation and Hydraulic Flip in the Outward-Opening GDi ... - Delphi

Create successful ePaper yourself
Turn your PDF publications into a flip-book with our unique Google optimized e-Paper software.
ambient doma<strong>in</strong> conta<strong>in</strong>s air at rest (with relevant<br />
<strong>the</strong>rmodynamic conditions).<br />
In <strong>the</strong> present calculations, <strong>the</strong> flow boundary conditions<br />
at <strong>the</strong> <strong>in</strong>let are prescribed static pressure, nom<strong>in</strong>al-zero<br />
vapour <strong>and</strong> air (for three-fluid cases) volume fractions<br />
<strong>and</strong> physical conditions (bubble number density). The<br />
boundary condition at outlet is prescribed static pressure.<br />
MULTI-PHASE FLOW SIMULATION RESULTS - Iso<strong>the</strong>rmal,<br />
two-fluid <strong>and</strong> three-fluid simulations have been<br />
performed for fuel system pressure variation between 5 –<br />
20MPa <strong>and</strong> <strong>the</strong> quantitative (pressure, flow rate) <strong>and</strong><br />
flow field results were checked aga<strong>in</strong>st <strong>the</strong><br />
measurements <strong>and</strong> <strong>the</strong> experimental imag<strong>in</strong>g data. In<br />
<strong>the</strong> present article, selected simulation flow-field results<br />
for <strong>the</strong> <strong>in</strong>jection conditions of 5 <strong>and</strong> 20 MPa fuel pressure<br />
<strong>and</strong> 0.4 MPa ambient pressure (for <strong>the</strong> fuel <strong>and</strong> ambient<br />
temperature of 23º C) are presented, analyzed <strong>and</strong><br />
compared with <strong>the</strong> imag<strong>in</strong>g data. These results are<br />
representative of <strong>the</strong> complexity of <strong>the</strong> liquid flow,<br />
cavitation <strong>and</strong> partial hydraulic flip <strong>in</strong> <strong>the</strong> valve group <strong>and</strong><br />
<strong>the</strong> level of agreement with <strong>the</strong> experimental data.<br />
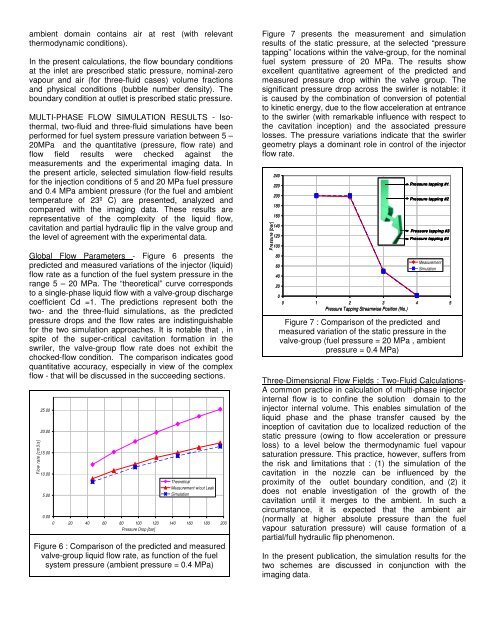
Global Flow Parameters - Figure 6 presents <strong>the</strong><br />
predicted <strong>and</strong> measured variations of <strong>the</strong> <strong>in</strong>jector (liquid)<br />
flow rate as a function of <strong>the</strong> fuel system pressure <strong>in</strong> <strong>the</strong><br />
range 5 – 20 MPa. The “<strong>the</strong>oretical” curve corresponds<br />
to a s<strong>in</strong>gle-phase liquid flow with a valve-group discharge<br />
coefficient Cd =1. The predictions represent both <strong>the</strong><br />
two- <strong>and</strong> <strong>the</strong> three-fluid simulations, as <strong>the</strong> predicted<br />
pressure drops <strong>and</strong> <strong>the</strong> flow rates are <strong>in</strong>dist<strong>in</strong>guishable<br />
for <strong>the</strong> two simulation approaches. It is notable that , <strong>in</strong><br />
spite of <strong>the</strong> super-critical cavitation formation <strong>in</strong> <strong>the</strong><br />
swriler, <strong>the</strong> valve-group flow rate does not exhibit <strong>the</strong><br />
chocked-flow condition. The comparison <strong>in</strong>dicates good<br />
quantitative accuracy, especially <strong>in</strong> view of <strong>the</strong> complex<br />
flow - that will be discussed <strong>in</strong> <strong>the</strong> succeed<strong>in</strong>g sections.<br />
Flow rate [cm3/s]<br />
25.00<br />
20.00<br />
15.00<br />
10.00<br />
5.00<br />
0.00<br />
Theoretical<br />
Measurement w/out Leak<br />
Simulation<br />
0 20 40 60 80 100 120 140 160 180 200<br />
Pressure Drop [bar]<br />
Figure 6 : Comparison of <strong>the</strong> predicted <strong>and</strong> measured<br />
valve-group liquid flow rate, as function of <strong>the</strong> fuel<br />
system pressure (ambient pressure = 0.4 MPa)<br />
Figure 7 presents <strong>the</strong> measurement <strong>and</strong> simulation<br />
results of <strong>the</strong> static pressure, at <strong>the</strong> selected “pressure<br />
tapp<strong>in</strong>g” locations with<strong>in</strong> <strong>the</strong> valve-group, for <strong>the</strong> nom<strong>in</strong>al<br />
fuel system pressure of 20 MPa. The results show<br />
excellent quantitative agreement of <strong>the</strong> predicted <strong>and</strong><br />
measured pressure drop with<strong>in</strong> <strong>the</strong> valve group. The<br />
significant pressure drop across <strong>the</strong> swirler is notable: it<br />
is caused by <strong>the</strong> comb<strong>in</strong>ation of conversion of potential<br />
to k<strong>in</strong>etic energy, due to <strong>the</strong> flow acceleration at entrance<br />
to <strong>the</strong> swirler (with remarkable <strong>in</strong>fluence with respect to<br />
<strong>the</strong> cavitation <strong>in</strong>ception) <strong>and</strong> <strong>the</strong> associated pressure<br />
losses. The pressure variations <strong>in</strong>dicate that <strong>the</strong> swirler<br />
geometry plays a dom<strong>in</strong>ant role <strong>in</strong> control of <strong>the</strong> <strong>in</strong>jector<br />
flow rate.<br />
P ressure [bar]<br />
240<br />
220<br />
200<br />
180<br />
160<br />
140<br />
120<br />
100<br />
80<br />
60<br />
40<br />
20<br />
Pressure tapp<strong>in</strong>g #1<br />
Pressure tapp<strong>in</strong>g #2<br />
Pressure tapp<strong>in</strong>g #3<br />
Pressure tapp<strong>in</strong>g #4<br />
Measurement<br />
Simulation<br />
0<br />
0 1 2 3 4 5<br />
Pressure Tapp<strong>in</strong>g Streamwise Position (No.)<br />
Figure 7 : Comparison of <strong>the</strong> predicted <strong>and</strong><br />
measured variation of <strong>the</strong> static pressure <strong>in</strong> <strong>the</strong><br />
valve-group (fuel pressure = 20 MPa , ambient<br />
pressure = 0.4 MPa)<br />
Three-Dimensional Flow Fields : Two-Fluid Calculations-<br />
A common practice <strong>in</strong> calculation of multi-phase <strong>in</strong>jector<br />
<strong>in</strong>ternal flow is to conf<strong>in</strong>e <strong>the</strong> solution doma<strong>in</strong> to <strong>the</strong><br />
<strong>in</strong>jector <strong>in</strong>ternal volume. This enables simulation of <strong>the</strong><br />
liquid phase <strong>and</strong> <strong>the</strong> phase transfer caused by <strong>the</strong><br />
<strong>in</strong>ception of cavitation due to localized reduction of <strong>the</strong><br />
static pressure (ow<strong>in</strong>g to flow acceleration or pressure<br />
loss) to a level below <strong>the</strong> <strong>the</strong>rmodynamic fuel vapour<br />
saturation pressure. This practice, however, suffers from<br />
<strong>the</strong> risk <strong>and</strong> limitations that : (1) <strong>the</strong> simulation of <strong>the</strong><br />
cavitation <strong>in</strong> <strong>the</strong> nozzle can be <strong>in</strong>fluenced by <strong>the</strong><br />
proximity of <strong>the</strong> outlet boundary condition, <strong>and</strong> (2) it<br />
does not enable <strong>in</strong>vestigation of <strong>the</strong> growth of <strong>the</strong><br />
cavitation until it merges to <strong>the</strong> ambient. In such a<br />
circumstance, it is expected that <strong>the</strong> ambient air<br />
(normally at higher absolute pressure than <strong>the</strong> fuel<br />
vapour saturation pressure) will cause formation of a<br />
partial/full hydraulic flip phenomenon.<br />
In <strong>the</strong> present publication, <strong>the</strong> simulation results for <strong>the</strong><br />
two schemes are discussed <strong>in</strong> conjunction with <strong>the</strong><br />
imag<strong>in</strong>g data.