

A New Mobility Transportation Master Plan for London
A New Mobility Transportation Master Plan for London
A New Mobility Transportation Master Plan for London

You also want an ePaper? Increase the reach of your titles
YUMPU automatically turns print PDFs into web optimized ePapers that Google loves.
A <strong>New</strong> <strong>Mobility</strong> <strong>Transportation</strong> <strong>Master</strong> <strong>Plan</strong> <strong>for</strong> <strong>London</strong><br />
Table 5. Recommended Weekday Peak Period Modal Share Targets<br />
Location<br />
Transit Active Transport Automobile<br />
2009 2020 2030 2009 2020 2030 2009 2020 2030<br />
City-Wide 12.5 15.0 20.0 8.0 11.0 15.0 73.5 68.0 60.0<br />
Nodes & Corridors 12.5 15.0 22.5 8.0 12.0 17.5 73.5 66.0 55.0<br />
Central Area 12.5 18.0 25.0 11.0 15.0 20.0 70.5 62.0 50.0<br />
2.4 Translating Growth into Future Travel Demands<br />
The previous section of the TMP focused on how to accommodate population growth in<br />
a more sustainable manner and the supporting key policy objectives that should guide<br />
future transportation planning in the City, including transportation mode share targets.<br />
Combined with these policy-based directions, the link between land use and<br />
transportation is further strengthened through the technical work of translating future<br />
growth into future travel demands.<br />
The City currently has a computerized travel <strong>for</strong>ecasting model that was upgraded as<br />
part of this TMP study. Its key outputs are projected volumes on the City’s road and<br />
transit networks <strong>for</strong> a typical weekday peak hour. The model was first calibrated to<br />
replicate existing conditions and then confidently applied to <strong>for</strong>ecast travel by mode <strong>for</strong><br />
future horizon years (in this case 2030).<br />
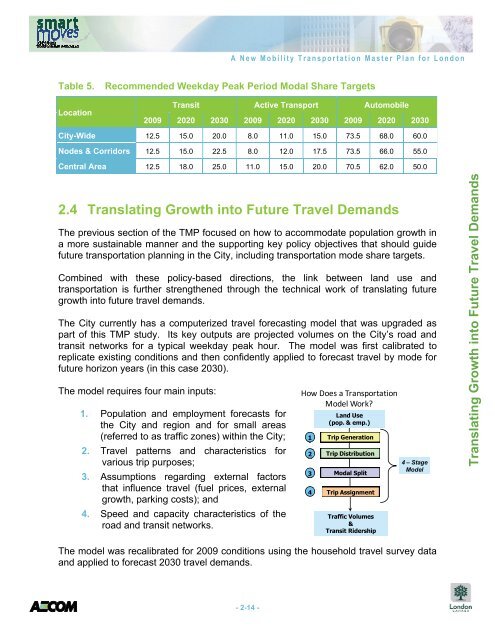
The model requires four main inputs:<br />
1. Population and employment <strong>for</strong>ecasts <strong>for</strong><br />
the City and region and <strong>for</strong> small areas<br />
(referred to as traffic zones) within the City;<br />
2. Travel patterns and characteristics <strong>for</strong><br />
various trip purposes;<br />
3. Assumptions regarding external factors<br />
that influence travel (fuel prices, external<br />
growth, parking costs); and<br />
4. Speed and capacity characteristics of the<br />
road and transit networks.<br />
The model was recalibrated <strong>for</strong> 2009 conditions using the household travel survey data<br />
and applied to <strong>for</strong>ecast 2030 travel demands.<br />
- 2-14 -<br />
How Does a <strong>Transportation</strong><br />
Model Work?<br />
1<br />
2<br />
3<br />
4<br />
Land Use<br />
(pop. & emp.)<br />
Trip Generation<br />
Trip Distribution<br />
Modal Split<br />
Trip Assignment<br />
Traffic Volumes<br />
&<br />
Transit Ridership<br />
4 – Stage<br />
Model<br />
Translating Growth into Future Travel Demands