

A New Mobility Transportation Master Plan for London
A New Mobility Transportation Master Plan for London
A New Mobility Transportation Master Plan for London

You also want an ePaper? Increase the reach of your titles
YUMPU automatically turns print PDFs into web optimized ePapers that Google loves.
A <strong>New</strong> <strong>Mobility</strong> <strong>Transportation</strong> <strong>Master</strong> <strong>Plan</strong> <strong>for</strong> <strong>London</strong><br />
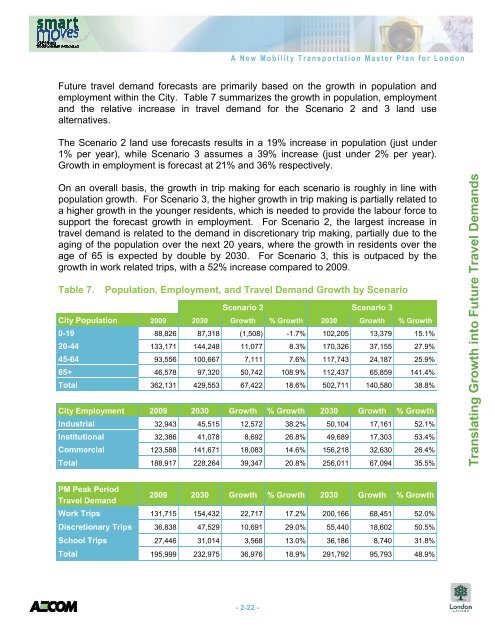
Future travel demand <strong>for</strong>ecasts are primarily based on the growth in population and<br />
employment within the City. Table 7 summarizes the growth in population, employment<br />
and the relative increase in travel demand <strong>for</strong> the Scenario 2 and 3 land use<br />
alternatives.<br />
The Scenario 2 land use <strong>for</strong>ecasts results in a 19% increase in population (just under<br />
1% per year), while Scenario 3 assumes a 39% increase (just under 2% per year).<br />
Growth in employment is <strong>for</strong>ecast at 21% and 36% respectively.<br />
On an overall basis, the growth in trip making <strong>for</strong> each scenario is roughly in line with<br />
population growth. For Scenario 3, the higher growth in trip making is partially related to<br />
a higher growth in the younger residents, which is needed to provide the labour <strong>for</strong>ce to<br />
support the <strong>for</strong>ecast growth in employment. For Scenario 2, the largest increase in<br />
travel demand is related to the demand in discretionary trip making, partially due to the<br />
aging of the population over the next 20 years, where the growth in residents over the<br />
age of 65 is expected by double by 2030. For Scenario 3, this is outpaced by the<br />
growth in work related trips, with a 52% increase compared to 2009.<br />
Table 7. Population, Employment, and Travel Demand Growth by Scenario<br />
Scenario 2 Scenario 3<br />
City Population 2009 2030 Growth % Growth 2030 Growth % Growth<br />
0-19 88,826 87,318 (1,508) -1.7% 102,205 13,379 15.1%<br />
20-44 133,171 144,248 11,077 8.3% 170,326 37,155 27.9%<br />
45-64 93,556 100,667 7,111 7.6% 117,743 24,187 25.9%<br />
65+ 46,578 97,320 50,742 108.9% 112,437 65,859 141.4%<br />
Total 362,131 429,553 67,422 18.6% 502,711 140,580 38.8%<br />
City Employment 2009 2030 Growth % Growth 2030 Growth % Growth<br />
Industrial 32,943 45,515 12,572 38.2% 50,104 17,161 52.1%<br />
Institutional 32,386 41,078 8,692 26.8% 49,689 17,303 53.4%<br />
Commercial 123,588 141,671 18,083 14.6% 156,218 32,630 26.4%<br />
Total 188,917 228,264 39,347 20.8% 256,011 67,094 35.5%<br />
PM Peak Period<br />
Travel Demand<br />
2009 2030 Growth % Growth 2030 Growth % Growth<br />
Work Trips 131,715 154,432 22,717 17.2% 200,166 68,451 52.0%<br />
Discretionary Trips 36,838 47,529 10,691 29.0% 55,440 18,602 50.5%<br />
School Trips 27,446 31,014 3,568 13.0% 36,186 8,740 31.8%<br />
Total 195,999 232,975 36,976 18.9% 291,792 95,793 48.9%<br />
- 2-22 -<br />
Translating Growth into Future Travel Demands