Nitrate Removal from Drinking Water in Iran Assessment of ... - Wabag
Nitrate Removal from Drinking Water in Iran Assessment of ... - Wabag
Nitrate Removal from Drinking Water in Iran Assessment of ... - Wabag

You also want an ePaper? Increase the reach of your titles
YUMPU automatically turns print PDFs into web optimized ePapers that Google loves.
<strong>Nitrate</strong> <strong>Removal</strong> <strong>from</strong> <strong>Dr<strong>in</strong>k<strong>in</strong>g</strong> <strong>Water</strong> <strong>in</strong> <strong>Iran</strong> <strong>Assessment</strong> <strong>of</strong> Three<br />
Different Treatment Processes Based On Pilot-Scale Investigations<br />
O. Dördelmann*, S. Panglisch*, F. Klegraf**, F. Hell**, A. Moshiri***, A. Emami*** and<br />
W.H. Höll****<br />
* IWW Institute for water research, Moritz Str. 26, 45476 Mülheim, Germany<br />
** VA Tech WABAG, Siemens Str. 89, A- 1211 Vienna, Austria<br />
*** Mashhad <strong>Water</strong> and Wastewater Co., Felest<strong>in</strong>e 26 Str., Mashhad, <strong>Iran</strong><br />
**** Forschungszentrum Karlsruhe, 76344 Eggenste<strong>in</strong>-Leopoldshafen, Germany<br />
Abstract Between 2004 and 2007 three pilot plants with different technologies for nitrate<br />
removal have been operated <strong>in</strong> Mashhad (<strong>Iran</strong>). The nitrate concentration <strong>in</strong> the groundwater was<br />
115 mg/l and the water quality goal after treatment was 40 mg/l. The objectives <strong>of</strong> this study<br />
were: ga<strong>in</strong><strong>in</strong>g experiences about the operation <strong>of</strong> the nitrate removal processes with regard to the<br />
specific conditions <strong>in</strong> <strong>Iran</strong> and evaluat<strong>in</strong>g the processes for decision-mak<strong>in</strong>g concern<strong>in</strong>g the most<br />
suitable treatment option for a full-scale nitrate removal plant <strong>in</strong> Mashhad. It was found that all<br />
three processes (Biological Denitrification, Reverse Osmosis (RO) and Ion Exchange) are capable<br />
to achieve the water quality goal. However, there are significant differences between these<br />
processes. Therefore, the treatment processes were assessed with regard to several aspects, e.g.<br />
effectiveness, stability, costs, dr<strong>in</strong>k<strong>in</strong>g water quality, human resources and environmental<br />
impacts. An assessment scheme with five ma<strong>in</strong> criteria and <strong>in</strong>dividual weight<strong>in</strong>g factors for these<br />
criteria was developed. Tak<strong>in</strong>g <strong>in</strong>to account the local boundary conditions, Biological<br />
Denitrification and RO were assessed to be the most favourable treatment processes for be<strong>in</strong>g<br />
operated <strong>in</strong> Mashhad/<strong>Iran</strong> <strong>in</strong> the future. However, chang<strong>in</strong>g boundary conditions, e.g. higher<br />
energy prices or different weight<strong>in</strong>g <strong>of</strong> assessment criteria may lead to different results.<br />
Keywords Biological Denitrification, <strong>Dr<strong>in</strong>k<strong>in</strong>g</strong> <strong>Water</strong> treatment, Ion Exchange, <strong>Nitrate</strong> <strong>Removal</strong>,<br />
Process <strong>Assessment</strong>, Reverse Osmosis<br />
INTRODUCTION<br />
In several middle-east countries <strong>in</strong>clud<strong>in</strong>g some places <strong>in</strong> <strong>Iran</strong> (e.g. Mashhad, Shiraz and southern<br />
parts <strong>of</strong> Tehran) high nitrate concentrations <strong>in</strong> groundwater have been detected. In most cases it is<br />
supposed that the high nitrate concentrations result <strong>from</strong> discharge <strong>of</strong> untreated wastewater and<br />
<strong>from</strong> agriculture. Mashhad is the 2 nd largest city <strong>in</strong> <strong>Iran</strong>. It has a population <strong>of</strong> approx. 2.4 million<br />
people and a high population growth. Additionally, over 12 Million pilgrims per year come to<br />
Mashhad for visit<strong>in</strong>g the holy shr<strong>in</strong>e <strong>of</strong> Imam Reza, which is one <strong>of</strong> the holiest places for Shiite<br />
people. The city is located <strong>in</strong> north-eastern <strong>Iran</strong> <strong>in</strong> a dry area (~ 200 - 250 mm ra<strong>in</strong>fall per year).<br />
At present, the water consumption <strong>in</strong> Mashhad is approx. 190 Mio. m 3 per year and Mashhad s<br />
water supply ma<strong>in</strong>ly depends on groundwater sources. Mashhad water and wastewater Co.<br />
operates some 350 groundwater wells for dr<strong>in</strong>k<strong>in</strong>g water supply. In some <strong>of</strong> these wells the nitrate<br />
concentrations are higher than 100 mg/l - sometimes even higher than 250 mg/l. Besides<br />
chlor<strong>in</strong>ation, currently there exists no groundwater treatment <strong>in</strong> Mashhad. Therefore, an<br />
<strong>in</strong>ternational research project was <strong>in</strong>itiated, funded by the <strong>Iran</strong>ian M<strong>in</strong>istry <strong>of</strong> Energy & <strong>Water</strong> and<br />
the German M<strong>in</strong>istry <strong>of</strong> Education and Research (BMBF). Project partners were:<br />
Mashhad <strong>Water</strong> & Wastewater Company, <strong>Iran</strong>,<br />
Forschungszentrum Karlsruhe (Karlsruhe Research Centre), Germany,<br />
VA Tech <strong>Wabag</strong>, Germany,<br />
WETECH Institute, Hamburg, Germany<br />
IWW Institute for <strong>Water</strong> Research, Mülheim, Germany.
Between October 2004 and November 2007 three pilot plants, designed and constructed <strong>in</strong><br />
Germany, were <strong>in</strong> parallel operation <strong>in</strong> Mashhad. The flow rates <strong>of</strong> the pilot plants were <strong>in</strong> the<br />
range <strong>of</strong> 1 3 m 3 /h each. A team <strong>of</strong> <strong>Iran</strong>ian, German and Austrian Eng<strong>in</strong>eers operated these plants.<br />
The three processes tested for nitrate removal <strong>in</strong> pilot-scale were:<br />
Biological Denitrification,<br />
Reverse Osmosis and<br />
Ion Exchange.<br />
Additionally, start<strong>in</strong>g <strong>from</strong> June 2007, a 4 th pilot plant has been operated <strong>in</strong> Mashhad. This plant<br />
was equipped with Electrodialysis technology. However, at the time <strong>of</strong> writ<strong>in</strong>g this paper, there<br />
were still very few results <strong>from</strong> the Electrodialysis pilot plant and therefore this paper only focuses<br />
on the 3 technologies which were mentioned before.<br />
The objectives <strong>of</strong> this research project were to ga<strong>in</strong> experiences about the operation <strong>of</strong> the nitrate<br />
removal processes under the specific conditions <strong>of</strong> <strong>Iran</strong> (e.g. dry climate, supply <strong>of</strong> energy,<br />
chemicals and spare parts, education <strong>of</strong> staff). Furthermore it was <strong>in</strong>tended to adapt, to optimize<br />
and to evaluate the processes. The f<strong>in</strong>d<strong>in</strong>gs <strong>of</strong> this research study should be used for decisionmak<strong>in</strong>g<br />
concern<strong>in</strong>g the most suitable treatment option for nitrate removal <strong>in</strong> Mashhad and for the<br />
subsequent plann<strong>in</strong>g <strong>of</strong> a full-scale dr<strong>in</strong>k<strong>in</strong>g water treatment plant. The water quality goal for all<br />
processes was a nitrate concentration <strong>of</strong> 40 mg/l after treatment. Additionally all requirements <strong>of</strong><br />
the dr<strong>in</strong>k<strong>in</strong>g water guidel<strong>in</strong>es by WHO (World Health Organization) should be met.<br />
METHODS<br />
In this chapter, at first the design and the operation <strong>of</strong> the three pilot plants will be described. Then<br />
the challenge water (ground water) will be characterized. F<strong>in</strong>ally, the concept for assessment and<br />
rat<strong>in</strong>g <strong>of</strong> the processes will be illustrated.<br />
Biological Denitrification pilot plant<br />
The basics and general pr<strong>in</strong>ciples <strong>of</strong> Biological Denitrification <strong>in</strong> dr<strong>in</strong>k<strong>in</strong>g water treatment were<br />
already described <strong>in</strong> the literature, e.g. by Kapoor et al. (1997), Overath (2000), Uhl et al. (2004)<br />
and WHO (2004). The biological pilot plant <strong>in</strong> Mashhad had 2 biological reactors which were<br />
operated downstream and <strong>in</strong> parallel at 1.5 bar. The flow rates could be varied <strong>from</strong> 0.5 to 3.0 m 3 /h<br />
for each reactor. Expanded clay (Liapor®) with two different gra<strong>in</strong> sizes (2-5 mm and 3-6 mm,<br />
respectively) was employed as growth material <strong>in</strong> the two reactors. An aqueous solution <strong>of</strong> acetic<br />
acid was dosed as electron donator <strong>in</strong>to the feed <strong>of</strong> the pilot plant. Additionally ferrous sulfate and<br />
(di-sodiumhydrogen-) phosphate were dosed as nutrients. With<strong>in</strong> the bio-reactors the bacteria<br />
reduce nitrate to nitrogen, which means that the nitrate is really elim<strong>in</strong>ated and not only separated.<br />
The bio-reactors were followed by a gas exchange (for nitrogen removal and addition <strong>of</strong> oxygen),<br />
a dual media filtration (filter stage 1) a second gas exchange and an activated carbon filtration<br />
(stage 2). From time to time the bio-reactors and the dual media filter had to be backwashed for<br />
remov<strong>in</strong>g biomass and reduc<strong>in</strong>g the differential pressure. The pilot plant did not have a<br />
dis<strong>in</strong>fection stage because the effluent water was not used for dr<strong>in</strong>k<strong>in</strong>g water purposes. However, a<br />
full-scale Biological Denitrification plant def<strong>in</strong>itely requires a f<strong>in</strong>al dis<strong>in</strong>fection stage. The<br />
biological pilot plant worked fully automated with automatic flush<strong>in</strong>g and flow control. Several<br />
process data (e.g. nitrate concentrations, turbidity, differential pressures and flow rates) were<br />
measured and logged cont<strong>in</strong>uously. Besides onl<strong>in</strong>e-measurement some 10 chemical parameters<br />
(e.g. DOC, pH, nitrite, oxygen) were analyzed daily on-site. Additionally the ma<strong>in</strong> cations and<br />
anions and microbiological parameters were analyzed weekly by the central laboratory <strong>of</strong><br />
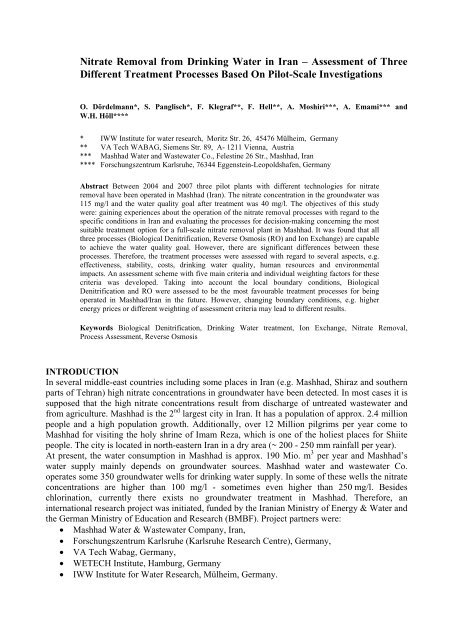
Mashhad <strong>Water</strong> and Wastewater Company. Figure 1 shows the process scheme <strong>of</strong> the Biological<br />
Denitrification pilot plant.
Feed<br />
<strong>Water</strong><br />
-<br />
(NO3 )<br />
Acetic<br />
Acid<br />
Acetic<br />
Acid<br />
Trace<br />
elements<br />
(PO 4 , Fe 2+ )<br />
Trace<br />
elements<br />
(PO 4 , Fe 2+ )<br />
Reactor 1<br />
-<br />
NO3 N 2<br />
Reactor 2<br />
-<br />
NO3 N 2<br />
O 2<br />
N 2<br />
Gas-<br />
Exchange<br />
Wastewater<br />
(suspended<br />
Biomass)<br />
Aerobic Post-Treatment<br />
Figure 1 Process scheme <strong>of</strong> the Biological Denitrification pilot plant<br />
Dual<br />
Media<br />
Filter<br />
O 2<br />
Activated<br />
Carbon<br />
Filter<br />
Effluent<br />
<strong>Water</strong><br />
Reverse Osmosis pilot plant<br />
Reverse Osmosis (RO) is a dr<strong>in</strong>k<strong>in</strong>g water treatment process which is wide-spread e.g. for<br />
seawater desal<strong>in</strong>ation. However, it can be employed for nitrate removal <strong>from</strong> groundwater as well.<br />
The basics and general pr<strong>in</strong>ciples <strong>of</strong> RO <strong>in</strong> dr<strong>in</strong>k<strong>in</strong>g water treatment are comprehensively<br />
described <strong>in</strong> the literature, e.g. by: AWWA (2007). Figure 2 shows the process scheme <strong>of</strong> the RO<br />
pilot plant. Its capacity was 3 m 3 /h (RO permeate).<br />
Raw<br />
<strong>Water</strong><br />
-<br />
(NO3 )<br />
HCl<br />
+<br />
Antiscalant<br />
Pre-<br />
Filtration<br />
RO<br />
Stage 1<br />
RO<br />
Stage 2<br />
Figure 2 Process scheme <strong>of</strong> the RO pilot plant<br />
Mix <strong>of</strong> Raw <strong>Water</strong> & Permeate<br />
Permeate<br />
Concentrate<br />
(Waste water)<br />
CO 2 -<br />
<strong>Removal</strong><br />
Gas<br />
Exchange<br />
<strong>Dr<strong>in</strong>k<strong>in</strong>g</strong><br />
<strong>Water</strong><br />
After raw water <strong>in</strong>take and low pressure feed pump, hydrochloric acid and antiscalant were added<br />
to the feed water. Pre-filtration was conducted <strong>in</strong> 2 steps by a self clean<strong>in</strong>g automatic filter<br />
(50 µm) followed by a cartridge filter (1 µm). Then, a high pressure pump delivered the water for<br />
the two-stage RO system. The membranes modules (type SUL-G10) were supplied <strong>from</strong> Toray<br />
Industries Inc. After RO, the nitrate-free permeates <strong>of</strong> the two RO stages were merged and then<br />
mixed with a certa<strong>in</strong> amount <strong>of</strong> nitrate-rich raw water so that the nitrate concentrate <strong>in</strong> the mixed<br />
water was approx. 40 mg/l. F<strong>in</strong>ally the mixed water was trickled <strong>in</strong> a gas exchange column for<br />
reduc<strong>in</strong>g the carbon dioxide concentration (respectively rais<strong>in</strong>g the pH value) <strong>of</strong> the water. Besides<br />
raw water blend<strong>in</strong>g and gas exchange no further post-treatment stages were found to be necessary,
ecause - apart <strong>from</strong> nitrate - the raw water did not conta<strong>in</strong> considerable concentrations <strong>of</strong> toxic<br />
(trace) compounds. The RO pilot plant worked fully automatic and some 15 process parameters<br />
(<strong>in</strong>clud<strong>in</strong>g nitrate concentration and differential pressure) were measured and logged cont<strong>in</strong>uously.<br />
The chemical parameters to be analyzed at the RO pilot plant were almost similar to the biological<br />
pilot plant.<br />
Ion Exchange pilot plant<br />
Ion Exchange processes for nitrate removal are comprehensively described <strong>in</strong> the literature, e.g.<br />
by: Rohmann et al. (1985), Van der Hoek (1987), Clifford (1993 and 1999) and Höll (2006). In the<br />
Ion Exchange pilot plant the first treatment stage was a cartridge filter which removed turbidity<br />
and iron <strong>from</strong> the raw water. Then the water was pumped trough one <strong>of</strong> the two Ion Exchange<br />
columns (diameter: 0.4 m). These columns were filled with two different types <strong>of</strong> nitrateselective<br />
res<strong>in</strong>s and operated <strong>in</strong> parallel. The res<strong>in</strong>s were:<br />
HP 555, manufactured by Rohm and Haas Company<br />
Ionac SR 7, manufactured by Sybron Chemicals Inc.<br />
The res<strong>in</strong> bed depth was 1.6 m and the res<strong>in</strong> bed volume (BV) was approx. 200 liter <strong>in</strong> each<br />
column. The flow rates were varied between 1.0 and 3.0 m 3 /h for each column, which is<br />
equivalent to a specific flow rate <strong>of</strong> 5 - 15 BV/h (Bed volumes per hour). In most <strong>of</strong> the<br />
experiments the flow direction dur<strong>in</strong>g operation (service cycle) was upstream while regeneration<br />
was conducted <strong>in</strong> downstream, which means regeneration was counter-current.<br />
The Ion Exchange pilot plant was equipped with a cont<strong>in</strong>uous measurement and registration <strong>of</strong> the<br />
nitrate effluent concentration <strong>of</strong> each column. Furthermore, flow rate, effluent pH and effluent<br />
conductivity <strong>of</strong> the spent br<strong>in</strong>e solution were measured and recorded cont<strong>in</strong>uously. The pilot plant<br />
worked semi-automatic which means that the service cycle was stopped automatically when a<br />
certa<strong>in</strong> nitrate effluent concentration was exceeded but the valve positions (e.g. for change<br />
between service and regeneration cycle) had to be changed manually.<br />
Groundwater well and raw water composition<br />
This pilot plant study was conducted at the Golshar pump<strong>in</strong>g station <strong>in</strong> an eastern suburb <strong>of</strong><br />
Mashhad. This groundwater well has a depth <strong>of</strong> 145 m and its water composition is more or less<br />
representative for other wells <strong>in</strong> this part <strong>of</strong> the city. Dur<strong>in</strong>g the time <strong>of</strong> this study the average<br />
nitrate concentration <strong>of</strong> the Golshar well water was about 115 mg/l. The electrical conductivity<br />
was about 1550 µS/cm and the pH value was about 7.2. Further parameters which characterize the<br />
raw water composition can be found later on <strong>in</strong> table 2.<br />
Concept for <strong>Assessment</strong> <strong>of</strong> the treatment processes<br />
For assessment <strong>of</strong> the three treatment processes several aspects were considered. Besides technical<br />
and f<strong>in</strong>ancial considerations there were some other important aspects as well, e.g. the quality <strong>of</strong><br />
dr<strong>in</strong>k<strong>in</strong>g water after treatment. Therefore, dur<strong>in</strong>g this study an assessment matrix was created<br />
which <strong>in</strong>cludes 5 ma<strong>in</strong> criteria. Every ma<strong>in</strong> criterion has some sub-criteria and each <strong>of</strong> them was<br />
rated on a scale <strong>from</strong> +2<br />
to -2<br />
<strong>in</strong> which the mark +2<br />
is used for very favourable and<br />
beneficial factors, 0 for neutral factors and -2 for very unfavourable factors. By application <strong>of</strong><br />
this procedure the five ma<strong>in</strong> criteria could be assessed <strong>in</strong> a transparent way. F<strong>in</strong>ally, the results <strong>of</strong><br />
the five ma<strong>in</strong> criteria were weighted as described <strong>in</strong> Table 1.<br />
The most criteria were assessed on the basis <strong>of</strong> the results <strong>from</strong> the pilot plant <strong>in</strong>vestigations <strong>in</strong><br />
Mashhad. For estimation <strong>of</strong> <strong>in</strong>vestment costs <strong>of</strong> full-scale treatment plants it was assumed that the<br />
basic design would be (almost) similar to the pilot plants, besides the fact that each full-scale<br />
treatment option <strong>in</strong>cluded a f<strong>in</strong>al stage for dis<strong>in</strong>fection.
Table 1 Ma<strong>in</strong> Criteria for assessment <strong>of</strong> the treatment processes for nitrate removal<br />
<strong>Assessment</strong> criteria Weight<strong>in</strong>g factor<br />
Effectiveness and stability <strong>of</strong> the process 25 %<br />
Operation and <strong>in</strong>vestment costs 25 %<br />
<strong>Dr<strong>in</strong>k<strong>in</strong>g</strong> water quality after treatment 20 %<br />
Required technical and human resources 10 %<br />
Impacts on the environment dur<strong>in</strong>g operation 20 %<br />
Total 100 %<br />
RESULTS AND DISCUSSION<br />
This paper ma<strong>in</strong>ly focuses on the assessment <strong>of</strong> the three treatment processes (RO, Ion Exchange<br />
and Biological Denitrification) and on the assessment procedure itself. Further detailed results<br />
<strong>from</strong> the pilot plant experiments on nitrate removal <strong>in</strong> Mashhad were already published by<br />
Panglisch (2005) and Dördelmann (2006).<br />
Effectiveness and stability <strong>of</strong> the treatment processes<br />
All three treatment processes were found to be very effective for nitrate removal. However,<br />
Biological Denitrification is the only process which really elim<strong>in</strong>ates the nitrate ions whereas the<br />
other two processes only separate the nitrate <strong>from</strong> the water and displace it <strong>in</strong>to a wastewater<br />
stream (concentrate) which then has a very high nitrate concentration. Therefore, the nitrate<br />
removal <strong>of</strong> the biological process was rated as +2 whereas the other two processes were rated as<br />
+1 . Concern<strong>in</strong>g the process stability the pilot plant experiments have shown that RO and Ion<br />
Exchange can be equally regarded as very stable processes ( +2 ). The stability <strong>of</strong> the biological<br />
process was rated favourable as well ( +1 ), although there is a (little) risk <strong>of</strong> <strong>in</strong>stability due to the<br />
sensitivity <strong>of</strong> the biological system.<br />
The process complexity <strong>of</strong> the Ion Exchange process is relatively low. Therefore it was rated<br />
positively ( +1 ). RO and Biological Denitrification are more complex processes result<strong>in</strong>g <strong>in</strong> a<br />
neutral rat<strong>in</strong>g ( 0 ) for RO and a slightly negative assessment ( -0.5 ) for the biological process.<br />
While RO membranes surely are very effective for removal <strong>of</strong> other contam<strong>in</strong>ants (e.g. trace<br />
compounds or bacteria) it has to be considered that the RO plant had a raw water bypass which is<br />
not treated by the RO membranes. Therefore, regard<strong>in</strong>g the removal <strong>of</strong> other contam<strong>in</strong>ants the RO<br />
treatment process is rated as +1 . In contrast to RO the other two processes are potentially not<br />
effective for removal <strong>of</strong> other contam<strong>in</strong>ants. Eventually some compounds may be reduced by a<br />
process (e.g. organic trace compounds dur<strong>in</strong>g Biological Denitrification), but on the other hand for<br />
none <strong>of</strong> the two other processes a removal efficiency can be assured. The rat<strong>in</strong>gs on effectiveness<br />
and stability <strong>of</strong> the treatment processes are shown <strong>in</strong> Table 5.<br />
Costs for <strong>in</strong>vestment and operation<br />
One part <strong>of</strong> this study covered the estimation <strong>of</strong> capital (<strong>in</strong>vestment) and operat<strong>in</strong>g costs with<br />
regard to full-scale treatment plants. Therefore several options with different technologies and<br />
capacities (flow rates) were <strong>in</strong>vestigated. Apart <strong>from</strong> the plant size, the basic designs <strong>of</strong> the fullscale<br />
treatment plants were similar to the respective pilot plants. Additionally each full-scale<br />
treatment option <strong>in</strong>cluded a f<strong>in</strong>al stage for dis<strong>in</strong>fection. For calculation <strong>of</strong> the capital costs <strong>of</strong> the<br />
full-scale treatment plants a depreciation time <strong>of</strong> 10 years and an <strong>in</strong>terest rate <strong>of</strong> 10 %/a were<br />
assumed. These are typical values for depreciation <strong>of</strong> <strong>in</strong>vestments goods <strong>in</strong> <strong>Iran</strong> at present. The<br />
estimated <strong>in</strong>vestment costs <strong>in</strong>clude the costs for process technology, electrical eng<strong>in</strong>eer<strong>in</strong>g and<br />
civil eng<strong>in</strong>eer<strong>in</strong>g. The specific operat<strong>in</strong>g costs are based on the results <strong>from</strong> the pilot plant
<strong>in</strong>vestigations and <strong>in</strong>clude the local costs (<strong>in</strong> <strong>Iran</strong>) for chemicals, energy, ma<strong>in</strong>tenance, spare parts,<br />
wastewater (concentrate) discharge and labor. Figure 3 shows the estimated capital and operat<strong>in</strong>g<br />
costs <strong>of</strong> the three treatment processes for nitrate reduction <strong>from</strong> 115 mg/l (feed) to 40 mg/l<br />
(effluent) at a flow rate <strong>of</strong> 1000 m 3 /h.<br />
Specific capital and operat<strong>in</strong>g costs<br />
<strong>in</strong> EUR per m 3<br />
dr<strong>in</strong>k<strong>in</strong>g water<br />
0,25<br />
0,20<br />
0,15<br />
0,10<br />
0,05<br />
0,00<br />
0,08<br />
Capacity <strong>of</strong> the water works:<br />
1000 m 3 /h dr<strong>in</strong>k<strong>in</strong>g water<br />
0,06<br />
0,11<br />
0,08 0,07 0,08<br />
Bio RO IE<br />
Treatment process<br />
Operat<strong>in</strong>g costs<br />
Capital costs<br />
Figure 3 Estimated capital and operat<strong>in</strong>g costs <strong>of</strong> the three treatment processes for nitrate reduction <strong>in</strong> <strong>Iran</strong><br />
It can be seen that the capital costs <strong>of</strong> RO, Ion Exchange and Biological Denitrification process<br />
were estimated to be almost similar (ca. 8 ct/m 3 ). The operat<strong>in</strong>g costs <strong>of</strong> the three treatment<br />
processes were estimated to be <strong>in</strong> the range <strong>of</strong> 6 11 ct/m 3 . Ma<strong>in</strong>ly due to its high costs for<br />
chemicals, the Ion Exchange process had the highest operat<strong>in</strong>g costs (11 ct/m 3 ). In this calculation<br />
the RO process was found to have the lowest operat<strong>in</strong>g costs (6 ct/m 3 ) although RO has the<br />
highest specific energy consumption <strong>of</strong> all three processes (ca. 0.6 kWh/m 3 dr<strong>in</strong>k<strong>in</strong>g water). The<br />
relatively low operat<strong>in</strong>g costs <strong>of</strong> RO result <strong>from</strong> low costs for concentrate discharge and <strong>from</strong> an<br />
extremely low price for electrical energy <strong>in</strong> <strong>Iran</strong> (ca. 0.3 ct / kWh). Therefore, <strong>in</strong> countries which<br />
have higher (unsubsidized) energy prices the operat<strong>in</strong>g costs <strong>of</strong> the RO process would be<br />
significantly higher (ca. 10 ct/m 3 ). However, this study considered the current boundary conditions<br />
<strong>of</strong> <strong>Iran</strong> and the rat<strong>in</strong>gs <strong>of</strong> capital and operat<strong>in</strong>g costs are based on the values which were given <strong>in</strong><br />
Figure 3. The results <strong>of</strong> these rat<strong>in</strong>gs are shown <strong>in</strong> Table 5.<br />
Required technical and human resources<br />
Accord<strong>in</strong>g to its title, this criterion focuses on human resources and technical resources: Other<br />
basic resources such as chemicals and energy were considered <strong>in</strong> the chapters on operation costs<br />
and environmental impacts.<br />
The pilot plant experiments have shown that staff requirements <strong>of</strong> RO and Ion Exchange were<br />
almost similar and both processes require very qualified, experienced and reliable personnel.<br />
Although these 2 processes can be operated and controlled automatically, for a water works with<br />
1000 m 3 /h at least 1 very well educated eng<strong>in</strong>eer plus 3 mechanists or technicians plus 1 lab<br />
technician are necessary. Therefore, RO and Ion Exchange were attributed to be favorable ( +1 )<br />
<strong>in</strong> terms <strong>of</strong> staff requirements. Biological Denitrification was found to be a process which requires<br />
more personnel due to <strong>in</strong>creased efforts for ma<strong>in</strong>tenance. Therefore the staff requirement <strong>of</strong> the<br />
biological process was assigned to grade 0 .<br />
The demand for spare parts, its availability (<strong>in</strong> <strong>Iran</strong>) and the frequency <strong>of</strong> replacement is another<br />
important factor which <strong>in</strong>fluences the operation <strong>of</strong> a water treatment plant. The RO process needs<br />
membrane replacement approximately after 5 years, similar to the Ion Exchange process which<br />
has an expected res<strong>in</strong> lifetime <strong>of</strong> approximately 5 years as well. Both processes were assessed to<br />
be neutral (grade 0 ) <strong>in</strong> terms <strong>of</strong> this criterion because RO membranes and Ion Exchange res<strong>in</strong>s
can be purchased <strong>in</strong> <strong>Iran</strong>. The biological process was attributed more favourable ( +1 ) because<br />
the <strong>in</strong>tervals for chang<strong>in</strong>g the filter materials will probably be much longer.<br />
<strong>Dr<strong>in</strong>k<strong>in</strong>g</strong> water quality after treatment<br />
For the assessment <strong>of</strong> this criterion the follow<strong>in</strong>g sub-criteria were taken <strong>in</strong>to account:<br />
Chloride concentration (Risk <strong>of</strong> Corrosion)<br />
TDS concentration<br />
Potential microbiological safety<br />
The nitrate concentration was the most important parameter <strong>of</strong> this study. However, it was not<br />
considered for the rat<strong>in</strong>g <strong>of</strong> the processes <strong>in</strong> terms <strong>of</strong> water quality because all three treatment<br />
processes were able to meet the water quality goal <strong>of</strong> 40 mg/l. RO and Ion Exchange were capable<br />
to remove even more nitrate result<strong>in</strong>g <strong>in</strong> very low nitrate concentrations such as 10 mg/l <strong>in</strong> the RO<br />
permeate. Therefore, RO permeate and Ion Exchange effluents were mixed with a certa<strong>in</strong> amount<br />
<strong>of</strong> raw water (ca. 25 %) so that the nitrate concentrations <strong>in</strong> the f<strong>in</strong>al waters <strong>of</strong> all three treatment<br />
processes were consistent (ca. 40 mg/l nitrate). Table 2 characterizes the ma<strong>in</strong> composition <strong>of</strong> the<br />
f<strong>in</strong>al waters after treatment and the raw water.<br />
Table 2 Composition <strong>of</strong> raw water and f<strong>in</strong>al waters (after treatment and blend<strong>in</strong>g)<br />
Feed Biological plant Ion Exchange RO<br />
(raw water) effluent effluent 1<br />
effluent 2<br />
Conductivity (20 °C) µS/cm 1400 1378 1451 480<br />
TDS mg/l 975 960 927 307<br />
pH - 7,3 7,3 7,3 7,4<br />
TOC mg/l 0,9 0,5 0,7 0,7<br />
Ca mg/l 126 125 125 38<br />
Mg mg/l 41 40 41 12<br />
Na mg/l 99 99 99 34<br />
K mg/l 1,2 1,1 1 0<br />
Cl mg/l 168 176 261 53<br />
NO 3 mg/l 105 46 39 35<br />
SO 4 mg/l 140 140 67 41<br />
HCO 3 mmol/l 4,8 5,5 4,8 1,6<br />
1 Average effluent sample (calculated <strong>from</strong> several s<strong>in</strong>gle effluent analyses) - after blend<strong>in</strong>g with raw water (feed)<br />
2 After blend<strong>in</strong>g <strong>of</strong> RO permeate with raw water (feed)<br />
It can be seen that the effluent waters <strong>of</strong> the three pilot plants had nitrate concentrations <strong>in</strong> the<br />
range <strong>of</strong> 40 mg/l whereas the nitrate concentration <strong>in</strong> the feed (raw water) was 105 mg/l. Dur<strong>in</strong>g<br />
the Biological Denitrification process - besides nitrate - no other <strong>in</strong>organic parameters were<br />
reduced significantly but bicarbonate was <strong>in</strong>creased. In opposite to that, the RO process reduced<br />
all <strong>in</strong>organic parameters by ca. 70 %, compared to the feed water. Regard<strong>in</strong>g the Ion Exchange<br />
process it can be seen that sulfate was reduced (besides nitrate) and that the chloride concentration<br />
was <strong>in</strong>creased significantly.<br />
The current WHO dr<strong>in</strong>k<strong>in</strong>g water guidel<strong>in</strong>e does not recommend a health-based guidel<strong>in</strong>e value<br />
for chloride (WHO, 2006). However, concentrations <strong>of</strong> 250 mg/l and more may affect the taste <strong>of</strong><br />
water adversely. Furthermore, the chloride concentration may strongly <strong>in</strong>fluence the corrosion<br />
properties <strong>of</strong> dr<strong>in</strong>k<strong>in</strong>g water dur<strong>in</strong>g its distribution. A high chloride concentration (such as 261<br />
mg/l <strong>in</strong> the effluent <strong>of</strong> the Ion Exchange pilot plant) usually <strong>in</strong>creases the corrosion risk <strong>of</strong> certa<strong>in</strong><br />
metallic materials <strong>in</strong> the distribution net and <strong>in</strong> hous<strong>in</strong>g <strong>in</strong>stallations. Therefore, the chloride
concentration <strong>of</strong> the Ion Exchange process was attributed to grade -2 . The biological process<br />
was assessed to be neutral ( 0 ) as the chloride concentration <strong>in</strong> the effluent was similar to the raw<br />
water. In contrast to the two before mentioned processes, the chloride concentration after RO<br />
treatment was found to be more favourable ( +1 ) because the chloride concentration <strong>in</strong> the f<strong>in</strong>al<br />
water (after blend<strong>in</strong>g with raw water) was still relatively low 53 mg/l.<br />
The concentration <strong>of</strong> TDS (total dissolved solids) strongly <strong>in</strong>fluences the taste <strong>of</strong> water, which is<br />
one <strong>of</strong> the most important aspects with regard to the acceptance <strong>of</strong> water by the consumers. <strong>Water</strong><br />
with a high TDS concentration (e.g. > 1000 mg/l) is likely to have a salty and unappetiz<strong>in</strong>g taste.<br />
Therefore, Ion Exchange and Biological Denitrification were rated as neutral ( 0 ) because these<br />
two processes do not affect the TDS significantly. In opposite, the RO process reduces TDS<br />
significantly, result<strong>in</strong>g <strong>in</strong> a favourable rat<strong>in</strong>g ( +1 ).<br />
F<strong>in</strong>ally, the potential microbiological safety - before dis<strong>in</strong>fection - was assessed. Dur<strong>in</strong>g this study<br />
dozens <strong>of</strong> microbiological <strong>in</strong>vestigations were performed, particularly focus<strong>in</strong>g on the effluent<br />
quality <strong>of</strong> the biological pilot plant. Although the Biological Denitrification pilot plant did not<br />
have a dis<strong>in</strong>fection stage, it was found that the bacterial counts <strong>in</strong> the plant s effluent usually were<br />
not higher than <strong>in</strong> the feed water - ma<strong>in</strong>ly due to very effective post-treatment after the biological<br />
stage (Dördelmann, 2006). However, the Biological Denitrification stage (<strong>of</strong> a full-scale plant)<br />
potentially may be a risk with regard to undesirable microorganisms <strong>in</strong> the plant s effluent (before<br />
dis<strong>in</strong>fection) and therefore the microbiological safety <strong>of</strong> the biological treatment process was<br />
supposed to be slightly unfavourable ( -0,5 ). Likewise, the potential microbiological safety <strong>of</strong> the<br />
Ion Exchange process was regarded as slightly unfavourable as well ( -0.5 ), because under<br />
certa<strong>in</strong> conditions Ion Exchangers may contribute to a microbiological contam<strong>in</strong>ation <strong>of</strong> water by<br />
promot<strong>in</strong>g growth <strong>of</strong> undesirable microorganisms. For assessment <strong>of</strong> the potential microbiological<br />
safety <strong>of</strong> the RO process two important aspects have to be considered: a) the (advantageous) very<br />
good removal <strong>of</strong> microorganisms by the RO membranes and b) there is a 25 % raw water bypass<br />
which is not treated by the RO membranes. Therefore the potential microbiological safety the RO<br />
process was rated to be neutral ( 0 ).<br />
Impacts on the environment dur<strong>in</strong>g operation<br />
This ma<strong>in</strong> criterion has the follow<strong>in</strong>g sub-criteria<br />
Energy consumption<br />
Chemicals consumption<br />
TDS load <strong>of</strong> concentrate and spent br<strong>in</strong>e<br />
Possibility for re-use <strong>of</strong> wastewater<br />
Increased raw water demand<br />
Consumption <strong>of</strong> chemicals <strong>in</strong> water treatment plants generally is connected to complicated issues<br />
such as supply, handl<strong>in</strong>g, storage and operational safety. Furthermore, <strong>of</strong> course, it is a very<br />
important economic factor <strong>in</strong> terms <strong>of</strong> operational costs. Table 3 gives an overview on the energy<br />
and chemicals demand <strong>of</strong> the three treatment processes.<br />
The chemical demands <strong>of</strong> the three treatment processes are very different and it is difficult to<br />
compare them with each other. The RO process only requires about 24 tons <strong>of</strong> antiscalant per year,<br />
which is very favourable compared to the other processes. However, for ensur<strong>in</strong>g a sufficient<br />
quality the antiscalant has to be imported to <strong>Iran</strong>. The chemicals demand <strong>of</strong> the RO process was<br />
evaluated as favourable ( +1 ). For operation <strong>of</strong> the Biological Denitrification process ca. 530<br />
tons acetic acid are required per year. This chemical is available <strong>in</strong> <strong>Iran</strong> at reasonable costs and <strong>in</strong><br />
sufficient quality. Therefore, the chemical demand <strong>of</strong> the Biological Denitrification process was<br />
rated as neutral ( 0 ). In contrast to this, the chemical demand <strong>of</strong> the Ion Exchange process was<br />
assessed to be very unfavourable ( -2 ) as it requires huge amounts <strong>of</strong> chemicals (about 5.500 tons
sodium chloride per year). Furthermore, the quality <strong>of</strong> the supplied salt was found to be<br />
<strong>in</strong>sufficient due to a high fraction <strong>of</strong> <strong>in</strong>soluble components.<br />
Table 3 Energy and chemicals demands (related to 1000 m3/h dr<strong>in</strong>k<strong>in</strong>g water production)<br />
Specific energy demand * kWh / m 3<br />
Energy demand<br />
per year<br />
Ma<strong>in</strong> chemicals for<br />
the treatment process<br />
Specific chemical demand * kg / m 3<br />
Demand <strong>of</strong> Chemicals<br />
per year<br />
* related to dr<strong>in</strong>k<strong>in</strong>g water<br />
RO<br />
Ion<br />
Exchange<br />
Biological<br />
process<br />
0.6 0.1 0.15<br />
Mio. kWh / a 5.3 0.9 1.3<br />
- Antiscalant<br />
Sodium<br />
chloride<br />
Acetic<br />
Acid<br />
0.003 0.645 0.060<br />
To / a 24 5650 526<br />
The energy consumption <strong>of</strong> the Ion Exchange and the biological process are relatively low (ca. 0.1<br />
kWh per m 3 <strong>of</strong> dr<strong>in</strong>k<strong>in</strong>g water) and therefore rated as favourable (grade +1 ). The RO process<br />
requires significantly more energy which results <strong>in</strong> a less favourable rat<strong>in</strong>g ( -1 ).<br />
The salt load (TDS load) <strong>of</strong> concentrate and br<strong>in</strong>e result<strong>in</strong>g <strong>from</strong> the three treatment processes<br />
varies largely (Table 4).<br />
Table 4 Wastewater characteristics (related to 1000 m3/h dr<strong>in</strong>k<strong>in</strong>g water production)<br />
RO<br />
Ion<br />
exchange<br />
Biological<br />
process<br />
Total Raw water demand m 3 /d 28800 25500 26000<br />
<strong>Dr<strong>in</strong>k<strong>in</strong>g</strong> water production m 3 /d 24000 24000 24000<br />
Total waste water amount m 3 /d 4800 1500 2000<br />
Wastewater ratio (related to dr<strong>in</strong>k<strong>in</strong>g water) % 20 % 6 % 8 %<br />
Wastewater <strong>from</strong> pre- or post-treatment m 3 /d 300 300 2000<br />
Re-use possible - yes * yes * yes *<br />
Wastewater that can be re-used (related to dr<strong>in</strong>k<strong>in</strong>g water) % 1 % 1 % 8 %<br />
Concentrate (br<strong>in</strong>e) flow rate m 3 /d 4500 1200 0<br />
Concentrate (br<strong>in</strong>e) salt-concentration (TDS) g/m 3 4700 21500 -<br />
Salt load (TDS) due to discharge <strong>of</strong> concentrate (br<strong>in</strong>e) kg/d 21150 25800 -<br />
Wastewater that can not be re-used - suitable disposal is<br />
required<br />
% 19 % 5 % 0 %<br />
* after removal <strong>of</strong> suspended solids (e.g. sedimentation) the water can be used for irrigation<br />
With regard to TDS load <strong>of</strong> the concentrate, the most favourable process is Biological<br />
Denitrification because it creates no concentrate at all. Therefore it is assigned to grade +2 . The<br />
TDS load <strong>of</strong> the RO concentrate is about 21000 tons per year. Although this is a high amount, it<br />
has to be emphasized that this TDS load orig<strong>in</strong>ates ma<strong>in</strong>ly <strong>from</strong> the raw water, due to desal<strong>in</strong>ation
<strong>of</strong> the dr<strong>in</strong>k<strong>in</strong>g water. This means the salt load <strong>of</strong> the entire system (dr<strong>in</strong>k<strong>in</strong>g water + concentrate)<br />
is not <strong>in</strong>creased significantly by the RO process. However, the TDS load <strong>of</strong> RO concentrate is<br />
rated as unfavourable -1 . In contrast to RO the br<strong>in</strong>e solution <strong>of</strong> the Ion Exchange process has a<br />
TDS load which is even higher. Furthermore, the TDS balance <strong>of</strong> the Ion Exchange process is<br />
extremely unfavourable because - <strong>in</strong> contrast to RO - dur<strong>in</strong>g Ion Exchange there is no reduction <strong>of</strong><br />
TDS <strong>in</strong> the dr<strong>in</strong>k<strong>in</strong>g water (compared to the raw water). This means, the entire salt load <strong>of</strong> the<br />
br<strong>in</strong>e solution results <strong>from</strong> the treatment process itself and the salt <strong>in</strong>put <strong>in</strong>to the environment is<br />
<strong>in</strong>creased significantly. Therefore, the Ion Exchange process was assigned to grade -2 .<br />
Dur<strong>in</strong>g RO and Ion Exchange the amount <strong>of</strong> wastewater that can be re-used (e.g. for irrigation) is<br />
almost similar: only about 1 % (related to the dr<strong>in</strong>k<strong>in</strong>g water production). Therefore, these two<br />
processes are assigned to grade -1 . Dur<strong>in</strong>g application <strong>of</strong> the Biological Denitrification process<br />
almost the entire amount <strong>of</strong> wastewater (ca. 8 %) can be re-used. Therefore, <strong>in</strong> terms <strong>of</strong><br />
wastewater re-usability the Biological Denitrification process is rated with mark +2 .<br />
Accord<strong>in</strong>g to Table 4 the RO treatment process has the highest raw water demand, due to its high<br />
wastewater ratio (20 %). Therefore it is rated as grade -2 . The other two processes have an<br />
<strong>in</strong>creased raw water demand <strong>in</strong> the range <strong>of</strong> 7 % and are therefore attributed to mark 0 .<br />
CONCLUSIONS<br />
The three treatment processes for nitrate removal were assessed with regard to different criteria on<br />
a scale <strong>from</strong> +2 (very favourable) to -2 (very unfavourable). The results <strong>of</strong> this assessment are<br />
shown <strong>in</strong> Table 5.<br />
With regard to effectiveness and process stability the three treatment processes (RO, Ion Exchange<br />
and Biological Denitrification) were assessed as favourable.<br />
The specific costs for <strong>in</strong>vestment and operation <strong>of</strong> a full-scale treatment plant (1000 m 3 /h) were<br />
estimated to 0.13 EUR per m 3 (for RO), 0.16 EUR / m 3 (for Biological Denitrification) and 0.19<br />
EUR / m 3 (for Ion Exchange). Thus, the specific costs <strong>of</strong> an Ion Exchange treatment plant -<br />
particularly the specific operation costs- were rated as unfavourable whereas the other 2 processes<br />
were found to be neutral or slightly favourable <strong>in</strong> terms <strong>of</strong> <strong>in</strong>vestment and operation costs.<br />
Concern<strong>in</strong>g quality <strong>of</strong> the f<strong>in</strong>al water after treatment, RO was found to be the most favourable<br />
processes. The dr<strong>in</strong>k<strong>in</strong>g water quality after application <strong>of</strong> Biological Denitrification was regarded<br />
as neutral. The water quality after Ion Exchange treatment was found to be unfavourable, ma<strong>in</strong>ly<br />
due to its <strong>in</strong>creased chloride concentration which might raise the corrosion risk with<strong>in</strong> the<br />
distribution net.<br />
With regard to the required technical and human resources RO and Ion Exchange were assessed as<br />
favourable whereas Biological Denitrification was rated as neutral.<br />
F<strong>in</strong>ally, operation <strong>of</strong> RO and Ion Exchange treatment processes were assessed to have<br />
unfavourable impacts on the environment, ma<strong>in</strong>ly due to energy consumption, chemicals<br />
consumption and discharge <strong>of</strong> concentrated salt solutions. Only the Biological Denitrification<br />
process was regarded as favourable <strong>in</strong> terms <strong>of</strong> environmental impacts. Two important factors for<br />
the better result <strong>of</strong> the biological process were: a) <strong>in</strong> contrast to the other two processes, dur<strong>in</strong>g<br />
Biological Denitrification there is no production <strong>of</strong> any concentrate (with high sal<strong>in</strong>ity) and b)<br />
almost the entire wastewater possibly can be re-used.
Table 5 Summarized results <strong>from</strong> the assessment <strong>of</strong> the three treatment processes<br />
Effectiveness and<br />
process stability<br />
Costs<br />
F<strong>in</strong>al water quality<br />
(after blend<strong>in</strong>g)<br />
Technical &<br />
human<br />
resources<br />
Environmental impacts<br />
<strong>Assessment</strong> <strong>of</strong> the five ma<strong>in</strong><br />
criteria<br />
<strong>Assessment</strong> criteria<br />
Weight<strong>in</strong>g<br />
factor<br />
RO IE<br />
Biological<br />
process<br />
Process stability 30 % 2 2 1<br />
<strong>Nitrate</strong> removal 30 % 1 1 2<br />
Process complexity (Risk <strong>of</strong><br />
technical difficulties)<br />
Effectiveness for removal <strong>of</strong> other<br />
contam<strong>in</strong>ants<br />
Total Rat<strong>in</strong>g <strong>of</strong> effectivness and<br />
process stability<br />
Investment costs for process,<br />
electrical and civil eng<strong>in</strong>eer<strong>in</strong>g<br />
30 % 0 1 -0,5<br />
10 % 1 0 0<br />
100 % 1,0 1,2 0,8<br />
50 % 0 0 0<br />
Operat<strong>in</strong>g Costs 50 % 0,5 -1,0 0<br />
Total Rat<strong>in</strong>g <strong>of</strong> <strong>in</strong>vestment and<br />
operat<strong>in</strong>g costs<br />
Chloride concentration (Risk <strong>of</strong><br />
Corrosion <strong>in</strong> the distribution net)<br />
100 % 0,3 -0,5 0,0<br />
40 % 1 -2 0<br />
TDS concentration 40 % 1 0 0<br />
Potential microbiological safety<br />
(before f<strong>in</strong>al dis<strong>in</strong>fection)<br />
20 % 0 -0,5 -0,5<br />
Total Rat<strong>in</strong>g <strong>of</strong> f<strong>in</strong>al water quality 100 % 0,8 -0,9 -0,1<br />
Staff requirements (mann<strong>in</strong>g level<br />
and qualification)<br />
Spare part demand / frequency for<br />
replacement<br />
Total Rat<strong>in</strong>g <strong>of</strong> technical and<br />
human resources requirements<br />
70 % 1 1 0<br />
30 % 0 0 1<br />
100 % 0,7 0,7 0,2<br />
Energy consumption 20 % -1 1 1<br />
Chemicals consumption 20 % 1 -2 0<br />
TDS load <strong>of</strong> concentrate and spent<br />
br<strong>in</strong>e<br />
20 % -1 -2 2<br />
Possibility for re-use <strong>of</strong> wastewater 20 % -1 -1 2<br />
Increased raw water demand 20 % -2 0 0<br />
Total Rat<strong>in</strong>g <strong>of</strong> environmental<br />
impacts<br />
Effectiveness and stability <strong>of</strong> the<br />
process<br />
100 % -0,8 -0,8 1,0<br />
25 % 1,0 1,2 0,8<br />
Operation and <strong>in</strong>vestment costs 25 % 0,3 -0,5 0,0<br />
<strong>Dr<strong>in</strong>k<strong>in</strong>g</strong> water quality after<br />
treatment<br />
Required technical and human<br />
resources<br />
Impacts on the environment dur<strong>in</strong>g<br />
operation<br />
20 % 0,8 -0,9 -0,1<br />
10 % 0,7 0,7 0,2<br />
20 % -0,8 -0,8 1,0<br />
Overall assessment 100 % 0,4 -0,1 0,4
Tak<strong>in</strong>g <strong>in</strong>to account the boundary conditions <strong>of</strong> this study (e.g. water quality goals, extreme low<br />
costs for energy and low costs for concentrate discharge <strong>in</strong> <strong>Iran</strong>) and <strong>in</strong> consideration <strong>of</strong> the<br />
scheme for assessment <strong>of</strong> the treatment processes (Table 1), Biological Denitrification and RO<br />
were found to be the most favourable treatment processes for be<strong>in</strong>g operated <strong>in</strong> Mashhad/<strong>Iran</strong> <strong>in</strong><br />
the future. However, it has to be emphasized that chang<strong>in</strong>g boundary conditions, e.g. higher<br />
energy prices or different assessment criteria and weight<strong>in</strong>g factors may lead to different results.<br />
ACKNOWLEDGEMENTS<br />
The authors would like to thank the German M<strong>in</strong>istry <strong>of</strong> Education and Research (BMBF) and the<br />
<strong>Iran</strong>ian M<strong>in</strong>istry <strong>of</strong> Energy and <strong>Water</strong> for support<strong>in</strong>g this research project. Special thanks go to<br />
Mr. Naseri and Mr. Ansari who operated the pilot plants carefully through the entire project.<br />
References<br />
AWWA American <strong>Water</strong> Works Association (2007). Reverse Osmosis and Nan<strong>of</strong>iltration (M46), second edition. AWWA Manual<br />
<strong>of</strong> water supply practices. ISBN 1583214917<br />
Clifford D. and Liu X. (1993). Ion exchange for nitrate removal. J. Am. <strong>Water</strong> Works Assoc. (4), 135-143<br />
Clifford D. (1999) Ion Exchange and Inorganic Adsorption (Chapter 9) <strong>in</strong>: <strong>Water</strong> Quality and Treatment - A Handbook <strong>of</strong><br />
Community <strong>Water</strong> Supplies (5 th edition). American <strong>Water</strong> Works Association AWWA. ISBN 0070016593<br />
Dördelmann, O., Buchta, P., Panglisch, S., Klegraf, F., Moshiri, A. and Emami, A. (2006) Heterotrophic denitrification <strong>in</strong> dr<strong>in</strong>k<strong>in</strong>g<br />
water treatment - results <strong>from</strong> pilot plant experiments <strong>in</strong> Mashhad/<strong>Iran</strong>. In: Recent Progress <strong>in</strong> Slow Sand and Alternative<br />
Bi<strong>of</strong>iltration Processes. ISBN. 9781843391203. 433-442. IWA Publish<strong>in</strong>g, London<br />
Höll W. H.: (2006) Methoden zur <strong>Nitrate</strong>ntfernung Stand der Technik, bbr 1 8 17<br />
Kapoor, A. and Viraraghavan, T. (1997) <strong>Nitrate</strong> <strong>Removal</strong> <strong>from</strong> <strong>Dr<strong>in</strong>k<strong>in</strong>g</strong> <strong>Water</strong> Review. J. Environ. Eng. 123 (1997), 371 380.<br />
Overath, H. (2000). Stand der Technologie zur <strong>Nitrate</strong>ntfernung im Tr<strong>in</strong>kwasserbereich. Technology <strong>of</strong> <strong>Nitrate</strong> <strong>Removal</strong> <strong>from</strong><br />
<strong>Dr<strong>in</strong>k<strong>in</strong>g</strong> <strong>Water</strong>: Actual State and Recent Developments. Vom Wasser, 94, 267-298<br />
Panglisch, S., Dördelmann, O., Buchta, P., Klegraf, F., Moshiri, A., Emami, A. Fakhraei, M. and Höll, W.H. (2005) <strong>Nitrate</strong><br />
Elim<strong>in</strong>ation <strong>from</strong> Raw waters an <strong>Iran</strong>ian-German Jo<strong>in</strong>t Co-operation Project. In: Proceed<strong>in</strong>gs BMBF & UNESCO-RCUWM<br />
Workshop <strong>in</strong> Berl<strong>in</strong>. Innovations <strong>in</strong> <strong>Water</strong> and Wastewater Technology . www.rcuwm.org.ir/events/workshop/6/articles.html<br />
Rohmann, U., Sontheimer, H. (1985). Nitrat im Grundwasser<br />
Ursachen, Bedeutung, Lösungswege. DVGW-Forschungsstelle.<br />
Universität Karlsruhe. ISBN 3-922671-12-8<br />
Uhl W., Overath H. (2004). Biologische Verfahren der Tr<strong>in</strong>kwasseraufbereitung. In: Wasseraufbereitung - Grundlagen und<br />
Verfahren, DVGW Lehr- und Handbuch Wasserversorgung (ed.), vol 6, 339-402. Oldenbourg Verlag, München.<br />
Van Der Hoek, J.P. and Klapwijk, A. (1987) <strong>Nitrate</strong> removal <strong>from</strong> Ground <strong>Water</strong>. <strong>Water</strong> Research Vol. 21 No. 8. 989-997<br />
WHO (2004) <strong>Water</strong> treatment processes for reduc<strong>in</strong>g nitrate concentrations. Background document.<br />
www.who.<strong>in</strong>t/water_sanitation_health/dwq/chemicals/en/nitrateschap6.pdf<br />
WHO (2006). Guidel<strong>in</strong>es for dr<strong>in</strong>k<strong>in</strong>g-water quality, First addendum to 3rd edition. Vol. 1, Recommendations. ISBN 92 4 154696<br />
4. Geneva, Switzerland