

NATIONAL ADAP MONITORING PROJECT - AIDS United
NATIONAL ADAP MONITORING PROJECT - AIDS United
NATIONAL ADAP MONITORING PROJECT - AIDS United

You also want an ePaper? Increase the reach of your titles
YUMPU automatically turns print PDFs into web optimized ePapers that Google loves.
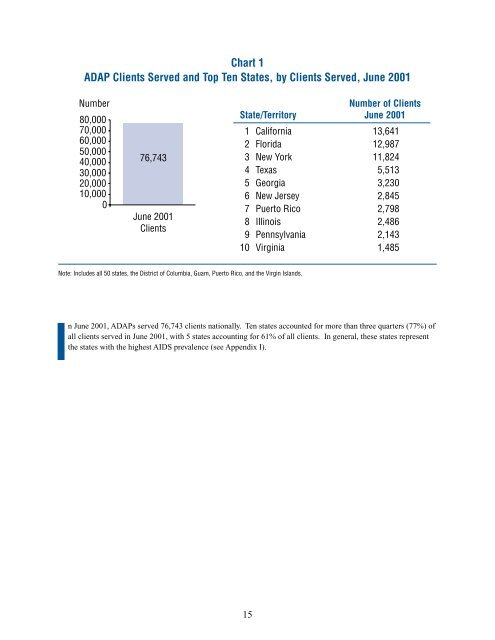
Chart 1<br />
<strong>ADAP</strong> Clients Served and Top Ten States, by Clients Served, June 2001<br />
Number Number of Clients<br />
80,000<br />
State/Territory June 2001<br />
70,000<br />
60,000<br />
50,000<br />
40,000<br />
30,000<br />
76,743<br />
1 California<br />
2 Florida<br />
3 New York<br />
4 Texas<br />
13,641<br />
12,987<br />
11,824<br />
5,513<br />
20,000<br />
5 Georgia 3,230<br />
10,000<br />
0<br />
June 2001<br />
Clients<br />
6 New Jersey<br />
7 Puerto Rico<br />
8 Illinois<br />
9 Pennsylvania<br />
2,845<br />
2,798<br />
2,486<br />
2,143<br />
10 Virginia 1,485<br />
Note: Includes all 50 states, the District of Columbia, Guam, Puerto Rico, and the Virgin Islands.<br />
In June 2001, <strong>ADAP</strong>s served 76,743 clients nationally. Ten states accounted for more than three quarters (77%) of<br />
all clients served in June 2001, with 5 states accounting for 61% of all clients. In general, these states represent<br />
the states with the highest <strong>AIDS</strong> prevalence (see Appendix I).<br />
15