

NATIONAL ADAP MONITORING PROJECT - AIDS United
NATIONAL ADAP MONITORING PROJECT - AIDS United
NATIONAL ADAP MONITORING PROJECT - AIDS United

Create successful ePaper yourself
Turn your PDF publications into a flip-book with our unique Google optimized e-Paper software.
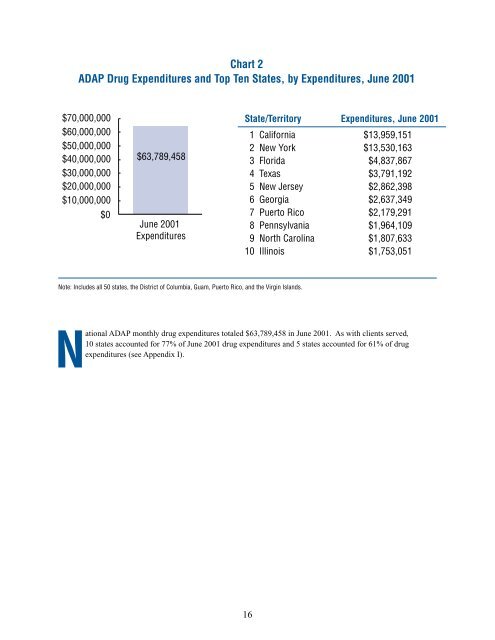
Chart 2<br />
<strong>ADAP</strong> Drug Expenditures and Top Ten States, by Expenditures, June 2001<br />
$70,000,000<br />
$60,000,000<br />
$50,000,000<br />
$40,000,000<br />
$30,000,000<br />
$20,000,000<br />
$10,000,000<br />
$0<br />
$63,789,458<br />
June 2001<br />
Expenditures<br />
Note: Includes all 50 states, the District of Columbia, Guam, Puerto Rico, and the Virgin Islands.<br />
State/Territory Expenditures, June 2001<br />
1 California $13,959,151<br />
2 New York $13,530,163<br />
3 Florida $4,837,867<br />
4 Texas $3,791,192<br />
5 New Jersey $2,862,398<br />
6 Georgia $2,637,349<br />
7 Puerto Rico $2,179,291<br />
8 Pennsylvania $1,964,109<br />
9 North Carolina $1,807,633<br />
10 Illinois $1,753,051<br />
National <strong>ADAP</strong> monthly drug expenditures totaled $63,789,458 in June 2001. As with clients served,<br />
10 states accounted for 77% of June 2001 drug expenditures and 5 states accounted for 61% of drug<br />
expenditures (see Appendix I).<br />
16