MBA 604 Introduction Probaility and Statistics Lecture Notes
MBA 604 Introduction Probaility and Statistics Lecture Notes
MBA 604 Introduction Probaility and Statistics Lecture Notes

You also want an ePaper? Increase the reach of your titles
YUMPU automatically turns print PDFs into web optimized ePapers that Google loves.
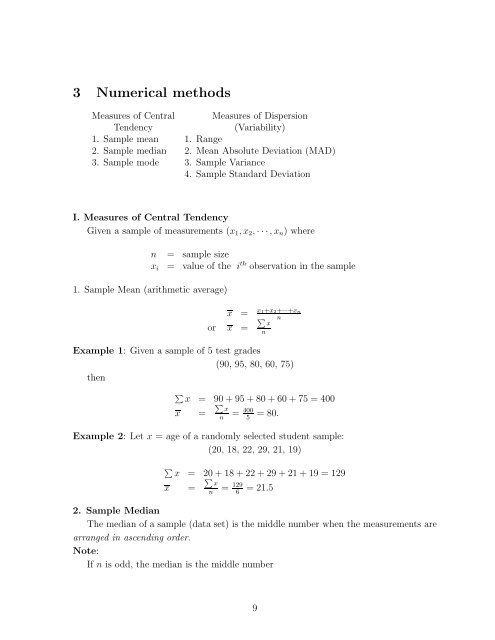
3 Numerical methods<br />
Measures of Central Measures of Dispersion<br />
Tendency (Variability)<br />
1. Sample mean 1. Range<br />
2. Sample median 2. Mean Absolute Deviation (MAD)<br />
3. Sample mode 3. Sample Variance<br />
4. Sample St<strong>and</strong>ard Deviation<br />
I. Measures of Central Tendency<br />
Given a sample of measurements (x1,x2, ···,xn) where<br />
n = sample size<br />
xi = value of the ith observation in the sample<br />
1. Sample Mean (arithmetic average)<br />
x = x1+x2+···+xn<br />
or x =<br />
x<br />
Example 1: Given a sample of 5 test grades<br />
(90, 95, 80, 60, 75)<br />
then<br />
x = 90 + 95 + 80 + 60 + 75 = 400<br />
x =<br />
x<br />
n<br />
n<br />
n<br />
= 400<br />
5 =80.<br />
Example 2: Letx = age of a r<strong>and</strong>omly selected student sample:<br />
(20, 18, 22, 29, 21, 19)<br />
x = 20 + 18 + 22 + 29 + 21 + 19 = 129<br />
x =<br />
x<br />
n<br />
= 129<br />
6 =21.5<br />
2. Sample Median<br />
The median of a sample (data set) is the middle number when the measurements are<br />
arranged in ascending order.<br />
Note:<br />
If n is odd, the median is the middle number<br />
9