- Page 1 and 2: MBA 604 Introduction Probaility and
- Page 3 and 4: Contents 1 Data Analysis 5 1 Introd
- Page 5 and 6: 10 Simple Linear Regression and Cor
- Page 7 and 8: 7. How to interpret polls. How many
- Page 9 and 10: Formulas: Note: w = 28.6−5.4 6 w
- Page 11 and 12: If n is even, the median is the ave
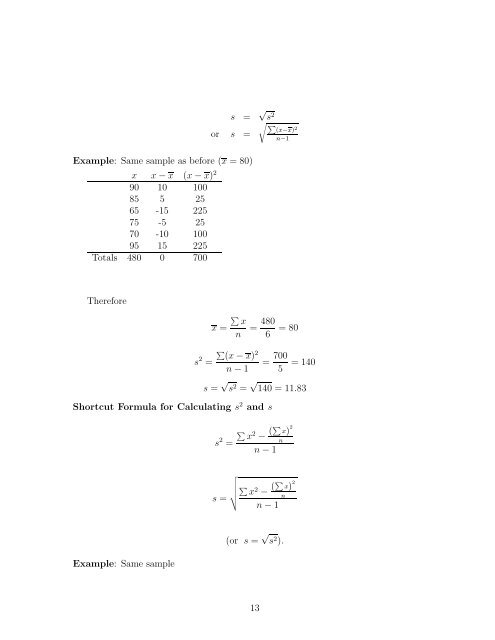
- Page 13: II. Measures of Variability Given:
- Page 17 and 18: (iii) Approximation: s range 4 (iv
- Page 19 and 20: z = x − µ σ Example. A set of g
- Page 21 and 22: (i) Complete all entries in the tab
- Page 23 and 24: Chapter 2 Probability Contents. Sam
- Page 25 and 26: nA = frequency of the event A nA n
- Page 27 and 28: provided P (B) > 0. Similarly, P (B
- Page 29 and 30: Thus only 32 percent of those perso
- Page 31 and 32: (which is equal to Combinations For
- Page 33 and 34: 2. Suppose that S = {1, 2, 3, 4, 5,
- Page 35 and 36: (Hint: Start by defining the events
- Page 37 and 38: The variable X transforms the probl
- Page 39 and 40: 3 Discrete Distributions Binomial.
- Page 41 and 42: of D elements of the first kind and
- Page 43 and 44: One equation is redundant. Choose t
- Page 45 and 46: 4. A random variable X has the foll
- Page 47 and 48: 1. List the properties for a binomi
- Page 49 and 50: Chapter 4 Continuous Distributions
- Page 51 and 52: Z-score: OR (simply) Conversely, X
- Page 53 and 54: Exercise. Specialize the above resu
- Page 55 and 56: 3. Let Z be a standard normal distr
- Page 57 and 58: Chapter 5 Sampling Distributions Co
- Page 59 and 60: σ ˆP = S.E.( ˆ pq P )= n (iii)
- Page 61 and 62: (ii) Find the probability that the
- Page 63 and 64: Single Quantitative Population: µ
- Page 65 and 66:
where σ is estimated by s. Note: I
- Page 67 and 68:
The width of the CI decreases. The
- Page 69 and 70:
Please show all work. No credit for
- Page 71 and 72:
Chapter 7 Large-Sample Tests of Hyp
- Page 73 and 74:
Conclusion: At 100α% significance
- Page 75 and 76:
1. Large sample (np ≥ 5,nq≥ 5)
- Page 77 and 78:
Test: Sample 2: n2, x2, ˆp2 = x2 n
- Page 79 and 80:
orders were recorded, with a sample
- Page 81 and 82:
1. Sampled population is normal 2.
- Page 83 and 84:
Sample data: Sample 1: n1, x1,s1 Sa
- Page 85 and 86:
SUBC> alternative 1. Note: alternat
- Page 87 and 88:
RR: Reject H0 if t>2.776 or t X 2
- Page 89 and 90:
Q1: Do the data present sufficient
- Page 91 and 92:
Training Group 1 2 3 4 65 75 59 94
- Page 93 and 94:
GT: Grand Total. Computational Form
- Page 95 and 96:
Treatments t1 t2 t3 Bi s1 17 34 23
- Page 97 and 98:
Solution to (ii) Test. H0 : µ1 =
- Page 99 and 100:
Chapter 10 Simple Linear Regression
- Page 101 and 102:
3. The r.v. ɛ has a normal distrib
- Page 103 and 104:
Optional material Ad Sales Calculat
- Page 105 and 106:
Estimator mean: µ β1 ˆ = β1 Est
- Page 107 and 108:
(ii) The population coefficient of
- Page 109 and 110:
The regression equation is y=46.5 +
- Page 111 and 112:
Source DF SS MS F P Regression 7626
- Page 113 and 114:
4. The random components of any two
- Page 115 and 116:
MINITAB. Use REGRESS command to reg
- Page 117:
Q1. What is the prediction equation