MBA 604 Introduction Probaility and Statistics Lecture Notes
MBA 604 Introduction Probaility and Statistics Lecture Notes
MBA 604 Introduction Probaility and Statistics Lecture Notes

You also want an ePaper? Increase the reach of your titles
YUMPU automatically turns print PDFs into web optimized ePapers that Google loves.
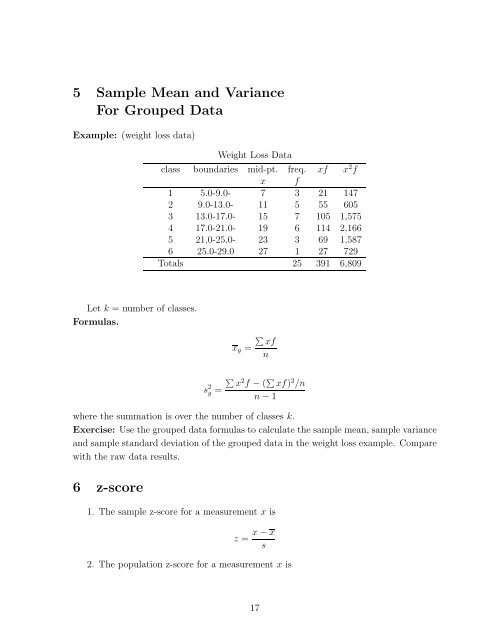
5 Sample Mean <strong>and</strong> Variance<br />
For Grouped Data<br />
Example: (weight loss data)<br />
Let k = number of classes.<br />
Formulas.<br />
Weight Loss Data<br />
class boundaries mid-pt. freq. xf x2f x f<br />
1 5.0-9.0- 7 3 21 147<br />
2 9.0-13.0- 11 5 55 605<br />
3 13.0-17.0- 15 7 105 1,575<br />
4 17.0-21.0- 19 6 114 2,166<br />
5 21.0-25.0- 23 3 69 1,587<br />
6 25.0-29.0 27 1 27 729<br />
Totals 25 391 6,809<br />
<br />
xf<br />
xg =<br />
n<br />
s 2 2 2 x f − ( xf) /n<br />
g =<br />
n − 1<br />
where the summation is over the number of classes k.<br />
Exercise: Use the grouped data formulas to calculate the sample mean, sample variance<br />
<strong>and</strong> sample st<strong>and</strong>ard deviation of the grouped data in the weight loss example. Compare<br />
with the raw data results.<br />
6 z-score<br />
1. The sample z-score for a measurement x is<br />
z =<br />
x − x<br />
s<br />
2. The population z-score for a measurement x is<br />
17