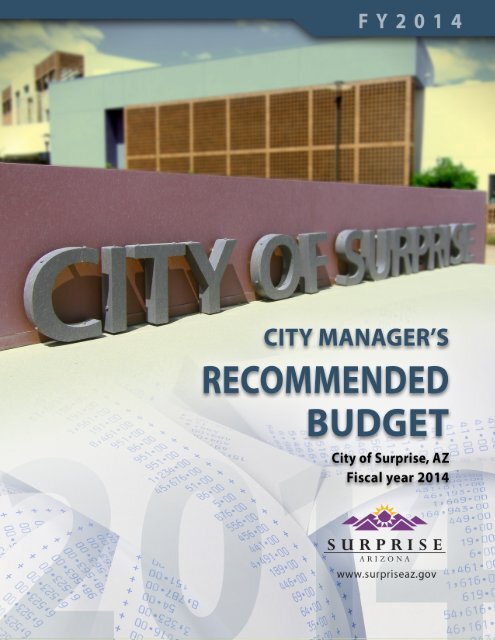
FY2014 Recommended Budget - City of Surprise
FY2014 Recommended Budget - City of Surprise
FY2014 Recommended Budget - City of Surprise

Create successful ePaper yourself
Turn your PDF publications into a flip-book with our unique Google optimized e-Paper software.
<strong>City</strong> <strong>of</strong> <strong>Surprise</strong>, Arizona<br />
<strong>FY2014</strong> <strong>City</strong> Manager’s <strong>Recommended</strong><br />
<strong>Budget</strong><br />
TABLE OF CONTENTS<br />
Description Page<br />
Number<br />
Transmittal Letter<br />
<strong>Budget</strong> Overview<br />
General Information<br />
Mayor and <strong>City</strong> Council Member ............................................................................ 1<br />
Mayor and <strong>City</strong> Council District Map Current ......................................................... 5<br />
Mayor and <strong>City</strong> Council District Map Future .......................................................... 6<br />
Strategic Plan ......................................................................................................... 7<br />
<strong>City</strong> Map ................................................................................................................. 9<br />
Special Planning Area Map .................................................................................... 10<br />
History <strong>of</strong> <strong>Surprise</strong> .................................................................................................. 11<br />
<strong>City</strong>wide Organization Chart .................................................................................. 13<br />
Revenue<br />
Revenue Summary ................................................................................................. 14<br />
Revenue Detail ....................................................................................................... 17<br />
Expense<br />
Expense Summary<br />
All Funds Total Expenses Detail by Category ................................................ 41<br />
All Funds Total Expenses Detail by Department ............................................. 42<br />
All Funds Total Expenses Detail by Object ..................................................... 43<br />
All Funds Detail by Department by Category .................................................. 48<br />
All Funds Detail by Object by Department....................................................... 52<br />
Department <strong>Budget</strong>s<br />
Police ............................................................................................................... 107<br />
Fire …………………………………………………………………. ...................... 117<br />
Community & Economic Development ............................................................ 127<br />
Court ………………………………………………………………...... .................. 134<br />
Human Resources ........................................................................................... 142<br />
<strong>City</strong> Attorney’s Office ....................................................................................... 154<br />
Community & Recreation Services ………….. ................................................ 156<br />
Public Works …………………………………………………………. .................. 166<br />
Information Technology ................................................................................... 191<br />
Finance ............................................................................................................ 194<br />
<strong>City</strong> Manager’s Office ……………………………………………….. .................. 199<br />
<strong>City</strong> Clerk’s Office ............................................................................................ 202<br />
Mayor & <strong>City</strong> Council ....................................................................................... 205
Capital Improvement Plan<br />
Capital Improvement Plan Summary ..................................................................... 207<br />
General Capital Fund ............................................................................................. 214<br />
Transportation Improvement Fund………………………………………….. ............. 215<br />
General Government Development Fee Fund ........………………………………. . 217<br />
Vehicle Replacement Fund…………………………………………………………….. 218<br />
Fire and EMS Development Fee Fund................................................................... 219<br />
Police Development Fee Fund.............................................................. ................ 220<br />
Parks and Recreation Development Fee Fund..................................... ................. 221<br />
Library Development Fee Fund .............................................................................. 222<br />
Roads <strong>of</strong> Regional Significance Development Fee Funds .................................... 223<br />
Public Works Development Fee Fund.................................................................... 224<br />
Debt Service Funds ................................................................................................ 225<br />
Water System and Replenishment Development Fee Fund .................................. 227<br />
Wastewater System Development Fee Funds ....................................................... 228<br />
Appendix<br />
<strong>Budget</strong> Transfer Policies and Procedures ............................................................. 229<br />
Comprehensive Financial Management Policies FY2013…… .............................. 231<br />
Glossary …………………………………………………………….... ......................... 236<br />
State Forms …………………………………………………………….... ................... 248
Transmittal Letter
<strong>Budget</strong> Overview
Introduction to the <strong>City</strong> y Manager’s g<br />
<strong>FY2014</strong> <strong>Recommended</strong> <strong>Budget</strong> g<br />
<strong>City</strong> Council Meeting<br />
April 30 30, 2013
Purpose p <strong>of</strong> Presentation<br />
1. Financial review<br />
2. Introduce <strong>City</strong> Manager’s <strong>Recommended</strong><br />
<strong>Budget</strong> g<br />
Review Outcomes<br />
Overview Operating <strong>Budget</strong> <strong>Budget</strong>, CIP CIP, and Enterprise<br />
Funds<br />
33. Identify <strong>City</strong> Council Discussion Issues<br />
4. Discuss <strong>Budget</strong> Calendar<br />
2
Financial Review<br />
• FY2010 audit found numerous accounting errors (more<br />
than 30 PPAs) related to construction <strong>of</strong> Civic Center<br />
ffacilities. iliti MMore th than $70 million illi hhad d bbeen misallocated i ll t d<br />
between numerous funds<br />
– <strong>City</strong> y hired consultant to review impact p fees transactions back<br />
through 2007<br />
• FY2011 audit found additional accounting errors<br />
(another ( 10 PPAs), ), with the impact p coming g more directly y<br />
on the general fund, transferring approximately $10M<br />
out <strong>of</strong> the general fund and erasing its fund balance<br />
reserve to an estimated $500,000. $ , <strong>City</strong> y received a<br />
“qualified opinion” for its FY2011 audit<br />
– Financial policies state reserves to be two-months worth <strong>of</strong><br />
operating costs<br />
3
Financial Review (Continued)<br />
( )<br />
• <strong>City</strong> once again hired consultants in May 2012<br />
to review all impact fee transactions back to<br />
FY2000 and all development agreements.<br />
This work is commonly referred to as our “post postaudit<br />
work”<br />
– MMore than th 100 100,000 000 iimpact t ffee ttransactions ti and d<br />
more than 100 development agreements and<br />
amendments were reviewed and audited<br />
4
Financial Review (Continued)<br />
( )<br />
• Council immediately set the policy direction that<br />
its priority p y financial ggoal<br />
was to re-establish the<br />
general fund reserve (approximately $11.6<br />
million) within 24 months, or by June 30, 2014<br />
• Th The post t audit dit field fi ld work k iis complete l t and d th the<br />
final report will be provided to Council on June<br />
18, 8, 2013 0 3 aand d accepted by Cou Council c oon Ju June e 25, 5,<br />
2013<br />
• To assist in the finalization <strong>of</strong> the <strong>FY2014</strong> budget,<br />
th the auditors dit hhave provided id d us with ith th the needed d d<br />
information that there will be no<br />
changes/impacts to the general fund as a result<br />
<strong>of</strong> the post-audit work<br />
5
Financial Review (Continued)<br />
( )<br />
• As will be shown in this presentation, the<br />
city currently projects it should meet<br />
Council’s priority policy direction <strong>of</strong> a fully<br />
funded general fund reserve balance<br />
within 12 months--June 30, 2013 instead<br />
<strong>of</strong> June 30 30, 2014<br />
• However, it is important to note, we will<br />
not hhave the h fi final l FY2013 audit di results l<br />
confirming this projection for another 9-10<br />
months in early 2014<br />
6
Approach pp oac to <strong>FY2014</strong> 0 <strong>Budget</strong> udget<br />
• To regain financial security and to achieve<br />
Council policy direction <strong>of</strong> a fully funded<br />
reserve, the city created a 2-year budget plan<br />
– Si Significantly ifi tl cut t expenses ffor FY2013<br />
• Cut 33 positions and cut line item expenses by more than<br />
$4 $4.5 5 million<br />
• Held <strong>of</strong>f on capital projects, no COLA or merit increases<br />
for employees, limited asset replacement<br />
– Allowed for anticipated growth in revenues in<br />
tandem with dramatic cuts to expenses to help<br />
replenish reserve fund balance<br />
7
Approach to <strong>FY2014</strong> <strong>Budget</strong><br />
(Continued)<br />
• An important note: the numbers presented in tonight’s budget for<br />
FY2013 ending balance and <strong>FY2014</strong> revenues are projections<br />
– We will not know final FY2012 ending balance until June 18 18, 2013 2013, and<br />
we will not know our final results for FY2013 until early in calendar year<br />
2014. We recognize revenues for <strong>FY2014</strong> as they come in<br />
• Therefore, as I presented to you this past December, we will have a very good<br />
and more complete understanding <strong>of</strong> our financial stability by early 2014<br />
• Therefore, the <strong>City</strong> Manager’s <strong>Recommended</strong> <strong>Budget</strong> continues in its<br />
2-year plan<br />
– Maintain current programs p g and services<br />
– Manage the impacts <strong>of</strong> increases in development and higher service<br />
demands from residents for existing programs and services<br />
– Manage the inherent and expected increases in costs (utilities,<br />
contractual obligations obligations, etc etc.) )<br />
– Effectively and efficiently use what resources we have for capital projects<br />
and asset replacement<br />
– Provides a solution to help p mitigate g impact p to employees’ p y take-home felt<br />
by increases in health care and retirement<br />
8
Approach to <strong>FY2014</strong> <strong>Budget</strong><br />
(Continued)<br />
Simply stated:<br />
The CM’s budget maintains Council’s policy<br />
direction <strong>of</strong> a two-year plan. It does not spend<br />
money we don’t know we have yet.<br />
9
General Fund Expenditures p<br />
(in millions)<br />
Millioons<br />
$80.0<br />
$78.0<br />
$76.0<br />
$74.0<br />
$72.0<br />
$70.0<br />
$68.0<br />
$66.0<br />
$64.0<br />
$62.0<br />
$73.7<br />
$78.3<br />
$71.6<br />
$ $68.6<br />
$72 $72.8 8<br />
$74.0<br />
FY2008 FY2009 FY2010 FY2011 FY2012 FY2013<br />
Estimate<br />
$78.6<br />
<strong>FY2014</strong><br />
<strong>Recommended</strong><br />
10
<strong>City</strong>wide y FTE<br />
860<br />
840<br />
820<br />
800<br />
780<br />
760<br />
740<br />
720<br />
700<br />
680<br />
839<br />
827<br />
-12<br />
12% Reduction Since 2008 (-103 FTEs)<br />
793<br />
-34<br />
770 769<br />
-23<br />
-1<br />
736<br />
-34 Abolished<br />
1 Added<br />
FY2008 FY2009 FY2010 FY2011 FY2012 FY2013<br />
Adopted<br />
747<br />
11 Added<br />
<strong>FY2014</strong><br />
<strong>Recommended</strong><br />
11
History y <strong>of</strong> Cost Cutting g Measures<br />
Staff reductions<br />
12%, 103 FTE since FY2008<br />
Net 33 reductions in FY2013<br />
Compensation and benefit<br />
reductions d ti<br />
No merit increases since July y 2007<br />
No COLA Increases since July 2008<br />
Increased Employee Healthcare<br />
costs/share in FY 2009, 2010, 2013, 2014<br />
12
<strong>FY2014</strong> <strong>City</strong> Manager Manager’s s<br />
<strong>Recommended</strong> <strong>Budget</strong> g<br />
13
The <strong>City</strong>’s y <strong>Budget</strong> g Is . . .<br />
A Policy Document<br />
A Financial Plan<br />
AAn Operating O ti Guide G id<br />
A Communications Device<br />
14
The <strong>Budget</strong> g Document Contains. . .<br />
1. <strong>City</strong> Manager’s Transmittal Memo<br />
2. Revenues<br />
33. Expenses<br />
1. Operating <strong>Budget</strong><br />
BBy Department, D t t By B Fund F d<br />
Line Item Reports (Separate Binder)<br />
22. Capital Improvement Plan<br />
4. Other information<br />
15
Outcomes<br />
1. Projected to exceed two-month operating<br />
reserve by June 30 30, 2014<br />
2. Maintain current levels <strong>of</strong> services for<br />
existing i i programs and d services i<br />
3. “We’re open for business”<br />
Funding for CIP, economic development, and asset<br />
replacement<br />
16
Outcomes (continued)<br />
( )<br />
4. Do not increase costs to taxpayers<br />
NNo iincrease iin sales l ttax rates t<br />
No increase in property tax revenues<br />
No increase in service fees<br />
No wastewater, or solid waste rate increases;<br />
rate t study t d for f all ll utilities tiliti iin <strong>FY2014</strong> <strong>FY2014</strong>, water t rate t<br />
increase expected<br />
17
<strong>FY2014</strong> <strong>Recommended</strong> <strong>Budget</strong> g<br />
18
<strong>FY2014</strong><br />
General Fund<br />
<strong>Budget</strong><br />
19
Revenues<br />
20
Millionss<br />
General Fund Revenue Summary<br />
$100.0<br />
$95.0<br />
$90.0<br />
$85.0<br />
$80.0<br />
$75 $75.0 0<br />
$70.0<br />
$65.0<br />
$60.0<br />
$55.0<br />
$50.0<br />
$81.1<br />
FY2012<br />
Actual<br />
2%<br />
$83.0<br />
FY2013<br />
Adopted<br />
<strong>Budget</strong><br />
2%<br />
$84.5<br />
FY2013<br />
Estimate<br />
4%<br />
$88 $88.2 2<br />
<strong>FY2014</strong><br />
Forecast<br />
21
General Fund Revenue (in millions)<br />
Category<br />
Estimate<br />
Forecast<br />
FY2012 FY2013 FY2013 to <strong>FY2014</strong> to<br />
Actual Adopted Estimate Adopted Forecast Estimate<br />
% Change<br />
% Change<br />
Sales Tax $ 32.6 $ 32.4 $ 32.7 1% $ 33.4 2%<br />
State Shared<br />
Revenue*<br />
Charges for<br />
Service / Other<br />
23.1 26.1 25.6 -2% 27.2 6%<br />
14.1 13.0 14.6 12% 15.9 9%<br />
Property Tax 6.2 6.3 6.3 0% 6.4 2%<br />
Franchise Fees 5.1 5.2 5.2 0% 5.2 0%<br />
TOTAL $ 81 81.1 1 $ 83 83.0 0 $ 84 84.5 5 2% $ 88 88.2 2 4%<br />
* Excludes HURF and LTAF II revenues<br />
22
<strong>FY2014</strong> Forecast: $88.2M ($3.7M, 4%)<br />
Change from FY2013 Estimate<br />
Franchise Fees<br />
$5.2<br />
Primary y Property p y<br />
6%<br />
Tax<br />
0%<br />
$6.4<br />
7%<br />
2%<br />
Charges for<br />
Services / Other<br />
$15.9<br />
18%<br />
9%<br />
State Shared<br />
$27.2<br />
31%<br />
6%<br />
Local Sales Tax<br />
$33.4<br />
38%<br />
2%<br />
23
Property p y Taxes<br />
How much Property Tax Revenue does the<br />
city want to receive in <strong>FY2014</strong>? Option B<br />
Revenue<br />
Ch Change<br />
from<br />
FY2013<br />
Levy Rate<br />
FY2013 Amount $6.3M $0.74<br />
Options:<br />
A. Maximum Revenue $8.3M $2.0M $1.00<br />
B. Same Revenue (plus new Construction) $6.4M $117,100 $0.7783*<br />
C. Same Revenue as FY2013 $6.3M $0 $0.76<br />
* Truth in Taxation Hearing not required<br />
24
Expenses<br />
25
Program/Service g Summaryy<br />
In Millions<br />
Adopted<br />
FY2013<br />
<strong>City</strong><br />
Manager’s Manager s<br />
<strong>FY2014</strong><br />
Net<br />
$<br />
Change<br />
Net<br />
%<br />
Change<br />
Personnel $ 52.1 $ 54.3 $ 2.3 4%<br />
Services 13 13.8 8 16 16.5 5 27 2.7 19%<br />
Supplies 3.9 4.0 0.1 1%<br />
Capital 0.0 0.1 0.1 240%<br />
Service/Program Expenses $ 69.8 $ 74.9 $ 5.1 7%<br />
26
Personnel Summary Summaryy<br />
In Millions<br />
FTE<br />
Change<br />
$ Change Amount<br />
Adopted FY2013 <strong>Budget</strong> $52.1<br />
FY2013 Changes -9.1 (0.5)<br />
Maintaining Current Service Levels 20 20.3 3 11 1.1<br />
Rate Changes 0.0 1.4<br />
Accounting Changes 8.0 0.2<br />
Net Change 19.2 $ $2.2<br />
<strong>City</strong> Manager’s <strong>FY2014</strong> <strong>Budget</strong> $54.3<br />
27
Personnel Details<br />
In Millions<br />
FY2013 Changes<br />
FTE<br />
Change<br />
$ Change<br />
Outsource Dial-a-Ride -10.1 $(0.6)<br />
El Mirage animal control IGA 1.0 0.1<br />
Maintaining Current Service Levels<br />
CRS Asante park operations (1/4 year) 4.0 0.2<br />
CRS current t llevel l <strong>of</strong> f service i ( (part t ti time) ) 86 8.6 01 0.1<br />
CRS 2 for 1 FTE 1.0 0.0<br />
CED increase in development/permitting activity 4.2 0.3<br />
Finance maintain budget and mailroom service 1.5 0.1<br />
Communications specialist for Council 1.0 0.1<br />
Police overtime $0 $0.3<br />
3<br />
28
Personnel Details (continued)<br />
( )<br />
In Millions<br />
Rate Changes<br />
FTE<br />
Change<br />
$ Change<br />
Cost <strong>of</strong> living adjustment (COLA) 2.2% $1.0<br />
Retirement rates 0.3<br />
Longevity increases 0.1<br />
Meet and Confer changes 0.1<br />
AAccounting ti Ch Changes<br />
Cost allocation - budget FTE in general fund 8.0 0.8<br />
Transfers to special revenue funds (0.5)<br />
Worker's compensation premiums $(0.1)<br />
29
Services Summary y<br />
In Millions $ Change Amount<br />
Adopted p FY2013 <strong>Budget</strong> g $13.8 $<br />
Community and Recreation Services $1.08<br />
Public Works 0.33<br />
Cit <strong>City</strong>wide id 033 0.33<br />
<strong>City</strong> Clerk 0.19<br />
Information Technology 0.18<br />
Police 0.17<br />
Finance 0.15<br />
Fire 013 0.13<br />
Human Resources 0.08<br />
Mayor and Council - Boards and Commissions 0.05<br />
Net Change $2.70<br />
<strong>City</strong> Manager’s <strong>FY2014</strong> <strong>Budget</strong> $16.5<br />
30
Services Details<br />
In Millions $ Change<br />
Community and Recreation Services Changes<br />
Library operations $0.47<br />
Spring training revenue (accounting change) 0.45<br />
CTCA remove tourism subsidy 0.10<br />
Asante park maintenance* 0.05<br />
Recreation center programming 001 0.01<br />
Public Works Changes<br />
Transit increases 0.24<br />
Vehicle maintenance (transferred from vehicle supplies) $0.09<br />
31
Services Details (continued)<br />
( )<br />
In Millions $ Change<br />
<strong>City</strong>wide Changes<br />
<strong>City</strong>wide water and electricity $0.37<br />
Other service changes (0.05)<br />
<strong>City</strong> Clerk<br />
Bi-annual election 0.19<br />
Information Technology Changes<br />
Service agreements 0.19<br />
Telephone services (0.02)<br />
Police Changes<br />
Regional wireless cooperative agreement 0.11<br />
County jail booking fees $0.06<br />
32
Services Details (continued)<br />
( )<br />
In Millions $ Change<br />
Finance Changes<br />
Consultant to develop policies and procedures $0.08<br />
Purchase and implement budget s<strong>of</strong>tware 0.04<br />
RFP vendor selection – city’s 457 plan 0.03<br />
Fire Changes<br />
Regional wireless cooperative agreement 011 0.11<br />
Equipment and hose testing 0.03<br />
Human Resources<br />
Training services (transferred from supplies) 0.09<br />
Mayor and Council<br />
Boards and Commissions $0.05<br />
33
Supplies pp Summaryy<br />
In Millions $ Change Amount<br />
Adopted p FY2013 <strong>Budget</strong> g $3.90 $<br />
Community and Recreation Services $0.16<br />
Mayor and Council 0.10<br />
Fi Fire 002 0.02<br />
<strong>City</strong>wide 0.01<br />
Human Resources (0.08)<br />
Public Works (0.15)<br />
Net Change $0.06<br />
<strong>City</strong> Manager’s Manager s <strong>FY2014</strong> <strong>Budget</strong> $3 $3.96 96<br />
34
Supplies pp Details<br />
In Millions $ Change<br />
Community and Recreation Services<br />
Asante park maintenance* $0.05<br />
Concession items for resale at youth events 0.04<br />
Field preps for campus rentals/tournaments 0.03<br />
Additional supplies for 3 rd party events 0.02<br />
Additional operational supplies 002 0.02<br />
Recreation center programming 0.01<br />
Mayor and Council<br />
Discretionary funds 0.05<br />
Community outreach $0.05<br />
35
Supplies pp Details (continued)<br />
( )<br />
In Millions $ Change<br />
Fire<br />
Utility truck and trailer $0.02<br />
<strong>City</strong>wide<br />
Books and subscriptions 0.01<br />
Human Resources<br />
Training supplies (moved to services) (0 (0.08) 08)<br />
Public Works<br />
Dial a Ride – gas and fuel (0.06)<br />
Auto parts (moved to vehicle maintenance services) $(0.09)<br />
36
Capital p Summaryy<br />
In Millions $ Change Amount<br />
Adopted p FY2013 <strong>Budget</strong> g $0.0 $<br />
Community and Recreation Services<br />
(Asante park operations)<br />
$0.1<br />
<strong>City</strong> Manager’s Manager s <strong>FY2014</strong> <strong>Budget</strong> $0.1<br />
37
Operating p g Reserve<br />
Financial policy definition:<br />
The minimum fund balance in the<br />
general fund is<br />
updated annually by<br />
calculating l l ti an average<br />
<strong>of</strong> the budgeted personnel, supplies,<br />
and services<br />
over a two month period p<br />
for the operating budget. 38
Operating p gReserve<br />
In Millions<br />
FY2013 FY2013 <strong>FY2014</strong> CM<br />
Adopted Estimate <strong>Recommended</strong><br />
General Fund $69.8 $69.8 $74.9<br />
Highway User Revenue Fund 5.1 - -<br />
Total Operating $ $74.9 $ $69.8 $ $74.9<br />
Operating Reserve $12.5 $11.6 $12.5<br />
39
PROJECTION<br />
FY2013<br />
Adopted<br />
FY2013<br />
Estimated<br />
<strong>City</strong> Manager’s<br />
<strong>FY2014</strong><br />
BBeginning i i Fund F d Balance B l $ 00.5 5 $ $ 44.7 7 $ 13 13.7 7<br />
Total Revenues $ 82.9 $ 84.5 $ 88.2<br />
Expenses: p<br />
Service/Program Expenses $ 69.8 $ 71.4 $ 74.9<br />
Transfer to General CIP Fund 1.7 0.0 0.0<br />
2003 MPC Debt Service 15 1.5 15 1.5 15 1.5<br />
Interfund Loan Interest 0.0 0.0 0.0<br />
DA Reimbursements 2.4 2.6 2.6<br />
ED Contingency 1.1 0.0 1.1<br />
Targeted Savings (1.0) 0.0 0.0<br />
Total Expenses $ 75.7 $ 75.5 $ 80.1<br />
Annual Surplus 7.3 8.9 8.1<br />
Interfund Loans $ 2.3 $ 0.0 $ 0.0<br />
Ending Fund Balance $ 5.5 $ 13.7 $ 21.8<br />
Reserve per Policy $ 12.5 $ 11.6 $ 12.5<br />
40
Operating p gReserve: Estimated vs. Target g<br />
Millioons<br />
$25.0<br />
$20.0<br />
$15.0<br />
$10.0<br />
$5.0<br />
$-<br />
$0 $0.5 5<br />
Projected Reserve<br />
Target Reserve<br />
$12.8<br />
FY2012<br />
Estimate<br />
$4.8<br />
$11.9<br />
FY2012<br />
Final<br />
$6 $6.1 1<br />
$12.5<br />
FY2013<br />
Adopted<br />
More Than a<br />
Fully Funded<br />
Reserve<br />
$13.8<br />
$11.5<br />
FY2013<br />
Estimate<br />
$21.9<br />
$12.5<br />
<strong>FY2014</strong> CM<br />
Recomended 41
<strong>City</strong> y Council Discussion Issues<br />
Funding not included in <strong>City</strong> Manager’s<br />
<strong>Recommended</strong> <strong>Budget</strong><br />
Southwest Victim Advocacy y Center contract<br />
Council funding<br />
Boards and commissions<br />
Community outreach<br />
District discretionary funds<br />
Program remaining general fund balance as<br />
contingency ti<br />
42
<strong>City</strong> Council Discussion Issues<br />
(Continued)<br />
(C (Continued) ti d)<br />
Street light improvement district<br />
smoothing<br />
Repayment <strong>of</strong> $3 $3.4M 4M loan from general<br />
capital to general fund<br />
RRestructure t t <strong>of</strong> f debt d bt<br />
Creation <strong>of</strong> 3-5 year y budget g pplan<br />
Other issues identified by Council<br />
43
CIP<br />
<strong>Budget</strong>s<br />
44
General Capital p Fund Outcomes<br />
• Maintain existing g policy y allocating g<br />
construction sales tax in excess <strong>of</strong><br />
$1.25M from the general fund<br />
$1.95M in <strong>FY2014</strong><br />
• Continue asset replacement<br />
$0.78M in <strong>FY2014</strong><br />
• Maintain $1M fund balance reserve<br />
policy p y<br />
45
Adopted<br />
FY2013<br />
Estimated<br />
FY2013<br />
<strong>Recommended</strong><br />
<strong>FY2014</strong><br />
Beginning Fund Balance $ $ 0.4 $ 5.8 $ 7.7<br />
Revenues:<br />
Construction Sales Tax 1.7 2.9 2.0<br />
Grants & 3rd Party Funding 0.8 0.3 -<br />
Interest on Interfund Loans 1.6 - -<br />
Total Revenues<br />
Expenses:<br />
$ 41 4.1 $ 32 3.2 $ 20 2.0<br />
Projects 4.4 0.6 7.0<br />
Asset Replacement 0.8 0.8 0.8<br />
DA Reimbursements 1.1 - -<br />
Total Expenses $ 6.3 $ 1.3 $ 7.8<br />
Annual Surplus $ (2.2) $ 1.9 $ (5.9)<br />
Interfund Loan Repayment $ 2.5 $ - $ -<br />
Ending Fund Balance $ 00.7 7 $ 77.7 7 $ 11.8 8<br />
Reserve per Policy $ 0.5 $ 0.5 $ 1.0<br />
46
Project Name <strong>FY2014</strong><br />
BBell ll RRoad d Sid Sidewalks lk (E (East t <strong>of</strong> f GGrand d A Avenue) ) $1 $1,433,100 433 100<br />
Replace Accounting\GL\FMS S<strong>of</strong>tware 500,000<br />
Disaster Recovery 315,000<br />
Relocating Fire Station #304 300,000<br />
Dove Valley Parkway (163rd to 179th) 285,300<br />
Loop 303 Sewer & Irrigation Line - general 250 250,000 000<br />
107th Avenue & Union Hills Drainage Project 250,000<br />
Irrigation Line Loop 303 & Peoria for Landscaping 250,000<br />
NWC 163rd Ave and Pat Tillman Blvd. Stormwater Mitigation 165,000<br />
SPA 1 Booster Station Upgrades @ Bell Road Lake 125,000<br />
Fiber Optics - Loop 303 (Peoria Avenue to Bell Road) (non (non-growth) growth) 101 101,400 400<br />
Martin Acres Flood Control 100,000<br />
SR303 Peoria Avenue to Mt. View Enhancements 50,000<br />
Community and Recreation Services Master Plan 50,000<br />
Pave Dirt Shoulders 46,300 47<br />
47
Transportation p CIP Fund Outcomes<br />
• Maintain existing g funding g <strong>of</strong> dedicated<br />
1.5% construction sales tax<br />
• Charge direct project administration staff<br />
costs to fund<br />
~$118,000 $ Annually<br />
• Maintain minimum fund balance reserve<br />
policy <strong>of</strong> $0.5M<br />
48
Transportation Improvement<br />
Fund<br />
Adopted<br />
FY2013<br />
Estimated<br />
FY2013<br />
<strong>Recommended</strong><br />
<strong>FY2014</strong><br />
Beginning Fund Balance $ $ 20 2.0 $ $ 29 2.9 $ 36 3.6<br />
Revenues:<br />
Construction Sales Tax 2.0 2.9 2.2<br />
Grants & 3rd Party Funding 1.5 - -<br />
Total Revenues $ 3.4 $ 2.9 $ 2.2<br />
Expenses:<br />
Project Administration 0.1 0.1 0.1<br />
Street Preservation 20 2.0 19 1.9 20 2.0<br />
Projects 2.1 0.0 2.9<br />
DA Reimbursements 0.3 0.3 0.3<br />
Total Expenses $ 4.3 $ 2.2 $ 5.2<br />
Annual Surplus $ (0.9) $ 0.7 $ (2.9)<br />
Ending Fund Balance $ 1.1 $ 3.6 $ 0.6<br />
Reserve per Policy $ 0.5 $ 0.5<br />
49<br />
$ 0.5<br />
49
Transportation Improvement Fund<br />
Projects<br />
Project Name <strong>FY2014</strong><br />
Street Preservation and Maintenance Program $ $1,433,100<br />
Dysart Road Improvements @ Grand Avenue 1,433,100<br />
Greenway Road (Litchfield Road to Bullard Avenue) 550,000<br />
El Mirage Road (Northern Avenue to Bell Road) 550,000<br />
Peoria Avenue (Sarival Avenue to Reems Road) 500,000<br />
MMountain t i View Vi BBoulevard l d (W (West t <strong>of</strong> f Grand G dA Avenue) ) 315 315,000 000<br />
Cactus Road (175th Avenue to Cotton Lane) $300,000<br />
50
Impact p Fee Fund Outcomes<br />
• All interfund loans payable y to impact<br />
fee funds have been paid <strong>of</strong>f<br />
• Pending completion <strong>of</strong> post audit<br />
work, fund balance will be<br />
programmed diin contingency ti<br />
• Loans continue related to:<br />
2003 MPC bonds<br />
Interfund loans<br />
51
Enterprise Funds<br />
Solid Waste<br />
Wastewater<br />
Water<br />
(April 23rd (April 23 Presentation)<br />
rd Presentation)<br />
52
Solid Waste Summaryy<br />
• <strong>FY2014</strong>: No rate changes are recommended<br />
• EEmphasis h i placed l d on multi-year l i perspective i<br />
• Six vehicles scheduled for replacement in<br />
<strong>FY2014</strong><br />
• Strong g financial structure<br />
Vehicle replacements are cash funded<br />
Strong reserves<br />
53
Wastewater Summaryy<br />
• <strong>FY2014</strong>: No rate changes are recommended<br />
• Strong financial structure<br />
Revenues exceed expenses<br />
Non-growth Non growth CIP is cash funded<br />
Strong reserves<br />
• Bond debt revenue coverage g requirements q<br />
satisfied<br />
• Loans<br />
FY2012 other interfund loans (total $14.4M)<br />
General government impact fee fund $7.7M<br />
Fire impact fee fund $ $6.7M<br />
54
Water Summaryy<br />
• <strong>FY2014</strong>: Rate increase indicated<br />
• OOperating ti revenues equal l operating ti expenses;<br />
capacity desired<br />
• OOperations ti and d maintenance i t (60 dday ttarget) t)<br />
reserve fully funded<br />
• Reserves for routine capital replacement and<br />
vehicle replacement are not fully funded<br />
• Programmed CIP is minimal<br />
• Only half <strong>of</strong> the allotment <strong>of</strong> recharge water from<br />
Central Arizona Project (CAP) is being purchased<br />
55
Re Review ie <strong>Budget</strong> B dget Calendar<br />
56
Policy y Discussions<br />
May 2013<br />
05/07 Work session Department presentations<br />
05/14 Work session Department presentations<br />
05/21 Work session Financial policies<br />
Capital improvement plan<br />
SStreet light li h iimprovement di districts i<br />
Primary property tax<br />
57
Adoption p Process<br />
May 2013<br />
05/28 Meeting<br />
June 2013<br />
Tentative budget adoption<br />
(<strong>Surprise</strong>, SLIDs)<br />
06/04 Work session Final wrap-up<br />
06/11 MMeeting/Hearing i /H i<br />
06/11 Special Meeting<br />
06/25 Meeting<br />
Truth in taxation & <strong>FY2014</strong> final budget<br />
(<strong>Surprise</strong>, SLIDs, Marley Park CFD)<br />
Final budget adoption<br />
(<strong>Surprise</strong>, ( p SLIDs, Marley y Park CFD) )<br />
Property tax levy adoption<br />
(<strong>Surprise</strong>, SLIDs, Marley Park CFD)<br />
58
Document Publication<br />
August 2013<br />
08/26<br />
<strong>FY2014</strong> Adopted <strong>Budget</strong> Document posted<br />
online<br />
59
Discussion<br />
Discussion<br />
and<br />
Questions
General Information<br />
Mayor and <strong>City</strong> Council Members<br />
Mayor and <strong>City</strong> Council District Map Current<br />
Mayor and <strong>City</strong> Council District Map Future<br />
Strategic Plan<br />
<strong>City</strong> Map<br />
Special Planning Area Map<br />
History <strong>of</strong> <strong>Surprise</strong><br />
<strong>City</strong>wide Organizational Chart
MAYOR AND CITY COUNCIL MEMBERS<br />
MAYOR SHARON WOLCOTT – Mayor@surpriseaz.gov<br />
Mayor Sharon Wolcott was elected November 2011 on a platform that called for creating<br />
more jobs, providing new education options, and addressing traffic congestion in <strong>Surprise</strong>.<br />
The former District 1 council member also has worked hard to bring about more fiscal<br />
accountability and transparency at <strong>City</strong> Hall; and she intends to continue the fight for<br />
taxpayers in her new job.<br />
As Mayor, she has promised to reach out to the community with regular town hall<br />
meetings in neighborhoods across <strong>Surprise</strong>. Sharon believes city government works best<br />
when elected <strong>of</strong>ficials and senior staff members take time away from <strong>City</strong> Hall to engage<br />
residents on the issues.<br />
In December 2011, she joined several members <strong>of</strong> the <strong>City</strong> Council in an initial round <strong>of</strong> public meetings to<br />
discuss what citizens believe the city’s priorities should be in 2012 and beyond.<br />
Her hands-on style <strong>of</strong> leadership is expected to help drive solutions to some <strong>of</strong> our community’s most<br />
pressing and important challenges and opportunities.<br />
Sharon discovered <strong>Surprise</strong> in 2003. Her first opportunity to serve came in 2008, when she was appointed to<br />
the <strong>Surprise</strong> Transportation Commission, serving as Vice-Chair. She was elected to the <strong>Surprise</strong> <strong>City</strong><br />
Council in 2009.<br />
Before coming to our community, Sharon previously served on the city council in Newport, Minnesota and as<br />
a state legislator in both the Minnesota House and Senate.<br />
Wolcott’s term expires in December 2015. She is elected at-large.<br />
VICE MAYOR JIM BIUNDO – Jim.Biundo@surpriseaz.gov<br />
<strong>City</strong> Council member Biundo was appointed District 1 Council member on June 14, 2011<br />
to fill a vacancy. He has been a resident <strong>of</strong> <strong>Surprise</strong> since 2003.<br />
Jim served in the United States Marine Corps from 1954 to 1957. Following military<br />
service, he attended college in Colorado, received Bachelor <strong>of</strong> Arts and Master <strong>of</strong> Arts<br />
degrees in English, Speech, and Theatre, and continued studies in a post-graduate<br />
doctoral graduate program.<br />
Jim has had a career in education as a high school teacher, associate pr<strong>of</strong>essor, and<br />
administrator at colleges in Colorado, Iowa, Arizona, and Missouri. During that time, he<br />
also pursued a parallel track in public service. He has served as a Councilmember atlarge<br />
and has been on boards <strong>of</strong> directors <strong>of</strong> Chambers <strong>of</strong> Commerce, convention and visitor’s bureaus,<br />
civic/service organizations, and was on the Board <strong>of</strong> Directors <strong>of</strong> Brucemore, Inc., and a National Trust for<br />
Historic Preservation property located in Cedar Rapids, Iowa.<br />
Jim is the author <strong>of</strong> two books, several published poems, and over thirty published articles. He has made<br />
over 40 presentations at regional, national, and international conferences. He retired in 2000 from Southeast<br />
Missouri State University where he served as Assistant to the President.<br />
Jim and his wife Antoinette have three daughters: Terrilee Day in Del Norte, Colorado; Kimberly Peets in Las<br />
Vegas, Nevada; and Tammy Gerstner in Lee’s Summit, Missouri. They also have four grandchildren.<br />
Biundo’s term expires in December 2013.<br />
1
RICHARD ALTON – Richard.Alton@surpriseaz.gov<br />
Richard Alton represents the Cottonwood District, 2. The Cottonwood District<br />
encompasses the majority <strong>of</strong> Sun <strong>City</strong> Grand, the northwest portion <strong>of</strong> Sun Village,<br />
Stonebrook, Summerfield, and Bell West Ranch.<br />
Richard was elected to Council in 2007, and re-elected in 2011. Since arriving in <strong>Surprise</strong><br />
in 2003, he has served as a member <strong>of</strong> the <strong>Surprise</strong> Revitalization Committee, served on<br />
the ad hoc committee to analyze and recommend an auto mileage reimbursement<br />
method (Alton voted for the IRS standards), and most recently, he served as a<br />
Commissioner on the <strong>Surprise</strong> Planning and Zoning Commission.<br />
His experience on these commissions has given him valuable insight into the complexities<br />
and importance <strong>of</strong> zoning decisions, planning strategies, and redeveloping needy areas. His pr<strong>of</strong>essional<br />
experience in the banking industry gives him a unique understanding <strong>of</strong> the economic and business<br />
development aspects <strong>of</strong> proper planning, zoning, and revitalization.<br />
Richard brings more than 35 years <strong>of</strong> banking experience to his post, which will be a valuable asset in the<br />
city’s budgeting and planning processes. He will address <strong>Surprise</strong>’s urgent transportation needs,<br />
and make an impact in economic development strategies and networking. He is committed to enhancing the<br />
communications between citizens and the Council regarding Council agenda items.<br />
He and his wife re-located to <strong>Surprise</strong> from the Seattle, Washington area. He has six children (all grown) and<br />
11 grandchildren.<br />
Alton was re-elected in 2011 and his current term expires in December 2015.<br />
JOHN WILLIAMS – John.Williams@surpriseaz.gov<br />
John Williams was first elected to the <strong>City</strong> Council from District 3 (Mesquite) in November<br />
2007. He was re-elected in November 2011. As a teacher, parent, and husband, John<br />
brings a community perspective to his commitment to serve as a voice for all residents.<br />
John has been in education and sports medicine since he and his wife Melissa bought<br />
their home in <strong>Surprise</strong> in 2000.<br />
A graduate <strong>of</strong> H<strong>of</strong>stra University in New York, John also holds a master’s in health<br />
science from Towson University in Maryland. His pr<strong>of</strong>essional career began in sports<br />
medicine and transitioned into education when he and Melissa came to <strong>Surprise</strong>.<br />
For the past seven years, he has been working as a teacher, building the Career and Technical Education<br />
Sports Medicine program in the Peoria Unified School District. He has been selected by his peers to be the<br />
program lead for the past two years.<br />
John and Melissa have three children, Connor, Ashlyn, and Matthew. Melissa and John are animal lovers<br />
and they have opened their home to numerous animals in need including Blaze, the three-legged cocker<br />
spaniel whose life was extended for eight years after they took him into their home in 1999.<br />
“I want to give my kids, our kids, the opportunity to be part <strong>of</strong> the city that is defining vibrant southwest living.<br />
In 15 years, I hope my oldest, Connor, can attend the next great university right here in <strong>Surprise</strong>. I hope<br />
when he graduates he will have the option <strong>of</strong> building his own family here because we will have grown a<br />
sustainable economy that <strong>of</strong>fers high quality jobs to our residents. These are my hopes and dreams. I<br />
believe working together, we can make them happen.”<br />
Williams was re-elected in 2011 and his current term expires in December 2015.<br />
2
ROY VILLANUEVA – Roy.Villanueva@surpriseaz.gov<br />
As the representative from District 4 (Mulberry), Roy Villanueva brings a combined 25 years<br />
<strong>of</strong> experience as <strong>Surprise</strong> Mayor, Vice Mayor, and council member. Most recently, he was<br />
elected to Council in 2007 and re-elected in 2011.<br />
During his many years <strong>of</strong> service, Roy has initiated many important improvements in the area <strong>of</strong><br />
housing rehabilitation, economic development, utilities, police services, fire services, and federal<br />
grants.<br />
While serving as chair <strong>of</strong> the Community Development Block Grant Committee, Roy was<br />
instrumental in targeting these important federal dollars to improve housing, roads, streetlights,<br />
sidewalks, baseball fields, sewer systems, and other important neighborhood infrastructure<br />
around the city.<br />
He was also instrumental in developing important <strong>Surprise</strong> economic milestones such as the West Point<br />
Towne Center, and bringing major league baseball and <strong>Surprise</strong> stadium to the community.<br />
He is excited and ready to introduce progressive programs and services to all residents <strong>of</strong> <strong>Surprise</strong>. His<br />
goals for his current term:<br />
• Work with all council members to represent respectfully our city and the residents <strong>of</strong> District 4.<br />
• Improve transportation.<br />
• Continue to improve and promote businesses in the Original Town Site.<br />
• Continue recreation programs for young people.<br />
• Support public services such as the Fire and Police Departments.<br />
• Explore more job opportunities for <strong>Surprise</strong> residents.<br />
Roy has lived in <strong>Surprise</strong> for 32 years; and has been married to Rachel for 39 years. His three grown<br />
children, all Dysart High School graduates, were raised in <strong>Surprise</strong>. He has one grandson.<br />
Villanueva was re-elected in 2011 and his current term expires in December 2015.<br />
MIKE WOODARD – Mike.Woodard@surpriseaz.gov<br />
<strong>City</strong> Council member Mike Woodard represents District 5 (Palm). District 5 includes the<br />
northern half <strong>of</strong> West Point, Kingswood Parke, The Orchards, Sierra Verde, a portion <strong>of</strong><br />
the Original Town Site, the Stadium Village complex, and the Civic Center/Recreational<br />
campuses.<br />
Mike, a <strong>Surprise</strong> resident since 1998, is a retired widower and resident <strong>of</strong> West Point<br />
Towne Center. He has been an active citizen in the community since 2001 as co-founder<br />
<strong>of</strong> the group Citizen’s for a Better <strong>Surprise</strong>, a member <strong>of</strong> the Planning and Zoning<br />
Commission, a Sundancer volunteer, an at-large member <strong>of</strong> the Citizen Bond Committee,<br />
and as a senior center volunteer driver. He also volunteers his time and efforts to West<br />
Valley Cancer Connections and the H.O.P.E. Team at Cancer Treatment Centers <strong>of</strong> America.<br />
His involvement in the city combined with over 40 years <strong>of</strong> accounting and managerial experience in a broad<br />
range <strong>of</strong> industries will be valuable in the city’s budgeting and planning processes. He is committed to<br />
bringing commuter rail and improving transportation corridors, major factors affecting the city’s economic<br />
development strategies. Mike believes communication between the citizens and council is <strong>of</strong> paramount<br />
importance and will be a top personal endeavor for him.<br />
Mike has helped raise four children and numerous foster children; and he is grandfather to six and greatgrandfather<br />
to one great-granddaughter.<br />
Woodard’s term expires in December 2013.<br />
3
SKIP HALL – Skip.Hall@surpriseaz.gov<br />
A resident <strong>of</strong> <strong>Surprise</strong> since 2003, Skip served on the <strong>Surprise</strong> Planning and Zoning<br />
Commission for three years and currently serves on the Sun Village Board <strong>of</strong> Directors as<br />
Treasurer.<br />
Skip’s goals for the city include additional east-west road crossings over the Aqua Fria<br />
River, working with other transportation partners to expand Grand Avenue, and attracting<br />
new businesses to <strong>Surprise</strong>.<br />
He grew up in Idaho and received a business degree from Seattle University. Skip is a<br />
Vietnam War Veteran and he was awarded the Bronze Star for his outstanding service<br />
1969-1970.<br />
Skip worked in the restaurant and lodging business for decades, opening restaurants in California, Oregon,<br />
and Washington and earning a certification in hotel administration. He was involved in multi-unit<br />
management for two lodging chains and achieved the Best Practice Award from American Express and the<br />
National Lodging Institute.<br />
He has worked with Junior Achievement and the Veterans <strong>of</strong> Foreign Wars. He has also taught community<br />
college courses on the hospitality business and restaurant and hotel management.<br />
Skip has two daughters, one son, and five grandchildren.<br />
The Palo Verde District includes Coyote Lakes, Canyon Ridge West, Rose Garden, Sunflower Resort, Sun<br />
Village, Fox Hill Run, and the eastern portion <strong>of</strong> the city’s Original Town Site.<br />
Hall’s term expires in December 2013.<br />
Redistricting<br />
The Mayor and <strong>City</strong> Council approved the map recommended by the citizen Redistricting Committee in<br />
October 2011. As required by federal law, the map redraws the boundaries <strong>of</strong> the <strong>City</strong> Council districts to<br />
achieve a roughly even population distribution among the districts, as determined by the 2010 Census. The<br />
last time district boundaries were set was after the 2000 Census.<br />
The new districts go into effect in stages. The first districts, numbers 1, 5, and 6 are effective January 1,<br />
2014. The remaining districts, 2, 3, and 4, go into effect January 1, 2016.<br />
The following two pages include a current map <strong>of</strong> the current city districts and a map <strong>of</strong> the new districts.<br />
4
DOVE VALLEY RD<br />
LONE MOUNTAIN RD<br />
DIXELETA DR<br />
PATTON RD<br />
JOMAX RD<br />
HAPPY VALLEY RD<br />
PINNACLE PEAK RD<br />
SUN VALLEY PKWY<br />
243RD AVE<br />
227TH AVE<br />
MAYOR<br />
Sharon Wolcott<br />
623.222.1300<br />
mayor@surpriseaz.gov<br />
DISTRICT 1<br />
Jim Biundo<br />
623 222-1321<br />
jim.biundo@surpriseaz.gov<br />
GRAND AVE<br />
1<br />
DISTRICT 4<br />
Roy Villanueva<br />
623.222.1324<br />
roy.villanueva@surpriseaz.gov<br />
211TH AVE<br />
211TH AVE<br />
DEER VALLEY RD<br />
BELL RD<br />
GREENWAY RD<br />
WADDELL RD<br />
CACTUS RD<br />
PEORIA AVE<br />
PERRYVILLE RD<br />
SR 303<br />
163RD AVE<br />
SR 303<br />
DISTRICT 2<br />
Richard Alton<br />
623.222.1322<br />
richard.alton@surpriseaz.gov<br />
DISTRICT 5<br />
Mike Woodard<br />
623.222.1325<br />
mike.woodard@surpriseaz.gov<br />
5<br />
COTTON LN<br />
SARIVAL AVE<br />
2<br />
3<br />
REEMS RD<br />
<strong>City</strong> <strong>of</strong> <strong>Surprise</strong><br />
<strong>City</strong> Council<br />
Districts<br />
GRAND AVE<br />
BULLARD AV<br />
5<br />
JOMAX RD<br />
HAPPY VALLEY RD<br />
PINNACLE PEAK RD<br />
LITCHFIELD RD<br />
DYSART RD<br />
4<br />
DISTRICT 3<br />
EL MIRAGE RD<br />
6<br />
John Williams, Vice Mayor<br />
623.222.1323<br />
john.williams@surpriseaz.gov<br />
DISTRICT 6<br />
Skip Hall<br />
623.222.1326<br />
skip.hall@surpriseaz.gov
DOVE VALLEY RD<br />
LONE MOUNTAIN RD<br />
DIXELETA DR<br />
PATTON RD<br />
JOMAX RD<br />
HAPPY VALLEY RD<br />
PINNACLE PEAK RD<br />
SUN VALLEY PKWY<br />
243RD AVE<br />
227TH AVE<br />
MAYOR<br />
Sharon Wolcott<br />
623.222.1300<br />
mayor@surpriseaz.gov<br />
DISTRICT 1<br />
Jim Biundo<br />
623 222-1321<br />
jim.biundo@surpriseaz.gov<br />
GRAND AVE<br />
DISTRICT 4<br />
Roy Villanueva<br />
623.222.1324<br />
roy.villanueva@surpriseaz.gov<br />
211TH AVE<br />
211TH AVE<br />
DEER VALLEY RD<br />
BELL RD<br />
GREENWAY RD<br />
WADDELL RD<br />
CACTUS RD<br />
PEORIA AVE<br />
PERRYVILLE RD<br />
1<br />
COTTON LN<br />
SR 303<br />
163RD AVE<br />
SR 303<br />
3<br />
SARIVAL AVE<br />
DISTRICT 2<br />
Richard Alton<br />
623.222.1322<br />
richard.alton@surpriseaz.gov<br />
DISTRICT 5<br />
Mike Woodard<br />
623.222.1325<br />
mike.woodard@surpriseaz.gov<br />
6<br />
2<br />
REEMS RD<br />
<strong>City</strong> <strong>of</strong> <strong>Surprise</strong><br />
<strong>City</strong> Council<br />
Districts<br />
5<br />
BULLARD AV<br />
JOMAX RD<br />
HAPPY VALLEY RD<br />
PINNACLE PEAK RD<br />
6<br />
LITCHFIELD RD<br />
4<br />
DYSART RD<br />
DISTRICT 3<br />
EL MIRAGE RD<br />
GRAND AVE<br />
John Williams, Vice Mayor<br />
623.222.1323<br />
john.williams@surpriseaz.gov<br />
DISTRICT 6<br />
Skip Hall<br />
623.222.1326<br />
skip.hall@surpriseaz.gov
<strong>City</strong> Council<br />
Strategic Plan<br />
The Strategic Plan establishes seven elements to guide policy and nancial decision making, shape partnerships, and involve the<br />
residents <strong>of</strong> <strong>Surprise</strong> in building our future based on a shared vision <strong>of</strong> the community’s future.<br />
Vision Statement<br />
“Develop a high standard <strong>of</strong> community life through shared vision, superior service, and sustainable practices.”<br />
Transportation<br />
Develop an ecient, cost eective, multi-modal transportation<br />
system that provides connectivity to the region, ease <strong>of</strong><br />
movement into, within, and out <strong>of</strong> <strong>Surprise</strong>, and supports a<br />
high standard <strong>of</strong> community life.<br />
1. Improve access to and from <strong>Surprise</strong>, specically<br />
east/west connections.<br />
2. Improve internal circulation by completing the arterial<br />
network in the city.<br />
3. Develop a robust multimodal transit plan that provides<br />
for transit connectivity to the region.<br />
4. Provide local public transit service in <strong>Surprise</strong>.<br />
5. Institute comprehensive Intelligent Transportation<br />
6.<br />
Systems (ITS) in the city.<br />
Develop and institute a plan to maintain the city’s streets<br />
and roads.<br />
7. Identify funding sources for the transportation system.<br />
8. Develop and maintain a balanced transportation system<br />
for alternative modes <strong>of</strong> travel.<br />
Sustainability<br />
Provide a vibrant and sustainable community for a green<br />
<strong>Surprise</strong> today and tomorrow.<br />
1. Reduce total energy usage in city owned facilities, i.e. city<br />
hall, stadium.<br />
2. Make good use <strong>of</strong> our physical resources and ensure<br />
proper disposal <strong>of</strong> those resources.<br />
3. Respect nature by protecting critical wildlife corridors.<br />
4. Ensure sucient water resources for current and future<br />
needs.<br />
5. Protect the air quality in <strong>Surprise</strong>.<br />
7<br />
Economic Development<br />
Create a robust business environment that attracts employment,<br />
wealth, capital investment, and enhanced opportunities<br />
for investors and residents.<br />
1. Promote <strong>Surprise</strong> as a location for clean industry, hightech<br />
manufacturing, and corporate oces.<br />
2. Continue hands-on approach with small business startups<br />
and retention/expansion opportunities.<br />
3. Partner with Regional Chamber <strong>of</strong> Commerce to promote<br />
jobs.<br />
4. Investigate opportunities to attract family-oriented entertainment<br />
venues.<br />
5. Attract specialty medical and/or research clinics.<br />
6. Assist property owners with development <strong>of</strong> <strong>Surprise</strong><br />
Center.<br />
7. Implement and market foreign trade zone.<br />
8. Identify and secure additional funding methods for<br />
economic development.<br />
Community Lifestyle<br />
Enhance community lifestyle for the current and the future<br />
residents <strong>of</strong> <strong>Surprise</strong>.<br />
1. Enhance the beauty <strong>of</strong> neighborhoods throughout our<br />
community.<br />
2. Maintain <strong>Surprise</strong> as a safe community.<br />
3. Continue to promote quality neighborhoods in design<br />
and amenities and smart, controlled growth.<br />
4. Encourage community connectivity when considering<br />
development.
Tourism<br />
Infuse tourism dollars into <strong>Surprise</strong>’s economy by diversifying<br />
the events, programs, and partnerships oered that<br />
make <strong>Surprise</strong> an attractive destination for a wide variety <strong>of</strong><br />
interests.<br />
1. Lay the groundwork for creating a multi-use facility that<br />
will draw entertainment and tourism.<br />
2. Develop an annual festival framework.<br />
3. Develop a regional entertainment corridor.<br />
4. Create partnerships that oer visitors a wide range <strong>of</strong><br />
non-baseball activities.<br />
Public Safety<br />
Public safety departments will work cooperatively with the<br />
community to provide a safe and secure city.<br />
1. Mitigate crime and accidents by enhancing community<br />
awareness <strong>of</strong> public safety systems and partnering with<br />
other re and crime prevention programs.<br />
2. Provide public safety workers with the tools and training<br />
necessary to meet community public safety needs.<br />
3. Ensure timely and appropriate response.<br />
4. Provide extraordinary internal and external customer<br />
service.<br />
5. Ensure scal responsibility in all public safety eorts.<br />
<strong>City</strong> Council<br />
Strategic Plan<br />
8<br />
Education<br />
Strive to develop world class education in <strong>Surprise</strong> by<br />
seeking and enhancing educational opportunities that<br />
support initiatives, programs, projects, and lifelong learning<br />
opportunities throughout the community.<br />
1.<br />
2.<br />
3.<br />
4.<br />
Support K-12 initiatives.<br />
Expand partnerships and maximize resources for greater<br />
access to education.<br />
Facilitate development <strong>of</strong> a 4-year liberal arts college<br />
campus.<br />
Facilitate development <strong>of</strong> a technical college.
283rd Ave<br />
28300W<br />
275th Ave<br />
27500W<br />
Desert Hills Dr<br />
39400N<br />
Joy Ranch Rd<br />
37800N<br />
Cloud Rd<br />
36200N<br />
Carefree Hwy<br />
34600N<br />
Dove Valley Rd<br />
33000N<br />
Lone Mountain Rd<br />
31400N<br />
Dixileta Dr<br />
29800N<br />
Patton Rd<br />
28200N<br />
267th Ave<br />
26700W<br />
259th Ave<br />
25900W<br />
251st Ave<br />
Jomax Rd<br />
26600N<br />
Happy Valley Rd<br />
25000N<br />
Pinnacle Peak Rd<br />
23400N<br />
Deer Valley Rd<br />
21800N<br />
Beardsley Rd<br />
20200N<br />
Union Hills Dr<br />
18600N<br />
243rd Ave<br />
FY 2014<br />
INCORPORATED: 1960<br />
ELEVATION: 1,130 Feet<br />
COUNTY: Maricopa<br />
AREA: 107.54 Square Miles<br />
POPULATION: 119,530<br />
25100W<br />
24300W<br />
Map Legend<br />
SURPRISE CITY COUNCIL 623.222.1300<br />
Sharon Wolcot, MA YOR<br />
Jim Biundo, Vice Mayor (DISTRICT 1)<br />
Richard Alton (DISTRICT 2)<br />
John Williams (DISTRICT 3)<br />
Roy Villanueva (DISTRICT 4)<br />
Mike Woodard (DISTRICT 5)<br />
Skip Hall (DISTRICT 6)<br />
CITY MANAGER 623.222.1100<br />
Chris Hillman<br />
<strong>City</strong> Limits<br />
Freeway<br />
235th Ave<br />
23500W<br />
Sun Valley<br />
Parkway<br />
227th Ave<br />
·<br />
Map Created by <strong>City</strong> <strong>of</strong> <strong>Surprise</strong>: April 2013<br />
Railroad<br />
22700W<br />
219th Ave/Crosier Rd<br />
21900W<br />
211th Ave<br />
<strong>City</strong> <strong>of</strong> <strong>Surprise</strong><br />
16000 N Civic Center Plaza<br />
<strong>Surprise</strong>, AZ 85374<br />
623.222.1000<br />
623.222.1001 Fax<br />
623.222.1002 TTY<br />
www.surpriseaz.gov<br />
21100W<br />
White Tank Mountain<br />
Regional Park<br />
203rd Ave<br />
20300W<br />
Olive Ave<br />
9000N<br />
Bell Rd<br />
Greenway Rd<br />
15400N<br />
Waddell Rd<br />
13800N<br />
Cactus Rd<br />
12200N<br />
Peoria Ave<br />
10600N<br />
Iv<br />
17000N<br />
195th Ave<br />
19500W<br />
Perryville Rd<br />
Desert Hills Dr<br />
39400N<br />
Joy Ranch Rd<br />
37800N<br />
Cloud Rd<br />
36200N<br />
Carefree Hwy<br />
34600N<br />
Dove Valley Rd<br />
33000N<br />
Lone Mountain Rd<br />
31400N<br />
Dixileta Dr<br />
29800N<br />
Dynamite Blvd<br />
28200N<br />
18700W<br />
9<br />
Citrus Rd<br />
17900W<br />
Grand Ave<br />
Cotton Ln<br />
17100W<br />
Estrella Fwy (SR 303)<br />
Aÿ<br />
Sarival Ave<br />
16300W<br />
Jomax Rd<br />
26600N<br />
Happy Valley Rd<br />
25000N<br />
Pinnacle Peak Rd<br />
23400N<br />
Deer Valley Rd<br />
21800N<br />
Beardsley Rd<br />
20200N<br />
Reems Rd<br />
15500W<br />
Bullard Ave<br />
Thunderbird Rd<br />
13800N<br />
14700W<br />
Union Hills Dr<br />
18600N<br />
Litchfield Rd<br />
13900W<br />
Dysart Rd<br />
13100W<br />
<strong>Surprise</strong><br />
PLOT DATE:09 JUNE 08<br />
El Mirage Rd<br />
12300W<br />
115th Ave<br />
^<br />
11500W<br />
^<br />
^<br />
Flagstaff<br />
Phoenix<br />
Tucson
283rd Av<br />
28300W<br />
283rd Ave<br />
28300W<br />
275th Av<br />
27500W<br />
275th Ave<br />
27500W<br />
267th Av<br />
26700W<br />
CIRCLE MOUNTAIN RD<br />
44200N<br />
HONDA BOW RD<br />
42600N<br />
ROCKAWAY HILLS RD<br />
41000N<br />
DESERT HILLS DR<br />
39400N<br />
JOY RANCH RD<br />
37800N<br />
CLOUD RD<br />
36200N<br />
CAREFREE HWY<br />
34600N<br />
DOVE VALLEY RD<br />
33000N<br />
LONE MOUNTAIN RD<br />
31400N<br />
Dixeleta Dr<br />
29800N<br />
Patton Rd<br />
28200N<br />
267th Ave<br />
26700W<br />
259th Av<br />
25900W<br />
JENNY LIN RD<br />
45800N<br />
259th Ave<br />
25900W<br />
251st Av<br />
25100W<br />
251st Ave<br />
25100W<br />
Jomax Rd<br />
26600N<br />
Happy Valley Rd<br />
25000N<br />
Pinnacle Peak Rd<br />
23400N<br />
Deer Valley Rd<br />
21800N<br />
Beardsley Rd<br />
20200N<br />
18600N<br />
243rd Av<br />
24300W<br />
Union Hills Dr<br />
243rd Ave<br />
24300W<br />
235th Av<br />
SPA 5<br />
235th Ave<br />
23500W<br />
23500W<br />
227th Av<br />
Sun Valley<br />
Parkway<br />
227th Ave<br />
22700W<br />
22700W<br />
Special Planning Area Map<br />
219th Av<br />
21900W<br />
SPA 6<br />
219th Ave/Crosier Rd<br />
21900W<br />
211th Av<br />
211th Ave<br />
21100W<br />
21100W<br />
203rd Av<br />
203rd Ave<br />
20300W<br />
20300W<br />
17000N<br />
Greenway Rd<br />
15400N<br />
Waddell Rd<br />
13800N<br />
Cactus Rd<br />
12200N<br />
Peoria Ave<br />
10600N<br />
Olive Ave<br />
9000N<br />
Bell Rd<br />
195th Ave<br />
19500W<br />
Northern Ave<br />
8000N<br />
Glendale Ave<br />
7000N<br />
195th Av<br />
19500W<br />
SPA 4<br />
10<br />
187th Av<br />
18700W<br />
Dynamite Blvd<br />
28200N<br />
Perryville Rd<br />
18700W<br />
LONE MOUNTAIN RD<br />
31400N<br />
Dixeleta Dr<br />
29800N<br />
SPA 3<br />
179th Av<br />
17900W<br />
CLOUD RD<br />
36200N<br />
Citrus Rd<br />
17900W<br />
JENNY LIN RD<br />
45800N<br />
CIRCLE MOUNTAIN RD<br />
44200N<br />
HONDA BOW RD<br />
42600N<br />
ROCKAWAY HILLS RD<br />
41000N<br />
DESERT HILLS DR<br />
39400N<br />
JOY RANCH RD<br />
37800N<br />
CAREFREE HWY<br />
34600N<br />
DOVE VALLEY RD<br />
33000N<br />
Grand Ave<br />
171st Av<br />
17100W<br />
Cotton Ln<br />
17100W<br />
Estrella Fwy (SR 303)<br />
163rd Av<br />
16300W<br />
Sarival Ave<br />
16300W<br />
155th Av<br />
15500W<br />
SPA 2<br />
Pinnacle Peak Rd<br />
23400N<br />
Deer Valley Rd<br />
21800N<br />
Beardsley Rd<br />
20200N<br />
Happy Valley Rd<br />
25000N<br />
Reems Rd<br />
15500W<br />
Jomax Rd<br />
26600N<br />
147th Av<br />
SPA 1<br />
Bullard Ave<br />
14700W<br />
14700W<br />
139th Av<br />
13900W<br />
Union Hills Dr<br />
18600N<br />
Thunderbird Rd<br />
13800N<br />
Litchfield Rd<br />
13900W<br />
131st Av<br />
13100W<br />
Dysart Rd<br />
13100W<br />
El Mirage Rd<br />
12300W<br />
115th Ave<br />
11500W
History <strong>of</strong> <strong>Surprise</strong><br />
<strong>Surprise</strong>, located just 45 minutes west <strong>of</strong> downtown Phoenix<br />
along U.S. Route 60/State Highway 93, was founded on May<br />
17, 1938 by Flora Mae Statler who purchased and subdivided<br />
the original townsite. The former small farming village now<br />
encompasses 108 square miles, including urban and<br />
commercial developments, ranches, industrial, and business<br />
parks. <strong>Surprise</strong> strives to achieve a balance between the<br />
needs <strong>of</strong> residential communities and the growth <strong>of</strong> business<br />
and industrial areas. Industrial growth zones are selected to<br />
operate competitively, but harmoniously, with the residential<br />
community.<br />
Over the past 51 years, <strong>Surprise</strong> has grown from 500 residents<br />
to a city <strong>of</strong> over 118,000 people, evolving from a small town<br />
government to a regional governmental entity. The city <strong>of</strong>fers a<br />
broad range <strong>of</strong> living styles, from small family subdivisions to a<br />
number <strong>of</strong> secluded ranches. <strong>Surprise</strong> also <strong>of</strong>fers a number <strong>of</strong><br />
retirement communities that address the needs and lifestyles <strong>of</strong> active adults.<br />
Besides year round sunshine and new, clean, safe neighborhoods, bustling <strong>Surprise</strong> <strong>of</strong>fers excellent<br />
opportunities to share our great southwestern lifestyle. You can check out awesome White Tank<br />
Mountain Regional Park, where you can puzzle over ancient petroglyphs and hike to a seasonal waterfall,<br />
or camp out under twinkling desert stars. Enjoy Spring Training in <strong>Surprise</strong>, when major leaguers for<br />
many <strong>of</strong> the 12 Cactus League teams visit beautiful <strong>Surprise</strong> Stadium, home to the Texas Rangers and<br />
Kansas <strong>City</strong> Royals. Play tennis at the Tennis and Racquet Complex featuring 25 tennis courts,<br />
racquetball and table tennis. <strong>Surprise</strong> Aquatic Center is the perfect place to cool <strong>of</strong>f in the one <strong>of</strong> the<br />
pools featuring 2 slides and a zero depth play area for children. Enjoy our eight open to the public golf<br />
courses, the region’s finest fully accessible community park, and year round events a fabulous 4th July<br />
fireworks to December community wide <strong>Surprise</strong> Party.<br />
Health and education are top priorities. You will find medical services at nearby Banner Hospitals and<br />
several urgent care centers. Kindergarten through twelfth grade schools are run by the rapidly growing<br />
Dysart Unified School District. Rio Salado Community College and the Communiversity at <strong>Surprise</strong> <strong>of</strong>fer<br />
collegiate classes in the city. According to the U.S. Census Bureau, 2010 American Community Survey:<br />
92% <strong>of</strong> people 25 years and over had at least graduated from high school and 29% had a<br />
bachelor's degree or higher.<br />
Total school enrollment in <strong>Surprise</strong> was 26,000<br />
o Nursery school and kindergarten enrollment was 3,599<br />
o Elementary or high school enrollment was 22,230 children<br />
o College or graduate school enrollment was 7,553<br />
<strong>Surprise</strong> residents are employed in a variety <strong>of</strong> occupations including management, pr<strong>of</strong>essional, and<br />
related occupations 36%; sales and <strong>of</strong>fice occupations 29%; service occupations 17%, natural resources,<br />
construction, and maintenance occupations 6%; and production transportation, and material moving<br />
occupations 12% (U.S. Census Bureau, 2010 American Community Survey).<br />
Excellence in municipal services is a city <strong>of</strong> <strong>Surprise</strong> standard. <strong>Surprise</strong> is a city that operates under the<br />
Council/Manager form <strong>of</strong> government.<br />
Values<br />
We are <strong>Surprise</strong>!<br />
Integrity Pr<strong>of</strong>essional Accountable High Quality Services Customer Focused<br />
Vision Statement<br />
Develop a high standard <strong>of</strong> community life through shared vision, superior service, and sustainable<br />
practices.<br />
11<br />
Year<br />
End <strong>of</strong> the<br />
Year<br />
Population<br />
Percentage<br />
Change<br />
2002 45,125 17%<br />
2003 51,885 14%<br />
2004 64,210 23%<br />
2005 88,265 37%<br />
2006 96,425 9%<br />
2007 98,140 1%<br />
2008 104,895 6%<br />
2009 108,040 6%<br />
2010 117,517 9%<br />
2011 118,349 1%
Statistical Information<br />
Population Information:<br />
<strong>City</strong> <strong>of</strong> <strong>Surprise</strong> Maricopa County<br />
Percentage<br />
<strong>of</strong> County<br />
Population Population<br />
Year Population<br />
Percentage<br />
Change<br />
1970 2,427 0.25% 971,228<br />
1980 3,723 53% 0.25% 1,509,175 55%<br />
1990 7,122 91% 0.34% 2,122,101 41%<br />
1995 10,737 51% 0.44% 2,419,394 14%<br />
2000 30,848 187% 1.0% 3,072,149 27%<br />
2005 88,265 186% 2.5% 3,524,175 13%<br />
2012 118,349 34% 3.1% 3,817,117 8%<br />
Source: U.S. Census Bureau<br />
Percentage<br />
Change<br />
Median Household Income<br />
Year Median Household Income Percentage Change<br />
1990 $21,750<br />
1995 $26,443 22%<br />
2000 $44,156 67%<br />
2005 $53,958 22%<br />
2010 $60,687 12%<br />
Source: U.S. Census Bureau<br />
Median Age<br />
Year Median Age Percentage Change<br />
1980 20.3<br />
1985 24.2 19%<br />
1990 33.0 36%<br />
1995 41.7 26%<br />
2000 46.1 11%<br />
2005 35.4 -23%<br />
2010<br />
Source: U.S. Census Bureau<br />
36.8 4%<br />
<strong>City</strong> <strong>of</strong> <strong>Surprise</strong> Incorporated Area – Date <strong>of</strong> Incorporation: December 1960<br />
Incorporated Square Miles<br />
Date<br />
(Approximately)<br />
1960 1<br />
1970 1<br />
1980 2<br />
1990 63<br />
2000 72<br />
2005 76<br />
2009 106<br />
2010 107<br />
2011 107<br />
2012 108<br />
2013 108<br />
Source: <strong>City</strong> <strong>of</strong> <strong>Surprise</strong><br />
12
Mayor<br />
Vice Mayor<br />
Council Members<br />
Presiding Judge <strong>City</strong> Attorney <strong>City</strong> Manager<br />
<strong>City</strong> Clerk<br />
Assistant <strong>City</strong> Manager/<br />
Community and<br />
Economic Development<br />
Director<br />
Public Works<br />
Director<br />
Community and<br />
Recreation Services<br />
Director<br />
<strong>City</strong> <strong>of</strong> <strong>Surprise</strong> Residents<br />
13<br />
Intergovernmental<br />
Relations<br />
Director<br />
Marketing and<br />
Communications<br />
Director<br />
Fire Chief<br />
Police Chief<br />
Assistant <strong>City</strong> Manager/<br />
Chief Financial Officer<br />
Human Resources<br />
Director<br />
Information<br />
Technology<br />
Director
Revenue<br />
Revenue Summary<br />
Revenue Detail
General Fund<br />
Revenue Summary<br />
General Fund Operating Revenues<br />
Operating revenues are those used to provide core government services (e.g. police, fire, street<br />
maintenance, library, parks, etc.) and are recorded in the general fund. The general fund is the primary<br />
operating fund <strong>of</strong> the city and used to account for all financial resources not accounted for in the other funds.<br />
Key Assumptions<br />
A number <strong>of</strong> assumptions influence the revenue forecast including the character <strong>of</strong> the economy and the<br />
effect <strong>of</strong> the state budget on the city. The city is experiencing a modest recovery following the recent<br />
economic downturn with increases showing in most revenue categories. A full recovery is likely in 2015, eight<br />
years from the beginning <strong>of</strong> the recession. The city’s population will continue to grow at a rate greater than<br />
that <strong>of</strong> many neighboring communities. As a result, the city is expected to capture a greater portion <strong>of</strong> state<br />
shared revenues and will receive a greater share <strong>of</strong> city revenues from building related activity.<br />
Consumers are beginning to spend more discretionary income and the city is experiencing an increase in<br />
sales tax revenues. Additionally, resident participation in city recreation programs continues to drive up<br />
demand for services, also resulting in greater revenue streams to recover associated costs.<br />
The city will continue to monitor activity in the state legislature related to transaction privilege tax reform.<br />
Recent conversations related to state action on the construction related tax could have a negative impact on<br />
the city budget.<br />
The degree <strong>of</strong> forecast accuracy varies by revenue source. Some revenue sources, such as state shared<br />
income tax, which is based on collections from two years prior, are known to the city in advance and the<br />
forecast is completely accurate. Other sources, such as construction sales tax, are much more sensitive to<br />
market forces and are more difficult to forecast.<br />
Millions<br />
$100.0<br />
$95.0<br />
$90.0<br />
$85.0<br />
$80.0<br />
$75.0<br />
$70.0<br />
$65.0<br />
$60.0<br />
$55.0<br />
$50.0<br />
$81.1<br />
FY2012<br />
Actual<br />
3%<br />
$83.0<br />
FY2013<br />
Adopted<br />
<strong>Budget</strong><br />
14<br />
3%<br />
$84.5<br />
FY2013<br />
Estimate<br />
5%<br />
$88.2<br />
<strong>FY2014</strong><br />
Forecast
Overview<br />
The operating revenue forecast for fiscal year (FY) 2014 is $88.2 million, an increase <strong>of</strong> $3.9 million or 4%<br />
over the FY2013 estimate, mainly the result <strong>of</strong> increased charges for services and state shared revenues<br />
due to increased population. Operating revenues may be categorized into five major groups:<br />
1. Sales Tax<br />
2. State Shared Revenue<br />
3. Charges for Services/Other<br />
4. Property Tax<br />
5. Franchise Fees<br />
Sales Tax<br />
This category represents the local sales taxes collected for the city <strong>of</strong> <strong>Surprise</strong> including construction sales<br />
tax. A sales tax projection team comprised <strong>of</strong> the budget manager, revenue manager and staff prepares and<br />
monitors the local sales tax forecast. Forecasts are done individually within each <strong>of</strong> 11 different categories<br />
(industries) using industry specific information (e.g. big box retail, construction, etc).<br />
The <strong>FY2014</strong> general fund forecast <strong>of</strong> $33.4 million is an increase <strong>of</strong> 2% over the FY2013 estimate. A number<br />
<strong>of</strong> the sales tax categories are driving the increase including major retailers and auto dealerships with new<br />
accounts, communications/utilities with increased cell phone activity, the use tax, and the continued<br />
rebounding <strong>of</strong> transient lodging, restaurants/bars, and arts/entertainment. From the construction sales tax,<br />
the general fund receives a flat $1.25 million from the 2.2% construction sales tax. The remaining portion<br />
after the fire $1.25 million is distributed to the general capital fund. The Transportation Improvement fund<br />
also receives an allocation from a dedicated 1.5%construction sales tax. In total, the city anticipates<br />
collecting $6.0 million in construction sales tax during <strong>FY2014</strong> between the three funds.<br />
State Shared Revenue<br />
The state shared revenue forecast is $27.2 million, an increase <strong>of</strong> 6% over the FY2013 estimate. State<br />
shared revenue sources include income tax, state sales tax, and vehicle license taxes (VLT). The changes<br />
over the prior year are attributable an improving economy.<br />
15
The largest state shared revenue source, income taxes, is distributed to the city <strong>of</strong> <strong>Surprise</strong> based on census<br />
population. The amount is certain because there is a two-year lag in receipts in which <strong>FY2014</strong> revenue<br />
results from FY2012 activity. Income tax collections <strong>of</strong> $13.1 million results in an increase <strong>of</strong> 9% from the<br />
prior year amount <strong>of</strong> $12.0 million.<br />
The state sales taxes reflect the city’s portion <strong>of</strong> statewide collections based on population. State sales taxes<br />
are economy driven and are expected to increase 5% to $10.2 million.<br />
The vehicle license tax is population based. Vehicle license taxes imposed annually in lieu <strong>of</strong> a personal<br />
property tax on automobiles and anticipated to remain flat at $3.9 million.<br />
Charges for Services/Other<br />
All fees for services charged by city departments are recorded in this category. The four major components<br />
include the indirect cost assessment, community and recreation services revenue, building/engineering fees,<br />
and court revenue. This category increased by 9% from the prior year estimate to $15.9 million.<br />
The largest source <strong>of</strong> charges for services is the indirect cost assessment charged to the enterprise funds.<br />
Services provided by the general fund on behalf <strong>of</strong> the enterprise funds are recovered through the indirect<br />
cost assessment, which serves as the invoice to the enterprise funds. The allocation performed is to ensure<br />
the general fund revenues are not subsidizing the enterprise funds <strong>of</strong> water, wastewater, and sanitation. For<br />
<strong>FY2014</strong>, the indirect cost assessment budgeted for $4.7 million and represents an increase <strong>of</strong> $1.0 million,<br />
28%, from the prior year. The increase results from shifting personnel formerly directly allocated in the<br />
enterprise funds to the general fund and allowing the indirect cost plan to allocate these administrative<br />
expenditures.<br />
The largest external service component is the community and recreation services fee revenue at $4.5 million.<br />
This represents the revenue collected from fees charged to participate in the various recreation programs<br />
<strong>of</strong>fered by the city. Also included are the rental fees for the stadium and parks and event sponsorships.<br />
The next notable category is the building/engineering fees (i.e., community development fees) as the<br />
economy continues its slow recovery. This is the combination <strong>of</strong> community development fees and public<br />
works fees. These sources include building activity related to single-family residential permits and<br />
commercial, <strong>of</strong>fice, institutional, and industrial square feet. For <strong>FY2014</strong>, community development fees are<br />
expected to be $2.7 million, which represents a 10% increase over the prior year estimate.<br />
The next notable category is the court revenue. All fees charged by the court in the city <strong>of</strong> <strong>Surprise</strong> recorded<br />
in this category will remain flat for <strong>FY2014</strong> at $1.3 million.<br />
Property Taxes<br />
The property tax category captures the taxes levied on properties in the city <strong>of</strong> <strong>Surprise</strong> and is set at $6.4<br />
million for <strong>FY2014</strong>. State law allows the city to increase property tax revenues annually by 2% over the prior<br />
year’s maximum allowable amount. The tax revenue is computed by multiplying the tax levy rate by the<br />
assessed value. The <strong>City</strong> Manager’s recommended budget does not include the 2% increase over the prior<br />
year’s allowable amount for current taxpayers. The <strong>FY2014</strong> property tax revenues only include allowable<br />
increases for new construction.<br />
Franchise Fees<br />
The last major category <strong>of</strong> operating revenues is franchise fees, which equals $5.2 million. This revenue<br />
source is related to the gross sales from franchised utility companies within the city <strong>of</strong> <strong>Surprise</strong>. This includes<br />
Arizona Public Service, Cox Communications, Southwest Gas, and American Water. Also included are in lieu<br />
franchise fees paid by city-operated utilities (i.e., water and wastewater). Business licenses and sanitation<br />
hauler’s licenses are also captured in this category.<br />
Forecast <strong>of</strong> Major Operating Revenue Accounts<br />
The following schedule presents a summary <strong>of</strong> the major revenue accounts with historical and forecasted<br />
revenues for the general fund and most other funds.<br />
16
General Fund<br />
Major Revenue Accounts<br />
FY2012<br />
Actual<br />
CITY OF SURPRISE OPERATING REVENUE FORECAST<br />
FY2013<br />
Adopted<br />
<strong>Budget</strong><br />
FY2013<br />
Estimate<br />
Estimate to<br />
Adopted<br />
$<br />
Estimate to<br />
Adopted<br />
%<br />
<strong>FY2014</strong><br />
Forecast<br />
Forecast to PY<br />
Estimate<br />
$<br />
Adopted to PY<br />
Estimate<br />
%<br />
Operating Funds<br />
Local Sales Tax<br />
Local Sales Tax 29,546,020 30,095,000 31,369,800 1,274,800 4% 32,051,500 681,700 2%<br />
Local Sales Tax-Construction 2,935,090 2,200,000 1,250,000 (950,000) -43% 1,250,000 0 0%<br />
Local Sales Tax-Bed Tax 110,429 101,500 107,000 5,500 5% 114,000 7,000 7%<br />
Subtotal Local Sales Tax 32,591,539 32,396,500 32,726,800 330,300 1% 33,415,500 688,700 2%<br />
State Shared Revenue<br />
State Shared Income Tax 9,918,521 12,003,000 12,003,000 0 0% 13,111,000 1,108,000 9%<br />
State Shared Sales Tax 9,220,163 9,826,800 9,671,700 (155,100) -2% 10,154,400 482,700 5%<br />
Vehicle License Tax 3,951,413 3,895,900 3,910,900 15,000 0% 3,917,200 6,300 0%<br />
LTAF II 344,813 330,000 0 (330,000) -100% 0 0 0%<br />
Subtotal State Shared Revenue 23,090,098 26,055,700 25,585,600 (470,100) -2% 27,182,600 1,597,000 6%<br />
Charges for Services / Other<br />
Indirect Cost Assessment 3,660,700 3,660,700 3,660,700 0 0% 4,682,900 1,022,200 28%<br />
Parks & Rec. Program Fees 4,732,333 3,817,500 4,452,800 635,300 17% 4,452,800 0 0%<br />
Court Revenue 1,275,954 1,290,400 1,256,200 (34,200) -3% 1,256,200 0 0%<br />
Fire Revenue 881,135 838,600 731,100 (107,500) -13% 754,100 23,000 3%<br />
Police Revenue 643,045 679,600 655,200 (24,400) -4% 655,200 0 0%<br />
Community Development Fees 1,575,231 944,700 1,985,800 1,041,100 110% 2,052,500 66,700 3%<br />
All Other Operating Revenue 736,536 753,200 495,200 (258,000) -34% 500,000 4,800 1%<br />
In Lieu Property Tax 0 479,900 518,800 38,900 8% 550,600 31,800 6%<br />
Interest Income (31,197) 25,100 0 (25,100) -100% 14,000 14,000 0%<br />
Public Works Fees 276,513 215,600 451,000 235,400 109% 633,100 182,100 40%<br />
Facilities Revenue 350,896 303,200 385,700 82,500 27% 397,300 11,600 3%<br />
Transit Fees 0 28,300 50,000 21,700 77% 0 (50,000) -100%<br />
Grant Revenue 0 0 0 0 0% 0 0 0%<br />
Subtotal Charges for Services / Other 14,101,147 13,036,800 14,642,500 1,605,700 12% 15,948,700 1,306,200 9%<br />
Property Tax<br />
Primary Property Tax 6,178,758 6,290,000 6,281,000 (9,000) 0% 6,407,100 126,100 2%<br />
Franchise Fees<br />
APS Franchise Fee 2,242,092 2,179,800 2,230,800 51,000 2% 2,186,500 (44,300) -2%<br />
Cable Franchise Fee 1,022,937 1,085,200 990,400 (94,800) -9% 990,400 0 0%<br />
Business Licenses 625,919 657,000 662,000 5,000 1% 680,000 18,000 3%<br />
Southwest Gas Franchise Fee 309,623 325,400 292,000 (33,400) -10% 292,000 0 0%<br />
Water Franchise Fee 347,050 357,600 465,200 107,600 30% 490,600 25,400 5%<br />
CoS Wastewater Franchise Fee 304,409 309,800 312,300 2,500 1% 314,300 2,000 1%<br />
CoS Water Franchise Fee 216,818 213,600 200,900 (12,700) -6% 200,400 (500) 0%<br />
Sanitation Hauler's Licenses 39,000 43,600 38,900 (4,700) -11% 40,000 1,100 3%<br />
CoS Sanitation Hauler's License 25,000 25,000 24,000 (1,000) -4% 24,000 0 0%<br />
Subtotal Franchise Fees 5,132,848 5,197,000 5,216,500 19,500 0% 5,218,200 1,700 0%<br />
Total - General Fund Revenue 81,094,400 82,976,000 84,452,400 1,476,400 2% 88,172,100 3,719,700 4%<br />
Other Operating Funds<br />
HURF 6,091,127 6,636,600 6,534,200 (102,400) -2% 6,629,100 94,900 1%<br />
LTAF II 0 0 345,000 345,000 0% 358,900 13,900 4%<br />
0%<br />
Enterprise Funds<br />
Wastewater Service Fee 15,196,544 15,354,000 15,613,000 259,000 2% 15,713,418 100,418 1%<br />
Water Service Fee 9,873,000 9,908,000 10,043,000 135,000 1% 10,020,504 (22,496) 0%<br />
Sanitation Service Fee 6,267,774 6,585,000 6,420,000 (165,000) -3% 6,482,000 62,000 1%<br />
Water Replenishment Service Fee 0 0 0 0 0% 0 0 0%<br />
Internal Service Funds<br />
Employee Healthcare Fund 8,227,342 9,033,700 8,421,900 (611,800) -7% 9,095,900 674,000 8%<br />
Risk Management Fund 1,558,410 1,609,500 1,601,000 (8,500) -1% 1,616,800 15,800 1%<br />
Capital Funds<br />
General Capital Fund 0 0 2,913,000 2,913,000 0% 1,950,000 (963,000) -33%<br />
Transportation Improvement 2,381,538 3,444,700 2,884,900 (559,800) -16% 2,228,300 (656,600) -23%<br />
Wastewater Development Fee 2,007,881 1,051,800 2,249,400 1,197,600 114% 2,365,700 116,300 5%<br />
Fire & EMS Development Fee 580,176 312,600 623,900 311,300 100% 579,100 (44,800) -7%<br />
Public Works Development Fee 314,957 37,300 247,300 210,000 563% 204,100 (43,200) -17%<br />
General Government Development Fee (245,393) 2,430,100 559,300 (1,870,800) -77% 537,400 (21,900) -4%<br />
Parks & Recreation Development Fee 530,867 220,700 376,600 155,900 71% 533,600 157,000 42%<br />
Water Development Fee 461,387 281,700 630,100 348,400 124% 1,277,700 647,600 103%<br />
Roads <strong>of</strong> Reg.Significance Dev Fee 23,746 11,600 27,400 15,800 136% 27,400 0 0%<br />
Replenishment Development Fee 264,828 156,600 319,900 163,300 104% 371,900 52,000 16%<br />
Police Development Fee 281,129 107,300 275,000 167,700 156% 236,300 (38,700) -14%<br />
Library Development Fee 141,187 56,900 116,900 60,000 105% 136,500 19,600 17%<br />
17
Local Sales Tax (excluding construction and bed tax)<br />
FY2013 <strong>FY2014</strong> $ %<br />
Estimate Forecast Inc/(Dec) Inc/(Dec)<br />
31,369,800 32,051,500 681,700 2%<br />
Description<br />
The local sales tax (non-construction sales tax) is the recurring sales tax revenue that is collected by the city on an annual basis through the<br />
course <strong>of</strong> doing business. The construction sales taxes have been separated out and addressed under local sales tax (construction sales<br />
tax). These revenues are recorded in the general fund.<br />
FY2013<br />
Actuals FY2008 FY2009 FY2010 FY 2011 FY2012 Adopted<br />
Revenue Collected<br />
Forecast Assumptions<br />
18,992,959 14,820,787 17,957,463 23,036,154 27,818,750 29,395,000<br />
A sales tax projection team comprised <strong>of</strong> the Chief Financial Officer, the sales tax audit division, and members <strong>of</strong> the budget staff was<br />
created to forecast and monitor the local sales tax. Forecasts are done individually within each <strong>of</strong> 12 different categories (industries) using<br />
industry specific information (e.g. big box retail, restaurant and bar, etc.). Sales taxes have declined from FY2007 through FY2010. However,<br />
this trend appears to have stopped with revenues increasing in FY2011 and projected increases through FY2018 as the economy improves.<br />
Forecast<br />
FY2013<br />
Estimate <strong>FY2014</strong> FY2015 FY2016 FY2017 FY2018<br />
Projected Revenue 31,369,800 32,051,500 31,974,900 33,399,500 36,145,600 39,320,900<br />
Millions<br />
$45.0<br />
$40.0<br />
$35.0<br />
$30.0<br />
$25.0<br />
$20.0<br />
$15.0<br />
$10.0<br />
$5.0<br />
$0.0<br />
FY2008 FY2009 FY2010 FY 2011 FY2012 FY2013<br />
Adopted<br />
FY2013<br />
Estimate<br />
FY2013 <strong>FY2014</strong> $ %<br />
Estimate Forecast Inc/(Dec) Inc/(Dec)<br />
4,163,000 3,200,000 (963,000) -23%<br />
<strong>FY2014</strong> FY2015 FY2016 FY2017 FY2018<br />
Local Construction Sales Tax (Construction Sales Tax)<br />
Description<br />
This represents the one-time construction sales tax revenue that is collected by the city <strong>of</strong> <strong>Surprise</strong> on an annual basis through the course <strong>of</strong><br />
doing business. The ongoing sales taxes have been separated out and addressed under local sales tax (non-construction sales tax). These<br />
revenues are recorded in the general fund.<br />
FY2013<br />
Actuals FY2008 FY2009 FY2010 FY 2011 FY2012 Adopted<br />
Revenue Collected 10,308,703 9,025,489 5,318,360 3,203,879 2,935,090 2,200,000<br />
Forecast Assumptions<br />
The construction sales tax forecast is based on estimates from the Community and Economic Development Department <strong>of</strong> the number <strong>of</strong><br />
single family residential permits completed and square feet <strong>of</strong> non-single family residential permits completed. Non-single family residential<br />
permits include multi-family, <strong>of</strong>fice/institution, and commercial/customer service. Year-to-date trends are used for the projected revenue per<br />
square foot starting in FY2010. Construction sales taxes have declined since FY2006 due to the recessionary economy and reduced<br />
construction activity.<br />
Forecast<br />
FY2013<br />
Estimate <strong>FY2014</strong> FY2015 FY2016 FY2017 FY2018<br />
Projected Revenue 4,163,000 3,200,000 4,665,300 7,299,900 9,290,800 10,257,600<br />
Millions<br />
$12.0<br />
$10.0<br />
$8.0<br />
$6.0<br />
$4.0<br />
$2.0<br />
$0.0<br />
18<br />
FY2008 FY2009 FY2010 FY 2011 FY2012 FY2013<br />
Adopted<br />
FY2013<br />
Estimate<br />
<strong>FY2014</strong> FY2015 FY2016 FY2017 FY2018
Description<br />
Local Bed Tax<br />
FY2013 <strong>FY2014</strong> $ %<br />
Estimate Forecast Inc/(Dec) Inc/(Dec)<br />
107,000 114,000 7,000 7%<br />
The city currently imposes a 2.52% transient lodging tax. Of the total tax, 1.52% is to be recorded in the Tourism Fund to be used for<br />
promoting tourism and 1.0% is to be recorded in the General Fund.<br />
Actuals FY2008 FY2009 FY2010 FY 2011 FY2012<br />
FY2013<br />
Adopted<br />
Revenue Collected<br />
Forecast Assumptions<br />
71,821 54,568 85,892 100,398 110,429 101,500<br />
During FY2010 the <strong>City</strong> Council approved an increase in the bed tax rate from 1.52% to 2.52%. Prior to 2010 the bed tax collected was not<br />
tracked seperately in the GL from the sales tax. The city expects the bed tax revenues to increase in accordance with an increase in transient<br />
lodging revenues.<br />
Forecast<br />
FY2013<br />
Estimate <strong>FY2014</strong> FY2015 FY2016 FY2017 FY2018<br />
Projected Revenue 107 107,000 000 114 114,000 000 118 118,200 200 123 123,200 200 133 133,000 000 144 144,300 300<br />
Millions<br />
$0.2<br />
$0.1<br />
$0.1<br />
$0.1<br />
$0.1<br />
$0.1<br />
$0.0<br />
$0.0<br />
$0.0<br />
FY2008 FY2009 FY2010 FY 2011 FY2012 FY2013<br />
Adopted<br />
FY2013<br />
Estimate<br />
State Shared Income Tax<br />
FY2013 <strong>FY2014</strong> $ %<br />
Estimate Forecast Inc/(Dec) Inc/(Dec)<br />
12,003,000 13,111,000 1,108,000 9%<br />
<strong>FY2014</strong> FY2015 FY2016 FY2017 FY2018<br />
Description<br />
State shared revenues are distributed to cities and towns based generally on the population at the last census or special census. Included in<br />
this category is the State Shared Income Tax. These revenues are recorded in the general fund.<br />
FY2013<br />
Actuals FY2008 FY2009 FY2010 FY 2011 FY2012 Adopted<br />
Revenue Collected 12,055,475 13,080,276 11,395,938 8,591,077 9,918,521 12,003,000<br />
Forecast Assumptions<br />
The FY2013 and <strong>FY2014</strong> forecasts are based on data from the League <strong>of</strong> Arizona Cities and Towns detailing actual income tax collection<br />
from FY2011 and FY2012 respectively. State shared income tax is distributed based on population. The 2010 census completed in FY2011,<br />
accounts for the increase in the city's share <strong>of</strong> state revenues. The 2010 census resulted in increased revenues beginning in FY2012 as the<br />
city share <strong>of</strong> total population increased.<br />
Forecast<br />
FY2013<br />
Estimate <strong>FY2014</strong> FY2015 FY2016 FY2017 FY2018<br />
Projected j Revenue 12,003,000 , , 13,111,000 , , 13,373,200 , , 13,640,700 , , 13,913,500 , , 14,191,800 , ,<br />
Millions<br />
$16.0<br />
$14.0<br />
$12.0<br />
$10.0<br />
$8.0<br />
$6.0<br />
$4.0<br />
$2.0<br />
$0.0<br />
FY2008 FY2009 FY2010 FY 2011 FY2012<br />
19<br />
FY2013<br />
Adopted<br />
FY2013<br />
Estimate<br />
<strong>FY2014</strong> FY2015 FY2016 FY2017 FY2018
State Shared Sales Tax<br />
FY2013 <strong>FY2014</strong> $ %<br />
Estimate Forecast Inc/(Dec) Inc/(Dec)<br />
9,671,700 10,154,400 482,700 5%<br />
Description<br />
State shared revenues are distributed to cities and towns based generally on the population at the last census or special census. Included in<br />
this category is the State Shared Sales Tax. These revenues are recorded in the general fund.<br />
FY2013<br />
Actuals FY2008 FY2009 FY2010 FY 2011 FY2012 Adopted<br />
Revenue Collected 8,141,197 7,022,643 6,464,521 7,158,275 9,220,163 9,826,800<br />
Forecast Assumptions<br />
The FY2013 and <strong>FY2014</strong> forecasts are based on year-over-year percent increase data from the League <strong>of</strong> Arizona Cities and Towns. The<br />
forecast for future years is based on population and revenue per capita. State shared sales tax is distributed based on population. The 2010<br />
census resulted in increased revenues beginning in FY2012 as the city share <strong>of</strong> total population increased.<br />
FY2013<br />
Forecast Estimate <strong>FY2014</strong> FY2015 FY2016 FY2017 FY2018<br />
Projected Revenue 9,671,700 10,154,400 10,357,400 10,564,600 10,775,900 10,991,400<br />
Millions<br />
$12.0<br />
$10.0<br />
$8.0<br />
$6.0<br />
$4.0<br />
$2.0<br />
$0.0<br />
FY2008 FY2009 FY2010 FY 2011 FY2012 FY2013<br />
Adopted<br />
FY2013<br />
Estimate<br />
Highway Users Revenue Fund (HURF)<br />
<strong>FY2014</strong> FY2015 FY2016 FY2017 FY2018<br />
FY2013 <strong>FY2014</strong> $ %<br />
Estimate Forecast Inc/(Dec) Inc/(Dec)<br />
6,534,200 6,629,100 94,900 1%<br />
Description<br />
State shared revenues are distributed to cities and towns based generally on the population at the last census or special census. Included in<br />
this category is the Highway Users Revenue Fund (HURF). This revenue source consists <strong>of</strong> state taxes collected on gasoline, vehicle<br />
licenses, and a number <strong>of</strong> other additional transportation related fees. These funds must be used for street and highway purposes. These<br />
revenues are recorded in the city's HURF.<br />
FY2013<br />
Actuals FY2008 FY2009 FY2010 FY 2011 FY2012 Adopted<br />
Revenue Collected 6,064,115 5,295,936 4,984,457 5,275,645 5,906,800 6,613,600<br />
Forecast Assumptions<br />
The FY2013 and <strong>FY2014</strong> forecasts are based on year-over-year percent increase data from the League <strong>of</strong> Arizona Cities and Towns. The<br />
forecast for future years is based on population and revenue per capita. HURF revenue is distributed based on population. The 2010 census<br />
resulted in increased revenues beginning in FY2012 as the city share <strong>of</strong> total population increased.<br />
Forecast<br />
FY2013<br />
Estimate <strong>FY2014</strong> FY2015 FY2016 FY2017 FY2018<br />
Projected Revenue 6,534,200 6,629,100 6,761,600 6,896,900 7,034,800 7,175,500<br />
Millions<br />
$8.0<br />
$7.0<br />
$6.0<br />
$5.0<br />
$4.0<br />
$3.0<br />
$2.0<br />
$1.0<br />
$0.0<br />
FY2008 FY2009 FY2010 FY 2011 FY2012 FY2013 20<br />
Adopted<br />
FY2013<br />
Estimate<br />
<strong>FY2014</strong> FY2015 FY2016 FY2017 FY2018
Vehicle License Tax<br />
FY2013 <strong>FY2014</strong> $ %<br />
Estimate Forecast Inc/(Dec) Inc/(Dec)<br />
3,910,900 3,917,200 6,300 0%<br />
Description<br />
In lieu <strong>of</strong> a personal property tax on automobiles, the state imposes an annual vehicle license tax (VLT). These are state shared revenues<br />
and are distributed to cities and towns based generally on the population at the last census or special census. These revenues are recorded<br />
in the general fund.<br />
FY2013<br />
Actuals FY2008 FY2009 FY2010 FY 2011 FY2012 Adopted<br />
Revenue Collected 3,545,692 3,207,654 2,960,716 2,930,709 3,951,413 3,895,900<br />
Forecast Assumptions<br />
The FY2013 and <strong>FY2014</strong> forecasts are based on year-over-year percent increase data from the League <strong>of</strong> Arizona Cities and Towns. The<br />
forecast for future years is based on population and revenue per capita. Vehicle license taxes are distributed based on population. The 2010<br />
census resulted in increased revenues beginning in FY2012 as the city share <strong>of</strong> total population increased. The decrease in FY2013 is<br />
attributable to the League's forecasted reduction in vehicle sales.<br />
Forecast<br />
FY2013<br />
Estimate <strong>FY2014</strong> FY2015 FY2016 FY2017 FY2018<br />
PProjected j t d Revenue R 33,910,900 910 900 33,917,200 917 200 33,995,500 995 500 44,075,500 075 500 44,157,000 157 000 44,240,100 240 100<br />
Millions<br />
$4.5<br />
$4.0<br />
$3.5<br />
$3.0<br />
$2.5<br />
$2.0<br />
$1.5<br />
$1.0<br />
$0.5<br />
$0.0<br />
FY2008 FY2009 FY2010 FY 2011 FY2012 FY2013<br />
Adopted<br />
FY2013<br />
Estimate<br />
Local Transportation Assistance Fund (LTAF)<br />
<strong>FY2014</strong> FY2015 FY2016 FY2017 FY2018<br />
FY2013 <strong>FY2014</strong> $ %<br />
Estimate Forecast Inc/(Dec) Inc/(Dec)<br />
345,000 358,900 13,900 4%<br />
Description<br />
The source <strong>of</strong> this funding is the Arizona State Lottery and is received from disbursements from the local transportation assistance fund<br />
(LTAF). These revenues are recorded in the transit fund, which was established to track all revenues and expenditures associated with<br />
providing transit services within the city <strong>of</strong> <strong>Surprise</strong>.<br />
Actuals FY2008 FY2009 FY2010 FY 2011 FY2012<br />
FY2013<br />
Adopted<br />
Revenue Collected<br />
Forecast Assumptions<br />
612,270 443,564 262,631 87,905 344,813 330,000<br />
In February 2010, the distribution <strong>of</strong> these funds to the cities was discontinued by the state legislature. This was reversed by the U.S. District<br />
Court in <strong>of</strong> 2011, and the city received a distribution in March 2011 for lottery earnings collected from July 2009 to February 2010. The<br />
distribution <strong>of</strong> these funds has been confirmed for FY2012 and FY013 however, it is uncertain if they will be received after FY 2013.<br />
Forecast<br />
FY2013<br />
Estimate <strong>FY2014</strong> FY2015 FY2016 FY2017 FY2018<br />
Projected Revenue 345 345,000 000 358 358,900 900 364 364,700 700 372 372,900 900 394 394,500 500 419 419,600 600<br />
Millions<br />
$0.7<br />
$0.6<br />
$0.5<br />
$0.4<br />
$0.3<br />
$0.2<br />
$0.1<br />
$0.0<br />
FY2008 FY2009 FY2010 FY 2011 FY2012 FY2013 21<br />
Adopted<br />
FY2013<br />
Estimate<br />
<strong>FY2014</strong> FY2015 FY2016 FY2017 FY2018
Indirect Cost Assessment<br />
FY2013 <strong>FY2014</strong> $ %<br />
Estimate Forecast Inc/(Dec) Inc/(Dec)<br />
3,660,700 4,682,900 1,022,200 28%<br />
Description<br />
Indirect expenses incurred by the general fund on behalf <strong>of</strong> the enterprise funds (water, waste water, and sanitation) are recovered through<br />
the indirect cost assessment and are recorded as a revenue in the general fund.<br />
FY2013<br />
Actuals FY2008 FY2009 FY2010 FY 2011 FY2012 Adopted<br />
Revenue Collected 3,264,900 3,511,100 4,449,225 3,660,700 3,660,700 3,660,700<br />
Forecast Assumptions<br />
Indirect cost assessments are calculated through the annual update to the Full Cost Central Services Cost Allocation Plan and are based on<br />
the last completed fiscal year. A greater portion <strong>of</strong> the general fund costs were allocated to the general fund during the FY2010 update than<br />
in the prior years, leading to the decrease in revenue from the enterprise funds. The study used for the FY2011and FY2012 indirect<br />
allocation, featured an improved allocation basis that more accurately reflected the amount <strong>of</strong> general fund support <strong>of</strong> the enterprise funds.<br />
FY2013 was budgeted at the FY2012 amount pending completion <strong>of</strong> an updated cost allocation plan.<br />
Forecast<br />
FY2013<br />
Estimate <strong>FY2014</strong> FY2015 FY2016 FY2017 FY2018<br />
Projected Revenue 33,660,700 660 700 44,682,900 682 900 44,776,500 776 500 44,872,100 872 100 44,969,600 969 600 55,068,900 068 900<br />
Millions<br />
$6.0<br />
$5.0<br />
$4.0<br />
$3.0<br />
$2.0<br />
$1.0<br />
$0.0<br />
FY2008 FY2009 FY2010 FY 2011 FY2012 FY2013<br />
Adopted<br />
FY2013<br />
Estimate<br />
Parks and Recreation Program Fees<br />
FY2013 <strong>FY2014</strong> $ %<br />
Estimate Forecast Inc/(Dec) Inc/(Dec)<br />
4,452,800 4,452,800 0 0%<br />
<strong>FY2014</strong> FY2015 FY2016 FY2017 FY2018<br />
Description<br />
This source reflects revenue collected from fees charged by the Community and Recreation Services Department to participate in the various<br />
recreational programs <strong>of</strong>fered by the city. These revenues are recorded in the general fund.<br />
FY2013<br />
Actuals FY2008 FY2009 FY2010 FY 2011 FY2012 Adopted<br />
Revenue Collected<br />
Forecast Assumptions<br />
2,898,803 3,538,989 3,892,092 4,389,606 4,732,333 3,817,500<br />
Forecasts are based on the Community and Recreation Services Department estimates <strong>of</strong> revenue per participant for recreation programs,<br />
aquatics programs, and special events. Special events and recreation participants reflect only revenue generating programs and events.<br />
FY2013<br />
Forecast Estimate <strong>FY2014</strong> FY2015 FY2016 FY2017 FY2018<br />
Projected Revenue<br />
$6 $6.0 0<br />
4,452,800 4,452,800 4,541,900 4,632,700 4,725,300 4,819,900<br />
Millions<br />
$5.0<br />
$4.0<br />
$3.0<br />
$2.0<br />
$1.0<br />
$0.0<br />
FY2008 FY2009 FY2010 FY 2011 FY2012 FY2013<br />
Adopted 22<br />
FY2013<br />
Estimate<br />
<strong>FY2014</strong> FY2015 FY2016 FY2017 FY2018
Court Revenue<br />
FY2013 <strong>FY2014</strong> $ %<br />
Estimate Forecast Inc/(Dec) Inc/(Dec)<br />
1,256,200 1,256,200 0 0%<br />
Description<br />
This revenue is generated by all court imposed fines collected by the <strong>City</strong> Court. These revenues are recorded in the general fund.<br />
FY2013<br />
Actuals FY2008 FY2009 FY2010 FY 2011 FY2012 Adopted<br />
Revenue Collected<br />
Forecast Assumptions<br />
1,281,739 1,757,682 1,759,817 1,266,929 1,275,954 1,290,400<br />
The forecast is based on revenue per court case where the number <strong>of</strong> court cases is relative to population growth. Population is expected to<br />
increase by approximately a half percent in FY2013 and <strong>FY2014</strong>. For FY2015 and after the population increase has been estimated at 3%.<br />
Forecast<br />
FY2013<br />
Estimate <strong>FY2014</strong> FY2015 FY2016 FY2017 FY2018<br />
Projected Revenue<br />
$2 $2.0 0<br />
1,256,200 1,256,200 1,381,500 1,440,800 1,555,000 1,687,000<br />
Millions<br />
$1.8<br />
$1.6<br />
$1.4<br />
$1.2<br />
$1.0<br />
$0.8<br />
$0.6<br />
$0.4<br />
$0.2<br />
$0.0<br />
FY2008 FY2009 FY2010 FY 2011 FY2012 FY2013<br />
Adopted<br />
FY2013<br />
Estimate<br />
Fire Revenue<br />
FY2013 <strong>FY2014</strong> $ %<br />
Estimate Forecast Inc/(Dec) Inc/(Dec)<br />
731,100 754,100 23,000 3%<br />
<strong>FY2014</strong> FY2015 FY2016 FY2017 FY2018<br />
Description<br />
This revenue source reflects revenue related to Fire Department activities. Sources include fire insurance premium tax, wild land fire<br />
intergovernmental revenue, and Helicopter Air-Medical and Logistics Operations (HALO) intergovernmental revenue. These revenues are<br />
recorded in the general fund.<br />
FY2013<br />
Actuals FY2008 FY2009 FY2010 FY 2011 FY2012 Adopted<br />
Revenue Collected 521,466 515,291 824,702 682,868 881,135 838,600<br />
Forecast Assumptions<br />
The fire revenue forecast is based on projections <strong>of</strong> individual revenue sources based on year-to-date trends and known contracts. The<br />
revenue increases in FY2010 include the fire insurance premium tax which was previously netted against retirement expenditures. The<br />
FY2011 revenues decreased as a result <strong>of</strong> lower than expected advanced life support paramedic and fire suppression revenues.<br />
Forecast<br />
FY2013<br />
Estimate <strong>FY2014</strong> FY2015 FY2016 FY2017 FY2018<br />
Projected Revenue 731,100 754,100 781,700 781,700 815,200 879,900 954,600 954,600<br />
Millions<br />
$1.2<br />
$1.0<br />
$0.8<br />
$0.6<br />
$0.4<br />
$0.2<br />
$0.0<br />
FY2008 FY2009 FY2010 FY 2011 FY2012 FY2013 23<br />
Adopted<br />
FY2013<br />
Estimate<br />
<strong>FY2014</strong> FY2015 FY2016 FY2017 FY2018
Police Revenue<br />
FY2013 <strong>FY2014</strong> $ %<br />
Estimate Forecast Inc/(Dec) Inc/(Dec)<br />
655,200 655,200 0 0%<br />
Description<br />
This revenue source reflects the revenue collected by the Police Department, including <strong>of</strong>f-duty fees, finger printing, reimbursement for<br />
intergovernmental assignments, and El Mirage dispatch fees. These revenues are recorded in the general fund.<br />
FY2013<br />
Actuals FY2008 FY2009 FY2010 FY 2011 FY2012 Adopted<br />
Revenue Collected 669,051 818,244 560,104 638,061 643,045 679,600<br />
Forecast Assumptions<br />
The police revenue forecast is based on projections <strong>of</strong> individual revenue sources based on year-to-date trends and known contracts. In<br />
FY2008, the city <strong>of</strong> <strong>Surprise</strong> entered in to an intergovernmental agreement with the city <strong>of</strong> El Mirage and agreed to provide emergency<br />
dispatch to the city for a fee. The fee revenue is recorded in this category.<br />
Forecast<br />
FY2013<br />
Estimate <strong>FY2014</strong> FY2015 FY2016 FY2017 FY2018<br />
Projected Revenue 655,200 655,200 679,200 708,300 764,400 829,400<br />
Millions<br />
$0.9<br />
$0.8<br />
$0.7<br />
$0.6<br />
$0.5<br />
$0.4<br />
$0.3<br />
$0.2<br />
$0.1<br />
$0.0<br />
FY2008 FY2009 FY2010 FY 2011 FY2012 FY2013<br />
Adopted<br />
FY2013<br />
Estimate<br />
Community Development Revenue<br />
<strong>FY2014</strong> FY2015 FY2016 FY2017 FY2018<br />
FY2013 <strong>FY2014</strong> $ %<br />
Estimate Forecast Inc/(Dec) Inc/(Dec)<br />
1,985,800 2,052,500 66,700 3%<br />
Description<br />
This source reflects fees collected by the city <strong>of</strong> <strong>Surprise</strong> including building inspection fees, permit fees, plan review fees, and fire fees<br />
related to new construction activities. These revenues are recorded in the general fund.<br />
FY2013<br />
Actuals FY2008 FY2009 FY2010 FY 2011 FY2012 Adopted<br />
Revenue Collected<br />
Forecast Assumptions<br />
3,617,438 1,481,772 873,132 1,369,212 1,575,231 944,700<br />
The revenue forecast is based on estimates from the Community and Economic Development Department <strong>of</strong> the number <strong>of</strong> single family<br />
residential permits issued and the square feet <strong>of</strong> non-single family residential permits issued. Non-single family residential permits include<br />
multi-family, <strong>of</strong>fice/institution, and commercial/customer service. Revenue is forecast by revenue per square foot based on year-to-date<br />
trends. This source has been decreasing due to reduced construction activity from the recession.<br />
FY2013<br />
Forecast Estimate <strong>FY2014</strong> FY2015 FY2016 FY2017 FY2018<br />
Projected Revenue<br />
$8.0<br />
1,985,800 2,052,500 3,052,100 4,871,200 6,323,700 7,121,400<br />
Millions<br />
$7.0<br />
$6.0<br />
$5.0<br />
$4.0<br />
$3.0<br />
$2.0<br />
$1.0<br />
$0.0<br />
FY2008 FY2009 FY2010 FY 2011 FY2012 FY2013 24<br />
Adopted<br />
FY2013<br />
Estimate<br />
<strong>FY2014</strong> FY2015 FY2016 FY2017 FY2018
All Other Operating Revenue<br />
FY2013 <strong>FY2014</strong> $ %<br />
Estimate Forecast Inc/(Dec) Inc/(Dec)<br />
495,200 500,000 4,800 1%<br />
Description<br />
This source includes all other operating revenue collected by the city <strong>of</strong> <strong>Surprise</strong> for various programs and services provided on a day to day<br />
basis. These revenues are recorded in the general fund and the highway users revenue fund.<br />
FY2013<br />
Actuals FY2008 FY2009 FY2010 FY 2011 FY2012 Adopted<br />
Revenue Collected<br />
Forecast Assumptions<br />
1,380,261 1,095,839 12,515,168 916,762 736,536 753,200<br />
This forecast is based on estimates <strong>of</strong> individual revenue sources within this category based on year-to-date trends and known contracts.<br />
Forecasts in the out-years are based on population and revenue per capita where population is expected to increase by approximately 2%<br />
per year thereafter. A number <strong>of</strong> revenue sources that had been recorded in this category in past fiscal years have been eliminated or moved<br />
to other categories.<br />
FY2013<br />
Forecast Estimate <strong>FY2014</strong> FY2015 FY2016 FY2017 FY2018<br />
Projected j Revenue 495,200 , 500,000 , 518,300 , 540,500 , 583,400 , 632,900 ,<br />
Millions<br />
$14.0<br />
$12.0<br />
$10.0<br />
$8.0<br />
$6.0<br />
$4.0<br />
$2.0<br />
$0.0<br />
FY2008 FY2009 FY2010 FY 2011 FY2012 FY2013<br />
Adopted<br />
FY2013<br />
Estimate<br />
In Lieu Property Tax<br />
FY2013 <strong>FY2014</strong> $ %<br />
Estimate Forecast Inc/(Dec) Inc/(Dec)<br />
518,800 550,600 31,800 6%<br />
<strong>FY2014</strong> FY2015 FY2016 FY2017 FY2018<br />
Description<br />
This source reflects a transfer from the enterprise funds (water, wastewater, and sanitation) to the general fund as a payment in lieu <strong>of</strong><br />
property taxes (PILOT) which was initiated in FY2011.<br />
FY2013<br />
Actuals FY2008 FY2009 FY2010 FY 2011 FY2012 Adopted<br />
Revenue Collected<br />
Forecast Assumptions<br />
0 0 0 379,077 421,917 479,900<br />
This source is forecast based on the valuation <strong>of</strong> water, wastewater, and sanitation property.<br />
FY2013<br />
Forecast Estimate <strong>FY2014</strong> FY2015 FY2016 FY2017 FY2018<br />
Projected Revenue<br />
$0.7<br />
518,800 550,600 558,200 576,200 582,300 579,300<br />
Millions<br />
$0.6<br />
$0.5<br />
$0.4<br />
$0.3<br />
$0.2<br />
$0.1<br />
$0.0<br />
FY2008 FY2009 FY2010 FY 2011 FY2012 FY2013<br />
Adopted<br />
25<br />
FY2013<br />
Estimate<br />
<strong>FY2014</strong> FY2015 FY2016 FY2017 FY2018
Interest Income<br />
FY2013 <strong>FY2014</strong> $ %<br />
Estimate Forecast Inc/(Dec) Inc/(Dec)<br />
0 14,000 14,000 0%<br />
Description<br />
This source includes all interest income earned by the city <strong>of</strong> <strong>Surprise</strong> in the operating funds. These revenues are recorded in the general<br />
fund, the highway users revenue fund, and the transit fund.<br />
FY2013<br />
Actuals FY2008 FY2009 FY2010 FY 2011 FY2012 Adopted<br />
Revenue Collected<br />
Forecast Assumptions<br />
2,486,333 296,400 183,766 128,503 (31,197) 25,100<br />
The activity reflects the recessionary economy with historically low interest rates. Investments are managed by a pr<strong>of</strong>essional management<br />
firm.<br />
FY2013<br />
Forecast Estimate <strong>FY2014</strong> FY2015 FY2016 FY2017 FY2018<br />
Projected Revenue 0 14,000 31,000 33,400 36,300 39,200<br />
Millions<br />
$4 $4.0 0<br />
$3.5<br />
$3.0<br />
$2.5<br />
$2.0<br />
$1.5<br />
$1.0<br />
$0.5<br />
$0.0<br />
($0.5)<br />
FY2008 FY2009 FY2010 FY 2011 FY2012 FY2013<br />
Adopted<br />
FY2013<br />
Estimate<br />
Public Works Revenue<br />
<strong>FY2014</strong> FY2015 FY2016 FY2017 FY2018<br />
FY2013 <strong>FY2014</strong> $ %<br />
Estimate Forecast Inc/(Dec) Inc/(Dec)<br />
451,000 633,100 182,100 40%<br />
Description<br />
This source reflects revenue collected for engineering and permit fees related to residential and commercial construction activities. These<br />
revenues are recorded in the general fund.<br />
FY2013<br />
Actuals FY2008 FY2009 FY2010 FY 2011 FY2012 Adopted<br />
Revenue Collected<br />
Forecast Assumptions<br />
2,547,753 729,800 185,638 290,885 276,513 215,600<br />
The revenue forecast is based on estimates from the Community and Economic Development Department <strong>of</strong> the number <strong>of</strong> single family<br />
residential permits issued and the square feet <strong>of</strong> non-single family residential permits issued. Non-single family residential permits include<br />
multi-family, <strong>of</strong>fice/institution, and commercial/customer service. Revenue is forecast by revenue per square foot based on year-to-date<br />
trends. This source has been decreasing due to reduced construction activity caused by the recent recession.<br />
Forecast<br />
FY2013<br />
Estimate <strong>FY2014</strong> FY2015 FY2016 FY2017 FY2018<br />
PProjected j d RRevenue 4451,000 1 000 633 633,100 100 941 941,500 00 11,502,600 02 600 19 1,950,700 0700 22,196,800 196 800<br />
Millions<br />
$3.0<br />
$2.5<br />
$2.0<br />
$1.5<br />
$1.0<br />
$0.5<br />
$0.0<br />
FY2008 FY2009 FY2010 FY 2011 FY2012 FY2013 26<br />
Adopted<br />
FY2013<br />
Estimate<br />
<strong>FY2014</strong> FY2015 FY2016 FY2017 FY2018
Facilities Fees<br />
FY2013 <strong>FY2014</strong> $ %<br />
Estimate Forecast Inc/(Dec) Inc/(Dec)<br />
385,700 397,300 11,600 3%<br />
Description<br />
This source includes rent revenue collected by the city <strong>of</strong> <strong>Surprise</strong> for the use <strong>of</strong> city owned facilities. These revenues are recorded in the<br />
general fund.<br />
FY2013<br />
Actuals FY2008 FY2009 FY2010 FY 2011 FY2012 Adopted<br />
Revenue Collected<br />
Forecast Assumptions<br />
68,080 68,880 212,339 383,334 350,896 303,200<br />
This forecast is based on estimates <strong>of</strong> individual revenue sources within this category based on year-to-date trends and known contracts.<br />
Forecasts in the out-years are based on population and revenue per capita where population is expected to increase by approximately 2%<br />
per year. The FY2011 increase in revenues is attributable to the increased tenant occupancy at the city's former city hall, the AZ<br />
Techcelerator.<br />
FY2013<br />
Forecast Estimate <strong>FY2014</strong> FY2015 FY2016 FY2017 FY2018<br />
Projected j Revenue 385,700 397,300 411,800 429,500 463,500 502,900<br />
Millions<br />
$0.6<br />
$0.5<br />
$0.4<br />
$0.3<br />
$0.2<br />
$0.1<br />
$0.0<br />
FY2008 FY2009 FY2010 FY 2011 FY2012 FY2013<br />
Adopted<br />
Transit Fees<br />
FY2013<br />
Estimate<br />
<strong>FY2014</strong> FY2015 FY2016 FY2017 FY2018<br />
FY2013 <strong>FY2014</strong> $ %<br />
Estimate Forecast Inc/(Dec) Inc/(Dec)<br />
50,000 0 (50,000) -100%<br />
Description<br />
This source includes Dial-a-Ride Transportation (DART) fees. These revenues are recorded in the general fund.<br />
Actuals FY2008 FY2009 FY2010 FY 2011 FY2012<br />
FY2013<br />
Adopted<br />
Revenue Collected<br />
Forecast Assumptions<br />
20,334 19,543 22,672 26,073 0 28,300<br />
DART fees are forecast based on year-to-date trends <strong>of</strong> monthly revenue. For <strong>FY2014</strong>, the DART program was outsourced.<br />
Forecast<br />
FY2013<br />
Estimate <strong>FY2014</strong> FY2015 FY2016 FY2017 FY2018<br />
Projected Revenue<br />
$0.1<br />
50,000 0 0 0 0 0<br />
Millions<br />
$0.1<br />
$0.0<br />
$0.0<br />
$0.0<br />
$0.0<br />
$0.0<br />
FY2008 FY2009 FY2010 FY 2011 FY2012 FY2013<br />
Adopted 27<br />
FY2013<br />
Estimate<br />
<strong>FY2014</strong> FY2015 FY2016 FY2017 FY2018
Primary Property Tax<br />
FY2013 <strong>FY2014</strong> $ %<br />
Estimate Forecast Inc/(Dec) Inc/(Dec)<br />
6,281,000 6,407,100 126,100 2%<br />
Description<br />
This source reflects the primary property tax levied for general government operations. State statute restricts the total levy to a maximum 2%<br />
annual increase plus an increase for any new construction and/or annexation. These revenues are recorded in the general fund. The <strong>FY2014</strong><br />
levy rate is $1.000 per $100 <strong>of</strong> assessed valuation.<br />
FY2013<br />
Actuals FY2008 FY2009 FY2010 FY 2011 FY2012 Adopted<br />
Revenue Collected 5,759,123 6,349,918 6,749,926 7,023,619 6,178,758 6,290,000<br />
Forecast Assumptions<br />
The FY2013 amount is based on calculations from data from the Maricopa County Assessor's Office. Revenue increases for <strong>FY2014</strong> are the<br />
result <strong>of</strong> new construction. Forecasts in the future years is based on inflation.<br />
FY2013<br />
Forecast Estimate <strong>FY2014</strong> FY2015 FY2016 FY2017 FY2018<br />
Projected Revenue 6,281,000 6,407,100 6,535,300 6,666,000 6,799,300 6,935,300<br />
Millions<br />
$8.0<br />
$7.0<br />
$6.0<br />
$5.0<br />
$4.0<br />
$3.0<br />
$2.0<br />
$1.0<br />
$0.0<br />
FY2008 FY2009 FY2010 FY 2011 FY2012 FY2013<br />
Adopted<br />
FY2013<br />
Estimate<br />
Arizona Public Service (APS) Franchise Fee<br />
FY2013 <strong>FY2014</strong> $ %<br />
Estimate Forecast Inc/(Dec) Inc/(Dec)<br />
2,230,800 2,186,500 (44,300) -2%<br />
<strong>FY2014</strong> FY2015 FY2016 FY2017 FY2018<br />
Description<br />
The fee is 2% <strong>of</strong> revenue earned by the Arizona Public Service (APS) electric utility company operating within the city <strong>of</strong> <strong>Surprise</strong>. These<br />
revenues are recorded in the general fund.<br />
Actuals FY2008 FY2009 FY2010 FY 2011 FY2012<br />
FY2013<br />
Adopted<br />
Revenue Collected<br />
Forecast Assumptions<br />
1,962,616 2,029,779 2,071,407 2,108,514 2,242,092 2,179,800<br />
Forecast revenues are based on demand and rate increases.<br />
Forecast<br />
FY2013<br />
Estimate <strong>FY2014</strong> FY2015 FY2016 FY2017 FY2018<br />
Projected Revenue<br />
$3 $3.0 0<br />
2,230,800 2,186,500 2,266,500 2,363,700 2,551,000 2,767,600<br />
Millions<br />
$2.5<br />
$2.0<br />
$1.5<br />
$1.0<br />
$0.5<br />
$0.0<br />
FY2008 FY2009 FY2010 FY 2011 FY2012 FY2013<br />
Adopted<br />
28<br />
FY2013<br />
Estimate<br />
<strong>FY2014</strong> FY2015 FY2016 FY2017 FY2018
Cox Communications Cable Franchise Fees<br />
FY2013 <strong>FY2014</strong> $ %<br />
Estimate Forecast Inc/(Dec) Inc/(Dec)<br />
990,400 990,400 0 0%<br />
Description<br />
The fee is 5% <strong>of</strong> revenue earned by the Cox Communications cable utility company operating within the city <strong>of</strong> <strong>Surprise</strong>. These revenues are<br />
recorded in the general fund.<br />
FY2013<br />
Actuals FY2008 FY2009 FY2010 FY 2011 FY2012 Adopted<br />
Revenue Collected 927,547 1,042,123 1,022,863 1,071,176 1,022,937 1,085,200<br />
Forecast Assumptions<br />
Forecast revenues are based on demand and rate increases.<br />
Forecast<br />
FY2013<br />
Estimate <strong>FY2014</strong> FY2015 FY2016 FY2017 FY2018<br />
Projected Revenue<br />
$1.6<br />
990,400 990,400 1,107,800 1,155,300 1,246,900 1,352,800<br />
Millions<br />
$1.4<br />
$1.2<br />
$1.0<br />
$0.8<br />
$0.6<br />
$0.4<br />
$0.2<br />
$0.0<br />
FY2008 FY2009 FY2010 FY 2011 FY2012 FY2013<br />
Adopted<br />
FY2013<br />
Estimate<br />
Business License Revenue<br />
<strong>FY2014</strong> FY2015 FY2016 FY2017 FY2018<br />
FY2013 <strong>FY2014</strong> $ %<br />
Estimate Forecast Inc/(Dec) Inc/(Dec)<br />
662,000 680,000 18,000 3%<br />
Description<br />
This source reflects the revenue received for licenses permitting businesses to operate within the city <strong>of</strong> <strong>Surprise</strong>. These revenues are<br />
recorded in the general fund.<br />
FY2013<br />
Actuals FY2008 FY2009 FY2010 FY 2011 FY2012 Adopted<br />
Revenue Collected<br />
Forecast Assumptions<br />
388,847 412,276 575,825 625,705 625,919 657,000<br />
The forecasted revenue increases are based on estimated increases in the number <strong>of</strong> business licenses issued.<br />
FY2013<br />
Forecast Estimate <strong>FY2014</strong> FY2015 FY2016 FY2017 FY2018<br />
Projected Revenue<br />
$0.9<br />
662,000 680,000 707,500 736,100 765,800 796,700<br />
Millions<br />
$0.8<br />
$0.7<br />
$0.6<br />
$0.5<br />
$0.4<br />
$0.3<br />
$0.2<br />
$0.1<br />
$0.0<br />
FY2008 FY2009 FY2010 FY 2011 FY2012 FY2013<br />
Adopted<br />
29<br />
FY2013<br />
Estimate<br />
<strong>FY2014</strong> FY2015 FY2016 FY2017 FY2018
Southwest Gas Franchise Fee<br />
FY2013 <strong>FY2014</strong> $ %<br />
Estimate Forecast Inc/(Dec) Inc/(Dec)<br />
292,000 292,000 0 0%<br />
Description<br />
The fee is 2% <strong>of</strong> revenue earned by the Southwest Gas utility company operating within the city <strong>of</strong> <strong>Surprise</strong>. These revenues are recorded in<br />
the general fund.<br />
FY2013<br />
Actuals FY2008 FY2009 FY2010 FY 2011 FY2012 Adopted<br />
Revenue Collected<br />
Forecast Assumptions<br />
354,442 314,091 326,264 308,232 309,623 325,400<br />
Forecast revenues are based on demand and rate increases.<br />
FY2013<br />
Forecast Estimate <strong>FY2014</strong> FY2015 FY2016 FY2017 FY2018<br />
Projected Revenue<br />
$0.5<br />
292,000 292,000 351,500 366,600 395,700 429,300<br />
Millions<br />
$0.4<br />
$0.3<br />
$0.2<br />
$0.1<br />
$0.0<br />
FY2008 FY2009 FY2010 FY 2011 FY2012 FY2013<br />
Adopted<br />
FY2013<br />
Estimate<br />
American Water Franchise Fee<br />
<strong>FY2014</strong> FY2015 FY2016 FY2017 FY2018<br />
FY2013 <strong>FY2014</strong> $ %<br />
Estimate Forecast Inc/(Dec) Inc/(Dec)<br />
465,200 490,600 25,400 5%<br />
Description<br />
The fee is 2% <strong>of</strong> revenue earned by the American Water utility company operating within the city <strong>of</strong> <strong>Surprise</strong>. About two-thirds <strong>of</strong> all water<br />
customers are served by American Water. These revenues are recorded in the general fund.<br />
Actuals FY2008 FY2009 FY2010 FY 2011 FY2012<br />
FY2013<br />
Adopted<br />
Revenue Collected<br />
Forecast Assumptions<br />
274,326 275,502 313,538 334,987 347,050 357,600<br />
Forecast revenues are based on demand and rate increases.<br />
FY2013<br />
Forecast Estimate <strong>FY2014</strong> FY2015 FY2016 FY2017 FY2018<br />
Projected Revenue<br />
$0.6<br />
465,200 490,600 500,412 510,420 520,629 531,041<br />
Millions<br />
$0.5<br />
$0.5<br />
$0.4<br />
$0.3<br />
$0.2<br />
$0.2<br />
$0.1<br />
$0.0<br />
FY2008 FY2009 FY2010 FY 2011 FY2012 FY2013<br />
Adopted<br />
30<br />
FY2013<br />
Estimate<br />
<strong>FY2014</strong> FY2015 FY2016 FY2017 FY2018
<strong>City</strong> <strong>of</strong> <strong>Surprise</strong> Wastewater Franchise Fee<br />
FY2013 <strong>FY2014</strong> $ %<br />
Estimate Forecast Inc/(Dec) Inc/(Dec)<br />
312,300 314,300 2,000 1%<br />
Description<br />
The fee is 2% <strong>of</strong> revenue earned by the wastewater utility operated by the city <strong>of</strong> <strong>Surprise</strong> and is paid in lieu <strong>of</strong> a franchise fee charged to a<br />
franchised utility operating in the city. This fee was initiated in FY2010. This source is transferred from the waste water operations fund to the<br />
general fund.<br />
FY2013<br />
Actuals FY2008 FY2009 FY2010 FY 2011 FY2012 Adopted<br />
Revenue Collected<br />
Forecast Assumptions<br />
Forecast revenues are based on demand and rate increases.<br />
FY2013<br />
0 0 0 314,216 304,409 309,800<br />
Forecast Estimate <strong>FY2014</strong> FY2015 FY2016 FY2017 FY2018<br />
Projected Revenue 312,300 314,300 317,800 323,400 330,900 339,200<br />
Millions<br />
$0.5<br />
$0.4<br />
$0.3<br />
$0.2<br />
$0.2<br />
$0.1<br />
$0.0<br />
FY2008 FY2009 FY2010 FY 2011 FY2012 FY2013<br />
Adopted<br />
FY2013<br />
Estimate<br />
<strong>City</strong> <strong>of</strong> <strong>Surprise</strong> Water Franchise Fee<br />
FY2013 <strong>FY2014</strong> $ %<br />
Estimate Forecast Inc/(Dec) Inc/(Dec)<br />
200,900 200,400 (500) 0%<br />
<strong>FY2014</strong> FY2015 FY2016 FY2017 FY2018<br />
Description<br />
The fee is 2% <strong>of</strong> revenue earned by the water utility operated by the city <strong>of</strong> <strong>Surprise</strong> and is paid in lieu <strong>of</strong> a franchise fee charged to a<br />
franchised utility operating in the city. This fee was initiated in FY2010. About one-third <strong>of</strong> all water customers are served by the city <strong>of</strong><br />
<strong>Surprise</strong>. This source is transferred from the water operations fund to the general fund.<br />
Actuals FY2008 FY2009 FY2010 FY 2011 FY2012<br />
FY2013<br />
Adopted<br />
Revenue Collected<br />
Forecast Assumptions<br />
Forecast revenues are based on demand and rate increases.<br />
FY2013<br />
0 0 0 228,525 216,818 213,600<br />
Forecast Estimate <strong>FY2014</strong> FY2015 FY2016 FY2017 FY2018<br />
Projected Revenue<br />
$0 $0.3 3<br />
200,900 200,400 201,600 203,600 206,300 208,800<br />
Millions<br />
$0.2<br />
$0.2<br />
$0.1<br />
$0.0<br />
FY2008 FY2009 FY2010 FY 2011 FY2012 FY2013<br />
Adopted 31<br />
FY2013<br />
Estimate<br />
<strong>FY2014</strong> FY2015 FY2016 FY2017 FY2018
Sanitation Hauler's License<br />
FY2013 <strong>FY2014</strong> $ %<br />
Estimate Forecast Inc/(Dec) Inc/(Dec)<br />
38,900 40,000 1,100 3%<br />
Description<br />
This source reflects the revenue for sanitation hauler's licenses charged per vehicle to all sanitation providers operating within the city <strong>of</strong><br />
<strong>Surprise</strong>. These revenues are recorded in the general fund.<br />
FY2013<br />
Actuals FY2008 FY2009 FY2010 FY 2011 FY2012 Adopted<br />
Revenue Collected<br />
Forecast Assumptions<br />
Nominal growth is expected.<br />
0 0 32,650 42,050 39,000 43,600<br />
Forecast<br />
FY2013<br />
Estimate <strong>FY2014</strong> FY2015 FY2016 FY2017 FY2018<br />
Projected Revenue<br />
$50.0<br />
38,900 40,000 40,800 41,616 42,448 43,297<br />
Thousands<br />
$45.0<br />
$40.0<br />
$35.0<br />
$30.0<br />
$25.0<br />
$20.0<br />
$15.0<br />
$10.0<br />
$5.0<br />
$0.0<br />
FY2008 FY2009 FY2010 FY 2011 FY2012 FY2013<br />
Adopted<br />
FY2013<br />
Estimate<br />
<strong>City</strong> <strong>of</strong> <strong>Surprise</strong> Sanitation Hauler's License<br />
<strong>FY2014</strong> FY2015 FY2016 FY2017 FY2018<br />
FY2013 <strong>FY2014</strong> $ %<br />
Estimate Forecast Inc/(Dec) Inc/(Dec)<br />
24,000 24,000 0 0%<br />
Description<br />
This source reflects the sanitation hauler's licenses charged per vehicle to city <strong>of</strong> <strong>Surprise</strong> sanitation operations. This source is transferred<br />
from the sanitation operations fund to the general fund.<br />
FY2013<br />
Actuals FY2008 FY2009 FY2010 FY 2011 FY2012 Adopted<br />
Revenue Collected<br />
Forecast Assumptions<br />
Nominal growth is expected.<br />
0 0 19,250 25,000 25,000 25,000<br />
Forecast<br />
FY2013<br />
Estimate <strong>FY2014</strong> FY2015 FY2016 FY2017 FY2018<br />
Projected Revenue<br />
$30.0<br />
24,000 24,000 24,000 24,000 24,000 24,000<br />
Thousands<br />
$25.0<br />
$20.0<br />
$15.0<br />
$10.0<br />
$5.0<br />
$0.0<br />
FY2008 FY2009 FY2010 FY 2011 FY2012 FY2013<br />
Adopted<br />
32<br />
FY2013<br />
Estimate<br />
<strong>FY2014</strong> FY2015 FY2016 FY2017 FY2018
Water Service Fee<br />
FY2013 <strong>FY2014</strong> $ %<br />
Estimate Adopted Inc/(Dec) Inc/(Dec)<br />
10,043,000 10,020,504 (22,496) 0%<br />
Description<br />
This source reflects the user charges collected from users <strong>of</strong> the city <strong>of</strong> <strong>Surprise</strong> water service in a tiered rate structure. The city serves about<br />
one-third <strong>of</strong> all water customers. These revenues are recorded in the water service fee fund.<br />
FY2013<br />
Actuals FY2008 FY2009 FY2010 FY 2011 FY2012 Adopted<br />
Revenue Collected 8,683,420 8,751,802 9,666,702 9,759,186 9,873,000 9,908,000<br />
Forecast Assumptions<br />
The water service fee forecast is based on estimates <strong>of</strong> residential customer monthly bills. The monthly service rate for FY2010 is based on a<br />
rate increase adopted by the Mayor and <strong>City</strong> Council effective January 1, 2010. Increases from FY2011 through <strong>FY2014</strong> are projected<br />
increases based on population and expense increases.<br />
FY2013<br />
Forecast Estimate <strong>FY2014</strong> FY2015 FY2016 FY2017 FY2018<br />
Projected Revenue 10,046,000 10,020,500 10,081,900 10,182,200 10,313,800 10,438,700<br />
Millions<br />
$12.0<br />
$10.0<br />
$8.0<br />
$6.0<br />
$4.0<br />
$2.0<br />
$0.0<br />
FY2008 FY2009 FY2010 FY 2011 FY2012 FY2013<br />
Adopted<br />
FY2013<br />
Estimate<br />
Wastewater Service Fee<br />
<strong>FY2014</strong> FY2015 FY2016 FY2017 FY2018<br />
FY2013 <strong>FY2014</strong> $ %<br />
Estimate Adopted Inc/(Dec) Inc/(Dec)<br />
15,613,000 15,713,418 100,418 1%<br />
Description<br />
This source reflects the user charges collected from users <strong>of</strong> the city <strong>of</strong> <strong>Surprise</strong> wastewater service. The city is the only wastewater service<br />
provider. These revenues are recorded in the wastewater service fee fund.<br />
FY2013<br />
Actuals FY2008 FY2009 FY2010 FY 2011 FY2012 Adopted<br />
Revenue Collected<br />
Forecast Assumptions<br />
12,943,202 13,519,397 14,628,974 15,196,067 15,196,544 15,354,000<br />
The wastewater service fee forecast is based on estimates <strong>of</strong> residential customer monthly bills and commercial customer gallons. The<br />
monthly service rate for FY2010 is based on a rate increase adopted by the Mayor and <strong>City</strong> Council effective January 1, 2010. Increases from<br />
FY2011 through <strong>FY2014</strong> are projected increases based on population and expense increases.<br />
FY2013<br />
Forecast Estimate <strong>FY2014</strong> FY2015 FY2016 FY2017 FY2018<br />
Projected Revenue<br />
$ $18.0<br />
15,613,000 15,713,500 15,887,600 16,172,400 16,545,400 16,958,500<br />
Millions<br />
$16.0<br />
$14.0<br />
$12.0<br />
$10.0<br />
$8.0<br />
$6.0<br />
$4.0<br />
$2.0<br />
$0.0<br />
FY2008 FY2009 FY2010 FY 2011 FY2012 FY2013<br />
Adopted 33<br />
FY2013<br />
Estimate<br />
<strong>FY2014</strong> FY2015 FY2016 FY2017 FY2018
Sanitation Service Fee<br />
FY2013 <strong>FY2014</strong> $ %<br />
Estimate Adopted Inc/(Dec) Inc/(Dec)<br />
6,420,000 6,482,000 62,000 1%<br />
Description<br />
This source reflects the user charges collected from users <strong>of</strong> the city <strong>of</strong> <strong>Surprise</strong> sanitation service. These revenues are recorded in the sanitation<br />
service fee fund.<br />
FY2013<br />
Actuals FY2008 FY2009 FY2010 FY 2011 FY2012 Adopted<br />
Revenue Collected 5,281,116 5,549,225 6,134,835 6,479,386 6,267,774 6,585,000<br />
Forecast Assumptions<br />
The sanitation service fee forecast is based on estimates <strong>of</strong> residential customer monthly bills. Also included is an estimate <strong>of</strong> recycling revenue<br />
based on FY2010 year-to-date trends. The monthly service rate for FY2010 is based on a rate increase adopted by the Mayor and <strong>City</strong> Council<br />
effective January 1, 2010. Increases from FY2011 through <strong>FY2014</strong> are projected increases based on population and expense increases.<br />
FY2013<br />
Forecast Estimate <strong>FY2014</strong> FY2015 FY2016 FY2017 FY2018<br />
Projected Revenue 6,420,000 6,482,000 6,649,000 6,928,000 7,323,000 7,304,700<br />
Millions<br />
$8.0<br />
$7.0<br />
$6.0<br />
$5.0<br />
$4.0<br />
$3.0<br />
$2.0<br />
$1.0<br />
$0.0<br />
FY2008 FY2009 FY2010 FY 2011 FY2012 FY2013<br />
Adopted<br />
FY2013<br />
Estimate<br />
Transportation Improvement Tax<br />
FY2013 <strong>FY2014</strong> $ %<br />
Estimate Adopted Inc/(Dec) Inc/(Dec)<br />
2,884,900 2,228,300 (656,600) -23%<br />
<strong>FY2014</strong> FY2015 FY2016 FY2017 FY2018<br />
Description<br />
This source reflects a 1.5% local construction transaction tax adopted by the Mayor and <strong>City</strong> Council. This tax is dedicated for the<br />
improvement <strong>of</strong> existing roadway corridors and costs related to the construction <strong>of</strong> new roadways. These revenues are recorded in the<br />
transportation improvement fund.<br />
FY2013<br />
Actuals FY2008 FY2009 FY2010 FY 2011 FY2012 Adopted<br />
Revenue Collected 6,721,863 6,986,698 4,051,776 2,696,525 2,381,538 3,444,700<br />
Forecast Assumptions<br />
The transportation improvement tax represents 68% <strong>of</strong> the construction sales tax.<br />
Forecast<br />
FY2013<br />
Estimate <strong>FY2014</strong> FY2015 FY2016 FY2017 FY2018<br />
Projected Revenue<br />
$8 $8.0 0<br />
2,884,900 2,228,300 3,227,400 5,023,700 6,381,100 7,040,300<br />
Millions<br />
$7.0<br />
$6.0<br />
$5.0<br />
$4.0<br />
$3.0<br />
$2.0<br />
$1.0<br />
$0.0<br />
FY2008 FY2009 FY2010 FY 2011 FY2012 FY2013<br />
Adopted 34<br />
FY2013<br />
Estimate<br />
<strong>FY2014</strong> FY2015 FY2016 FY2017 FY2018
Wastewater Development Fee<br />
FY2013 <strong>FY2014</strong> $ %<br />
Estimate Adopted Inc/(Dec) Inc/(Dec)<br />
2,249,400 2,365,700 116,300 5%<br />
Description<br />
This source reflects one-time impact fees (latest revision effective 01/01/2012) charged to developers to recover costs associated with<br />
providing wastewater related facilities and services to the community. This revenue is collected specifically to fund growth related projects<br />
and activities. Authorized under A.R.S. 9-463.05 and city ordinance # 07-18. These revenues are recorded in the wastewater development<br />
impact fee funds.<br />
FY2013<br />
Actuals FY2008 FY2009 FY2010 FY 2011 FY2012 Adopted<br />
Revenue Collected 12,427,298 2,832,405 2,061,007 1,590,925 2,007,881 1,051,800<br />
Forecast Assumptions<br />
The revenue forecast for FY2013 is based on estimates from the Community and Economic Development Department <strong>of</strong> the number <strong>of</strong><br />
single family residential permits issued and the square feet <strong>of</strong> non-single family residential permits issued. The 2014-2016 permits issued for<br />
single family residential permits were based on the conservative forecast estimates in the Elliot Pollack - <strong>City</strong> <strong>of</strong> <strong>Surprise</strong> Economic<br />
Conditons Report dated March 2012. FY2017 single family residential permits issued was a conservative estimate by the Finance dept<br />
based on the growth patterns from the Elliot Pollack Study. Non-single family residential permits include multi-family, <strong>of</strong>fice/institution, and<br />
commercial/customer service. This source has been decreasing due to reduced construction activity from the current recession. CED<br />
estimated FY2013 and years <strong>FY2014</strong>-2017 were conservative estimates done by Finance based on the FY2013 estimate.<br />
FY2013<br />
Forecast Estimate <strong>FY2014</strong> FY2015 FY2016 FY2017 FY2018<br />
Projected Revenue 2,249,400 2,365,700 4,094,800 6,693,900 8,751,600 9,691,600<br />
Millions<br />
$14.0<br />
$12.0<br />
$10.0<br />
$8.0<br />
$6.0<br />
$4.0<br />
$2.0<br />
$0.0<br />
FY2008 FY2009 FY2010 FY 2011 FY2012 FY2013<br />
Adopted<br />
FY2013<br />
Estimate<br />
Fire and EMS Development Fee<br />
FY2013 <strong>FY2014</strong> $ %<br />
Estimate Adopted Inc/(Dec) Inc/(Dec)<br />
623,900 579,100 (44,800) -7%<br />
<strong>FY2014</strong> FY2015 FY2016 FY2017 FY2018<br />
Description<br />
This source reflects one-time impact fees (latest revision effective 01/01/2012) charged to developers to recover costs associated with<br />
providing fire and emergency facilities and services to the community. This revenue is collected specifically to fund growth related activities.<br />
Authorized under A.R.S. 9-463.05 and city ordinance # 07-22. These revenues are recorded in the fire and EMS development impact fee<br />
fund.<br />
FY2013<br />
Actuals FY2008 FY2009 FY2010 FY 2011 FY2012 Adopted<br />
Revenue Collected 1,587,234 4,953,819 305,813 542,968 580,176 312,600<br />
Forecast Assumptions<br />
The revenue forecast for FY2013 is based on estimates from the Community and Economic Development Department <strong>of</strong> the number <strong>of</strong><br />
single family residential permits issued and the square feet <strong>of</strong> non-single family residential permits issued. The 2014-2016 permits issued for<br />
single family residential permits were based on the conservative forecast estimates in the Elliot Pollack - <strong>City</strong> <strong>of</strong> <strong>Surprise</strong> Economic<br />
Conditons Report dated March 2012. FY2017 single family residential permits issued was a conservative estimate by the Finance dept<br />
based on the growth patterns from the Elliot Pollack Study. Non-single family residential permits include multi-family, <strong>of</strong>fice/institution, and<br />
commercial/customer service. This source has been decreasing due to reduced construction activity from the current recession. CED<br />
estimated FY2013 and years <strong>FY2014</strong>-2017 were conservative estimates done by Finance based on the FY2013 estimate.<br />
Forecast<br />
FY2013<br />
Estimate <strong>FY2014</strong> FY2015 FY2016 FY2017 FY2018<br />
Projected Revenue 623,900 579,100 808,300 1,273,400 1,644,900 1,813,500<br />
Millions<br />
$6.0<br />
$5.0<br />
$4.0<br />
$3.0<br />
$2.0<br />
$1.0<br />
$0.0<br />
35<br />
FY2008 FY2009 FY2010 FY 2011 FY2012 FY2013<br />
Adopted<br />
FY2013<br />
Estimate<br />
<strong>FY2014</strong> FY2015 FY2016 FY2017 FY2018
Public Works Development Fee<br />
FY2013 <strong>FY2014</strong> $ %<br />
Estimate Adopted Inc/(Dec) Inc/(Dec)<br />
247,300 204,100 (43,200) -17%<br />
Description<br />
This source reflects one-time impact fees (latest revision effective 01/01/2012) charged to developers to recover costs associated<br />
with providing public works facilities and services to the community. This revenue is collected specifically to fund growth related<br />
projects and activities. Authorized under A.R.S. 9-463.05 and city ordinance # 07-23. These revenues are recorded in the public<br />
works development impact fee fund.<br />
FY2013<br />
Actuals FY2008 FY2009 FY2010 FY 2011 FY2012 Adopted<br />
Revenue Collected 4,375,942 982,080 563,728 583,670 314,957 37,300<br />
Forecast Assumptions<br />
The revenue forecast for FY2013 is based on estimates from the Community and Economic Development Department <strong>of</strong> the number<br />
<strong>of</strong> single family residential permits issued and the square feet <strong>of</strong> non-single family residential permits issued. The 2014-2016 permits<br />
issued for single family residential permits were based on the conservative forecast estimates in the Elliot Pollack - <strong>City</strong> <strong>of</strong> <strong>Surprise</strong><br />
Economic Conditons Report dated March 2012. FY2017 single family residential permits issued was a conservative estimate by the<br />
Finance dept based on the growth patterns from the Elliot Pollack Study. Non-single family residential permits include multi-family,<br />
<strong>of</strong>fice/institution, and commercial/customer service. This source has been decreasing due to reduced construction activity from the<br />
current recession. CED estimated FY2013 and years <strong>FY2014</strong>-2017 were conservative estimates done by Finance based on the<br />
FY2013 estimate.<br />
FY2013<br />
Forecast Estimate <strong>FY2014</strong> FY2015 FY2016 FY2017 FY2018<br />
Projected Revenue 247,300 204,100 242,600 316,300 375,100 401,800<br />
Millions<br />
$5.0<br />
$4.5<br />
$4.0<br />
$3.5<br />
$3.0<br />
$2.5<br />
$2.0<br />
$1.5<br />
$1.0<br />
$0.5<br />
$0.0<br />
FY2008 FY2009 FY2010 FY 2011 FY2012 FY2013<br />
Adopted<br />
FY2013<br />
Estimate<br />
General Government Development Fee<br />
FY2013 <strong>FY2014</strong> $ %<br />
Estimate Adopted Inc/(Dec) Inc/(Dec)<br />
559,300 537,400 (21,900) -4%<br />
<strong>FY2014</strong> FY2015 FY2016 FY2017 FY2018<br />
Description<br />
This source reflects one-time impact fees (latest revision effective 01/01/2012) charged to developers to recover costs associated with<br />
general government activities. This revenue is collected specifically to fund growth related activities. Authorized under A.R.S. 9-463.05 and<br />
city ordinance # 07-24. These revenues are recorded in the general government development impact fee fund.<br />
FY2013<br />
Actuals FY2008 FY2009 FY2010 FY 2011 FY2012 Adopted<br />
Revenue Collected 1,415,217 696,479 724,286 468,620 (245,393) 2,430,100<br />
Forecast Assumptions<br />
The revenue forecast for FY2013 is based on estimates from the Community and Economic Development Department <strong>of</strong> the number <strong>of</strong><br />
single family residential permits issued and the square feet <strong>of</strong> non-single family residential permits issued. The 2014-2016 permits issued for<br />
single family residential permits were based on the conservative forecast estimates in the Elliot Pollack - <strong>City</strong> <strong>of</strong> <strong>Surprise</strong> Economic<br />
Conditons Report dated March 2012. FY2017 single family residential permits issued was a conservative estimate by the Finance dept<br />
based on the growth patterns from the Elliot Pollack Study. Non-single family residential permits include multi-family, <strong>of</strong>fice/institution, and<br />
commercial/customer service. This source has been decreasing due to reduced construction activity from the current recession. CED<br />
estimated FY2013 and years <strong>FY2014</strong>-2017 were conservative estimates done by Finance based on the FY2013 estimate.<br />
Forecast<br />
FY2013<br />
Estimate <strong>FY2014</strong> FY2015 FY2016 FY2017 FY2018<br />
Projected Revenue 559,300 537,400 769,400 1,216,200 1,573,100 1,735,100<br />
Millions<br />
$3.0<br />
$2.5<br />
$2.0<br />
$1.5<br />
$1.0<br />
$0.5<br />
$0.0<br />
($0.5)<br />
FY2008 FY2009 FY2010 FY 2011 FY2012 FY2013<br />
Adopted<br />
36<br />
FY2013<br />
Estimate<br />
<strong>FY2014</strong> FY2015 FY2016 FY2017 FY2018
Parks and Recreation Development Fee<br />
FY2013 <strong>FY2014</strong> $ %<br />
Estimate Adopted Inc/(Dec) Inc/(Dec)<br />
376,600 533,600 157,000 42%<br />
Description<br />
This source reflects one-time impact fees (latest revision effective 01/01/2012) charged to developers to recover costs associated with<br />
providing parks and recreation facilities and services to the community. This revenue is collected specifically to fund growth related projects<br />
and activities. Authorized under A.R.S. 9-463.05 and city ordinance # 07-20. These revenues are recorded in the parks & recreation<br />
development impact fee fund.<br />
FY2013<br />
Actuals FY2008 FY2009 FY2010 FY 2011 FY2012 Adopted<br />
Revenue Collected<br />
Forecast Assumptions<br />
2,135,316 10,194,834 1,148,245 448,517 530,867 220,700<br />
The revenue forecast for FY2013 is based on estimates from the Community and Economic Development Department <strong>of</strong> the number <strong>of</strong><br />
single family residential permits issued. The 2014-2016 permits issued for single family residential permits were based on the conservative<br />
forecast estimates in the Elliot Pollack - <strong>City</strong> <strong>of</strong> <strong>Surprise</strong> Economic Conditons Report dated March 2012. FY2017 single family residential<br />
permits issued was a conservative estimate by the Finance dept based on the growth patterns from the Elliot Pollack Study.<br />
Forecast<br />
FY2013<br />
Estimate <strong>FY2014</strong> FY2015 FY2016 FY2017 FY2018<br />
Projected Revenue 376,600 533,600 887,600 1,418,300 1,842,200 2,034,500<br />
Millions<br />
$12.0<br />
$10.5<br />
$9.0<br />
$7.5<br />
$6.0<br />
$4.5<br />
$3.0<br />
$1.5<br />
$0.0<br />
FY2008 FY2009 FY2010 FY 2011 FY2012 FY2013<br />
Adopted<br />
FY2013<br />
Estimate<br />
Water Development Fee<br />
<strong>FY2014</strong> FY2015 FY2016 FY2017 FY2018<br />
FY2013 <strong>FY2014</strong> $ %<br />
Estimate Adopted Inc/(Dec) Inc/(Dec)<br />
630,100 1,277,700 647,600 103%<br />
Description<br />
This source reflects one-time impact fees (latest revision effective 01/01/2012) charged to developers to recover costs associated with<br />
providing water related facilities and services to the community. This revenue is collected specifically to fund growth related projects and<br />
activities. Authorized under A.R.S. 9-463.05 and city ordinance # 07-16. These revenues are recorded in the water development impact fee<br />
FY2013<br />
Actuals FY2008 FY2009 FY2010 FY 2011 FY2012 Adopted<br />
Revenue Collected<br />
Forecast Assumptions<br />
2,563,283 803,622 193,651 331,513 461,387 281,700<br />
The revenue forecast is based on estimates from the Community and Economic Development Department <strong>of</strong> the number <strong>of</strong> single family<br />
residential permits issued and the square feet <strong>of</strong> non-single family residential permits issued. Non-single family residential permits include<br />
multi-family, <strong>of</strong>fice/institution, and commercial/customer service. This source has been decreasing due to reduced construction activity from<br />
the current recession.<br />
Forecast Forecast<br />
FY2013<br />
Estimate <strong>FY2014</strong> FY2015 FY2016 FY2017 FY2018<br />
Projected Revenue 630,100 1,277,700 2,137,700 3,454,200 4,505,900 4,983,000<br />
Millions<br />
$6.0<br />
$4.5<br />
$3.0<br />
$1.5<br />
$0.0<br />
37<br />
FY2008 FY2009 FY2010 FY 2011 FY2012 FY2013<br />
Adopted<br />
FY2013<br />
Estimate<br />
<strong>FY2014</strong> FY2015 FY2016 FY2017 FY2018
Roads <strong>of</strong> Regional Significance<br />
FY2013 <strong>FY2014</strong> $ %<br />
Estimate Adopted Inc/(Dec) Inc/(Dec)<br />
27,400 27,400 0 0%<br />
Description<br />
This source reflects one-time impact fees (latest revision effective 01/01/2012) charged to developers to recover costs associated with roads<br />
<strong>of</strong> regional significance. This revenue is collected specifically to fund growth related projects and activities. Authorized under A.R.S. 9-463.05<br />
and city ordinance # 07-25. This fee was initiated in FY2008. These revenues are recorded in the roads <strong>of</strong> regional significance development<br />
impact fee funds.<br />
FY2013<br />
Actuals FY2008 FY2009 FY2010 FY 2011 FY2012 Adopted<br />
Revenue Collected 1,052,698 375,264 109,533 258,570 23,746 11,600<br />
Forecast Assumptions<br />
Based on estimates from the Community and Economic Development Department <strong>of</strong> the number <strong>of</strong> single family residential permits issued<br />
and the square feet <strong>of</strong> non-single family residential permits issued, no permit activity is forecasted for FY2013 in SPA's 2,3,4,5, and 6. The<br />
2014-2016 permits issued for single family residential permits were based on the conservative forecast estimates in the Elliot Pollack - <strong>City</strong> <strong>of</strong><br />
<strong>Surprise</strong> Economic Conditions Report dated March 2012. FY2017 single family residential permits issued was a conservative estimate by the<br />
Finance Department based on the growth patterns from the Elliot Pollack Study. Non-single family residential permits include multi-family,<br />
<strong>of</strong>fice/institution, and commercial/customer service. This source has been decreasing due to reduced construction activity from the current<br />
recession. CED estimated FY2013 and years <strong>FY2014</strong>-2017 were conservative estimates done by Finance based on the FY2013 estimate.<br />
Forecast<br />
FY2013<br />
Estimate <strong>FY2014</strong> FY2015 FY2016 FY2017 FY2018<br />
Projected Revenue 27,400 27,400 44,100 55,200 105,200 127,400<br />
Millions<br />
$1.2<br />
$1.0<br />
$0.8<br />
$0.6<br />
$0.4<br />
$0.2<br />
$0.0<br />
FY2008 FY2009 FY2010 FY 2011 FY2012 FY2013<br />
Adopted<br />
FY2013<br />
Estimate<br />
Water Replenishment Development Fee<br />
FY2013 <strong>FY2014</strong> $ %<br />
Estimate Adopted Inc/(Dec) Inc/(Dec)<br />
319,900 371,900 52,000 16%<br />
<strong>FY2014</strong> FY2015 FY2016 FY2017 FY2018<br />
Description<br />
This source reflects one-time impact fees (latest revision effective 01/01/2012) charged to developers to recover costs associated with<br />
providing water replenishment related facilities and services to the community. This revenue is collected specifically to fund growth related<br />
projects and activities. Authorized under A.R.S. 9-463.05 and city ordinance # 07-15. These revenues are recorded in the water replenishment<br />
development impact fee funds.<br />
Actuals FY2008 FY2009 FY2010 FY 2011 FY2012<br />
FY2013<br />
Adopted<br />
Revenue Collected<br />
Forecast Assumptions<br />
1,293,265 331,673 106,581 234,857 264,828 156,600<br />
The revenue forecast is based on estimates from the Community and Economic Development Department <strong>of</strong> the number <strong>of</strong> single family<br />
residential permits issued and the square feet <strong>of</strong> non-single family residential permits issued. Non-single family residential permits include<br />
multi-family, <strong>of</strong>fice/institution, and commercial/customer service. This source has been decreasing due to reduced construction activity from<br />
the current recession.<br />
Forecast<br />
FY2013<br />
Estimate <strong>FY2014</strong> FY2015 FY2016 FY2017 FY2018<br />
Projected Revenue<br />
$1.4<br />
319,900 371,900 423,900 475,900 527,900 579,900<br />
Millions<br />
$1.2<br />
$1.0<br />
$0.8<br />
$0.6<br />
$0.4<br />
$0.2<br />
$0.0<br />
38<br />
FY2008 FY2009 FY2010 FY 2011 FY2012 FY2013<br />
Adopted<br />
FY2013<br />
Estimate<br />
<strong>FY2014</strong> FY2015 FY2016 FY2017 FY2018
Police Development Fee<br />
FY2013 <strong>FY2014</strong> $ %<br />
Estimate Adopted Inc/(Dec) Inc/(Dec)<br />
275,000 236,300 (38,700) -14%<br />
Description<br />
This source reflects one-time impact fees (latest revision effective 01/01/2012) charged to developers to recover costs associated with<br />
providing police facilities and services to the community. This revenue is collected specifically to fund growth related activities. Authorized<br />
under A.R.S. 9-463.05 and city ordinance # 07-21. These revenues are recorded in the police development impact fee fund.<br />
FY2013<br />
Actuals FY2008 FY2009 FY2010 FY 2011 FY2012 Adopted<br />
Revenue Collected 829,097 403,718 636,843 215,053 281,129 107,300<br />
Forecast Assumptions<br />
The revenue forecast for FY2013 is based on estimates from the Community and Economic Development Department <strong>of</strong> the number <strong>of</strong><br />
single family residential permits issued and the square feet <strong>of</strong> non-single family residential permits issued. The 2014-2016 permits issued for<br />
single family residential permits were based on the conservative forecast estimates in the Elliot Pollack - <strong>City</strong> <strong>of</strong> <strong>Surprise</strong> Economic<br />
Conditons Report dated March 2012. FY2017 single family residential permits issued was a conservative estimate by the Finance dept<br />
based on the growth patterns from the Elliot Pollack Study. Non-single family residential permits include multi-family, <strong>of</strong>fice/institution, and<br />
commercial/customer service. This source has been decreasing due to reduced construction activity from the current recession. CED<br />
estimated FY2013 and years <strong>FY2014</strong>-2017 were conservative estimates done by Finance based on the FY2013 estimate.<br />
Forecast<br />
FY2013<br />
Estimate <strong>FY2014</strong> FY2015 FY2016 FY2017 FY2018<br />
Projected Revenue<br />
$1.5<br />
275,000 236,300 403,600 654,400 854,800 945,600<br />
Millions<br />
$0.8<br />
$0.0<br />
FY2008 FY2009 FY2010 FY 2011 FY2012 FY2013<br />
Adopted<br />
FY2013<br />
Estimate<br />
Library Development Fee<br />
<strong>FY2014</strong> FY2015 FY2016 FY2017 FY2018<br />
FY2013 <strong>FY2014</strong> $ %<br />
Estimate Adopted Inc/(Dec) Inc/(Dec)<br />
116,900 136,500 19,600 17%<br />
Description<br />
This source reflects one-time impact fees (latest revision effective 01/01/2012) charged to developers to recover costs associated with<br />
providing library facilities and services to the community. This revenue is collected specifically to fund growth related projects and activities.<br />
Authorized under A.R.S. 9-463.05 and city Ordinance # 07-19.<br />
FY2013<br />
Actuals FY2008 FY2009 FY2010 FY 2011 FY2012 Adopted<br />
Revenue Collected 572,848 176,261 168,784 142,137 141,187 56,900<br />
Forecast Assumptions<br />
The revenue forecast for FY2013 is based on estimates from the Community and Economic Development Department <strong>of</strong> the number <strong>of</strong><br />
single family residential permits issued. The 2014-2016 permits issued for single family residential permits were based on the conservative<br />
forecast estimates in the Elliot Pollack - <strong>City</strong> <strong>of</strong> <strong>Surprise</strong> Economic Conditons Report dated March 2012. FY2017 single family residential<br />
permits issued was a conservative estimate by the Finance dept based on the growth patterns from the Elliot Pollack Study.<br />
Forecast<br />
FY2013<br />
Estimate <strong>FY2014</strong> FY2015 FY2016 FY2017 FY2018<br />
Projected Revenue 116,900 136,500 196,400 286,400 358,200 390,800<br />
Millions<br />
$0.9<br />
$0.6<br />
$0.3<br />
$0.0<br />
FY2008 FY2009 FY2010 FY 2011 FY2012 39<br />
FY2013<br />
Adopted<br />
FY2013<br />
Estimate<br />
<strong>FY2014</strong> FY2015 FY2016 FY2017 FY2018
Employee Healthcare Self Insurance Fund<br />
FY2013 <strong>FY2014</strong> $ %<br />
Estimate Adopted Inc/(Dec) Inc/(Dec)<br />
8,421,900 9,095,900 674,000 8%<br />
Description<br />
As <strong>of</strong> FY2011, the city moved to become self insured and effectively moved from a fully insured program due to rising premiums. This<br />
source includes all employee contributions for the fiscal year.<br />
FY2013<br />
Actuals FY2008 FY2009 FY2010 FY 2011 FY2012 Adopted<br />
Revenue Collected<br />
Forecast Assumptions<br />
0 0 0 7,571,450 8,227,342 9,033,700<br />
The revenue estimate for FY2013 are based on enrollments into the various medical, dental, and vision plans mutliplied by the employer's<br />
(the city's) cost to determine the amount presented. For <strong>FY2014</strong>, the city manager receives input from the Loss Trust Fund Board which<br />
receives its information from a third-party consultant and input from HR.<br />
increases to the various plans.<br />
For the outer fiscal years, the city anticipates 2% inflationary<br />
Forecast<br />
FY2013<br />
Estimate <strong>FY2014</strong> FY2015 FY2016 FY2017 FY2018<br />
Projected Revenue<br />
$12.0<br />
88,421,900 421 900 99,095,900 095 900 99,278,000 278 000 99,463,500 463 500 99,652,800 652 800 99,845,900 845 900<br />
Millions<br />
$10.0<br />
$8.0<br />
$6.0<br />
$4.0<br />
$2.0<br />
$0.0<br />
FY2008 FY2009 FY2010 FY 2011 FY2012 FY2013<br />
Adopted<br />
FY2013<br />
Estimate<br />
Risk Management Fund<br />
<strong>FY2014</strong> FY2015 FY2016 FY2017 FY2018<br />
FY2013 <strong>FY2014</strong> $ %<br />
Estimate Adopted Inc/(Dec) Inc/(Dec)<br />
1,601,000 1,616,800 15,800 1%<br />
Description<br />
The city is apart <strong>of</strong> a county and local government risk management pool. The pool sets the premiums paid and the city collects the revenue<br />
from the various departments based on a variety <strong>of</strong> factors (i.e., number <strong>of</strong> cars, etc).<br />
FY2013<br />
Actuals FY2008 FY2009 FY2010 FY 2011 FY2012 Adopted<br />
Revenue Collected<br />
Forecast Assumptions<br />
1,755,444 1,652,030 1,925,630 1,182,054 1,558,410 1,609,500<br />
The estimate is based on weighted average formula <strong>of</strong> the past five years. Forecasts in the out-years are based on population and revenue<br />
per capita where population is expected to increase.<br />
Forecast<br />
FY2013<br />
Estimate <strong>FY2014</strong> FY2015 FY2016 FY2017 FY2018<br />
Projected Revenue<br />
$2.5<br />
1,601,000 1,616,800 1,643,100 1,679,900 1,777,500 1,890,700<br />
Millions<br />
$2.0<br />
$1.5<br />
$1.0<br />
$0.5<br />
$0.0<br />
FY2008 FY2009 FY2010 FY 2011 FY2012 FY2013<br />
Adopted 40<br />
FY2013<br />
Estimate<br />
<strong>FY2014</strong> FY2015 FY2016 FY2017 FY2018
Expense Summary<br />
All Funds Total Expenses Detail by Category<br />
All Funds Total Expenses Detail by Department<br />
All Funds Total Expenses Detail by Object<br />
All Funds Total Expenses by Department by Category<br />
All Funds Total Expenses by Object by Department
<strong>City</strong> <strong>of</strong> <strong>Surprise</strong> All Funds - Detail by Category<br />
Object Category<br />
FY2012<br />
Actual<br />
FY2013<br />
Amended<br />
<strong>FY2014</strong> CM<br />
<strong>Recommended</strong><br />
$<br />
Change<br />
% Change<br />
Personnel 64,122,488 63,618,200 65,606,600 1,988,400 3%<br />
Supplies 9,677,404 9,048,800 8,666,700 -382,100 -4%<br />
Services 35,169,251 41,099,600 46,212,100 5,112,500 12%<br />
Capital 9,402,735 16,111,600 20,554,600 4,443,000 28%<br />
Depreciation 0 0 0<br />
0 -<br />
Debt Service 7,953,138 12,650,900 12,566,100 -84,800 -1%<br />
Contingency 0 21,914,800 46,428,500 24,513,700 112%<br />
Transfer Out 13,679,653 13,560,000 17,737,900 4,177,900 31%<br />
Targeted Savings 0 -935,500 0 935,500 -100%<br />
ED Contingency 0 780,000 1,000,000 220,000 28%<br />
Development Agreements 3,788,150 4,042,900 4,653,700 610,800 15%<br />
Other Financing Use 0 2,267,800 0 -2,267,800 -100%<br />
Grand Total 143,792,821 184,159,100 223,426,200 39,267,100 21%<br />
Saturday, April 27, 2013 41
<strong>City</strong> <strong>of</strong> <strong>Surprise</strong> All Funds - Detail by Department<br />
Department<br />
Arts Commission<br />
<strong>City</strong> Clerk<br />
<strong>City</strong> Court<br />
<strong>City</strong> Manager<br />
Communications<br />
Community and Recreation Services<br />
Community Development<br />
Community Initiatives<br />
Debt Service<br />
Development Fee New Capital<br />
Economic Development<br />
Finance<br />
Fire-Emergency Services<br />
General Operations<br />
Government Relations<br />
Human Resources<br />
Information Services<br />
Legal<br />
Management & <strong>Budget</strong><br />
Mayor & Council<br />
Not Used <strong>City</strong> <strong>of</strong> <strong>Surprise</strong><br />
Police<br />
PW-Development Engineering<br />
PW-Facilities<br />
PW-Replenishment<br />
PW-Sanitation<br />
PW-Sewer<br />
PW-Stormwater<br />
PW-Streets<br />
PW-Transportation<br />
PW-Vehicle Maintenance<br />
PW-Water<br />
FY2012<br />
Actual<br />
FY2013<br />
Amended<br />
<strong>FY2014</strong> CM<br />
<strong>Recommended</strong><br />
$<br />
Change<br />
%<br />
Change<br />
128,323 0 0 0 -<br />
635,474 411,700 653,400 241,700 59%<br />
2,146,394 2,511,500 2,585,900 74,400 3%<br />
687,582 1,885,900 2,130,600 244,700 13%<br />
761,865 0 0 0 -<br />
14,194,400 13,790,300 24,304,500 10,514,200 76%<br />
7,348,597 9,054,600 10,044,100 989,500 11%<br />
0 0 0 0 -<br />
673,645 0 674,600 674,600 -<br />
0 1,837,000 0 -1,837,000 -100%<br />
0 0 0 0 -<br />
3,198,358 3,500,300 3,632,900 132,600 4%<br />
15,128,379 14,972,700 16,163,200 1,190,500 8%<br />
10,563,531 28,223,700 26,345,200 -1,878,500 -7%<br />
258,566 0 0 0 -<br />
9,849,352 15,187,100 16,980,600 1,793,500 12%<br />
3,600,896 3,880,300 4,710,600 830,300 21%<br />
1,651,900 1,749,100 1,785,100 36,000 2%<br />
0 0 0 0 -<br />
452,126 409,700 557,200 147,500 36%<br />
0 0 0 0 -<br />
19,927,168 20,642,000 22,986,600 2,344,600 11%<br />
1,297,521 2,001,500 1,684,500 -317,000 -16%<br />
3,833,746 3,291,900 13,221,600 9,929,700 302%<br />
33,551 1,400,000 3,364,100 1,964,100 140%<br />
5,675,249 6,405,300 7,293,800 888,500 14%<br />
16,558,410 22,315,300 24,652,900 2,337,600 10%<br />
118,718 23,600 22,400 -1,200 -5%<br />
7,149,253 8,552,900 8,900,300 347,400 4%<br />
4,168,425 8,926,800 10,221,500 1,294,700 15%<br />
3,738,054 1,405,900 5,170,700 3,764,800 268%<br />
10,013,337 11,780,000 15,339,900 3,559,900 30%<br />
Grand Total 143,792,821 184,159,100 223,426,200 39,267,100 21%<br />
Friday, April 26, 2013 42
<strong>City</strong> <strong>of</strong> <strong>Surprise</strong> All Funds - Detail by Category by Object<br />
Object Object Description<br />
Personnel<br />
FY2012<br />
Actual<br />
FY2013<br />
Amended<br />
<strong>FY2014</strong> CM<br />
<strong>Recommended</strong><br />
$<br />
Change<br />
% Change<br />
36111 FULL-TIME SALARIES<br />
38,417,577 41,715,300 42,553,500 838,200 2%<br />
36112 PART-TIME EMPLOYEES<br />
1,609,500 1,373,400 1,414,000 40,600 3%<br />
36113 OVERTIME COMPENSATION<br />
1,520,794 1,237,400 1,781,400 544,000 44%<br />
36114 FLSA OT COMPLIANCE<br />
470,843 554,500 590,600 36,100 7%<br />
36115 HOLIDAYS<br />
1,504,123 857,400 886,900 29,500 3%<br />
36116 PAID TIME OFF<br />
4,050,554 0 0<br />
0 -<br />
36118 CITY COUNCIL<br />
156,783 155,500 158,900 3,400 2%<br />
36119 Shift Differential<br />
0 0 37,200 37,200 -<br />
36131 FULL-TIME TEMP SALARIES<br />
21,238 0 0<br />
0 -<br />
36151 STIPEND<br />
183,814 153,400 161,800 8,400 5%<br />
36152 UNIFORM ALLOWANCE<br />
250,926 299,600 325,200 25,600 9%<br />
36153 VEHICLE ALLOWANCE<br />
4,200 4,200 1,500 -2,700 -64%<br />
36211 FICA<br />
2,951,338 2,898,500 3,001,900 103,400 4%<br />
36231 MEDICAL<br />
6,212,144 6,546,900 6,743,000 196,100 3%<br />
36232 DENTAL<br />
392,785 426,900 434,900 8,000 2%<br />
36233 VISION<br />
67,063 65,900 67,400 1,500 2%<br />
36234 LIFE<br />
169,796 184,800 188,600 3,800 2%<br />
36235 SHORT TERM DISABILITY<br />
0 0 0<br />
0 -<br />
36251 DEFERRED COMPENSATION<br />
32,339 50,600 32,800 -17,800 -35%<br />
36252 AZ STATE RETIREMENT<br />
2,833,729 3,047,100 3,299,700 252,600 8%<br />
36253 AZ PUBLIC SAFETY RETIREMENT<br />
2,123,416 2,716,800 2,867,800 151,000 6%<br />
36255 POST EMP. HEALTH PLAN<br />
9,445 0 0<br />
0 -<br />
36256 457 & 401A CONTRIBUTION & MATCH<br />
60,811 0 0<br />
0 -<br />
36257 AZ ELECTED OFFICIALS RETIREMNT<br />
51,894 59,000 65,500 6,500 11%<br />
36259 OTHER RETIREMENT<br />
100,383 0 0<br />
0 -<br />
36261 PSPRS ALT CONTRIBUTION RATE<br />
61,550 0 0<br />
0 -<br />
36278 WORKERS COMPENSATION<br />
867,950 1,230,500 941,200 -289,300 -24%<br />
36999 LABOR DIST. INTER-DEPARTMENT<br />
-2,506 40,500 52,800 12,300 30%<br />
Personnel Subtotal 64,122,488 63,618,200 65,606,600 1,988,400 3%<br />
Supplies<br />
37111 OFFICE SUPPLIES<br />
132,724 136,900 140,400 3,500 3%<br />
37112 COMPUTER SUPPLIES<br />
210,704 162,500 160,600 -1,900 -1%<br />
37113 POSTAGE<br />
0 200 200<br />
0 0%<br />
37114 BOOKS & SUBSCRIPTIONS<br />
49,248 65,000 78,900 13,900 21%<br />
37131 UNIFORMS<br />
146,491 94,300 93,200 -1,100 -1%<br />
37132 CLOTHING<br />
0 500 500<br />
0 0%<br />
37133 PERSONAL PROTECTIVE EQUIPMENT<br />
0 79,200 80,100<br />
900 1%<br />
37141 RADIO SUPPLIES<br />
47,096 17,200 19,200 2,000 12%<br />
37142 PHONE SUPPLIES<br />
14,740 7,900 8,300<br />
400 5%<br />
37151 AMMUNITION<br />
36,612 49,700 49,700<br />
0 0%<br />
37152 WEAPONS<br />
13,339 3,500 3,500<br />
0 0%<br />
37153 CANINE<br />
3,103 3,800 3,800<br />
0 0%<br />
37154 INVESTIGATION SUPPLIES<br />
9,519 6,000 6,000<br />
0 0%<br />
37161 OPERATIONAL SUPPLIES<br />
735,337 674,600 766,300 91,700 14%<br />
37162 FURN-FIXTURE-EQUIP
Object Object Description<br />
FY2012<br />
Actual<br />
FY2013<br />
Amended<br />
<strong>FY2014</strong> CM<br />
<strong>Recommended</strong><br />
$<br />
Change<br />
% Change<br />
37172 CLAIM/SETTLEMT/DEDUCTABLE<br />
142,968 250,000 0 -250,000 -100%<br />
37173 WELLNESS<br />
15,242 25,000 39,500 14,500 58%<br />
37181 PURCHASES FOR RESALE(COS)<br />
375,966 264,900 300,500 35,600 13%<br />
37191 FOOD (NON-TRAVEL)<br />
221,140 0 3,800 3,800 -<br />
37192 AWARDS & RECOGNITION<br />
118,510 133,600 155,600 22,000 16%<br />
37193 SAFETY & FIRST AID SUPPLIES<br />
108,406 135,500 137,500 2,000 1%<br />
37194 COMMUNITY RELATIONS SUPPLIES<br />
56,977 37,900 332,400 294,500 777%<br />
37195 SPECIAL EVENT HOSTING<br />
0 162,100 170,100 8,000 5%<br />
37196 MEETING SUPPLIES<br />
0 14,300 19,400 5,100 36%<br />
37211 GAS & FUEL<br />
1,557,402 1,409,900 1,374,100 -35,800 -3%<br />
37212 AUTO PARTS & LUBRICANTS<br />
775,495 818,500 822,100 3,600 0%<br />
37221 REPAIR AND MAINTENANCE<br />
177,610 181,100 185,200 4,100 2%<br />
37222 CLEANING/JANITORIAL<br />
98,748 109,200 111,700 2,500 2%<br />
37223 AGRICULTURAL/GROUNDS<br />
442,177 388,600 415,800 27,200 7%<br />
37232 CHEMICAL SUPPLIES<br />
851,349 914,800 913,400 -1,400 0%<br />
37233 STREET REPAIR SUPPLIES<br />
158,240 145,000 163,800 18,800 13%<br />
37391 DISTRICT 1-EXPENDITURES<br />
2,234 0 0<br />
0 -<br />
37392 DISTRICT 2-EXPENDITURES<br />
248 0 0<br />
0 -<br />
37393 DISTRICT 3-EXPENDITURES<br />
1,603 0 0<br />
0 -<br />
37394 DISTRICT 4-EXPENDITURES<br />
1,322 0 0<br />
0 -<br />
37395 DISTRICT 5-EXPENDITURES<br />
279 0 0<br />
0 -<br />
37396 DISTRICT 6-EXPENDITURES<br />
3,335 0 0<br />
0 -<br />
37397 MAYOR EXPENDITURES<br />
8,860 0 0<br />
0 -<br />
37398 COUNCIL COMMUNITY OUTREACH<br />
0 12,000 50,000 38,000 317%<br />
37399 MAYOR & COUNCIL DISCRETIONARY<br />
0 0 50,000 50,000 -<br />
37911 INVENTORY ADJUSTMENT<br />
0 0 0<br />
0 -<br />
37992 LICENSES/PERMITS<br />
2,463 0 400<br />
400 -<br />
37996 PACKAGING SUPPLIES<br />
2,728 5,000 5,000<br />
0 0%<br />
37997 TRAINING & EDUCATION SUPPLIES<br />
28,019 109,100 30,000 -79,100 -73%<br />
37998 PHOTOGRAPHY SUPPLIES<br />
6,124 11,700 10,900<br />
-800 -7%<br />
37999 OTHER OPERATIONAL SUPPLIES<br />
5,489 2,700 1,700 -1,000 -37%<br />
Supplies Subtotal 9,677,404 9,048,800 8,666,700 -382,100 -4%<br />
Services<br />
38111 DIST. 1-TRAVEL & TRAINING FUND<br />
1,164 0 0<br />
0 -<br />
38112 DIST. 2-TRAVEL & TRAINING FUND<br />
868 0 0<br />
0 -<br />
38113 DIST. 3-TRAVEL & TRAINING FUND<br />
3,477 0 0<br />
0 -<br />
38114 DIST. 4-TRAVEL & TRAINING FUND<br />
773 0 0<br />
0 -<br />
38115 DIST. 5-TRAVEL & TRAINING FUND<br />
0 0 0<br />
0 -<br />
38116 DIST. 6-TRAVEL & TRAINING FUND<br />
1,685 0 0<br />
0 -<br />
38117 MAYOR TRAVEL & TRAINING FUND<br />
9,100 0 0<br />
0 -<br />
38118 ELECTION EXPENSE<br />
248,556 0 0<br />
0 -<br />
38119 BOARDS & COMMISSIONS<br />
0 5,000 50,000 45,000 900%<br />
38122 FINANCIAL SERVICES<br />
87,939 101,400 110,400 9,000 9%<br />
38123 TAXES & SERVICE FEES<br />
301,551 140,000 123,500 -16,500 -12%<br />
38124 AUDIT SERVICES<br />
195,729 134,000 122,000 -12,000 -9%<br />
38125 LEGAL SERVICES<br />
109,980 126,500 126,500<br />
0 0%<br />
38126 SERVICE AGREEMENTS<br />
2,109,835 2,645,800 3,583,700 937,900 35%<br />
38128 RECORDING, LICENSE FEES<br />
109,052 119,700 119,200<br />
-500 0%<br />
38129 SOFTWARE LICENSES<br />
354,533 428,200 511,600 83,400 19%<br />
38131 COLLECTION FEES-DELINQ. ACCTS<br />
13 500 500<br />
0 0%<br />
38141 ANIMAL CONTROL SERVICES<br />
384 800 800<br />
0 0%<br />
38142 JAIL SERVICES<br />
728,088 728,000 788,000 60,000 8%<br />
38143 PUBLIC DEFENDER<br />
191,650 194,500 194,500<br />
0 0%<br />
38144 COURT REPORTERS<br />
236 1,000 1,000<br />
0 0%<br />
Saturday, April 27, 2013 44
Object Object Description<br />
FY2012<br />
Actual<br />
FY2013<br />
Amended<br />
<strong>FY2014</strong> CM<br />
<strong>Recommended</strong><br />
$<br />
Change<br />
% Change<br />
38145 JURIES<br />
3,205 3,000 3,000<br />
0 0%<br />
38146 INTERPRETERS<br />
6,584 8,200 10,100 1,900 23%<br />
38147 CODE ENFORCEMENT<br />
33,787 50,000 50,000<br />
0 0%<br />
38149 ANNUAL FF PHYSICALS<br />
77,850 97,500 97,500<br />
0 0%<br />
38162 LANDSCAPE SERVICES<br />
670,809 805,900 865,300 59,400 7%<br />
38183 COMMUNITY RELATIONS SERVICES<br />
253,634 74,400 59,600 -14,800 -20%<br />
38184 ADMISSIONS<br />
61,043 33,100 37,100 4,000 12%<br />
38191 PRE-EMPLOYMENT SERVICES<br />
65,580 53,500 49,000 -4,500 -8%<br />
38192 LAB SERVICES<br />
159,948 144,100 153,600 9,500 7%<br />
38193 FILM SERVICES<br />
3,332 2,700 2,200<br />
-500 -19%<br />
38194 REAL PROPERTY SERVICES<br />
19,760 16,000 16,000<br />
0 0%<br />
38195 GIS SERVICES<br />
28,785 30,000 30,000<br />
0 0%<br />
38196 AERIAL PHOTOGRAPHY<br />
44,890 6,000 6,000<br />
0 0%<br />
38197 SPORTING OFFICIALS<br />
0 244,700 240,300 -4,400 -2%<br />
38198 CLASS INSTRUCTORS<br />
0 83,100 86,100 3,000 4%<br />
38199 PROFESSIONAL AND OUTSIDE SERVICES<br />
3,304,238 3,676,500 4,998,600 1,322,100 36%<br />
38211 WATER<br />
1,500,070 1,613,300 1,723,800 110,500 7%<br />
38212 ELECTRICITY<br />
6,545,457 6,679,600 7,266,400 586,800 9%<br />
38213 PROPANE/NATURAL GAS<br />
79,071 118,500 108,800 -9,700 -8%<br />
38214 TELEPHONE SERVICE<br />
296,173 325,200 310,700 -14,500 -4%<br />
38216 SANITARY/LANDFILL<br />
1,127,489 1,159,100 1,169,900 10,800 1%<br />
38217 POSTAGE & MAILINGS<br />
127,358 175,800 180,200 4,400 3%<br />
38218 TELEPHONE MAINTENANCE<br />
0 2,000 0 -2,000 -100%<br />
38221 CELL PHONE/PAGERS<br />
201,710 174,800 170,200 -4,600 -3%<br />
38311 BUILDING MAINTENANCE<br />
583,969 422,900 419,900 -3,000 -1%<br />
38312 STREETS MAINTENANCE<br />
214,334 2,204,000 2,204,000<br />
0 0%<br />
38321 RADIO EQUIP. MAINT.<br />
183,739 214,500 383,800 169,300 79%<br />
38322 COMPUTER MAINTENANCE<br />
36,719 55,900 126,300 70,400 126%<br />
38323 OFFICE EQUIPMENT MAINT.<br />
1,476 20,000 19,000 -1,000 -5%<br />
38324 MACHINERY & EQUIPMENT MAINT<br />
525,329 907,200 658,600 -248,600 -27%<br />
38331 VEHICLE MAINTENANCE<br />
387,255 417,900 414,100 -3,800 -1%<br />
38341 TRAFFIC SIGNAL R&M<br />
170 15,000 15,000<br />
0 0%<br />
38351 WELLS/SEWER/LINS/ETC.<br />
454,494 474,100 559,100 85,000 18%<br />
38361 BUILDING CONTRACTORS<br />
111,532 170,300 159,700 -10,600 -6%<br />
38371 JANITORIAL SERVICES<br />
326,165 339,000 323,000 -16,000 -5%<br />
38372 PEST CONTROL SERVICES<br />
97,338 107,400 107,600<br />
200 0%<br />
38381 GROUNDS MAINTENANCE<br />
101,284 166,500 151,200 -15,300 -9%<br />
38382 PARKS MAINTENANCE<br />
0 0 47,700 47,700 -<br />
38391 OTHER REPAIRS/MAINT.<br />
425 0 0<br />
0 -<br />
38411 WATER SERVICE CONTRACT<br />
1,307,782 1,380,000 1,330,000 -50,000 -4%<br />
38412 SEWER SERVICE CONTRACT<br />
456,679 530,000 520,000 -10,000 -2%<br />
38413 TRASH COLLECTION CONTRACT<br />
362,115 410,000 410,000<br />
0 0%<br />
38511 BUILDING & STRUCTURES RENAL<br />
29,822 27,500 51,500 24,000 87%<br />
38521 EQUIPMENT RENTAL<br />
527,558 536,300 508,500 -27,800 -5%<br />
38591 OTHER RENTALS/LEASES<br />
234,839 279,700 260,200 -19,500 -7%<br />
38911 UNEMPLOYMENT CONTRIBUTION<br />
56,118 132,000 132,000<br />
0 0%<br />
38912 GENERAL INSURANCE<br />
1,438,065 1,600,000 1,600,000<br />
0 0%<br />
38913 CLAIM SETTLEMENT<br />
6,025,315 7,587,500 8,061,400 473,900 6%<br />
38914 COBRA INSURANCE<br />
14,131 15,700 15,700<br />
0 0%<br />
38915 MEDICAL INSURANCE PREMIUM<br />
803,942 882,300 927,800 45,500 5%<br />
38916 EVENT GENERAL INSURANCE<br />
0 68,900 3,300 -65,600 -95%<br />
38917 GENERAL INSURANCE ADMIN<br />
0 0 1,000,000 1,000,000 -<br />
38921 TUITION REIMBURSEMENT<br />
120,913 91,000 89,600 -1,400 -2%<br />
38922 TRAVEL & TRAINING<br />
341,937 341,500 399,500 58,000 17%<br />
38924 DUES & MEMBERSHIPS<br />
259,039 272,700 273,400<br />
700 0%<br />
Saturday, April 27, 2013 45
Object Object Description<br />
FY2012<br />
Actual<br />
FY2013<br />
Amended<br />
<strong>FY2014</strong> CM<br />
<strong>Recommended</strong><br />
$<br />
Change<br />
% Change<br />
38925 FEDERAL MILEAGE ALLOWANCE<br />
13,428 17,700 17,000<br />
-700 -4%<br />
38926 EMPLOYEE ORIENTATION<br />
374 1,500 500 -1,000 -67%<br />
38927 EMPLOYEE CERTS AND LICENSING<br />
4,160 34,900 42,500 7,600 22%<br />
38928 COUNCIL TRAVEL & TRAINING<br />
0 46,000 46,000<br />
0 0%<br />
38931 ADVERTISING<br />
253,069 233,700 234,200<br />
500 0%<br />
38942 RADIO DISPATCH SERVICE<br />
520,372 570,800 615,400 44,600 8%<br />
38951 PRINTING<br />
177,957 235,300 267,600 32,300 14%<br />
38991 UNIFORM/LAUNDRY SERVICES<br />
62,463 52,100 59,700 7,600 15%<br />
38999 OTHER PROFESSIONAL SERVICES<br />
69,559 35,400 391,200 355,800 1005%<br />
Services Subtotal 35,169,251 41,099,600 46,212,100 5,112,500 12%<br />
Capital<br />
39111 LAND PURCHASES<br />
18,515 0 628,100 628,100 -<br />
39210 BUILDING & STRUCTURES<br />
0 0 0<br />
0 -<br />
39211 BUILDING & STRUCTURE PURCHASES<br />
4,144,611 3,270,500 14,558,600 11,288,100 345%<br />
39212 IMPROVEMENTS TO BUILDINGS<br />
99,198 400,300 0 -400,300 -100%<br />
39220 STREETS/INFRASTRUCTURE<br />
0 0 0<br />
0 -<br />
39221 STREETS PURCHASES<br />
0 956,000 0 -956,000 -100%<br />
39222 STREET IMPROVEMENTS<br />
1,050,830 2,941,600 0 -2,941,600 -100%<br />
39223 INFRASTRUCTURE PURCHASES<br />
0 2,524,100 0 -2,524,100 -100%<br />
39224 INFRASTRUCTURE IMPROVEMENTS<br />
102,109 1,105,400 15,000 -1,090,400 -99%<br />
39310 IMP.'S OTR THAN BLDG. & LAND<br />
0 0 0<br />
0 -<br />
39311 IMP.'S OTR THAN BLDG. & LAND<br />
809,393 1,779,600 584,000 -1,195,600 -67%<br />
39411 FURN., FIXTURES & OFC EQUIPMT<br />
350,182 20,000 742,000 722,000 3610%<br />
39420 VEHICLES<br />
0 0 0<br />
0 -<br />
39421 VEHICLES<br />
2,456,254 2,063,500 3,932,300 1,868,800 91%<br />
39422 IMPROVEMENTS TO VEHICLES<br />
47,628 0 0<br />
0 -<br />
39430 MACH. & EQUIPMENT<br />
0 0 0<br />
0 -<br />
39431 MACH. & EQUIPMENT<br />
305,855 140,000 88,000 -52,000 -37%<br />
39432 IMP'S TO MACH. & EQUIPMENT<br />
0 750,000 0 -750,000 -100%<br />
39511 RIGHTS<br />
0 154,000 0 -154,000 -100%<br />
39521 EASEMENTS<br />
9,160 0 0<br />
0 -<br />
39600 CAPITAL INTEREST<br />
0 0 0<br />
0 -<br />
39610 CAPITAL INTEREST EXPENSE<br />
0 0 0<br />
0 -<br />
39813 OTHER LEASES<br />
9,000 6,600 6,600<br />
0 0%<br />
Capital Subtotal 9,402,735 16,111,600 20,554,600 4,443,000 28%<br />
Depreciation<br />
39711 BUILDINGS & STRUCTURES DEPREC.<br />
0 0 0<br />
0 -<br />
39713 EQUIPMENT DEPREC.<br />
0 0 0<br />
0 -<br />
Depreciation Subtotal 0 0 0<br />
0 -<br />
Debt Service<br />
39821 PRINCIPAL BONDS<br />
3,430,000 3,681,000 8,400,000 4,719,000 128%<br />
39822 INTEREST BONDS<br />
4,465,808 4,268,800 4,166,100 -102,700 -2%<br />
39823 OTHER BONDS<br />
1,000 0 0<br />
0 -<br />
39824 AMORITIZATION BONDS<br />
0 0 0<br />
0 -<br />
39831 PRINCIPAL NOTES<br />
0 1,270,000 0 -1,270,000 -100%<br />
39832 INTEREST NOTES<br />
6,569 30,000 0 -30,000 -100%<br />
39833 OTHER NOTES<br />
19,706 0 0<br />
0 -<br />
39834 AMORITIZATION NOTES<br />
0 0 0<br />
0 -<br />
39841 INTERFUND LOAN INTEREST<br />
0 3,401,100 0 -3,401,100 -100%<br />
39861 BAD DEBT EXPENSE<br />
30,056 0 0<br />
0 -<br />
Debt Service Subtotal 7,953,138 12,650,900 12,566,100 -84,800 -1%<br />
Contingency<br />
Saturday, April 27, 2013 46
Object Object Description<br />
FY2012<br />
Actual<br />
FY2013<br />
Amended<br />
<strong>FY2014</strong> CM<br />
<strong>Recommended</strong><br />
$<br />
Change<br />
% Change<br />
39996 GRANT MATCH CONTINGENCY<br />
0 70,000 70,000<br />
0 0%<br />
39998 PROJECT CONTINGENCY<br />
0 87,800 0 -87,800 -100%<br />
39999 CONTINGENCY<br />
0 21,757,000 46,358,500 24,601,500 113%<br />
Contingency Subtotal 0 21,914,800 46,428,500 24,513,700 112%<br />
Transfer Out<br />
34011 COS WTR IN LIEU FRANCH. TR OUT<br />
216,818 213,600 200,400 -13,200 -6%<br />
34012 COS SWR IN LIEU FRANCH. TR OUT<br />
304,409 309,800 314,300 4,500 1%<br />
34013 COS SANI. HAULER'S LIC. TR OUT<br />
25,000 25,000 24,000 -1,000 -4%<br />
34021 WATER INDIRECT COSTS TR OUT<br />
1,453,900 1,453,900 1,244,100 -209,800 -14%<br />
34022 SEWER INDIRECT COSTS TR OUT<br />
1,349,000 1,349,000 1,552,400 203,400 15%<br />
34023 SANI. INDIRECT COSTS TR OUT<br />
857,800 857,800 1,886,400 1,028,600 120%<br />
34031 WTR PYMT ILO PROP TAX TRAN OUT<br />
122,480 96,400 153,900 57,500 60%<br />
34032 SWR PYMT ILO PROP TAX TRAN OUT<br />
293,470 376,000 388,200 12,200 3%<br />
34033 SANI PYMT ILO PROPTAX TRAN OUT<br />
5,967 7,500 8,600 1,100 15%<br />
34041 MPC03 RENT PAYMENTS<br />
4,825,448 4,823,300 4,819,200 -4,100 0%<br />
34047 MPC07 RENT PAYMENTS<br />
2,401,733 2,397,700 7,072,700 4,675,000 195%<br />
34999 TRF TO OTHER FUNDS<br />
1,823,629 1,650,000 73,700 -1,576,300 -96%<br />
Transfer Out Subtotal 13,679,653 13,560,000 17,737,900 4,177,900 31%<br />
Targeted Savings<br />
39997 TARGETED SAVINGS<br />
0 -935,500 0 935,500 -100%<br />
Targeted Savings Subtotal 0 -935,500 0 935,500 -100%<br />
ED Contingency<br />
39995 ECONOMIC DEVELOPMENT CONTINGENCY<br />
0 780,000 1,000,000 220,000 28%<br />
ED Contingency Subtotal 0 780,000 1,000,000 220,000 28%<br />
Development Agre<br />
38127 ECONOMIC DEVELOPMENT<br />
1,529,816 2,892,900 1,666,100 -1,226,800 -42%<br />
38994 DEVELOPER REIMBURSMENT<br />
2,258,334 1,150,000 2,987,600 1,837,600 160%<br />
Development Agreements Subtotal 3,788,150 4,042,900 4,653,700 610,800 15%<br />
Other Financing U<br />
39851 INTERFUND LOAN ISSUANCE<br />
0 2,267,800 0 -2,267,800 -100%<br />
Other Financing Use Subtotal 0 2,267,800 0 -2,267,800 -100%<br />
Grand Total 143,792,821 184,159,100 223,426,200 39,267,100 21%<br />
Saturday, April 27, 2013 47
<strong>City</strong> <strong>of</strong> <strong>Surprise</strong> All Funds - Detail by Department by Category<br />
Object Category<br />
Arts Commission<br />
FY2012<br />
Actual<br />
FY2013<br />
Amended<br />
<strong>FY2014</strong> CM<br />
<strong>Recommended</strong><br />
$<br />
Change<br />
% Change<br />
Supplies 1,593 0 0<br />
0 -<br />
Services 26,430 0 0<br />
0 -<br />
Transfer Out 100,300 0 0<br />
0 -<br />
Arts Commission Total 128,323 0 0<br />
0 -<br />
<strong>City</strong> Clerk<br />
Personnel 345,276 352,500 361,100<br />
8,600 2%<br />
Supplies 5,667 7,000 8,000<br />
1,000 14%<br />
Services 284,531 52,200 284,300 232,100 445%<br />
<strong>City</strong> Clerk Total 635,474 411,700 653,400 241,700 59%<br />
<strong>City</strong> Court<br />
Personnel 1,741,818 1,585,600 1,627,700 42,100 3%<br />
Supplies 29,336 28,900 28,900<br />
0 0%<br />
Services 375,240 425,300 434,300<br />
9,000 2%<br />
Contingency 0 471,700 495,000 23,300 5%<br />
<strong>City</strong> Court Total 2,146,394 2,511,500 2,585,900 74,400 3%<br />
<strong>City</strong> Manager<br />
Personnel 586,207 1,390,300 1,588,900 198,600 14%<br />
Supplies 3,125 31,700 33,100<br />
1,400 4%<br />
Services 98,251 393,900 388,600 -5,300 -1%<br />
Capital 0 0 50,000 50,000 -<br />
Contingency 0 70,000 70,000<br />
0 0%<br />
<strong>City</strong> Manager Total 687,582 1,885,900 2,130,600 244,700 13%<br />
Communications<br />
Personnel 575,526 0 0<br />
0 -<br />
Supplies 21,487 0 0<br />
0 -<br />
Services 164,852 0 0<br />
0 -<br />
Communications Total 761,865 0 0<br />
0 -<br />
Community and Recreation Services<br />
Personnel 6,255,086 5,687,300 6,233,800 546,500 10%<br />
Supplies 2,039,718 1,748,500 2,193,000 444,500 25%<br />
Services 5,073,404 5,279,800 6,372,200 1,092,400 21%<br />
Capital 0 100,300 199,000 98,700 98%<br />
Contingency 0 179,400 8,512,300 8,332,900 4645%<br />
Transfer Out 826,193 795,000 794,200<br />
-800 0%<br />
Community and Recreation Services Total<br />
Community Development<br />
14,194,400 13,790,300 24,304,500 10,514,200 76%<br />
Personnel 2,956,388 3,105,000 3,330,700 225,700 7%<br />
Supplies 95,056 77,900 88,400 10,500 13%<br />
Services 1,023,497 1,048,800 946,300 -102,500 -10%<br />
Capital 0 0 25,000 25,000 -<br />
ED Contingency 0 780,000 1,000,000 220,000 28%<br />
Development Agreements 3,307,396 4,042,900 4,653,700 610,800 15%<br />
Community Development Total<br />
Debt Service<br />
7,382,337 9,054,600 10,044,100 989,500 11%<br />
Debt Service 673,645 0 674,600 674,600 -<br />
Tuesday, April 30, 2013<br />
48
Object Category<br />
FY2012<br />
Actual<br />
FY2013<br />
Amended<br />
<strong>FY2014</strong> CM<br />
<strong>Recommended</strong><br />
$<br />
Change<br />
% Change<br />
Debt Service Total 673,645 0 674,600 674,600 -<br />
Development Fee New Capital<br />
Debt Service 0 1,837,000 0 -1,837,000 -100%<br />
Development Fee New Capital Total 0 1,837,000 0 -1,837,000 -100%<br />
Finance<br />
Personnel 2,333,346 2,462,600 2,271,800 -190,800 -8%<br />
Supplies 33,955 28,400 32,100<br />
3,700 13%<br />
Services 622,602 921,500 1,329,000 407,500 44%<br />
Contingency 0 87,800 0 -87,800 -100%<br />
Development Agreements 208,454 0 0<br />
0 -<br />
Finance Total 3,198,358 3,500,300 3,632,900 132,600 4%<br />
Fire-Emergency Services<br />
Personnel 12,645,604 12,785,100 13,442,100 657,000 5%<br />
Supplies 1,059,049 392,300 522,100 129,800 33%<br />
Services 1,301,482 1,364,600 1,584,500 219,900 16%<br />
Capital 642 15,000 475,000 460,000 3067%<br />
Debt Service 0 292,600 0 -292,600 -100%<br />
Contingency 0 1,500 0 -1,500 -100%<br />
Transfer Out 121,601 121,600 121,500<br />
-100 0%<br />
Fire-Emergency Services Total 15,128,379 14,972,700 16,145,200 1,172,500 8%<br />
General Operations<br />
Personnel 100,383 0 0<br />
0 -<br />
Services 9,046 6,000 53,700 47,700 795%<br />
Capital 6,500 2,807,600 2,287,900 -519,700 -19%<br />
Debt Service 7,223,163 7,413,900 11,891,500 4,477,600 60%<br />
Contingency 0 13,543,700 10,505,000 -3,038,700 -22%<br />
Transfer Out 3,220,546 3,184,700 1,607,100 -1,577,600 -50%<br />
Targeted Savings 0 -1,000,000 0 1,000,000 -100%<br />
Development Agreements 3,894 0 0<br />
0 -<br />
Other Financing Use 0 2,267,800 0 -2,267,800 -100%<br />
General Operations Total 10,563,531 28,223,700 26,345,200 -1,878,500 -7%<br />
Government Relations<br />
Personnel 187,816 0 0<br />
0 -<br />
Supplies 5,866 0 0<br />
0 -<br />
Services 64,885 0 0<br />
0 -<br />
Government Relations Total 258,566 0 0<br />
0 -<br />
Human Resources<br />
Personnel 1,095,074 1,169,900 1,208,200 38,300 3%<br />
Supplies 1,121,093 1,406,300 99,800 -1,306,500 -93%<br />
Services 7,633,185 9,232,500 10,905,300 1,672,800 18%<br />
Contingency 0 3,378,400 4,767,300 1,388,900 41%<br />
Human Resources Total 9,849,352 15,187,100 16,980,600 1,793,500 12%<br />
Information Services<br />
Personnel 2,189,442 2,307,200 2,324,600 17,400 1%<br />
Supplies 144,003 97,800 100,700<br />
2,900 3%<br />
Services 1,158,576 1,455,300 1,650,300 195,000 13%<br />
Capital 108,875 20,000 635,000 615,000 3075%<br />
Information Services Total 3,600,896 3,880,300 4,710,600 830,300 21%<br />
Legal<br />
Tuesday, April 30, 2013<br />
49
Object Category<br />
FY2012<br />
Actual<br />
FY2013<br />
Amended<br />
<strong>FY2014</strong> CM<br />
<strong>Recommended</strong><br />
$<br />
Change<br />
% Change<br />
Personnel 1,530,760 1,561,600 1,597,600 36,000 2%<br />
Supplies 14,251 27,400 27,400<br />
0 0%<br />
Services 106,889 160,100 160,100<br />
0 0%<br />
Legal Total 1,651,900 1,749,100 1,785,100 36,000 2%<br />
Mayor & Council<br />
Personnel 353,384 289,600 304,100 14,500 5%<br />
Supplies 25,095 18,000 106,000 88,000 489%<br />
Services 73,648 102,100 147,100 45,000 44%<br />
Mayor & Council Total 452,126 409,700 557,200 147,500 36%<br />
Police<br />
Personnel 16,643,145 17,097,000 17,976,200 879,200 5%<br />
Supplies 796,203 787,700 1,036,900 249,200 32%<br />
Services 1,650,544 1,590,000 1,733,000 143,000 9%<br />
Capital 591,179 25,000 72,000 47,000 188%<br />
Contingency 0 896,300 1,922,700 1,026,400 115%<br />
Transfer Out 246,098 246,000 245,800<br />
-200 0%<br />
Police Total 19,927,168 20,642,000 22,986,600 2,344,600 11%<br />
PW-Development Engineering<br />
Personnel 850,351 948,300 1,588,700 640,400 68%<br />
Supplies 21,169 22,600 22,500<br />
-100 0%<br />
Services 225,151 110,900 73,300 -37,600 -34%<br />
Capital 200,850 919,700 0 -919,700 -100%<br />
PW-Development Engineering Total<br />
PW-Facilities<br />
1,297,521 2,001,500 1,684,500 -317,000 -16%<br />
Personnel 1,261,855 1,081,000 1,172,800 91,800 8%<br />
Supplies 220,641 204,000 201,300 -2,700 -1%<br />
Services 1,210,236 1,214,900 1,346,300 131,400 11%<br />
Capital 473,655 125,000 100,000 -25,000 -20%<br />
Contingency 0 0 9,734,700 9,734,700 -<br />
Transfer Out 667,359 667,000 666,500<br />
-500 0%<br />
PW-Facilities Total<br />
PW-Replenishment<br />
3,833,746 3,291,900 13,221,600 9,929,700 302%<br />
Services 0 0 195,000 195,000 -<br />
Capital 0 100,000 3,169,100 3,069,100 3069%<br />
Debt Service 26,274 1,300,000 0 -1,300,000 -100%<br />
Transfer Out 7,277 0 0<br />
0 -<br />
PW-Replenishment Total<br />
PW-Sanitation<br />
33,551 1,400,000 3,364,100 1,964,100 140%<br />
Personnel 2,441,395 2,343,600 2,078,500 -265,100 -11%<br />
Supplies 903,980 902,400 957,900 55,500 6%<br />
Services 1,441,106 1,477,000 1,524,000 47,000 3%<br />
Capital 0 0 20,000 20,000 -<br />
Contingency 0 792,000 794,400 2,400 0%<br />
Transfer Out 888,767 890,300 1,919,000 1,028,700 116%<br />
PW-Sanitation Total<br />
PW-Sewer<br />
5,675,249 6,405,300 7,293,800 888,500 14%<br />
Personnel 2,851,461 2,839,600 2,736,700 -102,900 -4%<br />
Supplies 1,170,812 1,321,800 1,296,000 -25,800 -2%<br />
Services 3,554,211 3,903,000 4,090,100 187,100 5%<br />
Friday, April 26, 2013 50
Object Category<br />
FY2012<br />
Actual<br />
FY2013<br />
Amended<br />
<strong>FY2014</strong> CM<br />
<strong>Recommended</strong><br />
$<br />
Change<br />
% Change<br />
Capital 3,173,617 5,154,500 4,152,800 -1,001,700 -19%<br />
Debt Service 0 1,807,400 0 -1,807,400 -100%<br />
Contingency 0 1,333,000 1,591,900 258,900 19%<br />
Transfer Out 5,808,310 5,891,500 10,785,400 4,893,900 83%<br />
Targeted Savings 0 64,500 0 -64,500 -100%<br />
PW-Sewer Total 16,558,410 22,315,300 24,652,900 2,337,600 10%<br />
PW-Stormwater<br />
Personnel 100,208 0 0<br />
0 -<br />
Supplies 2,431 3,200 2,800<br />
-400 -13%<br />
Services 16,079 20,400 19,600<br />
-800 -4%<br />
PW-Stormwater Total 118,718 23,600 22,400 -1,200 -5%<br />
PW-Streets<br />
Personnel 1,912,777 1,874,000 1,917,200 43,200 2%<br />
Supplies 456,259 414,300 466,300 52,000 13%<br />
Services 3,794,260 6,264,600 6,453,600 189,000 3%<br />
Capital 955,901 0 0<br />
0 -<br />
Debt Service 30,056 0 0<br />
0 -<br />
Contingency 0 0 63,200 63,200 -<br />
PW-Streets Total 7,149,253 8,552,900 8,900,300 347,400 4%<br />
PW-Transportation<br />
Personnel 1,779,852 1,630,900 953,700 -677,200 -42%<br />
Supplies 494,350 516,600 452,000 -64,600 -13%<br />
Services 970,650 1,629,300 1,793,800 164,500 10%<br />
Capital 923,574 5,150,000 5,257,400 107,400 2%<br />
Contingency 0 0 1,764,600 1,764,600 -<br />
PW-Transportation Total 4,168,425 8,926,800 10,221,500 1,294,700 15%<br />
PW-Vehicle Maintenance<br />
Personnel 908,764 808,300 938,800 130,500 16%<br />
Supplies 378,376 433,200 347,800 -85,400 -20%<br />
Services 221,396 164,400 266,100 101,700 62%<br />
Capital 2,229,519 0 1,620,000 1,620,000 -<br />
Contingency 0 0 1,998,000 1,998,000 -<br />
PW-Vehicle Maintenance Total<br />
PW-Water<br />
3,738,054 1,405,900 5,170,700 3,764,800 268%<br />
Personnel 2,476,574 2,298,800 1,935,400 -363,400 -16%<br />
Supplies 633,891 578,800 643,700 64,900 11%<br />
Services 4,102,840 4,283,000 4,461,600 178,600 4%<br />
Capital 738,425 1,694,500 2,491,400 796,900 47%<br />
Contingency 0 1,161,000 4,209,400 3,048,400 263%<br />
Transfer Out 1,793,202 1,763,900 1,598,400 -165,500 -9%<br />
Development Agreements 268,406 0 0<br />
0 -<br />
PW-Water Total 10,013,337 11,780,000 15,339,900 3,559,900 30%<br />
Grand Total 143,792,821 184,159,100 223,408,200 39,249,100 21%<br />
Friday, April 26, 2013 51
<strong>City</strong> <strong>of</strong> <strong>Surprise</strong> All Funds - Detail by Object by Department<br />
Object Object Description<br />
34011 COS WTR IN LIEU FRANCH. TR OUT<br />
PW-Water<br />
COS WTR IN LIEU FRANCH. TR OUT To<br />
34012 COS SWR IN LIEU FRANCH. TR OUT<br />
PW-Sewer<br />
COS SWR IN LIEU FRANCH. TR OUT To<br />
34013 COS SANI. HAULER'S LIC. TR OUT<br />
General Operations<br />
PW-Sanitation<br />
COS SANI. HAULER'S LIC. TR OUT Tota<br />
34021 WATER INDIRECT COSTS TR OUT<br />
General Operations<br />
PW-Water<br />
WATER INDIRECT COSTS TR OUT Tota<br />
34022 SEWER INDIRECT COSTS TR OUT<br />
General Operations<br />
PW-Sewer<br />
SEWER INDIRECT COSTS TR OUT Tota<br />
34023 SANI. INDIRECT COSTS TR OUT<br />
General Operations<br />
PW-Sanitation<br />
SANI. INDIRECT COSTS TR OUT Total<br />
34031 WTR PYMT ILO PROP TAX TRAN OUT<br />
General Operations<br />
PW-Water<br />
WTR PYMT ILO PROP TAX TRAN OUT T<br />
34032 SWR PYMT ILO PROP TAX TRAN OUT<br />
General Operations<br />
PW-Sewer<br />
SWR PYMT ILO PROP TAX TRAN OUT<br />
34033 SANI PYMT ILO PROPTAX TRAN OUT<br />
General Operations<br />
PW-Sanitation<br />
SANI PYMT ILO PROPTAX TRAN OUT T<br />
34041 MPC03 RENT PAYMENTS<br />
Community and Recreation Services<br />
Fire-Emergency Services<br />
General Operations<br />
Police<br />
PW-Facilities<br />
FY2012<br />
Actual<br />
Friday, April 26, 2013 52<br />
FY2013<br />
Amended<br />
<strong>FY2014</strong> CM<br />
<strong>Recommended</strong><br />
$<br />
Change<br />
%<br />
Change<br />
216,818 213,600 200,400 -13,200 -6%<br />
216,818 213,600 200,400 -13,200 -6%<br />
304,409 309,800 314,300 4,500 1%<br />
304,409 309,800 314,300 4,500 1%<br />
0 0 0 0 -<br />
25,000 25,000 24,000 -1,000 -4%<br />
25,000 25,000 24,000 -1,000 -4%<br />
0 0 0 0 -<br />
1,453,900 1,453,900 1,244,100 -209,800 -14%<br />
1,453,900 1,453,900 1,244,100 -209,800 -14%<br />
0 0 0 0 -<br />
1,349,000 1,349,000 1,552,400 203,400 15%<br />
1,349,000 1,349,000 1,552,400 203,400 15%<br />
0 0 0 0 -<br />
857,800 857,800 1,886,400 1,028,600 120%<br />
857,800 857,800 1,886,400 1,028,600 120%<br />
0 0 0 0 -<br />
122,480 96,400 153,900 57,500 60%<br />
122,480 96,400 153,900 57,500 60%<br />
0 0 0 0 -<br />
293,470 376,000 388,200 12,200 3%<br />
293,470 376,000 388,200 12,200 3%<br />
0 0 0 0 -<br />
5,967 7,500 8,600 1,100 15%<br />
5,967 7,500 8,600 1,100 15%<br />
795,234 795,000 794,200 -800 0%<br />
121,601 121,600 121,500 -100 0%<br />
1,535,457 1,534,700 1,533,400 -1,300 0%<br />
246,098 246,000 245,800 -200 0%<br />
667,359 667,000 666,500 -500 0%
Object Object Description<br />
PW-Sewer<br />
MPC03 RENT PAYMENTS Total<br />
34047 MPC07 RENT PAYMENTS<br />
PW-Sewer<br />
MPC07 RENT PAYMENTS Total<br />
34999 TRF TO OTHER FUNDS<br />
Arts Commission<br />
Community and Recreation Services<br />
Debt Service<br />
General Operations<br />
Not Used <strong>City</strong> <strong>of</strong> <strong>Surprise</strong><br />
Police<br />
PW-Facilities<br />
PW-Replenishment<br />
PW-Sanitation<br />
PW-Sewer<br />
PW-Transportation<br />
PW-Vehicle Maintenance<br />
PW-Water<br />
TRF TO OTHER FUNDS Total<br />
36111 FULL-TIME SALARIES<br />
<strong>City</strong> Clerk<br />
<strong>City</strong> Court<br />
<strong>City</strong> Manager<br />
Communications<br />
Community and Recreation Services<br />
Community Development<br />
Community Initiatives<br />
Economic Development<br />
Finance<br />
Fire-Emergency Services<br />
Government Relations<br />
Human Resources<br />
Information Services<br />
Legal<br />
Management & <strong>Budget</strong><br />
Mayor & Council<br />
Police<br />
PW-Development Engineering<br />
PW-Facilities<br />
PW-Replenishment<br />
PW-Sanitation<br />
PW-Sewer<br />
PW-Stormwater<br />
PW-Streets<br />
PW-Transportation<br />
FY2012<br />
Actual<br />
Friday, April 26, 2013 53<br />
FY2013<br />
Amended<br />
<strong>FY2014</strong> CM<br />
<strong>Recommended</strong><br />
$<br />
Change<br />
%<br />
Change<br />
1,459,698 1,459,000 1,457,800 -1,200 0%<br />
4,825,448 4,823,300 4,819,200 -4,100 0%<br />
2,401,733 2,397,700 7,072,700 4,675,000 195%<br />
2,401,733 2,397,700 7,072,700 4,675,000 195%<br />
100,300 0 0 0 -<br />
30,960 0 0 0 -<br />
0 0 0 0 -<br />
1,685,089 1,650,000 73,700 -1,576,300 -96%<br />
0 0 0 0 -<br />
0 0 0 0 -<br />
0 0 0 0 -<br />
7,277 0 0 0 -<br />
0 0 0 0 -<br />
0 0 0 0 -<br />
0 0 0 0 -<br />
0 0 0 0 -<br />
4 0 0 0 -<br />
1,823,629 1,650,000 73,700 -1,576,300 -96%<br />
227,047 268,600 275,100 6,500 2%<br />
1,022,741 1,021,500 1,045,800 24,300 2%<br />
411,268 987,500 1,151,800 164,300 17%<br />
372,704 0 0 0 -<br />
3,179,178 3,204,000 3,414,900 210,900 7%<br />
1,786,418 2,140,000 2,337,300 197,300 9%<br />
0 0 0 0 -<br />
0 0 0 0 -<br />
1,564,063 1,800,300 1,673,200 -127,100 -7%<br />
7,267,222 7,915,200 8,177,700 262,500 3%<br />
142,155 0 0 0 -<br />
758,506 871,400 897,100 25,700 3%<br />
1,464,952 1,723,600 1,745,300 21,700 1%<br />
1,025,962 1,137,200 1,165,500 28,300 2%<br />
0 0 0 0 -<br />
48,160 0 0 0 -<br />
9,910,026 11,061,700 11,399,000 337,300 3%<br />
565,908 713,500 1,202,100 488,600 68%<br />
783,479 722,900 804,700 81,800 11%<br />
0 0 0 0 -<br />
1,519,010 1,545,000 1,380,800 -164,200 -11%<br />
1,810,402 1,996,600 1,936,100 -60,500 -3%<br />
68,265 0 0 0 -<br />
1,138,610 1,265,300 1,276,800 11,500 1%<br />
1,121,205 1,099,200 664,100 -435,100 -40%
Object Object Description<br />
PW-Vehicle Maintenance<br />
PW-Water<br />
FULL-TIME SALARIES Total<br />
36112 PART-TIME EMPLOYEES<br />
<strong>City</strong> Court<br />
<strong>City</strong> Manager<br />
Communications<br />
Community and Recreation Services<br />
Community Development<br />
Community Initiatives<br />
Economic Development<br />
Finance<br />
Human Resources<br />
Legal<br />
Police<br />
PW-Development Engineering<br />
PW-Sewer<br />
PW-Transportation<br />
PART-TIME EMPLOYEES Total<br />
36113 OVERTIME COMPENSATION<br />
<strong>City</strong> Court<br />
Communications<br />
Community and Recreation Services<br />
Community Development<br />
Community Initiatives<br />
Economic Development<br />
Finance<br />
Fire-Emergency Services<br />
Human Resources<br />
Information Services<br />
Legal<br />
Management & <strong>Budget</strong><br />
Police<br />
PW-Development Engineering<br />
PW-Facilities<br />
PW-Replenishment<br />
PW-Sanitation<br />
PW-Sewer<br />
PW-Streets<br />
PW-Transportation<br />
PW-Vehicle Maintenance<br />
PW-Water<br />
OVERTIME COMPENSATION Total<br />
36114 FLSA OT COMPLIANCE<br />
Finance<br />
Fire-Emergency Services<br />
FY2012<br />
Actual<br />
Friday, April 26, 2013 54<br />
FY2013<br />
Amended<br />
<strong>FY2014</strong> CM<br />
<strong>Recommended</strong><br />
$<br />
Change<br />
%<br />
Change<br />
564,152 559,900 649,600 89,700 16%<br />
1,666,146 1,681,900 1,356,600 -325,300 -19%<br />
38,417,577 41,715,300 42,553,500 838,200 2%<br />
115,115 133,100 133,100 0 0%<br />
0 70,000 75,500 5,500 8%<br />
51,359 0 0 0 -<br />
1,244,013 940,900 1,109,100 168,200 18%<br />
161,491 143,500 83,600 -59,900 -42%<br />
0 0 0 0 -<br />
0 0 0 0 -<br />
0 46,100 12,700 -33,400 -72%<br />
0 0 0 0 -<br />
0 0 0 0 -<br />
0 0 0 0 -<br />
0 5,000 0 -5,000 -100%<br />
20,728 0 0 0 -<br />
16,793 34,800 0 -34,800 -100%<br />
1,609,500 1,373,400 1,414,000 40,600 3%<br />
93 0 0 0 -<br />
0 0 0 0 -<br />
28,403 60,000 60,000 0 0%<br />
20,277 19,800 19,800 0 0%<br />
0 0 0 0 -<br />
0 0 0 0 -<br />
12,112 13,700 13,700 0 0%<br />
723,330 674,800 879,400 204,600 30%<br />
3,303 0 0 0 -<br />
5,610 500 500 0 0%<br />
145 0 0 0 -<br />
0 0 0 0 -<br />
600,808 349,500 689,700 340,200 97%<br />
10,608 0 0 0 -<br />
8,082 11,500 8,000 -3,500 -30%<br />
0 0 0 0 -<br />
31,573 57,000 39,400 -17,600 -31%<br />
34,269 28,600 29,300 700 2%<br />
4,244 3,000 3,000 0 0%<br />
7,820 7,500 8,000 500 7%<br />
1,479 0 3,500 3,500 -<br />
28,640 11,500 27,100 15,600 136%<br />
1,520,794 1,237,400 1,781,400 544,000 44%<br />
0 0 0 0 -<br />
470,843 554,500 590,600 36,100 7%
Object Object Description<br />
FLSA OT COMPLIANCE Total<br />
36115 HOLIDAYS<br />
<strong>City</strong> Clerk<br />
<strong>City</strong> Court<br />
<strong>City</strong> Manager<br />
Communications<br />
Community and Recreation Services<br />
Community Development<br />
Community Initiatives<br />
Economic Development<br />
Finance<br />
Fire-Emergency Services<br />
Government Relations<br />
Human Resources<br />
Information Services<br />
Legal<br />
Management & <strong>Budget</strong><br />
Mayor & Council<br />
Police<br />
PW-Development Engineering<br />
PW-Facilities<br />
PW-Replenishment<br />
PW-Sanitation<br />
PW-Sewer<br />
PW-Stormwater<br />
PW-Streets<br />
PW-Transportation<br />
PW-Vehicle Maintenance<br />
PW-Water<br />
HOLIDAYS Total<br />
36116 PAID TIME OFF<br />
<strong>City</strong> Clerk<br />
<strong>City</strong> Court<br />
<strong>City</strong> Manager<br />
Communications<br />
Community and Recreation Services<br />
Community Development<br />
Community Initiatives<br />
Economic Development<br />
Finance<br />
Fire-Emergency Services<br />
Government Relations<br />
Human Resources<br />
Information Services<br />
Legal<br />
Management & <strong>Budget</strong><br />
FY2012<br />
Actual<br />
Friday, April 26, 2013 55<br />
FY2013<br />
Amended<br />
<strong>FY2014</strong> CM<br />
<strong>Recommended</strong><br />
$<br />
Change<br />
%<br />
Change<br />
470,843 554,500 590,600 36,100 7%<br />
4,717 0 0 0 -<br />
33,532 0 0 0 -<br />
1,386 0 0 0 -<br />
1,285 0 0 0 -<br />
80,590 0 0 0 -<br />
64,829 0 0 0 -<br />
0 0 0 0 -<br />
0 0 0 0 -<br />
31,568 0 0 0 -<br />
417,178 416,600 443,600 27,000 6%<br />
0 0 0 0 -<br />
13,007 0 0 0 -<br />
29,921 0 0 0 -<br />
13,905 0 0 0 -<br />
0 0 0 0 -<br />
785 0 0 0 -<br />
482,809 440,800 443,300 2,500 1%<br />
13,560 0 0 0 -<br />
27,933 0 0 0 -<br />
0 0 0 0 -<br />
62,738 0 0 0 -<br />
61,731 0 0 0 -<br />
165 0 0 0 -<br />
56,942 0 0 0 -<br />
37,678 0 0 0 -<br />
25,902 0 0 0 -<br />
41,963 0 0 0 -<br />
1,504,123 857,400 886,900 29,500 3%<br />
36,154 0 0 0 -<br />
121,459 0 0 0 -<br />
56,351 0 0 0 -<br />
23,769 0 0 0 -<br />
308,513 0 0 0 -<br />
179,040 0 0 0 -<br />
0 0 0 0 -<br />
0 0 0 0 -<br />
181,224 0 0 0 -<br />
851,063 0 0 0 -<br />
7,144 0 0 0 -<br />
69,762 0 0 0 -<br />
166,638 0 0 0 -<br />
93,790 0 0 0 -<br />
0 0 0 0 -
Object Object Description<br />
Mayor & Council<br />
Police<br />
PW-Development Engineering<br />
PW-Facilities<br />
PW-Replenishment<br />
PW-Sanitation<br />
PW-Sewer<br />
PW-Stormwater<br />
PW-Streets<br />
PW-Transportation<br />
PW-Vehicle Maintenance<br />
PW-Water<br />
PAID TIME OFF Total<br />
36117 SICK LEAVE<br />
<strong>City</strong> Clerk<br />
<strong>City</strong> Court<br />
<strong>City</strong> Manager<br />
Communications<br />
Community and Recreation Services<br />
Community Development<br />
Community Initiatives<br />
Economic Development<br />
Finance<br />
Fire-Emergency Services<br />
Government Relations<br />
Human Resources<br />
Information Services<br />
Legal<br />
Management & <strong>Budget</strong><br />
Police<br />
PW-Development Engineering<br />
PW-Facilities<br />
PW-Replenishment<br />
PW-Sanitation<br />
PW-Sewer<br />
PW-Stormwater<br />
PW-Streets<br />
PW-Transportation<br />
PW-Vehicle Maintenance<br />
PW-Water<br />
SICK LEAVE Total<br />
36118 CITY COUNCIL<br />
Mayor & Council<br />
CITY COUNCIL Total<br />
36119 Shift Differential<br />
Police<br />
FY2012<br />
Actual<br />
Friday, April 26, 2013 56<br />
FY2013<br />
Amended<br />
<strong>FY2014</strong> CM<br />
<strong>Recommended</strong><br />
$<br />
Change<br />
%<br />
Change<br />
3,079 0 0 0 -<br />
971,580 0 0 0 -<br />
68,314 0 0 0 -<br />
86,762 0 0 0 -<br />
0 0 0 0 -<br />
148,787 0 0 0 -<br />
189,047 0 0 0 -<br />
10,866 0 0 0 -<br />
137,867 0 0 0 -<br />
111,247 0 0 0 -<br />
62,667 0 0 0 -<br />
165,431 0 0 0 -<br />
4,050,554 0 0 0 -<br />
0 0 0 0 -<br />
0 0 0 0 -<br />
0 0 0 0 -<br />
0 0 0 0 -<br />
0 0 0 0 -<br />
0 0 0 0 -<br />
0 0 0 0 -<br />
0 0 0 0 -<br />
0 0 0 0 -<br />
0 0 0 0 -<br />
0 0 0 0 -<br />
0 0 0 0 -<br />
0 0 0 0 -<br />
0 0 0 0 -<br />
0 0 0 0 -<br />
0 0 0 0 -<br />
0 0 0 0 -<br />
0 0 0 0 -<br />
0 0 0 0 -<br />
0 0 0 0 -<br />
0 0 0 0 -<br />
0 0 0 0 -<br />
0 0 0 0 -<br />
0 0 0 0 -<br />
0 0 0 0 -<br />
0 0 0 0 -<br />
0 0 0 0 -<br />
156,783 155,500 158,900 3,400 2%<br />
156,783 155,500 158,900 3,400 2%<br />
0 0 37,200 37,200 -
Object Object Description<br />
Shift Differential Total<br />
36131 FULL-TIME TEMP SALARIES<br />
Community Development<br />
FULL-TIME TEMP SALARIES Total<br />
36151 STIPEND<br />
<strong>City</strong> Clerk<br />
<strong>City</strong> Court<br />
<strong>City</strong> Manager<br />
Communications<br />
Community and Recreation Services<br />
Community Development<br />
Community Initiatives<br />
Economic Development<br />
Finance<br />
Fire-Emergency Services<br />
Government Relations<br />
Human Resources<br />
Information Services<br />
Legal<br />
Management & <strong>Budget</strong><br />
Mayor & Council<br />
Police<br />
PW-Development Engineering<br />
PW-Facilities<br />
PW-Replenishment<br />
PW-Sanitation<br />
PW-Sewer<br />
PW-Stormwater<br />
PW-Streets<br />
PW-Transportation<br />
PW-Vehicle Maintenance<br />
PW-Water<br />
STIPEND Total<br />
36152 UNIFORM ALLOWANCE<br />
Community Initiatives<br />
Finance<br />
Fire-Emergency Services<br />
Legal<br />
Police<br />
UNIFORM ALLOWANCE Total<br />
36153 VEHICLE ALLOWANCE<br />
<strong>City</strong> Court<br />
<strong>City</strong> Manager<br />
Communications<br />
Community and Recreation Services<br />
FY2012<br />
Actual<br />
Friday, April 26, 2013 57<br />
FY2013<br />
Amended<br />
<strong>FY2014</strong> CM<br />
<strong>Recommended</strong><br />
$<br />
Change<br />
%<br />
Change<br />
0 0 37,200 37,200 -<br />
21,238 0 0 0 -<br />
21,238 0 0 0 -<br />
480 500 500 0 0%<br />
1,260 1,300 1,300 0 0%<br />
5,085 3,300 4,500 1,200 36%<br />
720 0 0 0 -<br />
10,488 9,400 9,900 500 5%<br />
8,280 8,600 9,700 1,100 13%<br />
0 0 0 0 -<br />
0 0 0 0 -<br />
2,583 2,600 500 -2,100 -81%<br />
9,123 10,200 10,900 700 7%<br />
1,440 0 0 0 -<br />
2,160 2,500 2,000 -500 -20%<br />
13,043 12,800 14,800 2,000 16%<br />
7,020 7,000 7,000 0 0%<br />
0 0 0 0 -<br />
8,445 6,400 6,400 0 0%<br />
64,826 41,000 55,900 14,900 36%<br />
3,629 4,100 7,000 2,900 71%<br />
6,647 5,700 6,000 300 5%<br />
0 0 0 0 -<br />
1,825 1,600 0 -1,600 -100%<br />
14,642 13,900 11,900 -2,000 -14%<br />
0 0 0 0 -<br />
1,380 1,500 1,000 -500 -33%<br />
7,502 7,300 2,500 -4,800 -66%<br />
253 0 1,400 1,400 -<br />
12,983 13,700 8,600 -5,100 -37%<br />
183,814 153,400 161,800 8,400 5%<br />
0 0 0 0 -<br />
0 0 0 0 -<br />
116,481 115,000 138,000 23,000 20%<br />
650 0 0 0 -<br />
133,795 184,600 187,200 2,600 1%<br />
250,926 299,600 325,200 25,600 9%<br />
0 0 0 0 -<br />
0 3,000 300 -2,700 -90%<br />
0 0 0 0 -<br />
0 0 0 0 -
Object Object Description<br />
Community Development<br />
Community Initiatives<br />
Economic Development<br />
Finance<br />
Government Relations<br />
Human Resources<br />
Information Services<br />
Legal<br />
Management & <strong>Budget</strong><br />
Mayor & Council<br />
PW-Development Engineering<br />
PW-Sewer<br />
PW-Streets<br />
VEHICLE ALLOWANCE Total<br />
36156 COMPENSATED ABSENCES<br />
Management & <strong>Budget</strong><br />
PW-Sanitation<br />
PW-Sewer<br />
PW-Water<br />
COMPENSATED ABSENCES Total<br />
36211 FICA<br />
<strong>City</strong> Clerk<br />
<strong>City</strong> Court<br />
<strong>City</strong> Manager<br />
Communications<br />
Community and Recreation Services<br />
Community Development<br />
Community Initiatives<br />
Economic Development<br />
Finance<br />
Fire-Emergency Services<br />
Government Relations<br />
Human Resources<br />
Information Services<br />
Legal<br />
Management & <strong>Budget</strong><br />
Mayor & Council<br />
Police<br />
PW-Development Engineering<br />
PW-Facilities<br />
PW-Replenishment<br />
PW-Sanitation<br />
PW-Sewer<br />
PW-Stormwater<br />
PW-Streets<br />
PW-Transportation<br />
FY2012<br />
Actual<br />
Friday, April 26, 2013 58<br />
FY2013<br />
Amended<br />
<strong>FY2014</strong> CM<br />
<strong>Recommended</strong><br />
$<br />
Change<br />
%<br />
Change<br />
1,200 1,200 1,200 0 0%<br />
0 0 0 0 -<br />
0 0 0 0 -<br />
0 0 0 0 -<br />
3,000 0 0 0 -<br />
0 0 0 0 -<br />
0 0 0 0 -<br />
0 0 0 0 -<br />
0 0 0 0 -<br />
0 0 0 0 -<br />
0 0 0 0 -<br />
0 0 0 0 -<br />
0 0 0 0 -<br />
4,200 4,200 1,500 -2,700 -64%<br />
0 0 0 0 -<br />
0 0 0 0 -<br />
0 0 0 0 -<br />
0 0 0 0 -<br />
0 0 0 0 -<br />
18,748 19,400 19,700 300 2%<br />
91,712 84,900 86,400 1,500 2%<br />
32,293 75,000 87,000 12,000 16%<br />
31,801 0 0 0 -<br />
356,310 316,800 346,700 29,900 9%<br />
163,704 169,400 183,500 14,100 8%<br />
0 0 0 0 -<br />
0 0 0 0 -<br />
129,267 139,500 127,200 -12,300 -9%<br />
178,852 171,500 164,900 -6,600 -4%<br />
11,254 0 0 0 -<br />
59,692 65,800 67,100 1,300 2%<br />
122,282 131,400 132,900 1,500 1%<br />
79,085 83,300 84,900 1,600 2%<br />
0 0 0 0 -<br />
16,936 12,400 12,600 200 2%<br />
886,465 906,000 973,000 67,000 7%<br />
49,008 51,100 89,800 38,700 76%<br />
65,920 56,300 62,600 6,300 11%<br />
0 0 0 0 -<br />
124,359 117,700 108,600 -9,100 -8%<br />
153,670 149,800 149,800 0 0%<br />
5,987 0 0 0 -<br />
95,748 97,200 98,000 800 1%<br />
90,936 83,700 50,600 -33,100 -40%
Object Object Description<br />
PW-Vehicle Maintenance<br />
PW-Water<br />
FICA Total<br />
36231 MEDICAL<br />
<strong>City</strong> Clerk<br />
<strong>City</strong> Court<br />
<strong>City</strong> Manager<br />
Communications<br />
Community and Recreation Services<br />
Community Development<br />
Community Initiatives<br />
Economic Development<br />
Finance<br />
Fire-Emergency Services<br />
Government Relations<br />
Human Resources<br />
Information Services<br />
Legal<br />
Management & <strong>Budget</strong><br />
Mayor & Council<br />
Police<br />
PW-Development Engineering<br />
PW-Facilities<br />
PW-Replenishment<br />
PW-Sanitation<br />
PW-Sewer<br />
PW-Stormwater<br />
PW-Streets<br />
PW-Transportation<br />
PW-Vehicle Maintenance<br />
PW-Water<br />
MEDICAL Total<br />
36232 DENTAL<br />
<strong>City</strong> Clerk<br />
<strong>City</strong> Court<br />
<strong>City</strong> Manager<br />
Communications<br />
Community and Recreation Services<br />
Community Development<br />
Community Initiatives<br />
Economic Development<br />
Finance<br />
Fire-Emergency Services<br />
Government Relations<br />
Human Resources<br />
Information Services<br />
FY2012<br />
Actual<br />
Friday, April 26, 2013 59<br />
FY2013<br />
Amended<br />
<strong>FY2014</strong> CM<br />
<strong>Recommended</strong><br />
$<br />
Change<br />
%<br />
Change<br />
47,446 42,600 50,100 7,500 18%<br />
139,862 124,700 106,500 -18,200 -15%<br />
2,951,338 2,898,500 3,001,900 103,400 4%<br />
27,033 29,700 30,000 300 1%<br />
203,920 193,800 188,600 -5,200 -3%<br />
33,503 99,600 110,400 10,800 11%<br />
45,652 0 0 0 -<br />
496,023 494,100 589,500 95,400 19%<br />
286,983 317,200 356,000 38,800 12%<br />
0 0 0 0 -<br />
0 0 0 0 -<br />
210,900 219,200 220,200 1,000 0%<br />
1,164,123 1,220,700 1,237,900 17,200 1%<br />
5,845 0 0 0 -<br />
91,459 116,700 123,500 6,800 6%<br />
191,304 214,800 200,100 -14,700 -7%<br />
158,684 170,600 169,200 -1,400 -1%<br />
0 0 0 0 -<br />
54,739 50,600 55,200 4,600 9%<br />
1,682,510 1,837,500 1,814,500 -23,000 -1%<br />
59,178 75,800 122,700 46,900 62%<br />
153,620 143,100 155,700 12,600 9%<br />
0 0 0 0 -<br />
295,929 289,300 297,300 8,000 3%<br />
290,222 315,200 306,800 -8,400 -3%<br />
6,207 0 0 0 -<br />
254,873 250,400 288,600 38,200 15%<br />
198,537 194,200 116,700 -77,500 -40%<br />
121,349 115,500 134,500 19,000 16%<br />
179,551 198,900 225,600 26,700 13%<br />
6,212,144 6,546,900 6,743,000 196,100 3%<br />
2,024 2,000 2,000 0 0%<br />
9,745 11,900 11,700 -200 -2%<br />
1,920 6,400 8,500 2,100 33%<br />
2,954 0 0 0 -<br />
29,604 33,500 39,000 5,500 16%<br />
21,609 22,300 25,300 3,000 13%<br />
0 0 0 0 -<br />
0 0 0 0 -<br />
15,494 16,800 15,200 -1,600 -10%<br />
70,986 74,000 76,000 2,000 3%<br />
375 0 0 0 -<br />
6,667 8,200 7,900 -300 -4%<br />
12,200 14,700 14,000 -700 -5%
Object Object Description<br />
Legal<br />
Management & <strong>Budget</strong><br />
Mayor & Council<br />
Police<br />
PW-Development Engineering<br />
PW-Facilities<br />
PW-Replenishment<br />
PW-Sanitation<br />
PW-Sewer<br />
PW-Stormwater<br />
PW-Streets<br />
PW-Transportation<br />
PW-Vehicle Maintenance<br />
PW-Water<br />
DENTAL Total<br />
36233 VISION<br />
<strong>City</strong> Clerk<br />
<strong>City</strong> Court<br />
<strong>City</strong> Manager<br />
Communications<br />
Community and Recreation Services<br />
Community Development<br />
Community Initiatives<br />
Economic Development<br />
Finance<br />
Fire-Emergency Services<br />
Government Relations<br />
Human Resources<br />
Information Services<br />
Legal<br />
Management & <strong>Budget</strong><br />
Mayor & Council<br />
Police<br />
PW-Development Engineering<br />
PW-Facilities<br />
PW-Replenishment<br />
PW-Sanitation<br />
PW-Sewer<br />
PW-Stormwater<br />
PW-Streets<br />
PW-Transportation<br />
PW-Vehicle Maintenance<br />
PW-Water<br />
VISION Total<br />
36234 LIFE<br />
<strong>City</strong> Clerk<br />
FY2012<br />
Actual<br />
Friday, April 26, 2013 60<br />
FY2013<br />
Amended<br />
<strong>FY2014</strong> CM<br />
<strong>Recommended</strong><br />
$<br />
Change<br />
%<br />
Change<br />
10,388 10,700 10,700 0 0%<br />
0 0 0 0 -<br />
3,120 3,800 3,800 0 0%<br />
102,720 115,000 113,000 -2,000 -2%<br />
4,755 6,300 10,500 4,200 67%<br />
10,150 9,400 10,300 900 10%<br />
0 0 0 0 -<br />
18,078 17,800 18,100 300 2%<br />
17,644 20,900 20,000 -900 -4%<br />
393 0 0 0 -<br />
17,276 17,400 19,400 2,000 11%<br />
12,767 13,000 7,400 -5,600 -43%<br />
7,645 7,000 7,700 700 10%<br />
14,271 15,800 14,400 -1,400 -9%<br />
392,785 426,900 434,900 8,000 2%<br />
299 300 300 0 0%<br />
2,013 1,800 1,700 -100 -6%<br />
363 1,000 1,000 0 0%<br />
477 0 0 0 -<br />
5,529 5,100 6,000 900 18%<br />
3,165 3,300 3,700 400 12%<br />
0 0 0 0 -<br />
0 0 0 0 -<br />
2,299 2,100 2,200 100 5%<br />
11,598 11,500 11,700 200 2%<br />
121 0 0 0 -<br />
1,190 1,300 1,300 0 0%<br />
2,400 2,500 2,400 -100 -4%<br />
1,470 1,500 1,500 0 0%<br />
0 0 0 0 -<br />
705 700 700 0 0%<br />
17,703 18,000 18,200 200 1%<br />
752 800 1,500 700 88%<br />
1,461 1,300 1,500 200 15%<br />
0 0 0 0 -<br />
3,083 2,900 2,900 0 0%<br />
3,304 3,400 3,100 -300 -9%<br />
67 0 0 0 -<br />
2,841 2,700 3,000 300 11%<br />
2,407 2,200 1,200 -1,000 -45%<br />
1,241 1,100 1,200 100 9%<br />
2,576 2,400 2,300 -100 -4%<br />
67,063 65,900 67,400 1,500 2%<br />
1,079 1,200 1,200 0 0%
Object Object Description<br />
<strong>City</strong> Court<br />
<strong>City</strong> Manager<br />
Communications<br />
Community and Recreation Services<br />
Community Development<br />
Community Initiatives<br />
Economic Development<br />
Finance<br />
Fire-Emergency Services<br />
Government Relations<br />
Human Resources<br />
Information Services<br />
Legal<br />
Management & <strong>Budget</strong><br />
Mayor & Council<br />
Police<br />
PW-Development Engineering<br />
PW-Facilities<br />
PW-Replenishment<br />
PW-Sanitation<br />
PW-Sewer<br />
PW-Stormwater<br />
PW-Streets<br />
PW-Transportation<br />
PW-Vehicle Maintenance<br />
PW-Water<br />
LIFE Total<br />
36235 SHORT TERM DISABILITY<br />
<strong>City</strong> Clerk<br />
<strong>City</strong> Court<br />
<strong>City</strong> Manager<br />
Communications<br />
Community and Recreation Services<br />
Community Development<br />
Community Initiatives<br />
Economic Development<br />
Finance<br />
Fire-Emergency Services<br />
Government Relations<br />
Human Resources<br />
Information Services<br />
Legal<br />
Management & <strong>Budget</strong><br />
Mayor & Council<br />
Police<br />
PW-Development Engineering<br />
PW-Facilities<br />
FY2012<br />
Actual<br />
Friday, April 26, 2013 61<br />
FY2013<br />
Amended<br />
<strong>FY2014</strong> CM<br />
<strong>Recommended</strong><br />
$<br />
Change<br />
%<br />
Change<br />
4,609 4,500 4,600 100 2%<br />
2,038 4,300 5,100 800 19%<br />
1,615 0 0 0 -<br />
14,129 14,100 14,900 800 6%<br />
7,869 9,400 10,400 1,000 11%<br />
0 0 0 0 -<br />
0 0 0 0 -<br />
6,803 7,800 7,400 -400 -5%<br />
30,245 35,100 36,100 1,000 3%<br />
563 0 0 0 -<br />
3,283 3,900 4,000 100 3%<br />
6,632 7,600 7,700 100 1%<br />
4,466 5,000 5,100 100 2%<br />
0 0 0 0 -<br />
3,053 700 700 0 0%<br />
43,071 48,700 50,400 1,700 3%<br />
2,565 3,100 5,200 2,100 68%<br />
3,421 3,200 3,600 400 13%<br />
0 0 0 0 -<br />
6,569 6,900 6,100 -800 -12%<br />
7,803 8,900 8,700 -200 -2%<br />
258 0 0 0 -<br />
5,201 5,700 5,700 0 0%<br />
4,924 4,900 2,900 -2,000 -41%<br />
2,455 2,500 2,900 400 16%<br />
7,143 7,300 5,900 -1,400 -19%<br />
169,796 184,800 188,600 3,800 2%<br />
0 0 0 0 -<br />
0 0 0 0 -<br />
-9 0 0 0 -<br />
0 0 0 0 -<br />
0 0 0 0 -<br />
0 0 0 0 -<br />
0 0 0 0 -<br />
0 0 0 0 -<br />
0 0 0 0 -<br />
0 0 0 0 -<br />
0 0 0 0 -<br />
0 0 0 0 -<br />
0 0 0 0 -<br />
0 0 0 0 -<br />
0 0 0 0 -<br />
9 0 0 0 -<br />
0 0 0 0 -<br />
0 0 0 0 -<br />
0 0 0 0 -
Object Object Description<br />
PW-Replenishment<br />
PW-Sanitation<br />
PW-Sewer<br />
PW-Stormwater<br />
PW-Streets<br />
PW-Transportation<br />
PW-Vehicle Maintenance<br />
PW-Water<br />
SHORT TERM DISABILITY Total<br />
36251 DEFERRED COMPENSATION<br />
<strong>City</strong> Court<br />
<strong>City</strong> Manager<br />
Community Development<br />
Community Initiatives<br />
Fire-Emergency Services<br />
Legal<br />
PW-Replenishment<br />
DEFERRED COMPENSATION Total<br />
36252 AZ STATE RETIREMENT<br />
<strong>City</strong> Clerk<br />
<strong>City</strong> Court<br />
<strong>City</strong> Manager<br />
Communications<br />
Community and Recreation Services<br />
Community Development<br />
Community Initiatives<br />
Economic Development<br />
Finance<br />
Fire-Emergency Services<br />
Government Relations<br />
Human Resources<br />
Information Services<br />
Legal<br />
Management & <strong>Budget</strong><br />
Mayor & Council<br />
Police<br />
PW-Development Engineering<br />
PW-Facilities<br />
PW-Replenishment<br />
PW-Sanitation<br />
PW-Sewer<br />
PW-Stormwater<br />
PW-Streets<br />
PW-Transportation<br />
PW-Vehicle Maintenance<br />
PW-Water<br />
FY2012<br />
Actual<br />
Friday, April 26, 2013 62<br />
FY2013<br />
Amended<br />
<strong>FY2014</strong> CM<br />
<strong>Recommended</strong><br />
$<br />
Change<br />
%<br />
Change<br />
0 0 0 0 -<br />
0 0 0 0 -<br />
0 0 0 0 -<br />
0 0 0 0 -<br />
0 0 0 0 -<br />
0 0 0 0 -<br />
0 0 0 0 -<br />
0 0 0 0 -<br />
0 0 0 0 -<br />
16,184 16,100 16,400 300 2%<br />
0 18,500 0 -18,500 -100%<br />
0 0 0 0 -<br />
0 0 0 0 -<br />
0 0 0 0 -<br />
16,155 16,000 16,400 400 3%<br />
0 0 0 0 -<br />
32,339 50,600 32,800 -17,800 -35%<br />
27,283 30,000 31,800 1,800 6%<br />
111,690 114,000 136,200 22,200 19%<br />
41,284 118,300 142,200 23,900 20%<br />
42,368 0 0 0 -<br />
381,985 467,200 527,500 60,300 13%<br />
217,955 252,800 282,800 30,000 12%<br />
0 0 0 0 -<br />
0 0 0 0 -<br />
173,785 208,800 196,200 -12,600 -6%<br />
63,099 72,700 52,400 -20,300 -28%<br />
15,682 0 0 0 -<br />
77,246 97,400 103,800 6,400 7%<br />
171,418 193,600 203,200 9,600 5%<br />
117,557 127,500 135,300 7,800 6%<br />
0 0 0 0 -<br />
5,312 0 0 0 -<br />
322,277 273,500 400,100 126,600 46%<br />
66,456 80,000 139,700 59,700 75%<br />
90,472 82,500 94,500 12,000 15%<br />
0 0 0 0 -<br />
173,731 178,800 163,900 -14,900 -8%<br />
210,362 227,400 228,300 900 0%<br />
6,178 0 0 0 -<br />
134,042 141,600 147,800 6,200 4%<br />
131,447 128,200 77,900 -50,300 -39%<br />
63,869 62,400 75,500 13,100 21%<br />
188,232 190,400 160,600 -29,800 -16%
Object Object Description<br />
AZ STATE RETIREMENT Total<br />
36253 AZ PUBLIC SAFETY RETIREMENT<br />
Finance<br />
Fire-Emergency Services<br />
Police<br />
AZ PUBLIC SAFETY RETIREMENT Total<br />
36255 POST EMP. HEALTH PLAN<br />
<strong>City</strong> Clerk<br />
<strong>City</strong> Court<br />
<strong>City</strong> Manager<br />
Communications<br />
Community and Recreation Services<br />
Community Development<br />
Community Initiatives<br />
Economic Development<br />
Finance<br />
Fire-Emergency Services<br />
Government Relations<br />
Human Resources<br />
Information Services<br />
Legal<br />
Management & <strong>Budget</strong><br />
Mayor & Council<br />
Police<br />
PW-Development Engineering<br />
PW-Facilities<br />
PW-Replenishment<br />
PW-Sanitation<br />
PW-Sewer<br />
PW-Stormwater<br />
PW-Streets<br />
PW-Transportation<br />
PW-Vehicle Maintenance<br />
PW-Water<br />
POST EMP. HEALTH PLAN Total<br />
36256 457 & 401A CONTRIBUTION & MATCH<br />
<strong>City</strong> Clerk<br />
<strong>City</strong> Court<br />
<strong>City</strong> Manager<br />
Communications<br />
Community and Recreation Services<br />
Community Development<br />
Community Initiatives<br />
Economic Development<br />
Finance<br />
Fire-Emergency Services<br />
FY2012<br />
Actual<br />
Friday, April 26, 2013 63<br />
FY2013<br />
Amended<br />
<strong>FY2014</strong> CM<br />
<strong>Recommended</strong><br />
$<br />
Change<br />
%<br />
Change<br />
2,833,729 3,047,100 3,299,700 252,600 8%<br />
0 0 0 0 -<br />
996,595 1,239,100 1,392,200 153,100 12%<br />
1,126,821 1,477,700 1,475,600 -2,100 0%<br />
2,123,416 2,716,800 2,867,800 151,000 6%<br />
0 0 0 0 -<br />
0 0 0 0 -<br />
0 0 0 0 -<br />
0 0 0 0 -<br />
0 0 0 0 -<br />
0 0 0 0 -<br />
0 0 0 0 -<br />
0 0 0 0 -<br />
0 0 0 0 -<br />
9,445 0 0 0 -<br />
0 0 0 0 -<br />
0 0 0 0 -<br />
0 0 0 0 -<br />
0 0 0 0 -<br />
0 0 0 0 -<br />
0 0 0 0 -<br />
0 0 0 0 -<br />
0 0 0 0 -<br />
0 0 0 0 -<br />
0 0 0 0 -<br />
0 0 0 0 -<br />
0 0 0 0 -<br />
0 0 0 0 -<br />
0 0 0 0 -<br />
0 0 0 0 -<br />
0 0 0 0 -<br />
0 0 0 0 -<br />
9,445 0 0 0 -<br />
0 0 0 0 -<br />
6,199 0 0 0 -<br />
0 0 0 0 -<br />
0 0 0 0 -<br />
0 0 0 0 -<br />
0 0 0 0 -<br />
0 0 0 0 -<br />
0 0 0 0 -<br />
0 0 0 0 -<br />
47,104 0 0 0 -
Object Object Description<br />
Government Relations<br />
Human Resources<br />
Information Services<br />
Legal<br />
Management & <strong>Budget</strong><br />
Mayor & Council<br />
Police<br />
PW-Development Engineering<br />
PW-Facilities<br />
PW-Replenishment<br />
PW-Sanitation<br />
PW-Sewer<br />
PW-Stormwater<br />
PW-Streets<br />
PW-Transportation<br />
PW-Vehicle Maintenance<br />
PW-Water<br />
457 & 401A CONTRIBUTION & MATCH T<br />
36257 AZ ELECTED OFFICIALS RETIREMNT<br />
Mayor & Council<br />
AZ ELECTED OFFICIALS RETIREMNT T<br />
36259 OTHER RETIREMENT<br />
<strong>City</strong> Clerk<br />
<strong>City</strong> Court<br />
<strong>City</strong> Manager<br />
Communications<br />
Community and Recreation Services<br />
Community Development<br />
Finance<br />
Fire-Emergency Services<br />
General Operations<br />
Government Relations<br />
Human Resources<br />
Information Services<br />
Legal<br />
Police<br />
PW-Development Engineering<br />
PW-Facilities<br />
PW-Sanitation<br />
PW-Sewer<br />
PW-Streets<br />
PW-Transportation<br />
PW-Vehicle Maintenance<br />
PW-Water<br />
OTHER RETIREMENT Total<br />
36261 PSPRS ALT CONTRIBUTION RATE<br />
FY2012<br />
Actual<br />
Friday, April 26, 2013 64<br />
FY2013<br />
Amended<br />
<strong>FY2014</strong> CM<br />
<strong>Recommended</strong><br />
$<br />
Change<br />
%<br />
Change<br />
0 0 0 0 -<br />
7,509 0 0 0 -<br />
0 0 0 0 -<br />
0 0 0 0 -<br />
0 0 0 0 -<br />
0 0 0 0 -<br />
0 0 0 0 -<br />
0 0 0 0 -<br />
0 0 0 0 -<br />
0 0 0 0 -<br />
0 0 0 0 -<br />
0 0 0 0 -<br />
0 0 0 0 -<br />
0 0 0 0 -<br />
0 0 0 0 -<br />
0 0 0 0 -<br />
0 0 0 0 -<br />
60,811 0 0 0 -<br />
51,894 59,000 65,500 6,500 11%<br />
51,894 59,000 65,500 6,500 11%<br />
0 0 0 0 -<br />
0 0 0 0 -<br />
0 0 0 0 -<br />
0 0 0 0 -<br />
0 0 0 0 -<br />
0 0 0 0 -<br />
0 0 0 0 -<br />
0 0 0 0 -<br />
100,383 0 0 0 -<br />
0 0 0 0 -<br />
0 0 0 0 -<br />
0 0 0 0 -<br />
0 0 0 0 -<br />
0 0 0 0 -<br />
0 0 0 0 -<br />
0 0 0 0 -<br />
0 0 0 0 -<br />
0 0 0 0 -<br />
0 0 0 0 -<br />
0 0 0 0 -<br />
0 0 0 0 -<br />
0 0 0 0 -<br />
100,383 0 0 0 -
Object Object Description<br />
Fire-Emergency Services<br />
Police<br />
PSPRS ALT CONTRIBUTION RATE Tota<br />
36278 WORKERS COMPENSATION<br />
<strong>City</strong> Clerk<br />
<strong>City</strong> Court<br />
<strong>City</strong> Manager<br />
Communications<br />
Community and Recreation Services<br />
Community Development<br />
Community Initiatives<br />
Economic Development<br />
Finance<br />
Fire-Emergency Services<br />
Government Relations<br />
Human Resources<br />
Information Services<br />
Legal<br />
Management & <strong>Budget</strong><br />
Mayor & Council<br />
Police<br />
PW-Development Engineering<br />
PW-Facilities<br />
PW-Replenishment<br />
PW-Sanitation<br />
PW-Sewer<br />
PW-Stormwater<br />
PW-Streets<br />
PW-Transportation<br />
PW-Vehicle Maintenance<br />
PW-Water<br />
WORKERS COMPENSATION Total<br />
36279 OTHER COMPENSATION<br />
Human Resources<br />
PW-Transportation<br />
OTHER COMPENSATION Total<br />
36999 LABOR DIST. INTER-DEPARTMENT<br />
Community and Recreation Services<br />
Community Development<br />
Community Initiatives<br />
Fire-Emergency Services<br />
Police<br />
PW-Facilities<br />
PW-Streets<br />
PW-Transportation<br />
LABOR DIST. INTER-DEPARTMENT Tot<br />
FY2012<br />
Actual<br />
Friday, April 26, 2013 65<br />
FY2013<br />
Amended<br />
<strong>FY2014</strong> CM<br />
<strong>Recommended</strong><br />
$<br />
Change<br />
%<br />
Change<br />
15,878 0 0 0 -<br />
45,672 0 0 0 -<br />
61,550 0 0 0 -<br />
413 800 500 -300 -38%<br />
1,546 2,700 1,900 -800 -30%<br />
725 3,400 2,600 -800 -24%<br />
822 0 0 0 -<br />
74,714 101,700 75,500 -26,200 -26%<br />
12,330 17,500 17,400 -100 -1%<br />
0 0 0 0 -<br />
0 0 0 0 -<br />
3,250 5,700 3,300 -2,400 -42%<br />
221,983 274,200 236,700 -37,500 -14%<br />
236 0 0 0 -<br />
1,290 2,700 1,500 -1,200 -44%<br />
3,042 5,700 3,700 -2,000 -35%<br />
1,484 2,800 2,000 -800 -29%<br />
0 0 0 0 -<br />
365 500 300 -200 -40%<br />
280,631 343,000 319,100 -23,900 -7%<br />
5,619 8,600 10,200 1,600 19%<br />
23,908 45,100 25,900 -19,200 -43%<br />
0 0 0 0 -<br />
55,714 126,600 61,400 -65,200 -52%<br />
37,634 74,900 42,700 -32,200 -43%<br />
1,822 0 0 0 -<br />
63,753 89,200 73,900 -15,300 -17%<br />
36,589 55,900 22,400 -33,500 -60%<br />
10,304 17,300 12,400 -4,900 -28%<br />
29,775 52,200 27,800 -24,400 -47%<br />
867,950 1,230,500 941,200 -289,300 -24%<br />
0 0 0 0 -<br />
0 0 0 0 -<br />
0 0 0 0 -<br />
45,605 40,500 40,800 300 1%<br />
0 0 0 0 -<br />
0 0 0 0 -<br />
-19,544 0 12,000 12,000 -<br />
-28,568 0 0 0 -<br />
0 0 0 0 -<br />
0 0 0 0 -<br />
0 0 0 0 -<br />
-2,506 40,500 52,800 12,300 30%
Object Object Description<br />
37111 OFFICE SUPPLIES<br />
<strong>City</strong> Clerk<br />
<strong>City</strong> Court<br />
<strong>City</strong> Manager<br />
Communications<br />
Community and Recreation Services<br />
Community Development<br />
Community Initiatives<br />
Economic Development<br />
Finance<br />
Fire-Emergency Services<br />
General Operations<br />
Government Relations<br />
Human Resources<br />
Information Services<br />
Legal<br />
Management & <strong>Budget</strong><br />
Mayor & Council<br />
Police<br />
PW-Development Engineering<br />
PW-Facilities<br />
PW-Replenishment<br />
PW-Sanitation<br />
PW-Sewer<br />
PW-Stormwater<br />
PW-Streets<br />
PW-Transportation<br />
PW-Vehicle Maintenance<br />
PW-Water<br />
OFFICE SUPPLIES Total<br />
37112 COMPUTER SUPPLIES<br />
<strong>City</strong> Clerk<br />
<strong>City</strong> Court<br />
<strong>City</strong> Manager<br />
Communications<br />
Community and Recreation Services<br />
Community Development<br />
Community Initiatives<br />
Economic Development<br />
Finance<br />
Fire-Emergency Services<br />
Government Relations<br />
Human Resources<br />
Information Services<br />
Legal<br />
Management & <strong>Budget</strong><br />
Mayor & Council<br />
FY2012<br />
Actual<br />
Friday, April 26, 2013 66<br />
FY2013<br />
Amended<br />
<strong>FY2014</strong> CM<br />
<strong>Recommended</strong><br />
$<br />
Change<br />
%<br />
Change<br />
3,892 7,000 8,000 1,000 14%<br />
10,696 12,000 12,000 0 0%<br />
99 2,600 2,300 -300 -12%<br />
488 0 0 0 -<br />
13,288 16,900 16,900 0 0%<br />
8,796 8,700 8,600 -100 -1%<br />
0 0 0 0 -<br />
0 0 0 0 -<br />
10,803 12,400 14,900 2,500 20%<br />
5,429 4,900 4,900 0 0%<br />
0 0 0 0 -<br />
937 0 0 0 -<br />
10,807 10,500 10,500 0 0%<br />
3,515 4,000 4,800 800 20%<br />
5,544 9,000 9,000 0 0%<br />
0 0 0 0 -<br />
1,956 2,000 2,000 0 0%<br />
38,476 22,700 25,000 2,300 10%<br />
3,572 3,500 3,500 0 0%<br />
2,485 1,800 1,800 0 0%<br />
0 0 0 0 -<br />
1,617 3,900 2,900 -1,000 -26%<br />
3,926 5,900 5,400 -500 -8%<br />
13 100 100 0 0%<br />
1,114 900 900 0 0%<br />
1,564 2,300 1,400 -900 -39%<br />
1,355 1,500 1,500 0 0%<br />
2,351 4,300 4,000 -300 -7%<br />
132,724 136,900 140,400 3,500 3%<br />
357 0 0 0 -<br />
7,189 7,000 7,000 0 0%<br />
68 2,800 2,500 -300 -11%<br />
1,406 0 0 0 -<br />
17,152 28,800 25,800 -3,000 -10%<br />
14,033 11,700 11,700 0 0%<br />
0 0 0 0 -<br />
0 0 0 0 -<br />
7,850 8,400 8,300 -100 -1%<br />
18,135 14,700 16,200 1,500 10%<br />
202 0 0 0 -<br />
19,209 10,200 10,200 0 0%<br />
43,812 26,400 26,400 0 0%<br />
2,485 4,900 4,900 0 0%<br />
0 0 0 0 -<br />
1,376 1,500 1,500 0 0%
Object Object Description<br />
Police<br />
PW-Development Engineering<br />
PW-Facilities<br />
PW-Sanitation<br />
PW-Sewer<br />
PW-Stormwater<br />
PW-Streets<br />
PW-Transportation<br />
PW-Vehicle Maintenance<br />
PW-Water<br />
COMPUTER SUPPLIES Total<br />
37113 POSTAGE<br />
<strong>City</strong> Manager<br />
Community and Recreation Services<br />
Finance<br />
POSTAGE Total<br />
37114 BOOKS & SUBSCRIPTIONS<br />
<strong>City</strong> Clerk<br />
<strong>City</strong> Court<br />
<strong>City</strong> Manager<br />
Communications<br />
Community and Recreation Services<br />
Community Development<br />
Community Initiatives<br />
Economic Development<br />
Finance<br />
Fire-Emergency Services<br />
Government Relations<br />
Human Resources<br />
Information Services<br />
Legal<br />
Management & <strong>Budget</strong><br />
Mayor & Council<br />
Police<br />
PW-Development Engineering<br />
PW-Facilities<br />
PW-Replenishment<br />
PW-Sanitation<br />
PW-Sewer<br />
PW-Stormwater<br />
PW-Streets<br />
PW-Transportation<br />
PW-Vehicle Maintenance<br />
PW-Water<br />
BOOKS & SUBSCRIPTIONS Total<br />
37115 ALLOCATABLE<br />
FY2012<br />
Actual<br />
Friday, April 26, 2013 67<br />
FY2013<br />
Amended<br />
<strong>FY2014</strong> CM<br />
<strong>Recommended</strong><br />
$<br />
Change<br />
%<br />
Change<br />
50,078 24,000 24,000 0 0%<br />
5,655 5,800 5,800 0 0%<br />
5,685 2,500 2,500 0 0%<br />
1,676 800 1,300 500 63%<br />
3,688 4,400 4,400 0 0%<br />
0 100 100 0 0%<br />
1,305 900 900 0 0%<br />
3,690 1,800 1,800 0 0%<br />
2,004 2,000 2,000 0 0%<br />
3,646 3,800 3,300 -500 -13%<br />
210,704 162,500 160,600 -1,900 -1%<br />
0 0 0 0 -<br />
0 0 0 0 -<br />
0 200 200 0 0%<br />
0 200 200 0 0%<br />
0 0 0 0 -<br />
8,997 8,000 8,000 0 0%<br />
24 4,300 4,400 100 2%<br />
457 0 0 0 -<br />
1,280 1,800 1,900 100 6%<br />
544 1,500 4,900 3,400 227%<br />
0 0 0 0 -<br />
0 0 0 0 -<br />
3,523 3,200 3,000 -200 -6%<br />
2,717 6,600 7,100 500 8%<br />
3,852 0 0 0 -<br />
5,565 5,500 11,500 6,000 109%<br />
1,959 2,500 2,300 -200 -8%<br />
4,865 11,000 11,000 0 0%<br />
0 0 0 0 -<br />
282 500 500 0 0%<br />
1,180 6,400 11,000 4,600 72%<br />
879 1,200 1,200 0 0%<br />
864 2,100 2,100 0 0%<br />
0 0 0 0 -<br />
120 100 100 0 0%<br />
715 2,300 2,200 -100 -4%<br />
381 500 500 0 0%<br />
678 0 0 0 -<br />
442 500 500 0 0%<br />
3,358 2,000 2,000 0 0%<br />
6,568 5,000 4,700 -300 -6%<br />
49,248 65,000 78,900 13,900 21%
Object Object Description<br />
Finance<br />
General Operations<br />
Management & <strong>Budget</strong><br />
ALLOCATABLE Total<br />
37131 UNIFORMS<br />
Community and Recreation Services<br />
Community Development<br />
Community Initiatives<br />
Fire-Emergency Services<br />
Human Resources<br />
Information Services<br />
Police<br />
PW-Development Engineering<br />
PW-Facilities<br />
PW-Replenishment<br />
PW-Sanitation<br />
PW-Sewer<br />
PW-Stormwater<br />
PW-Streets<br />
PW-Transportation<br />
PW-Vehicle Maintenance<br />
PW-Water<br />
UNIFORMS Total<br />
37132 CLOTHING<br />
Information Services<br />
CLOTHING Total<br />
37133 PERSONAL PROTECTIVE EQUIPMENT<br />
Fire-Emergency Services<br />
Police<br />
PERSONAL PROTECTIVE EQUIPMENT<br />
37141 RADIO SUPPLIES<br />
Community and Recreation Services<br />
Finance<br />
Fire-Emergency Services<br />
Information Services<br />
Police<br />
PW-Sanitation<br />
PW-Streets<br />
PW-Transportation<br />
PW-Vehicle Maintenance<br />
RADIO SUPPLIES Total<br />
37142 PHONE SUPPLIES<br />
Community and Recreation Services<br />
Community Development<br />
Community Initiatives<br />
FY2012<br />
Actual<br />
Friday, April 26, 2013 68<br />
FY2013<br />
Amended<br />
<strong>FY2014</strong> CM<br />
<strong>Recommended</strong><br />
$<br />
Change<br />
%<br />
Change<br />
0 0 0 0 -<br />
0 0 0 0 -<br />
0 0 0 0 -<br />
0 0 0 0 -<br />
33,078 33,700 33,700 0 0%<br />
2,561 1,300 1,400 100 8%<br />
0 0 0 0 -<br />
73,096 14,600 15,200 600 4%<br />
0 0 0 0 -<br />
140 0 0 0 -<br />
13,439 16,000 16,000 0 0%<br />
812 1,700 1,700 0 0%<br />
2,347 2,100 2,200 100 5%<br />
0 0 0 0 -<br />
3,926 3,400 3,700 300 9%<br />
1,688 4,000 3,400 -600 -15%<br />
0 100 0 -100 -100%<br />
4,228 4,700 4,700 0 0%<br />
5,985 5,500 4,000 -1,500 -27%<br />
1,984 2,600 2,600 0 0%<br />
3,206 4,600 4,600 0 0%<br />
146,491 94,300 93,200 -1,100 -1%<br />
0 500 500 0 0%<br />
0 500 500 0 0%<br />
0 40,000 40,000 0 0%<br />
0 39,200 40,100 900 2%<br />
0 79,200 80,100 900 1%<br />
1,241 200 200 0 0%<br />
0 0 0 0 -<br />
1,789 8,200 10,200 2,000 24%<br />
0 0 0 0 -<br />
23,924 8,000 8,000 0 0%<br />
0 300 300 0 0%<br />
19,078 500 500 0 0%<br />
1,064 0 0 0 -<br />
0 0 0 0 -<br />
47,096 17,200 19,200 2,000 12%<br />
652 0 600 600 -<br />
0 200 200 0 0%<br />
0 0 0 0 -
Object Object Description<br />
Economic Development<br />
Fire-Emergency Services<br />
Information Services<br />
Police<br />
PW-Development Engineering<br />
PW-Facilities<br />
PW-Sanitation<br />
PW-Sewer<br />
PW-Streets<br />
PW-Transportation<br />
PW-Vehicle Maintenance<br />
PW-Water<br />
PHONE SUPPLIES Total<br />
37151 AMMUNITION<br />
Police<br />
AMMUNITION Total<br />
37152 WEAPONS<br />
Police<br />
WEAPONS Total<br />
37153 CANINE<br />
Police<br />
CANINE Total<br />
37154 INVESTIGATION SUPPLIES<br />
Police<br />
INVESTIGATION SUPPLIES Total<br />
37161 OPERATIONAL SUPPLIES<br />
<strong>City</strong> Clerk<br />
<strong>City</strong> Court<br />
<strong>City</strong> Manager<br />
Communications<br />
Community and Recreation Services<br />
Community Development<br />
Community Initiatives<br />
Economic Development<br />
Finance<br />
Fire-Emergency Services<br />
Human Resources<br />
Mayor & Council<br />
Police<br />
PW-Development Engineering<br />
PW-Facilities<br />
PW-Replenishment<br />
PW-Sanitation<br />
PW-Sewer<br />
PW-Stormwater<br />
FY2012<br />
Actual<br />
Friday, April 26, 2013 69<br />
FY2013<br />
Amended<br />
<strong>FY2014</strong> CM<br />
<strong>Recommended</strong><br />
$<br />
Change<br />
%<br />
Change<br />
0 0 0 0 -<br />
587 0 0 0 -<br />
10,869 4,000 4,000 0 0%<br />
197 500 500 0 0%<br />
270 100 100 0 0%<br />
44 100 100 0 0%<br />
202 100 200 100 100%<br />
476 800 500 -300 -38%<br />
770 600 600 0 0%<br />
453 700 700 0 0%<br />
98 200 200 0 0%<br />
122 600 600 0 0%<br />
14,740 7,900 8,300 400 5%<br />
36,612 49,700 49,700 0 0%<br />
36,612 49,700 49,700 0 0%<br />
13,339 3,500 3,500 0 0%<br />
13,339 3,500 3,500 0 0%<br />
3,103 3,800 3,800 0 0%<br />
3,103 3,800 3,800 0 0%<br />
9,519 6,000 6,000 0 0%<br />
9,519 6,000 6,000 0 0%<br />
0 0 0 0 -<br />
199 0 0 0 -<br />
0 0 0 0 -<br />
538 0 0 0 -<br />
374,718 343,600 413,700 70,100 20%<br />
10,793 12,500 12,500 0 0%<br />
0 0 0 0 -<br />
0 0 0 0 -<br />
0 0 0 0 -<br />
25,772 12,300 34,300 22,000 179%<br />
183 300 1,300 1,000 333%<br />
2 0 0 0 -<br />
24,946 12,000 13,500 1,500 13%<br />
219 100 0 -100 -100%<br />
2,477 1,000 1,100 100 10%<br />
0 0 0 0 -<br />
18,378 18,000 18,500 500 3%<br />
162,942 179,300 176,500 -2,800 -2%<br />
0 500 0 -500 -100%
Object Object Description<br />
PW-Streets<br />
PW-Transportation<br />
PW-Vehicle Maintenance<br />
PW-Water<br />
OPERATIONAL SUPPLIES Total<br />
37162 FURN-FIXTURE-EQUIP
Object Object Description<br />
Management & <strong>Budget</strong><br />
Police<br />
PW-Development Engineering<br />
PW-Facilities<br />
PW-Sanitation<br />
PW-Sewer<br />
PW-Streets<br />
PW-Transportation<br />
PW-Vehicle Maintenance<br />
PW-Water<br />
SIGNS AND SIGN SUPPLIES Total<br />
37165 OP EQUIP, TOOL, PART
Object Object Description<br />
CLAIM/SETTLEMT/DEDUCTABLE Total<br />
37173 WELLNESS<br />
Human Resources<br />
WELLNESS Total<br />
37181 PURCHASES FOR RESALE(COS)<br />
Communications<br />
Community and Recreation Services<br />
PURCHASES FOR RESALE(COS) Total<br />
37191 FOOD (NON-TRAVEL)<br />
<strong>City</strong> Clerk<br />
<strong>City</strong> Court<br />
<strong>City</strong> Manager<br />
Communications<br />
Community and Recreation Services<br />
Community Development<br />
Community Initiatives<br />
Economic Development<br />
Finance<br />
Fire-Emergency Services<br />
General Operations<br />
Government Relations<br />
Human Resources<br />
Information Services<br />
Legal<br />
Management & <strong>Budget</strong><br />
Mayor & Council<br />
Police<br />
PW-Development Engineering<br />
PW-Facilities<br />
PW-Replenishment<br />
PW-Sanitation<br />
PW-Sewer<br />
PW-Streets<br />
PW-Transportation<br />
PW-Vehicle Maintenance<br />
PW-Water<br />
FOOD (NON-TRAVEL) Total<br />
37192 AWARDS & RECOGNITION<br />
<strong>City</strong> Court<br />
<strong>City</strong> Manager<br />
Communications<br />
Community and Recreation Services<br />
Community Development<br />
Community Initiatives<br />
Economic Development<br />
FY2012<br />
Actual<br />
Friday, April 26, 2013 72<br />
FY2013<br />
Amended<br />
<strong>FY2014</strong> CM<br />
<strong>Recommended</strong><br />
$<br />
Change<br />
%<br />
Change<br />
142,968 250,000 0 -250,000 -100%<br />
15,242 25,000 39,500 14,500 58%<br />
15,242 25,000 39,500 14,500 58%<br />
254 0 0 0 -<br />
375,711 264,900 300,500 35,600 13%<br />
375,966 264,900 300,500 35,600 13%<br />
56 0 0 0 -<br />
9 0 0 0 -<br />
760 0 0 0 -<br />
0 0 0 0 -<br />
188,532 0 3,000 3,000 -<br />
6,603 0 0 0 -<br />
0 0 0 0 -<br />
0 0 0 0 -<br />
979 0 0 0 -<br />
5,657 0 0 0 -<br />
0 0 0 0 -<br />
551 0 0 0 -<br />
7,705 0 0 0 -<br />
898 0 0 0 -<br />
5 0 0 0 -<br />
0 0 0 0 -<br />
2,111 0 0 0 -<br />
6,518 0 0 0 -<br />
0 0 0 0 -<br />
0 0 0 0 -<br />
0 0 0 0 -<br />
82 0 800 800 -<br />
206 0 0 0 -<br />
192 0 0 0 -<br />
117 0 0 0 -<br />
0 0 0 0 -<br />
159 0 0 0 -<br />
221,140 0 3,800 3,800 -<br />
0 400 400 0 0%<br />
0 800 800 0 0%<br />
1,345 0 0 0 -<br />
95,467 116,200 137,500 21,300 18%<br />
1,781 1,200 1,200 0 0%<br />
0 0 0 0 -<br />
0 0 0 0 -
Object Object Description<br />
Fire-Emergency Services<br />
Human Resources<br />
Information Services<br />
Management & <strong>Budget</strong><br />
Mayor & Council<br />
Police<br />
PW-Development Engineering<br />
PW-Replenishment<br />
PW-Sanitation<br />
PW-Sewer<br />
PW-Streets<br />
PW-Transportation<br />
PW-Water<br />
AWARDS & RECOGNITION Total<br />
37193 SAFETY & FIRST AID SUPPLIES<br />
<strong>City</strong> Clerk<br />
<strong>City</strong> Court<br />
<strong>City</strong> Manager<br />
Community and Recreation Services<br />
Community Development<br />
Community Initiatives<br />
Economic Development<br />
Finance<br />
Fire-Emergency Services<br />
Human Resources<br />
Information Services<br />
Legal<br />
Management & <strong>Budget</strong><br />
Mayor & Council<br />
Police<br />
PW-Development Engineering<br />
PW-Facilities<br />
PW-Replenishment<br />
PW-Sanitation<br />
PW-Sewer<br />
PW-Stormwater<br />
PW-Streets<br />
PW-Transportation<br />
PW-Vehicle Maintenance<br />
PW-Water<br />
SAFETY & FIRST AID SUPPLIES Total<br />
37194 COMMUNITY RELATIONS SUPPLIES<br />
<strong>City</strong> Court<br />
<strong>City</strong> Manager<br />
Communications<br />
Community and Recreation Services<br />
FY2012<br />
Actual<br />
Friday, April 26, 2013 73<br />
FY2013<br />
Amended<br />
<strong>FY2014</strong> CM<br />
<strong>Recommended</strong><br />
$<br />
Change<br />
%<br />
Change<br />
6,274 3,800 4,300 500 13%<br />
8,818 8,000 8,000 0 0%<br />
68 0 200 200 -<br />
0 0 0 0 -<br />
0 0 0 0 -<br />
2,590 500 500 0 0%<br />
0 0 0 0 -<br />
0 0 0 0 -<br />
43 0 0 0 -<br />
308 800 800 0 0%<br />
260 100 100 0 0%<br />
1,204 1,200 1,200 0 0%<br />
352 600 600 0 0%<br />
118,510 133,600 155,600 22,000 16%<br />
0 0 0 0 -<br />
0 100 100 0 0%<br />
0 0 0 0 -<br />
11,703 16,800 16,300 -500 -3%<br />
1,117 1,600 2,000 400 25%<br />
0 0 0 0 -<br />
0 0 0 0 -<br />
74 200 200 0 0%<br />
19,784 26,300 28,200 1,900 7%<br />
951 1,000 1,000 0 0%<br />
322 100 200 100 100%<br />
0 0 0 0 -<br />
0 0 0 0 -<br />
0 0 0 0 -<br />
21,514 24,300 24,300 0 0%<br />
569 1,000 1,000 0 0%<br />
3,793 5,700 4,000 -1,700 -30%<br />
0 0 0 0 -<br />
8,416 7,900 10,400 2,500 32%<br />
11,773 19,500 19,400 -100 -1%<br />
0 200 0 -200 -100%<br />
12,331 11,600 11,600 0 0%<br />
3,402 2,900 2,700 -200 -7%<br />
6,863 6,000 6,000 0 0%<br />
5,795 10,300 10,100 -200 -2%<br />
108,406 135,500 137,500 2,000 1%<br />
0 0 0 0 -<br />
342 5,200 5,200 0 0%<br />
2,593 0 0 0 -<br />
29,412 13,200 286,200 273,000 2068%
Object Object Description<br />
Community Development<br />
Community Initiatives<br />
Economic Development<br />
Fire-Emergency Services<br />
Government Relations<br />
Human Resources<br />
Management & <strong>Budget</strong><br />
Police<br />
PW-Facilities<br />
PW-Replenishment<br />
PW-Sewer<br />
PW-Stormwater<br />
PW-Transportation<br />
PW-Water<br />
COMMUNITY RELATIONS SUPPLIES To<br />
37195 SPECIAL EVENT HOSTING<br />
<strong>City</strong> Court<br />
<strong>City</strong> Manager<br />
Community and Recreation Services<br />
Community Development<br />
Finance<br />
Fire-Emergency Services<br />
Human Resources<br />
Information Services<br />
SPECIAL EVENT HOSTING Total<br />
37196 MEETING SUPPLIES<br />
<strong>City</strong> Manager<br />
Community and Recreation Services<br />
Community Development<br />
Fire-Emergency Services<br />
Human Resources<br />
Mayor & Council<br />
Police<br />
PW-Development Engineering<br />
PW-Facilities<br />
PW-Sanitation<br />
PW-Sewer<br />
PW-Streets<br />
PW-Transportation<br />
PW-Vehicle Maintenance<br />
PW-Water<br />
MEETING SUPPLIES Total<br />
37211 GAS & FUEL<br />
<strong>City</strong> Clerk<br />
<strong>City</strong> Court<br />
<strong>City</strong> Manager<br />
FY2012<br />
Actual<br />
Friday, April 26, 2013 74<br />
FY2013<br />
Amended<br />
<strong>FY2014</strong> CM<br />
<strong>Recommended</strong><br />
$<br />
Change<br />
%<br />
Change<br />
5,503 4,000 5,500 1,500 38%<br />
0 0 0 0 -<br />
0 0 0 0 -<br />
113 0 6,000 6,000 -<br />
304 0 0 0 -<br />
18 0 0 0 -<br />
0 0 0 0 -<br />
13,482 5,000 19,300 14,300 286%<br />
0 3,500 3,500 0 0%<br />
0 0 0 0 -<br />
587 0 0 0 -<br />
1,041 1,000 1,200 200 20%<br />
0 0 0 0 -<br />
3,581 6,000 5,500 -500 -8%<br />
56,977 37,900 332,400 294,500 777%<br />
0 400 400 0 0%<br />
0 0 2,000 2,000 -<br />
0 145,500 147,000 1,500 1%<br />
0 7,400 9,900 2,500 34%<br />
0 1,000 2,000 1,000 100%<br />
0 4,000 4,500 500 13%<br />
0 3,200 3,700 500 16%<br />
0 600 600 0 0%<br />
0 162,100 170,100 8,000 5%<br />
0 0 0 0 -<br />
0 500 1,500 1,000 200%<br />
0 300 0 -300 -100%<br />
0 0 0 0 -<br />
0 4,500 9,600 5,100 113%<br />
0 2,000 2,000 0 0%<br />
0 4,200 4,200 0 0%<br />
0 200 200 0 0%<br />
0 100 100 0 0%<br />
0 1,300 1,100 -200 -15%<br />
0 300 100 -200 -67%<br />
0 200 200 0 0%<br />
0 500 100 -400 -80%<br />
0 0 100 100 -<br />
0 200 200 0 0%<br />
0 14,300 19,400 5,100 36%<br />
46 0 0 0 -<br />
0 0 0 0 -<br />
0 300 200 -100 -33%
Object Object Description<br />
Communications<br />
Community and Recreation Services<br />
Community Development<br />
Community Initiatives<br />
Economic Development<br />
Finance<br />
Fire-Emergency Services<br />
Government Relations<br />
Information Services<br />
Management & <strong>Budget</strong><br />
Police<br />
PW-Development Engineering<br />
PW-Facilities<br />
PW-Replenishment<br />
PW-Sanitation<br />
PW-Sewer<br />
PW-Stormwater<br />
PW-Streets<br />
PW-Transportation<br />
PW-Vehicle Maintenance<br />
PW-Water<br />
GAS & FUEL Total<br />
37212 AUTO PARTS & LUBRICANTS<br />
Community and Recreation Services<br />
Community Development<br />
Community Initiatives<br />
Fire-Emergency Services<br />
Information Services<br />
Police<br />
PW-Development Engineering<br />
PW-Facilities<br />
PW-Replenishment<br />
PW-Sanitation<br />
PW-Sewer<br />
PW-Stormwater<br />
PW-Streets<br />
PW-Transportation<br />
PW-Vehicle Maintenance<br />
PW-Water<br />
AUTO PARTS & LUBRICANTS Total<br />
37221 REPAIR AND MAINTENANCE<br />
<strong>City</strong> Court<br />
Community and Recreation Services<br />
Community Development<br />
Community Initiatives<br />
Economic Development<br />
FY2012<br />
Actual<br />
Friday, April 26, 2013 75<br />
FY2013<br />
Amended<br />
<strong>FY2014</strong> CM<br />
<strong>Recommended</strong><br />
$<br />
Change<br />
%<br />
Change<br />
188 0 0 0 -<br />
93,265 79,500 79,500 0 0%<br />
14,027 15,600 18,600 3,000 19%<br />
0 0 0 0 -<br />
0 0 0 0 -<br />
152 500 500 0 0%<br />
124,935 126,700 130,200 3,500 3%<br />
20 0 0 0 -<br />
2,326 1,600 1,600 0 0%<br />
0 0 0 0 -<br />
417,116 336,500 350,000 13,500 4%<br />
5,744 7,500 7,500 0 0%<br />
24,036 19,600 17,800 -1,800 -9%<br />
0 0 0 0 -<br />
479,383 464,700 464,700 0 0%<br />
39,116 34,100 40,900 6,800 20%<br />
214 500 500 0 0%<br />
183,119 167,600 167,600 0 0%<br />
108,576 94,200 33,100 -61,100 -65%<br />
17,235 16,900 17,300 400 2%<br />
47,904 44,100 44,100 0 0%<br />
1,557,402 1,409,900 1,374,100 -35,800 -3%<br />
32,944 28,600 28,600 0 0%<br />
0 0 0 0 -<br />
0 0 0 0 -<br />
0 0 21,200 21,200 -<br />
0 0 0 0 -<br />
0 0 0 0 -<br />
0 0 0 0 -<br />
13 0 0 0 -<br />
0 0 0 0 -<br />
333,009 317,500 334,900 17,400 5%<br />
15,046 9,600 27,700 18,100 189%<br />
8 0 200 200 -<br />
69,002 69,200 102,200 33,000 48%<br />
14,763 15,200 15,000 -200 -1%<br />
305,141 368,500 280,700 -87,800 -24%<br />
5,568 9,900 11,600 1,700 17%<br />
775,495 818,500 822,100 3,600 0%<br />
0 0 0 0 -<br />
50,775 53,800 53,000 -800 -1%<br />
1,955 2,000 2,000 0 0%<br />
0 0 0 0 -<br />
0 0 0 0 -
Object Object Description<br />
Fire-Emergency Services<br />
Information Services<br />
Management & <strong>Budget</strong><br />
Police<br />
PW-Facilities<br />
PW-Sanitation<br />
PW-Sewer<br />
PW-Streets<br />
PW-Vehicle Maintenance<br />
PW-Water<br />
REPAIR AND MAINTENANCE Total<br />
37222 CLEANING/JANITORIAL<br />
<strong>City</strong> Court<br />
Community and Recreation Services<br />
Community Development<br />
Community Initiatives<br />
Finance<br />
Fire-Emergency Services<br />
Legal<br />
Police<br />
PW-Facilities<br />
PW-Sanitation<br />
PW-Sewer<br />
PW-Streets<br />
PW-Transportation<br />
PW-Vehicle Maintenance<br />
PW-Water<br />
CLEANING/JANITORIAL Total<br />
37223 AGRICULTURAL/GROUNDS<br />
Community and Recreation Services<br />
PW-Sewer<br />
PW-Streets<br />
PW-Water<br />
AGRICULTURAL/GROUNDS Total<br />
37232 CHEMICAL SUPPLIES<br />
Community and Recreation Services<br />
Fire-Emergency Services<br />
PW-Sanitation<br />
PW-Sewer<br />
PW-Water<br />
CHEMICAL SUPPLIES Total<br />
37233 STREET REPAIR SUPPLIES<br />
PW-Sewer<br />
PW-Streets<br />
PW-Transportation<br />
FY2012<br />
Actual<br />
Friday, April 26, 2013 76<br />
FY2013<br />
Amended<br />
<strong>FY2014</strong> CM<br />
<strong>Recommended</strong><br />
$<br />
Change<br />
%<br />
Change<br />
4,136 10,000 10,000 0 0%<br />
4,424 10,000 13,000 3,000 30%<br />
0 0 0 0 -<br />
0 0 0 0 -<br />
107,172 100,000 100,000 0 0%<br />
898 0 0 0 -<br />
80 3,600 3,600 0 0%<br />
0 800 800 0 0%<br />
819 0 1,900 1,900 -<br />
7,350 900 900 0 0%<br />
177,610 181,100 185,200 4,100 2%<br />
19 0 0 0 -<br />
31,179 34,900 34,600 -300 -1%<br />
0 400 400 0 0%<br />
0 0 0 0 -<br />
0 0 0 0 -<br />
15,248 15,300 17,100 1,800 12%<br />
12 0 0 0 -<br />
11 1,700 1,700 0 0%<br />
50,839 55,000 56,000 1,000 2%<br />
787 0 0 0 -<br />
278 1,600 1,600 0 0%<br />
122 200 200 0 0%<br />
9 0 0 0 -<br />
227 0 0 0 -<br />
18 100 100 0 0%<br />
98,748 109,200 111,700 2,500 2%<br />
395,890 333,600 360,400 26,800 8%<br />
32,855 44,000 44,000 0 0%<br />
12,336 10,000 10,000 0 0%<br />
1,096 1,000 1,400 400 40%<br />
442,177 388,600 415,800 27,200 7%<br />
58,387 49,200 49,200 0 0%<br />
0 0 0 0 -<br />
0 1,200 13,200 12,000 1000%<br />
471,658 567,400 554,400 -13,000 -2%<br />
321,304 297,000 296,600 -400 0%<br />
851,349 914,800 913,400 -1,400 0%<br />
0 2,600 2,400 -200 -8%<br />
78,347 82,000 101,000 19,000 23%<br />
79,893 60,400 60,400 0 0%
Object Object Description<br />
STREET REPAIR SUPPLIES Total<br />
37391 DISTRICT 1-EXPENDITURES<br />
Mayor & Council<br />
DISTRICT 1-EXPENDITURES Total<br />
37392 DISTRICT 2-EXPENDITURES<br />
Mayor & Council<br />
DISTRICT 2-EXPENDITURES Total<br />
37393 DISTRICT 3-EXPENDITURES<br />
Mayor & Council<br />
DISTRICT 3-EXPENDITURES Total<br />
37394 DISTRICT 4-EXPENDITURES<br />
Mayor & Council<br />
DISTRICT 4-EXPENDITURES Total<br />
37395 DISTRICT 5-EXPENDITURES<br />
Mayor & Council<br />
DISTRICT 5-EXPENDITURES Total<br />
37396 DISTRICT 6-EXPENDITURES<br />
Mayor & Council<br />
DISTRICT 6-EXPENDITURES Total<br />
37397 MAYOR EXPENDITURES<br />
Mayor & Council<br />
MAYOR EXPENDITURES Total<br />
37398 COUNCIL COMMUNITY OUTREACH<br />
Mayor & Council<br />
COUNCIL COMMUNITY OUTREACH Tot<br />
37399 MAYOR & COUNCIL DISCRETIONARY<br />
Mayor & Council<br />
MAYOR & COUNCIL DISCRETIONARY T<br />
37911 INVENTORY ADJUSTMENT<br />
PW-Sewer<br />
INVENTORY ADJUSTMENT Total<br />
37990 OTHER/MISC. SUPPLIES<br />
PW-Sewer<br />
OTHER/MISC. SUPPLIES Total<br />
37991 TAXES, CHARGES & FEES<br />
General Operations<br />
PW-Water<br />
TAXES, CHARGES & FEES Total<br />
37992 LICENSES/PERMITS<br />
Community and Recreation Services<br />
FY2012<br />
Actual<br />
Friday, April 26, 2013 77<br />
FY2013<br />
Amended<br />
<strong>FY2014</strong> CM<br />
<strong>Recommended</strong><br />
$<br />
Change<br />
%<br />
Change<br />
158,240 145,000 163,800 18,800 13%<br />
2,234 0 0 0 -<br />
2,234 0 0 0 -<br />
248 0 0 0 -<br />
248 0 0 0 -<br />
1,603 0 0 0 -<br />
1,603 0 0 0 -<br />
1,322 0 0 0 -<br />
1,322 0 0 0 -<br />
279 0 0 0 -<br />
279 0 0 0 -<br />
3,335 0 0 0 -<br />
3,335 0 0 0 -<br />
8,860 0 0 0 -<br />
8,860 0 0 0 -<br />
0 12,000 50,000 38,000 317%<br />
0 12,000 50,000 38,000 317%<br />
0 0 50,000 50,000 -<br />
0 0 50,000 50,000 -<br />
0 0 0 0 -<br />
0 0 0 0 -<br />
0 0 0 0 -<br />
0 0 0 0 -<br />
0 0 0 0 -<br />
0 0 0 0 -<br />
0 0 0 0 -<br />
2,463 0 400 400 -
Object Object Description<br />
Community Initiatives<br />
Information Services<br />
PW-Replenishment<br />
PW-Sewer<br />
LICENSES/PERMITS Total<br />
37996 PACKAGING SUPPLIES<br />
Police<br />
PACKAGING SUPPLIES Total<br />
37997 TRAINING & EDUCATION SUPPLIES<br />
Community and Recreation Services<br />
Community Development<br />
Community Initiatives<br />
Finance<br />
Fire-Emergency Services<br />
Human Resources<br />
Information Services<br />
Management & <strong>Budget</strong><br />
Police<br />
PW-Facilities<br />
PW-Replenishment<br />
PW-Sanitation<br />
PW-Sewer<br />
PW-Stormwater<br />
PW-Streets<br />
PW-Transportation<br />
PW-Water<br />
TRAINING & EDUCATION SUPPLIES To<br />
37998 PHOTOGRAPHY SUPPLIES<br />
<strong>City</strong> Manager<br />
Communications<br />
Community and Recreation Services<br />
Community Development<br />
Fire-Emergency Services<br />
Management & <strong>Budget</strong><br />
Police<br />
PW-Development Engineering<br />
PW-Facilities<br />
PW-Replenishment<br />
PW-Sewer<br />
PW-Streets<br />
PW-Transportation<br />
PW-Water<br />
PHOTOGRAPHY SUPPLIES Total<br />
37999 OTHER OPERATIONAL SUPPLIES<br />
<strong>City</strong> Clerk<br />
FY2012<br />
Actual<br />
Friday, April 26, 2013 78<br />
FY2013<br />
Amended<br />
<strong>FY2014</strong> CM<br />
<strong>Recommended</strong><br />
$<br />
Change<br />
%<br />
Change<br />
0 0 0 0 -<br />
0 0 0 0 -<br />
0 0 0 0 -<br />
0 0 0 0 -<br />
2,463 0 400 400 -<br />
2,728 5,000 5,000 0 0%<br />
2,728 5,000 5,000 0 0%<br />
956 1,400 1,400 0 0%<br />
0 0 0 0 -<br />
0 0 0 0 -<br />
0 0 0 0 -<br />
4,557 10,500 16,600 6,100 58%<br />
16,751 87,600 4,000 -83,600 -95%<br />
1,011 1,000 1,000 0 0%<br />
0 0 0 0 -<br />
1,033 500 500 0 0%<br />
0 0 0 0 -<br />
0 0 0 0 -<br />
0 0 0 0 -<br />
1,412 300 300 0 0%<br />
773 200 200 0 0%<br />
613 900 900 0 0%<br />
0 0 0 0 -<br />
912 6,700 5,100 -1,600 -24%<br />
28,019 109,100 30,000 -79,100 -73%<br />
0 3,600 3,600 0 0%<br />
3,274 0 0 0 -<br />
689 3,100 3,000 -100 -3%<br />
223 500 500 0 0%<br />
523 2,800 2,100 -700 -25%<br />
0 0 0 0 -<br />
543 1,000 1,000 0 0%<br />
0 0 0 0 -<br />
0 0 100 100 -<br />
0 0 0 0 -<br />
0 200 100 -100 -50%<br />
305 0 0 0 -<br />
0 0 0 0 -<br />
567 500 500 0 0%<br />
6,124 11,700 10,900 -800 -7%<br />
1,316 0 0 0 -
Object Object Description<br />
<strong>City</strong> Court<br />
<strong>City</strong> Manager<br />
Communications<br />
Community and Recreation Services<br />
Community Development<br />
Community Initiatives<br />
Economic Development<br />
Finance<br />
Fire-Emergency Services<br />
Human Resources<br />
Information Services<br />
Legal<br />
Management & <strong>Budget</strong><br />
Mayor & Council<br />
Police<br />
PW-Development Engineering<br />
PW-Facilities<br />
PW-Sanitation<br />
PW-Sewer<br />
PW-Stormwater<br />
PW-Streets<br />
PW-Transportation<br />
PW-Vehicle Maintenance<br />
PW-Water<br />
OTHER OPERATIONAL SUPPLIES Total<br />
38111 DIST. 1-TRAVEL & TRAINING FUND<br />
Mayor & Council<br />
DIST. 1-TRAVEL & TRAINING FUND Tot<br />
38112 DIST. 2-TRAVEL & TRAINING FUND<br />
Mayor & Council<br />
DIST. 2-TRAVEL & TRAINING FUND Tot<br />
38113 DIST. 3-TRAVEL & TRAINING FUND<br />
Mayor & Council<br />
DIST. 3-TRAVEL & TRAINING FUND Tot<br />
38114 DIST. 4-TRAVEL & TRAINING FUND<br />
Mayor & Council<br />
DIST. 4-TRAVEL & TRAINING FUND Tot<br />
38115 DIST. 5-TRAVEL & TRAINING FUND<br />
Mayor & Council<br />
DIST. 5-TRAVEL & TRAINING FUND Tot<br />
38116 DIST. 6-TRAVEL & TRAINING FUND<br />
Mayor & Council<br />
DIST. 6-TRAVEL & TRAINING FUND Tot<br />
38117 MAYOR TRAVEL & TRAINING FUND<br />
FY2012<br />
Actual<br />
Friday, April 26, 2013 79<br />
FY2013<br />
Amended<br />
<strong>FY2014</strong> CM<br />
<strong>Recommended</strong><br />
$<br />
Change<br />
%<br />
Change<br />
331 0 0 0 -<br />
70 0 0 0 -<br />
755 0 0 0 -<br />
101 0 0 0 -<br />
397 0 0 0 -<br />
0 0 0 0 -<br />
0 0 0 0 -<br />
-437 200 200 0 0%<br />
655 0 0 0 -<br />
1,261 500 500 0 0%<br />
-179 2,000 1,000 -1,000 -50%<br />
35 0 0 0 -<br />
0 0 0 0 -<br />
0 0 0 0 -<br />
527 0 0 0 -<br />
0 0 0 0 -<br />
0 0 0 0 -<br />
233 0 0 0 -<br />
349 0 0 0 -<br />
0 0 0 0 -<br />
0 0 0 0 -<br />
0 0 0 0 -<br />
0 0 0 0 -<br />
75 0 0 0 -<br />
5,489 2,700 1,700 -1,000 -37%<br />
1,164 0 0 0 -<br />
1,164 0 0 0 -<br />
868 0 0 0 -<br />
868 0 0 0 -<br />
3,477 0 0 0 -<br />
3,477 0 0 0 -<br />
773 0 0 0 -<br />
773 0 0 0 -<br />
0 0 0 0 -<br />
0 0 0 0 -<br />
1,685 0 0 0 -<br />
1,685 0 0 0 -
Object Object Description<br />
Mayor & Council<br />
MAYOR TRAVEL & TRAINING FUND Tot<br />
38118 ELECTION EXPENSE<br />
<strong>City</strong> Clerk<br />
ELECTION EXPENSE Total<br />
38119 BOARDS & COMMISSIONS<br />
Government Relations<br />
Management & <strong>Budget</strong><br />
Mayor & Council<br />
BOARDS & COMMISSIONS Total<br />
38120 ADMINISTRATIVE<br />
PW-Sewer<br />
ADMINISTRATIVE Total<br />
38122 FINANCIAL SERVICES<br />
Finance<br />
General Operations<br />
PW-Streets<br />
FINANCIAL SERVICES Total<br />
38123 TAXES & SERVICE FEES<br />
<strong>City</strong> Court<br />
Communications<br />
Community and Recreation Services<br />
Finance<br />
General Operations<br />
Information Services<br />
Police<br />
PW-Development Engineering<br />
PW-Facilities<br />
PW-Sewer<br />
PW-Streets<br />
PW-Transportation<br />
PW-Vehicle Maintenance<br />
TAXES & SERVICE FEES Total<br />
38124 AUDIT SERVICES<br />
<strong>City</strong> Court<br />
<strong>City</strong> Manager<br />
Finance<br />
PW-Replenishment<br />
PW-Sanitation<br />
PW-Sewer<br />
PW-Stormwater<br />
PW-Water<br />
AUDIT SERVICES Total<br />
38125 LEGAL SERVICES<br />
FY2012<br />
Actual<br />
Friday, April 26, 2013 80<br />
FY2013<br />
Amended<br />
<strong>FY2014</strong> CM<br />
<strong>Recommended</strong><br />
$<br />
Change<br />
%<br />
Change<br />
9,100 0 0 0 -<br />
9,100 0 0 0 -<br />
248,556 0 0 0 -<br />
248,556 0 0 0 -<br />
0 0 0 0 -<br />
0 0 0 0 -<br />
0 5,000 50,000 45,000 900%<br />
0 5,000 50,000 45,000 900%<br />
0 0 0 0 -<br />
0 0 0 0 -<br />
45,219 53,200 53,200 0 0%<br />
0 0 0 0 -<br />
42,720 48,200 57,200 9,000 19%<br />
87,939 101,400 110,400 9,000 9%<br />
16,511 25,000 25,000 0 0%<br />
4 0 0 0 -<br />
79,267 114,500 98,000 -16,500 -14%<br />
59,134 500 500 0 0%<br />
0 0 0 0 -<br />
0 0 0 0 -<br />
61 0 0 0 -<br />
0 0 0 0 -<br />
0 0 0 0 -<br />
146,405 0 0 0 -<br />
0 0 0 0 -<br />
0 0 0 0 -<br />
170 0 0 0 -<br />
301,551 140,000 123,500 -16,500 -12%<br />
3,640 0 0 0 -<br />
0 0 0 0 -<br />
192,089 134,000 122,000 -12,000 -9%<br />
0 0 0 0 -<br />
0 0 0 0 -<br />
0 0 0 0 -<br />
0 0 0 0 -<br />
0 0 0 0 -<br />
195,729 134,000 122,000 -12,000 -9%
Object Object Description<br />
Community Development<br />
General Operations<br />
Government Relations<br />
Human Resources<br />
Legal<br />
Police<br />
PW-Sewer<br />
PW-Streets<br />
PW-Water<br />
LEGAL SERVICES Total<br />
38126 SERVICE AGREEMENTS<br />
<strong>City</strong> Clerk<br />
<strong>City</strong> Court<br />
<strong>City</strong> Manager<br />
Communications<br />
Community and Recreation Services<br />
Community Development<br />
Community Initiatives<br />
Finance<br />
Fire-Emergency Services<br />
General Operations<br />
Government Relations<br />
Human Resources<br />
Information Services<br />
Management & <strong>Budget</strong><br />
Police<br />
PW-Development Engineering<br />
PW-Facilities<br />
PW-Sanitation<br />
PW-Sewer<br />
PW-Streets<br />
PW-Transportation<br />
PW-Vehicle Maintenance<br />
PW-Water<br />
SERVICE AGREEMENTS Total<br />
38127 ECONOMIC DEVELOPMENT<br />
Community Development<br />
Economic Development<br />
Finance<br />
General Operations<br />
ECONOMIC DEVELOPMENT Total<br />
38128 RECORDING, LICENSE FEES<br />
<strong>City</strong> Clerk<br />
Community and Recreation Services<br />
Community Development<br />
Community Initiatives<br />
FY2012<br />
Actual<br />
Friday, April 26, 2013 81<br />
FY2013<br />
Amended<br />
<strong>FY2014</strong> CM<br />
<strong>Recommended</strong><br />
$<br />
Change<br />
%<br />
Change<br />
3,983 0 0 0 -<br />
0 0 0 0 -<br />
0 0 0 0 -<br />
32,145 20,000 20,000 0 0%<br />
73,845 106,500 106,500 0 0%<br />
0 0 0 0 -<br />
7 0 0 0 -<br />
0 0 0 0 -<br />
0 0 0 0 -<br />
109,980 126,500 126,500 0 0%<br />
0 0 0 0 -<br />
78,813 100,000 109,000 9,000 9%<br />
79 99,000 68,300 -30,700 -31%<br />
16,254 0 0 0 -<br />
567,020 635,600 1,129,100 493,500 78%<br />
5,052 4,500 4,500 0 0%<br />
0 0 0 0 -<br />
64,634 66,100 78,000 11,900 18%<br />
123,681 141,600 170,500 28,900 20%<br />
0 0 0 0 -<br />
42,593 0 0 0 -<br />
31,840 61,500 61,500 0 0%<br />
529,990 749,600 941,500 191,900 26%<br />
0 0 0 0 -<br />
290,954 277,100 146,300 -130,800 -47%<br />
576 1,100 18,100 17,000 1545%<br />
0 0 0 0 -<br />
8,187 79,600 75,900 -3,700 -5%<br />
7,861 42,800 48,500 5,700 13%<br />
32 24,000 8,600 -15,400 -64%<br />
306,005 311,800 664,300 352,500 113%<br />
0 0 0 0 -<br />
36,266 51,500 59,600 8,100 16%<br />
2,109,835 2,645,800 3,583,700 937,900 35%<br />
1,321,362 2,892,900 1,666,100 -1,226,800 -42%<br />
0 0 0 0 -<br />
208,454 0 0 0 -<br />
0 0 0 0 -<br />
1,529,816 2,892,900 1,666,100 -1,226,800 -42%<br />
223 500 500 0 0%<br />
1,396 2,900 2,700 -200 -7%<br />
11,479 11,000 11,000 0 0%<br />
0 0 0 0 -
Object Object Description<br />
General Operations<br />
Information Services<br />
PW-Development Engineering<br />
PW-Facilities<br />
PW-Replenishment<br />
PW-Sanitation<br />
PW-Sewer<br />
PW-Stormwater<br />
PW-Streets<br />
PW-Transportation<br />
PW-Vehicle Maintenance<br />
PW-Water<br />
RECORDING, LICENSE FEES Total<br />
38129 SOFTWARE LICENSES<br />
<strong>City</strong> Court<br />
<strong>City</strong> Manager<br />
Communications<br />
Community and Recreation Services<br />
Community Development<br />
Economic Development<br />
Finance<br />
Fire-Emergency Services<br />
Government Relations<br />
Human Resources<br />
Information Services<br />
Legal<br />
Management & <strong>Budget</strong><br />
Police<br />
PW-Development Engineering<br />
PW-Facilities<br />
PW-Sanitation<br />
PW-Sewer<br />
PW-Stormwater<br />
PW-Streets<br />
PW-Transportation<br />
PW-Vehicle Maintenance<br />
PW-Water<br />
SOFTWARE LICENSES Total<br />
38131 COLLECTION FEES-DELINQ. ACCTS<br />
Finance<br />
PW-Sanitation<br />
PW-Sewer<br />
PW-Streets<br />
PW-Water<br />
COLLECTION FEES-DELINQ. ACCTS To<br />
38141 ANIMAL CONTROL SERVICES<br />
FY2012<br />
Actual<br />
Friday, April 26, 2013 82<br />
FY2013<br />
Amended<br />
<strong>FY2014</strong> CM<br />
<strong>Recommended</strong><br />
$<br />
Change<br />
%<br />
Change<br />
46 0 0 0 -<br />
30 300 300 0 0%<br />
0 0 0 0 -<br />
0 0 0 0 -<br />
0 0 0 0 -<br />
7,770 5,100 7,000 1,900 37%<br />
46,067 55,900 56,000 100 0%<br />
12,000 14,800 14,000 -800 -5%<br />
100 2,000 2,000 0 0%<br />
2,678 2,400 2,400 0 0%<br />
0 0 0 0 -<br />
27,265 24,800 23,300 -1,500 -6%<br />
109,052 119,700 119,200 -500 0%<br />
863 1,000 1,000 0 0%<br />
0 16,300 15,100 -1,200 -7%<br />
5,787 0 0 0 -<br />
6,640 22,500 38,700 16,200 72%<br />
748 800 800 0 0%<br />
0 0 0 0 -<br />
33,677 65,200 103,800 38,600 59%<br />
37,061 49,400 44,700 -4,700 -10%<br />
219 0 0 0 -<br />
129,474 144,900 162,300 17,400 12%<br />
76,480 106,300 122,100 15,800 15%<br />
2,816 4,200 4,200 0 0%<br />
0 0 0 0 -<br />
12,356 0 900 900 -<br />
0 0 0 0 -<br />
4,270 0 300 300 -<br />
7,399 0 0 0 -<br />
16,316 10,000 10,600 600 6%<br />
202 0 0 0 -<br />
4,599 600 0 -600 -100%<br />
0 3,500 3,100 -400 -11%<br />
0 0 0 0 -<br />
15,625 3,500 4,000 500 14%<br />
354,533 428,200 511,600 83,400 19%<br />
0 0 0 0 -<br />
5 0 0 0 -<br />
8 500 500 0 0%<br />
0 0 0 0 -<br />
0 0 0 0 -<br />
13 500 500 0 0%
Object Object Description<br />
Police<br />
ANIMAL CONTROL SERVICES Total<br />
38142 JAIL SERVICES<br />
General Operations<br />
Police<br />
JAIL SERVICES Total<br />
38143 PUBLIC DEFENDER<br />
<strong>City</strong> Court<br />
General Operations<br />
PUBLIC DEFENDER Total<br />
38144 COURT REPORTERS<br />
<strong>City</strong> Court<br />
COURT REPORTERS Total<br />
38145 JURIES<br />
<strong>City</strong> Court<br />
JURIES Total<br />
38146 INTERPRETERS<br />
<strong>City</strong> Court<br />
Community and Recreation Services<br />
Management & <strong>Budget</strong><br />
Police<br />
INTERPRETERS Total<br />
38147 CODE ENFORCEMENT<br />
Community Development<br />
CODE ENFORCEMENT Total<br />
38149 ANNUAL FF PHYSICALS<br />
Fire-Emergency Services<br />
ANNUAL FF PHYSICALS Total<br />
38162 LANDSCAPE SERVICES<br />
Community and Recreation Services<br />
Finance<br />
PW-Replenishment<br />
PW-Sewer<br />
PW-Streets<br />
PW-Transportation<br />
PW-Water<br />
LANDSCAPE SERVICES Total<br />
38164 SURVEYING SERVICES<br />
Information Services<br />
SURVEYING SERVICES Total<br />
38181 GRANTS TO OUTSIDE AGENCIES<br />
<strong>City</strong> Clerk<br />
FY2012<br />
Actual<br />
Friday, April 26, 2013 83<br />
FY2013<br />
Amended<br />
<strong>FY2014</strong> CM<br />
<strong>Recommended</strong><br />
$<br />
Change<br />
%<br />
Change<br />
384 800 800 0 0%<br />
384 800 800 0 0%<br />
0 0 0 0 -<br />
728,088 728,000 788,000 60,000 8%<br />
728,088 728,000 788,000 60,000 8%<br />
191,650 194,500 194,500 0 0%<br />
0 0 0 0 -<br />
191,650 194,500 194,500 0 0%<br />
236 1,000 1,000 0 0%<br />
236 1,000 1,000 0 0%<br />
3,205 3,000 3,000 0 0%<br />
3,205 3,000 3,000 0 0%<br />
4,516 4,000 6,000 2,000 50%<br />
150 1,200 1,100 -100 -8%<br />
0 0 0 0 -<br />
1,918 3,000 3,000 0 0%<br />
6,584 8,200 10,100 1,900 23%<br />
33,787 50,000 50,000 0 0%<br />
33,787 50,000 50,000 0 0%<br />
77,850 97,500 97,500 0 0%<br />
77,850 97,500 97,500 0 0%<br />
140,829 139,500 139,500 0 0%<br />
0 0 0 0 -<br />
0 0 0 0 -<br />
600 1,900 1,900 0 0%<br />
496,458 633,900 693,900 60,000 9%<br />
8,025 10,100 9,500 -600 -6%<br />
24,897 20,500 20,500 0 0%<br />
670,809 805,900 865,300 59,400 7%<br />
0 0 0 0 -<br />
0 0 0 0 -<br />
0 0 0 0 -
Object Object Description<br />
General Operations<br />
Police<br />
GRANTS TO OUTSIDE AGENCIES Total<br />
38183 COMMUNITY RELATIONS SERVICES<br />
Arts Commission<br />
<strong>City</strong> Manager<br />
Communications<br />
Community and Recreation Services<br />
Community Development<br />
Community Initiatives<br />
Economic Development<br />
Government Relations<br />
Mayor & Council<br />
Police<br />
PW-Development Engineering<br />
COMMUNITY RELATIONS SERVICES T<br />
38184 ADMISSIONS<br />
Community and Recreation Services<br />
ADMISSIONS Total<br />
38191 PRE-EMPLOYMENT SERVICES<br />
<strong>City</strong> Court<br />
<strong>City</strong> Manager<br />
Communications<br />
Community and Recreation Services<br />
Community Development<br />
Community Initiatives<br />
Economic Development<br />
Finance<br />
Fire-Emergency Services<br />
General Operations<br />
Government Relations<br />
Human Resources<br />
Information Services<br />
Legal<br />
Management & <strong>Budget</strong><br />
Mayor & Council<br />
Police<br />
PW-Development Engineering<br />
PW-Facilities<br />
PW-Sanitation<br />
PW-Sewer<br />
PW-Streets<br />
PW-Transportation<br />
PW-Vehicle Maintenance<br />
PW-Water<br />
PRE-EMPLOYMENT SERVICES Total<br />
FY2012<br />
Actual<br />
Friday, April 26, 2013 84<br />
FY2013<br />
Amended<br />
<strong>FY2014</strong> CM<br />
<strong>Recommended</strong><br />
$<br />
Change<br />
%<br />
Change<br />
0 0 0 0 -<br />
0 0 0 0 -<br />
0 0 0 0 -<br />
26,430 0 0 0 -<br />
0 1,600 1,600 0 0%<br />
22,482 0 0 0 -<br />
77,374 52,800 38,000 -14,800 -28%<br />
14,518 14,000 14,000 0 0%<br />
0 0 0 0 -<br />
0 0 0 0 -<br />
1,759 0 0 0 -<br />
10,071 6,000 6,000 0 0%<br />
1,000 0 0 0 -<br />
100,000 0 0 0 -<br />
253,634 74,400 59,600 -14,800 -20%<br />
61,043 33,100 37,100 4,000 12%<br />
61,043 33,100 37,100 4,000 12%<br />
156 0 0 0 -<br />
5 0 0 0 -<br />
240 0 0 0 -<br />
17,523 9,400 5,900 -3,500 -37%<br />
1,936 0 0 0 -<br />
0 0 0 0 -<br />
0 0 0 0 -<br />
1,416 0 0 0 -<br />
10,271 0 0 0 -<br />
0 0 0 0 -<br />
139 0 0 0 -<br />
6,913 29,000 29,000 0 0%<br />
577 0 0 0 -<br />
361 0 0 0 -<br />
0 0 0 0 -<br />
290 0 0 0 -<br />
21,210 10,300 10,300 0 0%<br />
0 0 0 0 -<br />
473 0 500 500 -<br />
57 800 800 0 0%<br />
1,267 2,500 1,000 -1,500 -60%<br />
923 0 0 0 -<br />
312 0 0 0 -<br />
5 0 0 0 -<br />
1,505 1,500 1,500 0 0%<br />
65,580 53,500 49,000 -4,500 -8%
Object Object Description<br />
38192 LAB SERVICES<br />
Community and Recreation Services<br />
Police<br />
PW-Development Engineering<br />
PW-Replenishment<br />
PW-Sanitation<br />
PW-Sewer<br />
PW-Streets<br />
PW-Water<br />
LAB SERVICES Total<br />
38193 FILM SERVICES<br />
Communications<br />
Community and Recreation Services<br />
Community Development<br />
Fire-Emergency Services<br />
PW-Streets<br />
FILM SERVICES Total<br />
38194 REAL PROPERTY SERVICES<br />
Information Services<br />
PW-Transportation<br />
REAL PROPERTY SERVICES Total<br />
38195 GIS SERVICES<br />
Information Services<br />
GIS SERVICES Total<br />
38196 AERIAL PHOTOGRAPHY<br />
Information Services<br />
AERIAL PHOTOGRAPHY Total<br />
38197 SPORTING OFFICIALS<br />
Community and Recreation Services<br />
SPORTING OFFICIALS Total<br />
38198 CLASS INSTRUCTORS<br />
FY2012<br />
Actual<br />
Community and Recreation Services<br />
CLASS INSTRUCTORS Total<br />
38199 PROFESSIONAL AND OUTSIDE SERVICE<br />
<strong>City</strong> Clerk<br />
<strong>City</strong> Court<br />
<strong>City</strong> Manager<br />
Communications<br />
Community and Recreation Services<br />
Community Development<br />
Community Initiatives<br />
Economic Development<br />
Finance<br />
Friday, April 26, 2013 85<br />
FY2013<br />
Amended<br />
<strong>FY2014</strong> CM<br />
<strong>Recommended</strong><br />
$<br />
Change<br />
%<br />
Change<br />
2,560 3,800 3,800 0 0%<br />
0 0 0 0 -<br />
0 0 0 0 -<br />
0 0 0 0 -<br />
662 0 0 0 -<br />
73,770 63,200 63,200 0 0%<br />
662 0 0 0 -<br />
82,295 77,100 86,600 9,500 12%<br />
159,948 144,100 153,600 9,500 7%<br />
179 0 0 0 -<br />
3,153 2,700 2,200 -500 -19%<br />
0 0 0 0 -<br />
0 0 0 0 -<br />
0 0 0 0 -<br />
3,332 2,700 2,200 -500 -19%<br />
6,260 16,000 16,000 0 0%<br />
13,500 0 0 0 -<br />
19,760 16,000 16,000 0 0%<br />
28,785 30,000 30,000 0 0%<br />
28,785 30,000 30,000 0 0%<br />
44,890 6,000 6,000 0 0%<br />
44,890 6,000 6,000 0 0%<br />
0 244,700 240,300 -4,400 -2%<br />
0 244,700 240,300 -4,400 -2%<br />
0 83,100 86,100 3,000 4%<br />
0 83,100 86,100 3,000 4%<br />
0 0 0 0 -<br />
8 0 0 0 -<br />
10,232 51,000 73,000 22,000 43%<br />
26,642 0 0 0 -<br />
933,600 509,400 989,700 480,300 94%<br />
651,519 686,200 573,300 -112,900 -16%<br />
0 0 0 0 -<br />
0 0 0 0 -<br />
137,699 507,800 873,500 365,700 72%
Object Object Description<br />
Fire-Emergency Services<br />
General Operations<br />
Government Relations<br />
Human Resources<br />
Information Services<br />
Legal<br />
Management & <strong>Budget</strong><br />
Mayor & Council<br />
Police<br />
PW-Development Engineering<br />
PW-Facilities<br />
PW-Replenishment<br />
PW-Sanitation<br />
PW-Sewer<br />
PW-Stormwater<br />
PW-Streets<br />
PW-Transportation<br />
PW-Vehicle Maintenance<br />
PW-Water<br />
PROFESSIONAL AND OUTSIDE SERVIC<br />
38211 WATER<br />
<strong>City</strong> Court<br />
Community and Recreation Services<br />
Community Development<br />
Community Initiatives<br />
Fire-Emergency Services<br />
Police<br />
PW-Facilities<br />
PW-Replenishment<br />
PW-Sewer<br />
PW-Streets<br />
PW-Transportation<br />
PW-Vehicle Maintenance<br />
PW-Water<br />
WATER Total<br />
38212 ELECTRICITY<br />
<strong>City</strong> Court<br />
Community and Recreation Services<br />
Community Development<br />
Community Initiatives<br />
Fire-Emergency Services<br />
General Operations<br />
Police<br />
PW-Facilities<br />
PW-Sanitation<br />
PW-Sewer<br />
FY2012<br />
Actual<br />
Friday, April 26, 2013 86<br />
FY2013<br />
Amended<br />
<strong>FY2014</strong> CM<br />
<strong>Recommended</strong><br />
$<br />
Change<br />
%<br />
Change<br />
12,680 19,000 19,000 0 0%<br />
3,000 0 0 0 -<br />
8,595 0 0 0 -<br />
202,128 134,000 212,500 78,500 59%<br />
43,746 78,000 78,000 0 0%<br />
0 0 0 0 -<br />
0 0 0 0 -<br />
10,000 0 0 0 -<br />
9,800 7,700 7,700 0 0%<br />
90,405 77,500 22,500 -55,000 -71%<br />
32,886 17,800 17,800 0 0%<br />
0 0 195,000 195,000 -<br />
88,369 0 0 0 -<br />
223,331 396,700 446,800 50,100 13%<br />
0 500 500 0 0%<br />
29,676 40,900 41,500 600 1%<br />
364,238 917,500 831,100 -86,400 -9%<br />
0 0 0 0 -<br />
425,685 232,500 616,700 384,200 165%<br />
3,304,238 3,676,500 4,998,600 1,322,100 36%<br />
0 0 0 0 -<br />
411,243 481,000 525,700 44,700 9%<br />
1,443 5,500 5,200 -300 -5%<br />
0 0 0 0 -<br />
29,942 29,400 31,500 2,100 7%<br />
561 1,500 1,600 100 7%<br />
84,774 80,000 91,000 11,000 14%<br />
0 0 0 0 -<br />
131,564 137,000 106,100 -30,900 -23%<br />
74,261 98,700 133,900 35,200 36%<br />
11,911 4,300 13,600 9,300 216%<br />
2,339 3,000 4,100 1,100 37%<br />
752,031 772,900 811,100 38,200 5%<br />
1,500,070 1,613,300 1,723,800 110,500 7%<br />
0 0 0 0 -<br />
1,133,155 1,039,900 1,199,000 159,100 15%<br />
107,849 89,000 87,200 -1,800 -2%<br />
0 0 0 0 -<br />
134,905 131,300 143,200 11,900 9%<br />
0 0 0 0 -<br />
0 0 0 0 -<br />
458,881 443,100 577,700 134,600 30%<br />
4,269 6,000 6,600 600 10%<br />
883,841 907,000 987,800 80,800 9%
Object Object Description<br />
PW-Streets<br />
PW-Transportation<br />
PW-Vehicle Maintenance<br />
PW-Water<br />
ELECTRICITY Total<br />
38213 PROPANE/NATURAL GAS<br />
Community and Recreation Services<br />
Community Development<br />
Community Initiatives<br />
Fire-Emergency Services<br />
PW-Facilities<br />
PW-Sewer<br />
PROPANE/NATURAL GAS Total<br />
38214 TELEPHONE SERVICE<br />
Community and Recreation Services<br />
Community Development<br />
Economic Development<br />
Fire-Emergency Services<br />
General Operations<br />
Information Services<br />
Mayor & Council<br />
Police<br />
PW-Facilities<br />
PW-Sewer<br />
PW-Water<br />
TELEPHONE SERVICE Total<br />
38216 SANITARY/LANDFILL<br />
Community and Recreation Services<br />
Community Development<br />
Community Initiatives<br />
Fire-Emergency Services<br />
Police<br />
PW-Facilities<br />
PW-Sanitation<br />
PW-Sewer<br />
PW-Streets<br />
PW-Transportation<br />
PW-Vehicle Maintenance<br />
PW-Water<br />
SANITARY/LANDFILL Total<br />
38217 POSTAGE & MAILINGS<br />
<strong>City</strong> Clerk<br />
<strong>City</strong> Court<br />
<strong>City</strong> Manager<br />
Communications<br />
FY2012<br />
Actual<br />
Friday, April 26, 2013 87<br />
FY2013<br />
Amended<br />
<strong>FY2014</strong> CM<br />
<strong>Recommended</strong><br />
$<br />
Change<br />
%<br />
Change<br />
2,771,683 3,074,100 3,171,800 97,700 3%<br />
128,362 129,900 153,900 24,000 18%<br />
18,934 19,300 23,600 4,300 22%<br />
903,579 840,000 915,600 75,600 9%<br />
6,545,457 6,679,600 7,266,400 586,800 9%<br />
30,551 55,600 55,300 -300 -1%<br />
499 0 600 600 -<br />
0 0 0 0 -<br />
16,936 16,500 16,500 0 0%<br />
30,316 45,000 35,000 -10,000 -22%<br />
769 1,400 1,400 0 0%<br />
79,071 118,500 108,800 -9,700 -8%<br />
9,125 14,600 14,000 -600 -4%<br />
937 1,000 1,000 0 0%<br />
0 0 0 0 -<br />
1,395 1,500 1,500 0 0%<br />
0 0 0 0 -<br />
260,957 285,000 271,100 -13,900 -5%<br />
0 0 0 0 -<br />
4,936 0 0 0 -<br />
851 900 900 0 0%<br />
2,644 5,500 5,500 0 0%<br />
15,328 16,700 16,700 0 0%<br />
296,173 325,200 310,700 -14,500 -4%<br />
51,031 46,800 46,800 0 0%<br />
2,230 4,200 4,200 0 0%<br />
0 0 0 0 -<br />
4,613 4,500 4,500 0 0%<br />
2,627 2,000 2,000 0 0%<br />
9,545 10,500 9,500 -1,000 -10%<br />
715,495 773,300 773,300 0 0%<br />
233,395 240,000 240,000 0 0%<br />
66,209 51,900 63,200 11,300 22%<br />
164 200 200 0 0%<br />
945 700 1,200 500 71%<br />
41,235 25,000 25,000 0 0%<br />
1,127,489 1,159,100 1,169,900 10,800 1%<br />
262 1,100 1,100 0 0%<br />
8,517 11,000 11,000 0 0%<br />
5 33,800 33,800 0 0%<br />
30,814 0 0 0 -
Object Object Description<br />
Community and Recreation Services<br />
Community Development<br />
Community Initiatives<br />
Economic Development<br />
Finance<br />
Fire-Emergency Services<br />
Government Relations<br />
Human Resources<br />
Information Services<br />
Legal<br />
Management & <strong>Budget</strong><br />
Mayor & Council<br />
Police<br />
PW-Development Engineering<br />
PW-Facilities<br />
PW-Replenishment<br />
PW-Sanitation<br />
PW-Sewer<br />
PW-Stormwater<br />
PW-Streets<br />
PW-Transportation<br />
PW-Vehicle Maintenance<br />
PW-Water<br />
POSTAGE & MAILINGS Total<br />
38218 TELEPHONE MAINTENANCE<br />
Information Services<br />
TELEPHONE MAINTENANCE Total<br />
38221 CELL PHONE/PAGERS<br />
<strong>City</strong> Clerk<br />
<strong>City</strong> Court<br />
<strong>City</strong> Manager<br />
Community and Recreation Services<br />
Community Development<br />
Community Initiatives<br />
Economic Development<br />
Finance<br />
Fire-Emergency Services<br />
Government Relations<br />
Human Resources<br />
Information Services<br />
Mayor & Council<br />
Police<br />
PW-Development Engineering<br />
PW-Facilities<br />
PW-Sanitation<br />
PW-Sewer<br />
FY2012<br />
Actual<br />
Friday, April 26, 2013 88<br />
FY2013<br />
Amended<br />
<strong>FY2014</strong> CM<br />
<strong>Recommended</strong><br />
$<br />
Change<br />
%<br />
Change<br />
35,267 48,500 52,500 4,000 8%<br />
14,112 17,100 17,000 -100 -1%<br />
0 0 0 0 -<br />
0 0 0 0 -<br />
15,030 18,600 18,600 0 0%<br />
824 1,200 1,200 0 0%<br />
15 0 0 0 -<br />
1,814 4,500 4,500 0 0%<br />
651 600 600 0 0%<br />
6,459 16,800 16,800 0 0%<br />
0 0 0 0 -<br />
54 100 100 0 0%<br />
8,800 10,000 10,000 0 0%<br />
36 400 400 0 0%<br />
83 100 100 0 0%<br />
0 0 0 0 -<br />
22 1,000 700 -300 -30%<br />
2,833 1,800 2,600 800 44%<br />
13 100 100 0 0%<br />
54 100 100 0 0%<br />
718 800 300 -500 -63%<br />
124 100 100 0 0%<br />
850 8,100 8,600 500 6%<br />
127,358 175,800 180,200 4,400 3%<br />
0 2,000 0 -2,000 -100%<br />
0 2,000 0 -2,000 -100%<br />
0 600 600 0 0%<br />
173 300 300 0 0%<br />
257 1,000 1,600 600 60%<br />
20,045 20,400 20,400 0 0%<br />
8,206 8,000 8,700 700 9%<br />
0 0 0 0 -<br />
0 0 0 0 -<br />
494 600 600 0 0%<br />
22,880 19,900 20,500 600 3%<br />
513 0 0 0 -<br />
0 0 0 0 -<br />
11,785 11,000 11,000 0 0%<br />
825 600 600 0 0%<br />
92,081 69,700 69,700 0 0%<br />
3,234 2,300 2,800 500 22%<br />
3,264 3,400 3,400 0 0%<br />
4,315 4,400 4,000 -400 -9%<br />
5,406 5,700 5,300 -400 -7%
Object Object Description<br />
PW-Streets<br />
PW-Transportation<br />
PW-Vehicle Maintenance<br />
PW-Water<br />
CELL PHONE/PAGERS Total<br />
38311 BUILDING MAINTENANCE<br />
Community and Recreation Services<br />
Community Development<br />
Community Initiatives<br />
Finance<br />
Fire-Emergency Services<br />
Human Resources<br />
Information Services<br />
Legal<br />
Management & <strong>Budget</strong><br />
PW-Facilities<br />
PW-Sewer<br />
PW-Streets<br />
PW-Transportation<br />
PW-Vehicle Maintenance<br />
PW-Water<br />
BUILDING MAINTENANCE Total<br />
38312 STREETS MAINTENANCE<br />
Community Development<br />
Finance<br />
Human Resources<br />
Management & <strong>Budget</strong><br />
PW-Development Engineering<br />
PW-Sewer<br />
PW-Streets<br />
PW-Transportation<br />
STREETS MAINTENANCE Total<br />
38321 RADIO EQUIP. MAINT.<br />
Community and Recreation Services<br />
Community Initiatives<br />
Finance<br />
Fire-Emergency Services<br />
Human Resources<br />
Management & <strong>Budget</strong><br />
Police<br />
PW-Facilities<br />
PW-Sanitation<br />
PW-Sewer<br />
PW-Streets<br />
PW-Transportation<br />
PW-Vehicle Maintenance<br />
FY2012<br />
Actual<br />
Friday, April 26, 2013 89<br />
FY2013<br />
Amended<br />
<strong>FY2014</strong> CM<br />
<strong>Recommended</strong><br />
$<br />
Change<br />
%<br />
Change<br />
10,759 6,800 5,200 -1,600 -24%<br />
6,926 7,900 6,100 -1,800 -23%<br />
1,524 1,600 1,400 -200 -13%<br />
9,023 10,600 8,000 -2,600 -25%<br />
201,710 174,800 170,200 -4,600 -3%<br />
283,447 276,400 276,400 0 0%<br />
7,896 8,000 8,000 0 0%<br />
0 0 0 0 -<br />
269 0 0 0 -<br />
0 0 0 0 -<br />
131,509 30,000 30,000 0 0%<br />
3,827 0 0 0 -<br />
1,598 0 0 0 -<br />
0 0 0 0 -<br />
140,783 100,000 100,000 0 0%<br />
1,847 6,000 3,000 -3,000 -50%<br />
3,638 0 0 0 -<br />
5,792 0 0 0 -<br />
212 0 0 0 -<br />
3,150 2,500 2,500 0 0%<br />
583,969 422,900 419,900 -3,000 -1%<br />
0 0 0 0 -<br />
0 0 0 0 -<br />
350 10,000 10,000 0 0%<br />
0 0 0 0 -<br />
10,790 0 0 0 -<br />
18,086 45,000 45,000 0 0%<br />
122,905 2,090,000 2,090,000 0 0%<br />
62,204 59,000 59,000 0 0%<br />
214,334 2,204,000 2,204,000 0 0%<br />
0 500 500 0 0%<br />
0 0 0 0 -<br />
0 0 0 0 -<br />
399 0 48,200 48,200 -<br />
0 10,000 10,000 0 0%<br />
0 0 0 0 -<br />
157,003 188,700 302,000 113,300 60%<br />
0 0 0 0 -<br />
12,380 0 13,000 13,000 -<br />
0 2,500 2,500 0 0%<br />
0 1,000 1,000 0 0%<br />
7,566 5,200 0 -5,200 -100%<br />
6,390 6,600 6,600 0 0%
Object Object Description<br />
RADIO EQUIP. MAINT. Total<br />
38322 COMPUTER MAINTENANCE<br />
<strong>City</strong> Court<br />
Finance<br />
Fire-Emergency Services<br />
Human Resources<br />
Information Services<br />
PW-Water<br />
COMPUTER MAINTENANCE Total<br />
38323 OFFICE EQUIPMENT MAINT.<br />
<strong>City</strong> Clerk<br />
<strong>City</strong> Court<br />
Community and Recreation Services<br />
Community Development<br />
Economic Development<br />
Fire-Emergency Services<br />
Human Resources<br />
Information Services<br />
Legal<br />
Management & <strong>Budget</strong><br />
Police<br />
PW-Development Engineering<br />
PW-Facilities<br />
PW-Sanitation<br />
PW-Sewer<br />
PW-Streets<br />
PW-Transportation<br />
PW-Vehicle Maintenance<br />
OFFICE EQUIPMENT MAINT. Total<br />
38324 MACHINERY & EQUIPMENT MAINT<br />
Communications<br />
Community and Recreation Services<br />
Community Initiatives<br />
Finance<br />
Fire-Emergency Services<br />
Human Resources<br />
Police<br />
PW-Facilities<br />
PW-Replenishment<br />
PW-Sanitation<br />
PW-Sewer<br />
PW-Streets<br />
PW-Transportation<br />
PW-Vehicle Maintenance<br />
PW-Water<br />
MACHINERY & EQUIPMENT MAINT Tot<br />
FY2012<br />
Actual<br />
Friday, April 26, 2013 90<br />
FY2013<br />
Amended<br />
<strong>FY2014</strong> CM<br />
<strong>Recommended</strong><br />
$<br />
Change<br />
%<br />
Change<br />
183,739 214,500 383,800 169,300 79%<br />
34,125 40,000 40,000 0 0%<br />
0 500 500 0 0%<br />
0 0 65,800 65,800 -<br />
0 10,000 10,000 0 0%<br />
2,594 5,400 10,000 4,600 85%<br />
0 0 0 0 -<br />
36,719 55,900 126,300 70,400 126%<br />
0 500 500 0 0%<br />
0 500 500 0 0%<br />
0 500 500 0 0%<br />
419 1,300 1,300 0 0%<br />
0 0 0 0 -<br />
95 0 0 0 -<br />
84 11,200 11,200 0 0%<br />
0 1,500 1,000 -500 -33%<br />
0 200 200 0 0%<br />
0 0 0 0 -<br />
26 800 800 0 0%<br />
0 0 0 0 -<br />
367 1,000 500 -500 -50%<br />
0 1,000 1,000 0 0%<br />
115 0 0 0 -<br />
0 1,500 1,500 0 0%<br />
0 0 0 0 -<br />
370 0 0 0 -<br />
1,476 20,000 19,000 -1,000 -5%<br />
0 0 0 0 -<br />
5,350 13,700 15,100 1,400 10%<br />
0 0 0 0 -<br />
0 0 0 0 -<br />
35,499 17,200 35,600 18,400 107%<br />
14,722 15,000 15,000 0 0%<br />
6,973 4,000 4,000 0 0%<br />
87 1,200 1,500 300 25%<br />
0 0 0 0 -<br />
6,258 5,000 5,000 0 0%<br />
364,933 361,400 434,000 72,600 20%<br />
4,977 4,700 4,700 0 0%<br />
1,164 1,000 0 -1,000 -100%<br />
2,837 2,500 2,500 0 0%<br />
82,530 481,500 141,200 -340,300 -71%<br />
525,329 907,200 658,600 -248,600 -27%
Object Object Description<br />
38331 VEHICLE MAINTENANCE<br />
Community and Recreation Services<br />
Community Development<br />
Community Initiatives<br />
Finance<br />
Fire-Emergency Services<br />
Human Resources<br />
Information Services<br />
Management & <strong>Budget</strong><br />
Police<br />
PW-Development Engineering<br />
PW-Facilities<br />
PW-Replenishment<br />
PW-Sanitation<br />
PW-Sewer<br />
PW-Stormwater<br />
PW-Streets<br />
PW-Transportation<br />
PW-Vehicle Maintenance<br />
PW-Water<br />
VEHICLE MAINTENANCE Total<br />
38341 TRAFFIC SIGNAL R&M<br />
Human Resources<br />
PW-Transportation<br />
TRAFFIC SIGNAL R&M Total<br />
38351 WELLS/SEWER/LINS/ETC.<br />
Human Resources<br />
PW-Sewer<br />
PW-Water<br />
WELLS/SEWER/LINS/ETC. Total<br />
38361 BUILDING CONTRACTORS<br />
PW-Facilities<br />
BUILDING CONTRACTORS Total<br />
38371 JANITORIAL SERVICES<br />
Community and Recreation Services<br />
Community Development<br />
Community Initiatives<br />
PW-Facilities<br />
PW-Sewer<br />
PW-Water<br />
JANITORIAL SERVICES Total<br />
38372 PEST CONTROL SERVICES<br />
Community and Recreation Services<br />
Community Development<br />
FY2012<br />
Actual<br />
Friday, April 26, 2013 91<br />
FY2013<br />
Amended<br />
<strong>FY2014</strong> CM<br />
<strong>Recommended</strong><br />
$<br />
Change<br />
%<br />
Change<br />
2,287 13,000 13,000 0 0%<br />
139 0 0 0 -<br />
0 0 0 0 -<br />
14 0 0 0 -<br />
465 0 3,500 3,500 -<br />
9,264 10,000 10,000 0 0%<br />
0 0 0 0 -<br />
0 0 0 0 -<br />
820 0 0 0 -<br />
111 0 0 0 -<br />
523 300 0 -300 -100%<br />
0 0 0 0 -<br />
132,885 106,300 134,600 28,300 27%<br />
26,110 15,000 10,100 -4,900 -33%<br />
28 0 0 0 -<br />
45,678 47,000 40,600 -6,400 -14%<br />
10,919 132,600 7,900 -124,700 -94%<br />
149,926 90,900 186,900 96,000 106%<br />
8,086 2,800 7,500 4,700 168%<br />
387,255 417,900 414,100 -3,800 -1%<br />
0 15,000 15,000 0 0%<br />
170 0 0 0 -<br />
170 15,000 15,000 0 0%<br />
12,348 0 0 0 -<br />
264,656 374,100 406,100 32,000 9%<br />
177,489 100,000 153,000 53,000 53%<br />
454,494 474,100 559,100 85,000 18%<br />
111,532 170,300 159,700 -10,600 -6%<br />
111,532 170,300 159,700 -10,600 -6%<br />
82,902 96,900 97,900 1,000 1%<br />
0 2,400 2,400 0 0%<br />
0 0 0 0 -<br />
223,607 220,000 203,000 -17,000 -8%<br />
19,656 19,700 19,700 0 0%<br />
0 0 0 0 -<br />
326,165 339,000 323,000 -16,000 -5%<br />
15,890 17,800 17,400 -400 -2%<br />
200 1,200 1,200 0 0%
Object Object Description<br />
PW-Facilities<br />
PW-Sewer<br />
PW-Streets<br />
PW-Water<br />
PEST CONTROL SERVICES Total<br />
38381 GROUNDS MAINTENANCE<br />
Community and Recreation Services<br />
PW-Sewer<br />
PW-Streets<br />
PW-Water<br />
GROUNDS MAINTENANCE Total<br />
38382 PARKS MAINTENANCE<br />
General Operations<br />
PARKS MAINTENANCE Total<br />
38391 OTHER REPAIRS/MAINT.<br />
Community and Recreation Services<br />
Finance<br />
OTHER REPAIRS/MAINT. Total<br />
38411 WATER SERVICE CONTRACT<br />
PW-Water<br />
WATER SERVICE CONTRACT Total<br />
38412 SEWER SERVICE CONTRACT<br />
PW-Sewer<br />
SEWER SERVICE CONTRACT Total<br />
38413 TRASH COLLECTION CONTRACT<br />
Police<br />
PW-Facilities<br />
PW-Sanitation<br />
TRASH COLLECTION CONTRACT Total<br />
38511 BUILDING & STRUCTURES RENAL<br />
Communications<br />
Community and Recreation Services<br />
Community Development<br />
Community Initiatives<br />
Finance<br />
Information Services<br />
PW-Facilities<br />
PW-Streets<br />
BUILDING & STRUCTURES RENAL Tota<br />
38521 EQUIPMENT RENTAL<br />
<strong>City</strong> Clerk<br />
<strong>City</strong> Court<br />
Communications<br />
FY2012<br />
Actual<br />
Friday, April 26, 2013 92<br />
FY2013<br />
Amended<br />
<strong>FY2014</strong> CM<br />
<strong>Recommended</strong><br />
$<br />
Change<br />
%<br />
Change<br />
7,025 10,000 10,000 0 0%<br />
72,362 76,600 77,200 600 1%<br />
1,020 1,200 1,200 0 0%<br />
841 600 600 0 0%<br />
97,338 107,400 107,600 200 0%<br />
33,403 77,600 63,200 -14,400 -19%<br />
18,298 28,900 28,000 -900 -3%<br />
49,582 60,000 60,000 0 0%<br />
0 0 0 0 -<br />
101,284 166,500 151,200 -15,300 -9%<br />
0 0 47,700 47,700 -<br />
0 0 47,700 47,700 -<br />
0 0 0 0 -<br />
425 0 0 0 -<br />
425 0 0 0 -<br />
1,307,782 1,380,000 1,330,000 -50,000 -4%<br />
1,307,782 1,380,000 1,330,000 -50,000 -4%<br />
456,679 530,000 520,000 -10,000 -2%<br />
456,679 530,000 520,000 -10,000 -2%<br />
0 0 0 0 -<br />
0 0 0 0 -<br />
362,115 410,000 410,000 0 0%<br />
362,115 410,000 410,000 0 0%<br />
0 0 0 0 -<br />
16,088 15,500 15,500 0 0%<br />
247 0 0 0 -<br />
0 0 0 0 -<br />
0 0 0 0 -<br />
0 0 0 0 -<br />
13,487 12,000 36,000 24,000 200%<br />
0 0 0 0 -<br />
29,822 27,500 51,500 24,000 87%<br />
0 0 0 0 -<br />
0 0 0 0 -<br />
0 0 0 0 -
Object Object Description<br />
Community and Recreation Services<br />
Community Development<br />
Community Initiatives<br />
Finance<br />
Fire-Emergency Services<br />
Information Services<br />
Police<br />
PW-Facilities<br />
PW-Replenishment<br />
PW-Sanitation<br />
PW-Sewer<br />
PW-Streets<br />
PW-Transportation<br />
PW-Vehicle Maintenance<br />
PW-Water<br />
EQUIPMENT RENTAL Total<br />
38591 OTHER RENTALS/LEASES<br />
<strong>City</strong> Clerk<br />
Community and Recreation Services<br />
Community Development<br />
Community Initiatives<br />
Finance<br />
Fire-Emergency Services<br />
General Operations<br />
Information Services<br />
Mayor & Council<br />
Police<br />
PW-Facilities<br />
PW-Sewer<br />
PW-Streets<br />
PW-Water<br />
OTHER RENTALS/LEASES Total<br />
38911 UNEMPLOYMENT CONTRIBUTION<br />
General Operations<br />
Human Resources<br />
UNEMPLOYMENT CONTRIBUTION Tota<br />
38912 GENERAL INSURANCE<br />
<strong>City</strong> Clerk<br />
<strong>City</strong> Court<br />
<strong>City</strong> Manager<br />
Communications<br />
Community and Recreation Services<br />
Community Development<br />
Community Initiatives<br />
Finance<br />
Fire-Emergency Services<br />
FY2012<br />
Actual<br />
Friday, April 26, 2013 93<br />
FY2013<br />
Amended<br />
<strong>FY2014</strong> CM<br />
<strong>Recommended</strong><br />
$<br />
Change<br />
%<br />
Change<br />
314,645 296,400 313,400 17,000 6%<br />
5,624 6,800 6,800 0 0%<br />
0 0 0 0 -<br />
624 0 0 0 -<br />
52 200 200 0 0%<br />
104,271 126,000 126,000 0 0%<br />
0 0 0 0 -<br />
762 2,000 2,000 0 0%<br />
0 0 0 0 -<br />
98 0 0 0 -<br />
95,860 93,500 48,700 -44,800 -48%<br />
986 6,000 6,000 0 0%<br />
1,265 400 400 0 0%<br />
0 0 0 0 -<br />
3,370 5,000 5,000 0 0%<br />
527,558 536,300 508,500 -27,800 -5%<br />
0 0 0 0 -<br />
221,037 268,600 248,600 -20,000 -7%<br />
1,138 800 0 -800 -100%<br />
0 0 0 0 -<br />
0 0 0 0 -<br />
0 0 0 0 -<br />
0 0 0 0 -<br />
6,600 6,300 6,300 0 0%<br />
57 0 0 0 -<br />
816 1,000 1,000 0 0%<br />
0 0 0 0 -<br />
2,293 0 0 0 -<br />
2,897 3,000 3,000 0 0%<br />
0 0 1,300 1,300 -<br />
234,839 279,700 260,200 -19,500 -7%<br />
0 0 0 0 -<br />
56,118 132,000 132,000 0 0%<br />
56,118 132,000 132,000 0 0%<br />
3,300 3,500 3,500 0 0%<br />
7,500 8,000 8,000 0 0%<br />
3,700 7,700 7,700 0 0%<br />
2,700 0 0 0 -<br />
205,665 289,500 289,500 0 0%<br />
22,800 24,200 24,200 0 0%<br />
0 0 0 0 -<br />
8,900 9,500 9,500 0 0%<br />
189,800 201,800 201,800 0 0%
Object Object Description<br />
General Operations<br />
Government Relations<br />
Information Services<br />
Legal<br />
Mayor & Council<br />
Police<br />
PW-Development Engineering<br />
PW-Facilities<br />
PW-Replenishment<br />
PW-Sanitation<br />
PW-Sewer<br />
PW-Stormwater<br />
PW-Streets<br />
PW-Transportation<br />
PW-Vehicle Maintenance<br />
PW-Water<br />
GENERAL INSURANCE Total<br />
38913 CLAIM SETTLEMENT<br />
Human Resources<br />
CLAIM SETTLEMENT Total<br />
38914 COBRA INSURANCE<br />
Human Resources<br />
COBRA INSURANCE Total<br />
38915 MEDICAL INSURANCE PREMIUM<br />
Community and Recreation Services<br />
Human Resources<br />
MEDICAL INSURANCE PREMIUM Total<br />
38916 EVENT GENERAL INSURANCE<br />
Community and Recreation Services<br />
EVENT GENERAL INSURANCE Total<br />
38917 GENERAL INSURANCE ADMIN<br />
Human Resources<br />
GENERAL INSURANCE ADMIN Total<br />
38921 TUITION REIMBURSEMENT<br />
Community and Recreation Services<br />
Finance<br />
Fire-Emergency Services<br />
General Operations<br />
Human Resources<br />
Information Services<br />
Legal<br />
Police<br />
PW-Sewer<br />
PW-Water<br />
FY2012<br />
Actual<br />
Friday, April 26, 2013 94<br />
FY2013<br />
Amended<br />
<strong>FY2014</strong> CM<br />
<strong>Recommended</strong><br />
$<br />
Change<br />
%<br />
Change<br />
0 0 0 0 -<br />
800 0 0 0 -<br />
8,200 8,700 8,700 0 0%<br />
6,700 7,100 7,100 0 0%<br />
3,200 3,400 3,400 0 0%<br />
212,600 226,100 226,100 0 0%<br />
12,900 13,700 13,700 0 0%<br />
71,400 75,900 75,900 0 0%<br />
0 0 0 0 -<br />
39,700 42,200 42,200 0 0%<br />
394,800 419,800 419,800 0 0%<br />
900 1,000 1,000 0 0%<br />
50,600 53,800 53,800 0 0%<br />
25,000 26,600 26,600 0 0%<br />
25,300 26,900 26,900 0 0%<br />
141,600 150,600 150,600 0 0%<br />
1,438,065 1,600,000 1,600,000 0 0%<br />
6,025,315 7,587,500 8,061,400 473,900 6%<br />
6,025,315 7,587,500 8,061,400 473,900 6%<br />
14,131 15,700 15,700 0 0%<br />
14,131 15,700 15,700 0 0%<br />
1,000 0 0 0 -<br />
802,942 882,300 927,800 45,500 5%<br />
803,942 882,300 927,800 45,500 5%<br />
0 68,900 3,300 -65,600 -95%<br />
0 68,900 3,300 -65,600 -95%<br />
0 0 1,000,000 1,000,000 -<br />
0 0 1,000,000 1,000,000 -<br />
0 0 0 0 -<br />
0 0 600 600 -<br />
912 0 0 0 -<br />
0 0 0 0 -<br />
120,001 80,000 80,000 0 0%<br />
0 0 0 0 -<br />
0 0 0 0 -<br />
0 0 0 0 -<br />
0 5,000 5,000 0 0%<br />
0 6,000 4,000 -2,000 -33%
Object Object Description<br />
TUITION REIMBURSEMENT Total<br />
38922 TRAVEL & TRAINING<br />
<strong>City</strong> Clerk<br />
<strong>City</strong> Court<br />
<strong>City</strong> Manager<br />
Communications<br />
Community and Recreation Services<br />
Community Development<br />
Community Initiatives<br />
Economic Development<br />
Finance<br />
Fire-Emergency Services<br />
Government Relations<br />
Human Resources<br />
Information Services<br />
Legal<br />
Management & <strong>Budget</strong><br />
Police<br />
PW-Development Engineering<br />
PW-Facilities<br />
PW-Replenishment<br />
PW-Sanitation<br />
PW-Sewer<br />
PW-Stormwater<br />
PW-Streets<br />
PW-Transportation<br />
PW-Vehicle Maintenance<br />
PW-Water<br />
TRAVEL & TRAINING Total<br />
38924 DUES & MEMBERSHIPS<br />
<strong>City</strong> Clerk<br />
<strong>City</strong> Court<br />
<strong>City</strong> Manager<br />
Communications<br />
Community and Recreation Services<br />
Community Development<br />
Community Initiatives<br />
Economic Development<br />
Finance<br />
Fire-Emergency Services<br />
General Operations<br />
Government Relations<br />
Human Resources<br />
Information Services<br />
Legal<br />
Management & <strong>Budget</strong><br />
FY2012<br />
Actual<br />
Friday, April 26, 2013 95<br />
FY2013<br />
Amended<br />
<strong>FY2014</strong> CM<br />
<strong>Recommended</strong><br />
$<br />
Change<br />
%<br />
Change<br />
120,913 91,000 89,600 -1,400 -2%<br />
80 700 2,400 1,700 243%<br />
7,256 13,300 13,300 0 0%<br />
11,349 20,900 25,800 4,900 23%<br />
180 0 0 0 -<br />
24,452 14,800 23,600 8,800 59%<br />
25,909 28,200 35,800 7,600 27%<br />
0 0 0 0 -<br />
0 0 0 0 -<br />
37,325 45,000 49,700 4,700 10%<br />
58,562 21,000 15,600 -5,400 -26%<br />
10,098 0 0 0 -<br />
23,117 15,300 15,800 500 3%<br />
26,085 18,300 18,300 0 0%<br />
6,753 11,800 11,800 0 0%<br />
0 0 0 0 -<br />
52,758 27,500 26,000 -1,500 -5%<br />
3,553 13,000 13,000 0 0%<br />
2,825 7,400 7,000 -400 -5%<br />
0 0 0 0 -<br />
5,220 12,500 12,700 200 2%<br />
20,717 33,800 71,900 38,100 113%<br />
849 1,400 1,400 0 0%<br />
1,762 4,700 4,700 0 0%<br />
7,448 9,200 8,800 -400 -4%<br />
296 2,000 2,000 0 0%<br />
15,345 40,700 39,900 -800 -2%<br />
341,937 341,500 399,500 58,000 17%<br />
606 700 700 0 0%<br />
2,406 3,200 3,200 0 0%<br />
71,107 81,700 80,800 -900 -1%<br />
1,823 0 0 0 -<br />
28,527 11,300 14,700 3,400 30%<br />
46,595 62,000 63,700 1,700 3%<br />
0 0 0 0 -<br />
0 0 0 0 -<br />
13,573 8,300 5,900 -2,400 -29%<br />
9,213 8,800 8,600 -200 -2%<br />
0 0 0 0 -<br />
0 0 0 0 -<br />
5,704 6,100 6,100 0 0%<br />
1,453 2,400 2,400 0 0%<br />
5,335 6,700 6,700 0 0%<br />
0 0 0 0 -
Object Object Description<br />
Mayor & Council<br />
Police<br />
PW-Development Engineering<br />
PW-Facilities<br />
PW-Replenishment<br />
PW-Sanitation<br />
PW-Sewer<br />
PW-Stormwater<br />
PW-Streets<br />
PW-Transportation<br />
PW-Vehicle Maintenance<br />
PW-Water<br />
DUES & MEMBERSHIPS Total<br />
38925 FEDERAL MILEAGE ALLOWANCE<br />
<strong>City</strong> Clerk<br />
<strong>City</strong> Court<br />
<strong>City</strong> Manager<br />
Communications<br />
Community and Recreation Services<br />
Community Development<br />
Community Initiatives<br />
Economic Development<br />
Finance<br />
Fire-Emergency Services<br />
Government Relations<br />
Human Resources<br />
Information Services<br />
Legal<br />
Management & <strong>Budget</strong><br />
Mayor & Council<br />
Police<br />
PW-Development Engineering<br />
PW-Facilities<br />
PW-Replenishment<br />
PW-Sanitation<br />
PW-Sewer<br />
PW-Streets<br />
PW-Transportation<br />
PW-Water<br />
FEDERAL MILEAGE ALLOWANCE Total<br />
38926 EMPLOYEE ORIENTATION<br />
Human Resources<br />
EMPLOYEE ORIENTATION Total<br />
38927 EMPLOYEE CERTS AND LICENSING<br />
Community and Recreation Services<br />
Community Development<br />
FY2012<br />
Actual<br />
Friday, April 26, 2013 96<br />
FY2013<br />
Amended<br />
<strong>FY2014</strong> CM<br />
<strong>Recommended</strong><br />
$<br />
Change<br />
%<br />
Change<br />
28,000 36,000 36,000 0 0%<br />
8,270 5,800 5,800 0 0%<br />
2,430 2,500 1,800 -700 -28%<br />
2,902 3,900 4,400 500 13%<br />
0 0 0 0 -<br />
2,856 1,600 3,200 1,600 100%<br />
3,248 4,100 3,600 -500 -12%<br />
2,087 2,600 2,600 0 0%<br />
1,939 2,000 2,000 0 0%<br />
3,220 4,900 4,200 -700 -14%<br />
3,180 1,300 1,300 0 0%<br />
14,565 16,800 15,700 -1,100 -7%<br />
259,039 272,700 273,400 700 0%<br />
0 0 0 0 -<br />
197 500 500 0 0%<br />
1,260 700 700 0 0%<br />
0 0 0 0 -<br />
1,852 1,400 1,400 0 0%<br />
102 400 600 200 50%<br />
0 0 0 0 -<br />
0 0 0 0 -<br />
979 1,300 1,300 0 0%<br />
282 200 200 0 0%<br />
54 0 0 0 -<br />
2,284 4,500 4,500 0 0%<br />
28 1,400 700 -700 -50%<br />
1,202 1,000 1,000 0 0%<br />
0 0 0 0 -<br />
4,082 5,000 5,000 0 0%<br />
165 200 200 0 0%<br />
458 100 0 -100 -100%<br />
0 0 0 0 -<br />
0 0 0 0 -<br />
93 0 0 0 -<br />
0 100 100 0 0%<br />
0 0 0 0 -<br />
302 600 500 -100 -17%<br />
88 300 300 0 0%<br />
13,428 17,700 17,000 -700 -4%<br />
374 1,500 500 -1,000 -67%<br />
374 1,500 500 -1,000 -67%<br />
1,935 5,900 4,500 -1,400 -24%<br />
110 0 0 0 -
Object Object Description<br />
Finance<br />
Fire-Emergency Services<br />
Human Resources<br />
Information Services<br />
Police<br />
PW-Development Engineering<br />
PW-Facilities<br />
PW-Sewer<br />
PW-Streets<br />
PW-Vehicle Maintenance<br />
PW-Water<br />
EMPLOYEE CERTS AND LICENSING To<br />
38928 COUNCIL TRAVEL & TRAINING<br />
Mayor & Council<br />
COUNCIL TRAVEL & TRAINING Total<br />
38931 ADVERTISING<br />
<strong>City</strong> Clerk<br />
<strong>City</strong> Manager<br />
Communications<br />
Community and Recreation Services<br />
Community Development<br />
Community Initiatives<br />
Economic Development<br />
Finance<br />
Fire-Emergency Services<br />
Human Resources<br />
Information Services<br />
Management & <strong>Budget</strong><br />
Police<br />
PW-Development Engineering<br />
PW-Replenishment<br />
PW-Sanitation<br />
PW-Sewer<br />
PW-Streets<br />
PW-Transportation<br />
PW-Water<br />
ADVERTISING Total<br />
38942 RADIO DISPATCH SERVICE<br />
Fire-Emergency Services<br />
RADIO DISPATCH SERVICE Total<br />
38951 PRINTING<br />
<strong>City</strong> Clerk<br />
<strong>City</strong> Court<br />
<strong>City</strong> Manager<br />
Communications<br />
FY2012<br />
Actual<br />
Friday, April 26, 2013 97<br />
FY2013<br />
Amended<br />
<strong>FY2014</strong> CM<br />
<strong>Recommended</strong><br />
$<br />
Change<br />
%<br />
Change<br />
300 1,900 1,200 -700 -37%<br />
0 27,100 33,300 6,200 23%<br />
450 0 0 0 -<br />
24 0 0 0 -<br />
568 0 0 0 -<br />
0 0 700 700 -<br />
200 0 0 0 -<br />
87 0 1,600 1,600 -<br />
0 0 0 0 -<br />
162 0 0 0 -<br />
324 0 1,200 1,200 -<br />
4,160 34,900 42,500 7,600 22%<br />
0 46,000 46,000 0 0%<br />
0 46,000 46,000 0 0%<br />
21,838 38,000 40,000 2,000 5%<br />
0 20,000 20,000 0 0%<br />
19,493 0 0 0 -<br />
157,769 145,400 143,400 -2,000 -1%<br />
9,630 13,000 13,000 0 0%<br />
0 0 0 0 -<br />
0 0 0 0 -<br />
1,955 1,500 1,000 -500 -33%<br />
0 0 0 0 -<br />
5,701 0 0 0 -<br />
389 0 0 0 -<br />
0 0 0 0 -<br />
4,126 1,000 1,000 0 0%<br />
0 0 0 0 -<br />
0 0 0 0 -<br />
29,045 13,000 13,000 0 0%<br />
436 0 0 0 -<br />
0 300 300 0 0%<br />
0 0 0 0 -<br />
2,688 1,500 2,500 1,000 67%<br />
253,069 233,700 234,200 500 0%<br />
520,372 570,800 615,400 44,600 8%<br />
520,372 570,800 615,400 44,600 8%<br />
22 1,200 35,000 33,800 2817%<br />
7,049 14,000 12,000 -2,000 -14%<br />
0 60,200 60,200 0 0%<br />
37,034 0 0 0 -
Object Object Description<br />
Community and Recreation Services<br />
Community Development<br />
Community Initiatives<br />
Economic Development<br />
Finance<br />
Fire-Emergency Services<br />
Government Relations<br />
Human Resources<br />
Information Services<br />
Legal<br />
Management & <strong>Budget</strong><br />
Mayor & Council<br />
Police<br />
PW-Development Engineering<br />
PW-Facilities<br />
PW-Replenishment<br />
PW-Sanitation<br />
PW-Sewer<br />
PW-Stormwater<br />
PW-Streets<br />
PW-Transportation<br />
PW-Vehicle Maintenance<br />
PW-Water<br />
PRINTING Total<br />
38991 UNIFORM/LAUNDRY SERVICES<br />
Community and Recreation Services<br />
Economic Development<br />
Fire-Emergency Services<br />
Police<br />
PW-Facilities<br />
PW-Replenishment<br />
PW-Sanitation<br />
PW-Sewer<br />
PW-Streets<br />
PW-Transportation<br />
PW-Vehicle Maintenance<br />
PW-Water<br />
UNIFORM/LAUNDRY SERVICES Total<br />
38992 UNFORSEEN GRANTS<br />
Community and Recreation Services<br />
UNFORSEEN GRANTS Total<br />
38994 DEVELOPER REIMBURSMENT<br />
Community and Recreation Services<br />
Community Development<br />
Economic Development<br />
Fire-Emergency Services<br />
FY2012<br />
Actual<br />
Friday, April 26, 2013 98<br />
FY2013<br />
Amended<br />
<strong>FY2014</strong> CM<br />
<strong>Recommended</strong><br />
$<br />
Change<br />
%<br />
Change<br />
93,033 102,200 102,900 700 1%<br />
6,760 6,400 8,900 2,500 39%<br />
0 0 0 0 -<br />
0 0 0 0 -<br />
7,122 7,500 8,600 1,100 15%<br />
2,393 5,700 5,700 0 0%<br />
0 0 0 0 -<br />
3,404 2,500 2,500 0 0%<br />
93 500 300 -200 -40%<br />
1,337 5,400 5,400 0 0%<br />
0 0 0 0 -<br />
0 0 0 0 -<br />
9,538 12,000 10,000 -2,000 -17%<br />
458 300 300 0 0%<br />
0 100 100 0 0%<br />
0 0 0 0 -<br />
3,398 10,000 10,000 0 0%<br />
2,151 2,000 1,600 -400 -20%<br />
0 0 0 0 -<br />
463 300 300 0 0%<br />
158 300 400 100 33%<br />
0 0 0 0 -<br />
3,543 4,700 3,400 -1,300 -28%<br />
177,957 235,300 267,600 32,300 14%<br />
1,684 500 500 0 0%<br />
0 0 0 0 -<br />
56 0 0 0 -<br />
0 0 0 0 -<br />
9,333 10,000 10,000 0 0%<br />
0 0 0 0 -<br />
10,329 5,100 11,000 5,900 116%<br />
15,466 13,200 14,900 1,700 13%<br />
9,296 7,900 7,100 -800 -10%<br />
2,244 1,100 1,500 400 36%<br />
8,622 9,500 9,500 0 0%<br />
5,433 4,800 5,200 400 8%<br />
62,463 52,100 59,700 7,600 15%<br />
0 0 0 0 -<br />
0 0 0 0 -<br />
0 0 0 0 -<br />
1,986,034 1,150,000 2,987,600 1,837,600 160%<br />
0 0 0 0 -<br />
0 0 0 0 -
Object Object Description<br />
General Operations<br />
PW-Sewer<br />
PW-Water<br />
DEVELOPER REIMBURSMENT Total<br />
38999 OTHER PROFESSIONAL SERVICES<br />
Arts Commission<br />
<strong>City</strong> Clerk<br />
<strong>City</strong> Court<br />
<strong>City</strong> Manager<br />
Communications<br />
Community and Recreation Services<br />
Community Development<br />
Community Initiatives<br />
Economic Development<br />
Finance<br />
Fire-Emergency Services<br />
General Operations<br />
Government Relations<br />
Human Resources<br />
Information Services<br />
Legal<br />
Management & <strong>Budget</strong><br />
Mayor & Council<br />
Police<br />
PW-Development Engineering<br />
PW-Facilities<br />
PW-Replenishment<br />
PW-Sanitation<br />
PW-Sewer<br />
PW-Stormwater<br />
PW-Streets<br />
PW-Transportation<br />
PW-Vehicle Maintenance<br />
PW-Water<br />
OTHER PROFESSIONAL SERVICES Tot<br />
39110 LAND<br />
PW-Sewer<br />
LAND Total<br />
39111 LAND PURCHASES<br />
Fire-Emergency Services<br />
Police<br />
PW-Development Engineering<br />
PW-Facilities<br />
PW-Sewer<br />
PW-Transportation<br />
LAND PURCHASES Total<br />
FY2012<br />
Actual<br />
Friday, April 26, 2013 99<br />
FY2013<br />
Amended<br />
<strong>FY2014</strong> CM<br />
<strong>Recommended</strong><br />
$<br />
Change<br />
%<br />
Change<br />
3,894 0 0 0 -<br />
0 0 0 0 -<br />
268,406 0 0 0 -<br />
2,258,334 1,150,000 2,987,600 1,837,600 160%<br />
0 0 0 0 -<br />
9,645 5,400 200,000 194,600 3604%<br />
8,420 6,000 6,000 0 0%<br />
257 0 0 0 -<br />
1,221 0 0 0 -<br />
1,467 1,000 1,000 0 0%<br />
3,890 2,800 2,900 100 4%<br />
0 0 0 0 -<br />
0 0 0 0 -<br />
1,725 0 500 500 -<br />
10,343 0 0 0 -<br />
6,000 6,000 6,000 0 0%<br />
100 0 0 0 -<br />
1,053 0 58,000 58,000 -<br />
861 0 0 0 -<br />
484 400 400 0 0%<br />
0 0 0 0 -<br />
0 0 0 0 -<br />
22,105 12,800 115,800 103,000 805%<br />
202 0 0 0 -<br />
60 0 0 0 -<br />
0 0 0 0 -<br />
180 100 0 -100 -100%<br />
325 400 100 -300 -75%<br />
0 0 0 0 -<br />
383 0 0 0 -<br />
360 0 0 0 -<br />
60 0 0 0 -<br />
419 500 500 0 0%<br />
69,559 35,400 391,200 355,800 1005%<br />
0 0 0 0 -<br />
0 0 0 0 -<br />
0 0 0 0 -<br />
0 0 0 0 -<br />
18,515 0 0 0 -<br />
0 0 0 0 -<br />
0 0 0 0 -<br />
0 0 628,100 628,100 -<br />
18,515 0 628,100 628,100 -
Object Object Description<br />
39112 IMPROVEMENTS TO LAND<br />
Community and Recreation Services<br />
General Operations<br />
PW-Facilities<br />
IMPROVEMENTS TO LAND Total<br />
39210 BUILDING & STRUCTURES<br />
PW-Facilities<br />
PW-Replenishment<br />
PW-Sewer<br />
PW-Water<br />
BUILDING & STRUCTURES Total<br />
39211 BUILDING & STRUCTURE PURCHASES<br />
Community and Recreation Services<br />
Fire-Emergency Services<br />
Not Used <strong>City</strong> <strong>of</strong> <strong>Surprise</strong><br />
Police<br />
PW-Development Engineering<br />
PW-Facilities<br />
PW-Replenishment<br />
PW-Sewer<br />
PW-Streets<br />
PW-Transportation<br />
PW-Water<br />
BUILDING & STRUCTURE PURCHASES<br />
39212 IMPROVEMENTS TO BUILDINGS<br />
<strong>City</strong> Court<br />
Community and Recreation Services<br />
Community Development<br />
Economic Development<br />
Fire-Emergency Services<br />
Management & <strong>Budget</strong><br />
PW-Facilities<br />
PW-Sewer<br />
PW-Vehicle Maintenance<br />
PW-Water<br />
IMPROVEMENTS TO BUILDINGS Total<br />
39220 STREETS/INFRASTRUCTURE<br />
PW-Replenishment<br />
PW-Sewer<br />
PW-Water<br />
STREETS/INFRASTRUCTURE Total<br />
39221 STREETS PURCHASES<br />
PW-Development Engineering<br />
PW-Transportation<br />
FY2012<br />
Actual<br />
Friday, April 26, 2013 100<br />
FY2013<br />
Amended<br />
<strong>FY2014</strong> CM<br />
<strong>Recommended</strong><br />
$<br />
Change<br />
%<br />
Change<br />
0 0 0 0 -<br />
0 0 0 0 -<br />
0 0 0 0 -<br />
0 0 0 0 -<br />
0 0 0 0 -<br />
0 0 0 0 -<br />
0 0 0 0 -<br />
0 0 0 0 -<br />
0 0 0 0 -<br />
0 0 0 0 -<br />
0 0 300,000 300,000 -<br />
0 0 0 0 -<br />
0 0 0 0 -<br />
179,834 0 0 0 -<br />
281,382 0 100,000 100,000 -<br />
0 0 3,169,100 3,169,100 -<br />
3,065,102 3,136,100 4,120,300 984,200 31%<br />
0 0 0 0 -<br />
534,017 134,400 4,539,300 4,404,900 3277%<br />
84,276 0 2,329,900 2,329,900 -<br />
4,144,611 3,270,500 14,558,600 11,288,100 345%<br />
0 0 0 0 -<br />
0 100,300 0 -100,300 -100%<br />
0 0 0 0 -<br />
0 0 0 0 -<br />
0 0 0 0 -<br />
0 0 0 0 -<br />
49,975 0 0 0 -<br />
0 300,000 0 -300,000 -100%<br />
49,223 0 0 0 -<br />
0 0 0 0 -<br />
99,198 400,300 0 -400,300 -100%<br />
0 0 0 0 -<br />
0 0 0 0 -<br />
0 0 0 0 -<br />
0 0 0 0 -<br />
0 376,000 0 -376,000 -100%<br />
0 580,000 0 -580,000 -100%
Object Object Description<br />
STREETS PURCHASES Total<br />
39222 STREET IMPROVEMENTS<br />
PW-Development Engineering<br />
PW-Streets<br />
PW-Transportation<br />
STREET IMPROVEMENTS Total<br />
39223 INFRASTRUCTURE PURCHASES<br />
Community and Recreation Services<br />
Community Development<br />
General Operations<br />
PW-Development Engineering<br />
PW-Replenishment<br />
PW-Sewer<br />
PW-Transportation<br />
PW-Water<br />
INFRASTRUCTURE PURCHASES Total<br />
39224 INFRASTRUCTURE IMPROVEMENTS<br />
PW-Development Engineering<br />
PW-Sewer<br />
PW-Streets<br />
PW-Transportation<br />
PW-Water<br />
INFRASTRUCTURE IMPROVEMENTS T<br />
39225 PRASADA CONSTRUCTION<br />
Economic Development<br />
PRASADA CONSTRUCTION Total<br />
39226 PRASADA AUTO<br />
Economic Development<br />
PRASADA AUTO Total<br />
39227 PRASADA RETAIL<br />
Economic Development<br />
PRASADA RETAIL Total<br />
39310 IMP.'S OTR THAN BLDG. & LAND<br />
PW-Replenishment<br />
PW-Water<br />
IMP.'S OTR THAN BLDG. & LAND Total<br />
39311 IMP.'S OTR THAN BLDG. & LAND<br />
Community Development<br />
Fire-Emergency Services<br />
Information Services<br />
Police<br />
PW-Facilities<br />
PW-Replenishment<br />
FY2012<br />
Actual<br />
Friday, April 26, 2013 101<br />
FY2013<br />
Amended<br />
<strong>FY2014</strong> CM<br />
<strong>Recommended</strong><br />
$<br />
Change<br />
%<br />
Change<br />
0 956,000 0 -956,000 -100%<br />
0 373,700 0 -373,700 -100%<br />
955,901 0 0 0 -<br />
94,929 2,567,900 0 -2,567,900 -100%<br />
1,050,830 2,941,600 0 -2,941,600 -100%<br />
0 0 0 0 -<br />
0 0 0 0 -<br />
0 0 0 0 -<br />
0 0 0 0 -<br />
0 0 0 0 -<br />
0 200,000 0 -200,000 -100%<br />
0 1,187,600 0 -1,187,600 -100%<br />
0 1,136,500 0 -1,136,500 -100%<br />
0 2,524,100 0 -2,524,100 -100%<br />
0 170,000 0 -170,000 -100%<br />
23,377 517,800 7,500 -510,300 -99%<br />
0 0 0 0 -<br />
0 417,600 0 -417,600 -100%<br />
78,732 0 7,500 7,500 -<br />
102,109 1,105,400 15,000 -1,090,400 -99%<br />
0 0 0 0 -<br />
0 0 0 0 -<br />
0 0 0 0 -<br />
0 0 0 0 -<br />
0 0 0 0 -<br />
0 0 0 0 -<br />
0 0 0 0 -<br />
0 0 0 0 -<br />
0 0 0 0 -<br />
0 0 25,000 25,000 -<br />
0 0 0 0 -<br />
0 0 315,000 315,000 -<br />
0 0 0 0 -<br />
74,469 125,000 0 -125,000 -100%<br />
0 0 0 0 -
Object Object Description<br />
PW-Sewer<br />
PW-Transportation<br />
PW-Water<br />
IMP.'S OTR THAN BLDG. & LAND Total<br />
39410 FURN., FIXTURES & OFC EQUIPMT<br />
PW-Sewer<br />
FURN., FIXTURES & OFC EQUIPMT Tot<br />
39411 FURN., FIXTURES & OFC EQUIPMT<br />
<strong>City</strong> Manager<br />
Communications<br />
Community and Recreation Services<br />
Finance<br />
Fire-Emergency Services<br />
Human Resources<br />
Information Services<br />
Management & <strong>Budget</strong><br />
Police<br />
PW-Facilities<br />
PW-Sewer<br />
PW-Transportation<br />
PW-Water<br />
FURN., FIXTURES & OFC EQUIPMT Tot<br />
39420 VEHICLES<br />
PW-Sanitation<br />
PW-Vehicle Maintenance<br />
PW-Water<br />
VEHICLES Total<br />
39421 VEHICLES<br />
Community and Recreation Services<br />
Finance<br />
Fire-Emergency Services<br />
General Operations<br />
Police<br />
PW-Facilities<br />
PW-Sanitation<br />
PW-Streets<br />
PW-Transportation<br />
PW-Vehicle Maintenance<br />
PW-Water<br />
VEHICLES Total<br />
39422 IMPROVEMENTS TO VEHICLES<br />
Fire-Emergency Services<br />
Police<br />
PW-Water<br />
FY2012<br />
Actual<br />
Friday, April 26, 2013 102<br />
FY2013<br />
Amended<br />
<strong>FY2014</strong> CM<br />
<strong>Recommended</strong><br />
$<br />
Change<br />
%<br />
Change<br />
0 1,000,600 0 -1,000,600 -100%<br />
159,537 250,000 90,000 -160,000 -64%<br />
575,387 404,000 154,000 -250,000 -62%<br />
809,393 1,779,600 584,000 -1,195,600 -67%<br />
0 0 0 0 -<br />
0 0 0 0 -<br />
0 0 50,000 50,000 -<br />
0 0 0 0 -<br />
0 0 100,000 100,000 -<br />
0 0 0 0 -<br />
0 0 175,000 175,000 -<br />
0 0 0 0 -<br />
107,489 20,000 320,000 300,000 1500%<br />
0 0 0 0 -<br />
174,863 0 72,000 72,000 -<br />
67,829 0 0 0 -<br />
0 0 25,000 25,000 -<br />
0 0 0 0 -<br />
0 0 0 0 -<br />
350,182 20,000 742,000 722,000 3610%<br />
0 0 0 0 -<br />
0 0 0 0 -<br />
0 0 0 0 -<br />
0 0 0 0 -<br />
0 0 35,000 35,000 -<br />
0 0 0 0 -<br />
0 0 0 0 -<br />
0 2,051,000 2,277,300 226,300 11%<br />
332,473 0 0 0 -<br />
0 0 0 0 -<br />
0 0 0 0 -<br />
0 0 0 0 -<br />
135,091 12,500 0 -12,500 -100%<br />
1,988,691 0 1,620,000 1,620,000 -<br />
0 0 0 0 -<br />
2,456,254 2,063,500 3,932,300 1,868,800 91%<br />
0 0 0 0 -<br />
47,628 0 0 0 -<br />
0 0 0 0 -
Object Object Description<br />
IMPROVEMENTS TO VEHICLES Total<br />
39430 MACH. & EQUIPMENT<br />
PW-Sewer<br />
PW-Water<br />
MACH. & EQUIPMENT Total<br />
39431 MACH. & EQUIPMENT<br />
Community and Recreation Services<br />
Fire-Emergency Services<br />
General Operations<br />
Information Services<br />
Police<br />
PW-Replenishment<br />
PW-Sanitation<br />
PW-Sewer<br />
PW-Streets<br />
PW-Vehicle Maintenance<br />
PW-Water<br />
MACH. & EQUIPMENT Total<br />
39432 IMP'S TO MACH. & EQUIPMENT<br />
General Operations<br />
PW-Sewer<br />
IMP'S TO MACH. & EQUIPMENT Total<br />
39511 RIGHTS<br />
PW-Water<br />
RIGHTS Total<br />
39521 EASEMENTS<br />
PW-Sewer<br />
EASEMENTS Total<br />
39600 CAPITAL INTEREST<br />
PW-Replenishment<br />
PW-Sewer<br />
CAPITAL INTEREST Total<br />
39610 CAPITAL INTEREST EXPENSE<br />
PW-Replenishment<br />
PW-Sewer<br />
CAPITAL INTEREST EXPENSE Total<br />
39711 BUILDINGS & STRUCTURES DEPREC.<br />
FY2012<br />
Actual<br />
PW-Sewer<br />
PW-Water<br />
BUILDINGS & STRUCTURES DEPREC.<br />
39712 IMP'S OTHER THN BLDGS & LAND DEPR<br />
PW-Replenishment<br />
Friday, April 26, 2013 103<br />
FY2013<br />
Amended<br />
<strong>FY2014</strong> CM<br />
<strong>Recommended</strong><br />
$<br />
Change<br />
%<br />
Change<br />
47,628 0 0 0 -<br />
0 0 0 0 -<br />
0 0 0 0 -<br />
0 0 0 0 -<br />
0 0 64,000 64,000 -<br />
642 15,000 0 -15,000 -100%<br />
0 0 4,000 4,000 -<br />
1,386 0 0 0 -<br />
36,214 25,000 0 -25,000 -100%<br />
0 100,000 0 -100,000 -100%<br />
0 0 20,000 20,000 -<br />
75,978 0 0 0 -<br />
0 0 0 0 -<br />
191,606 0 0 0 -<br />
30 0 0 0 -<br />
305,855 140,000 88,000 -52,000 -37%<br />
0 750,000 0 -750,000 -100%<br />
0 0 0 0 -<br />
0 750,000 0 -750,000 -100%<br />
0 154,000 0 -154,000 -100%<br />
0 154,000 0 -154,000 -100%<br />
9,160 0 0 0 -<br />
9,160 0 0 0 -<br />
0 0 0 0 -<br />
0 0 0 0 -<br />
0 0 0 0 -<br />
0 0 0 0 -<br />
0 0 0 0 -<br />
0 0 0 0 -<br />
0 0 0 0 -<br />
0 0 0 0 -<br />
0 0 0 0 -<br />
0 0 0 0 -
Object Object Description<br />
IMP'S OTHER THN BLDGS & LAND DEP<br />
39713 EQUIPMENT DEPREC.<br />
PW-Replenishment<br />
PW-Sanitation<br />
PW-Sewer<br />
PW-Water<br />
EQUIPMENT DEPREC. Total<br />
39813 OTHER LEASES<br />
General Operations<br />
PW-Development Engineering<br />
OTHER LEASES Total<br />
39821 PRINCIPAL BONDS<br />
Debt Service<br />
General Operations<br />
PW-Sewer<br />
PRINCIPAL BONDS Total<br />
39822 INTEREST BONDS<br />
Debt Service<br />
General Operations<br />
PW-Sewer<br />
INTEREST BONDS Total<br />
39823 OTHER BONDS<br />
Debt Service<br />
General Operations<br />
OTHER BONDS Total<br />
39824 AMORITIZATION BONDS<br />
General Operations<br />
AMORITIZATION BONDS Total<br />
39831 PRINCIPAL NOTES<br />
PW-Replenishment<br />
PRINCIPAL NOTES Total<br />
39832 INTEREST NOTES<br />
PW-Replenishment<br />
INTEREST NOTES Total<br />
39833 OTHER NOTES<br />
PW-Replenishment<br />
OTHER NOTES Total<br />
39834 AMORITIZATION NOTES<br />
PW-Replenishment<br />
AMORITIZATION NOTES Total<br />
39841 INTERFUND LOAN INTEREST<br />
FY2012<br />
Actual<br />
Friday, April 26, 2013 104<br />
FY2013<br />
Amended<br />
<strong>FY2014</strong> CM<br />
<strong>Recommended</strong><br />
$<br />
Change<br />
%<br />
Change<br />
0 0 0 0 -<br />
0 0 0 0 -<br />
0 0 0 0 -<br />
0 0 0 0 -<br />
0 0 0 0 -<br />
0 0 0 0 -<br />
6,500 6,600 6,600 0 0%<br />
2,500 0 0 0 -<br />
9,000 6,600 6,600 0 0%<br />
190,000 0 210,000 210,000 -<br />
3,240,000 3,345,100 8,190,000 4,844,900 145%<br />
0 335,900 0 -335,900 -100%<br />
3,430,000 3,681,000 8,400,000 4,719,000 128%<br />
483,645 0 464,600 464,600 -<br />
3,982,163 3,868,800 3,701,500 -167,300 -4%<br />
0 400,000 0 -400,000 -100%<br />
4,465,808 4,268,800 4,166,100 -102,700 -2%<br />
0 0 0 0 -<br />
1,000 0 0 0 -<br />
1,000 0 0 0 -<br />
0 0 0 0 -<br />
0 0 0 0 -<br />
0 1,270,000 0 -1,270,000 -100%<br />
0 1,270,000 0 -1,270,000 -100%<br />
6,569 30,000 0 -30,000 -100%<br />
6,569 30,000 0 -30,000 -100%<br />
19,706 0 0 0 -<br />
19,706 0 0 0 -<br />
0 0 0 0 -<br />
0 0 0 0 -
Object Object Description<br />
Development Fee New Capital<br />
Fire-Emergency Services<br />
General Operations<br />
PW-Replenishment<br />
PW-Sewer<br />
PW-Water<br />
INTERFUND LOAN INTEREST Total<br />
39851 INTERFUND LOAN ISSUANCE<br />
General Operations<br />
INTERFUND LOAN ISSUANCE Total<br />
39861 BAD DEBT EXPENSE<br />
FY2012<br />
Actual<br />
FY2013<br />
Amended<br />
<strong>FY2014</strong> CM<br />
<strong>Recommended</strong><br />
$<br />
Change<br />
%<br />
Change<br />
0 1,837,000 0 -1,837,000 -100%<br />
0 292,600 0 -292,600 -100%<br />
0 200,000 0 -200,000 -100%<br />
0 0 0 0 -<br />
0 1,071,500 0 -1,071,500 -100%<br />
0 0 0 0 -<br />
0 3,401,100 0 -3,401,100 -100%<br />
0 2,267,800 0 -2,267,800 -100%<br />
0 2,267,800 0 -2,267,800 -100%<br />
PW-Streets<br />
30,056 0 0 0 -<br />
BAD DEBT EXPENSE Total<br />
30,056 0 0 0 -<br />
39995 ECONOMIC DEVELOPMENT CONTINGEN<br />
Community Development<br />
ECONOMIC DEVELOPMENT CONTINGE<br />
39996 GRANT MATCH CONTINGENCY<br />
<strong>City</strong> Manager<br />
GRANT MATCH CONTINGENCY Total<br />
39997 TARGETED SAVINGS<br />
Community and Recreation Services<br />
Community Development<br />
General Operations<br />
PW-Sewer<br />
TARGETED SAVINGS Total<br />
39998 PROJECT CONTINGENCY<br />
Finance<br />
PROJECT CONTINGENCY Total<br />
39999 CONTINGENCY<br />
<strong>City</strong> Court<br />
Community and Recreation Services<br />
Fire-Emergency Services<br />
General Operations<br />
Human Resources<br />
Police<br />
PW-Facilities<br />
PW-Sanitation<br />
PW-Sewer<br />
PW-Streets<br />
PW-Transportation<br />
PW-Vehicle Maintenance<br />
PW-Water<br />
CONTINGENCY Total<br />
Friday, April 26, 2013 105<br />
0 780,000 1,000,000 220,000 28%<br />
0 780,000 1,000,000 220,000 28%<br />
0 70,000 70,000 0 0%<br />
0 70,000 70,000 0 0%<br />
0 0 0 0 -<br />
0 0 0 0 -<br />
0 -1,000,000 0 1,000,000 -100%<br />
0 64,500 0 -64,500 -100%<br />
0 -935,500 0 935,500 -100%<br />
0 87,800 0 -87,800 -100%<br />
0 87,800 0 -87,800 -100%<br />
0 471,700 495,000 23,300 5%<br />
0 179,400 8,512,300 8,332,900 4645%<br />
0 1,500 0 -1,500 -100%<br />
0 13,543,700 10,505,000 -3,038,700 -22%<br />
0 3,378,400 4,767,300 1,388,900 41%<br />
0 896,300 1,922,700 1,026,400 115%<br />
0 0 9,734,700 9,734,700 -<br />
0 792,000 794,400 2,400 0%<br />
0 1,333,000 1,591,900 258,900 19%<br />
0 0 63,200 63,200 -<br />
0 0 1,764,600 1,764,600 -<br />
0 0 1,998,000 1,998,000 -<br />
0 1,161,000 4,209,400 3,048,400 263%<br />
0 21,757,000 46,358,500 24,601,500 113%
Object Object Description<br />
FY2012<br />
Actual<br />
FY2013<br />
Amended<br />
<strong>FY2014</strong> CM<br />
<strong>Recommended</strong><br />
$<br />
Change<br />
%<br />
Change<br />
Grand Total 143,792,821 184,159,100 223,426,200 39,267,100 21%<br />
Friday, April 26, 2013 106
Department <strong>Budget</strong>s<br />
Police<br />
Fire<br />
Community & Economic Development<br />
<strong>City</strong> Attorney’s Office<br />
Community & Recreation Services<br />
Public Works<br />
Information Technology<br />
Finance<br />
<strong>City</strong> Manager’s Office<br />
<strong>City</strong> Clerk’s Office<br />
Mayor & <strong>City</strong> Council
Police Department<br />
Department Overview<br />
Department Description<br />
The <strong>Surprise</strong> Police Department, in partnership with the community, provides the delivery <strong>of</strong> progressive<br />
services, including, but not limited to, community-based policing, proactive and responsive patrol, criminal<br />
investigations, traffic enforcement and safety, and crime prevention and protection. The department<br />
provides proactive patrols and responds to police-related calls for service. These calls for service, from 9-<br />
1-1 emergencies and non-emergencies, are dispatched through the Communications Unit. Criminal<br />
investigations are conducted for crimes against persons and for property crimes. Traffic enforcement and<br />
safety is provided through enforcement and education programs. Crime prevention is provided through<br />
multiple programs involving communities, business, and schools. The department also provides victim<br />
support services and sex <strong>of</strong>fender notices to the community.<br />
Mission Statement<br />
The <strong>Surprise</strong> Police Department is committed to maintaining a safe community by providing extraordinary<br />
law enforcement service with an emphasis on pr<strong>of</strong>essionalism, accountability, and respect.<br />
Department-Wide<br />
The Police Department is primarily funded by the general fund. In addition, it has several special revenue<br />
funds that provide restricted-use funding including the Drug Enforcement Agency (DEA) fund, the<br />
Racketeer Influenced and Corrupt Organizations (RICO) fund, the tow fund, and the SB1398 fund.<br />
Expenditures and personnel related to these special revenue funds are included in the tables below.<br />
Expenditure <strong>Budget</strong> by Fund<br />
FY2011 FY2012 FY2013 <strong>FY2014</strong> Amended to<br />
Expenditures<br />
By fund<br />
Actual Actual Amended <strong>Budget</strong> <strong>Budget</strong><br />
Gen General Fund 18,459,291 18,722,035 19,004,800 19,965,400 5%<br />
DON Donations Fund 9,769 14,249 11,800 14,300 21%<br />
POL Police Dev Fee Fund 245,400 246,098 246,000 1,224,600 398%<br />
SPD SPD DEA Fund 128,685 66,457 230,900 154,400 -33%<br />
SPD SPD RICO Fund 35,159 220,140 513,200 806,000 57%<br />
SPD SPD Towing Fund 67,680 66,067 372,900 532,000 43%<br />
SB SB1398 FINES 0 0 39,200 40,100 2%<br />
UNF Grants Fund 535,116 592,122 223,200 177,800 -20%<br />
Total 19,481,101 19,927,168 20,642,000 22,986,600 11%<br />
FY2011<br />
Final<br />
FY2012<br />
Adopted<br />
FY2013<br />
Adopted<br />
<strong>FY2014</strong><br />
<strong>Budget</strong><br />
Adopted to<br />
<strong>Budget</strong><br />
Personnel<br />
By fund<br />
General Fund 188.0 183.0 179.9 180.9 1.0<br />
Vehicle Impound Fund 1.0 1.0 0.5 0.5 0.0<br />
Grants and Contigency Fund 1.0 0.0 0.6 0.6 0.0<br />
Total 190.0 184.0 181.0 182.0 1.0<br />
107
Organizational Chart<br />
The <strong>Surprise</strong> Police Department’s organization chart is below. Please note that the legal advisor position<br />
is funded by the <strong>City</strong> Attorney’s Office. In addition, a portion <strong>of</strong> two positions are partially funded by either<br />
a grant or special revenue fund.<br />
Division Manager<br />
Lieutenant<br />
Police Sergeant (3)<br />
Police Officers (21)<br />
Senior Analyst<br />
Analyst<br />
Program<br />
Coordinator<br />
Division Manager<br />
Commander<br />
Criminal Investigations<br />
Manager<br />
PS<br />
Communications<br />
Supervisor (5)<br />
PS<br />
Communications<br />
Officers (17)<br />
Assistant Department<br />
Director<br />
Division Manager<br />
Lieutenant<br />
Police Sergeant<br />
Police Officers (3)<br />
Community<br />
Service Officers<br />
(2)<br />
Primary Functions<br />
• Administration/pr<strong>of</strong>essional standards<br />
• Animal control<br />
• Communications<br />
• Community services<br />
• Information to the media and public<br />
• Internal audits and inspections<br />
• Internal Investigations<br />
• Jail transport<br />
• Court transportation and jail booking<br />
• Notifications and referrals<br />
• Park ranger services<br />
• Patrol services-proactive<br />
• Patrol services-responsive<br />
• Police accreditation management<br />
• Policy management<br />
• Property and evidence management<br />
• Public information and notification<br />
Administrative<br />
Technician<br />
Division Manager<br />
Lieutenant<br />
Police Sergeants<br />
(5)<br />
Police Officers (42)<br />
Animal Control<br />
Officers (3)<br />
Transportation<br />
Officers (2)<br />
Community<br />
Services Officers<br />
(3)<br />
Park Ranger<br />
108<br />
Department Director<br />
Chief <strong>of</strong> Police<br />
Division Manager<br />
Commander<br />
Field Operations<br />
Division Manager<br />
Lieutenant<br />
Police Sergeants<br />
(2)<br />
Police Officers (17)<br />
Administrative<br />
Officer<br />
Administrative<br />
Specialist<br />
Division Manager<br />
Lieutenant<br />
Police Sergeants<br />
(2)<br />
Police Officers (18)<br />
Legal Advisor<br />
Division Manager<br />
Commander<br />
Pr<strong>of</strong>essional Standards<br />
& Training<br />
Division Managers<br />
Lieutenant<br />
Police Sergeants<br />
(2)<br />
Police Officers (4)<br />
Administrative<br />
Specialist<br />
(2)<br />
Senior Analyst<br />
• Crime analysis<br />
• Crime prevention<br />
• Criminal Investigations<br />
• Law enforcement and education<br />
Senior Financial<br />
Analyst<br />
Administrative<br />
Support Supervisor<br />
Administrative<br />
Technicians (5)<br />
• Quality management<br />
• Records management<br />
• Recruitment<br />
• School resource services<br />
• Sex <strong>of</strong>fender registration/notification<br />
• Special assignments<br />
• Strategic planning and management<br />
• Traffic enforcement<br />
• Training<br />
• Victim advocacy
Divisions<br />
Office <strong>of</strong> the Chief - This division is responsible for the performance <strong>of</strong> the Police department and<br />
its commanding <strong>of</strong>ficers. The pr<strong>of</strong>essional standards unit is also a component<br />
<strong>of</strong> this <strong>of</strong>fice. Additional functions <strong>of</strong> the division are internal financial review,<br />
strategic planning, quality management, criminal history records management,<br />
property and evidence management, crime prevention, and the citizen patrol.<br />
Pr<strong>of</strong>essional Standards - This division is responsible for recruiting, training, departmental accreditation,<br />
policy management, internal audits, inspections, investigations, and the vehicle<br />
impound program.<br />
Criminal Investigations - This division is the investigative arm <strong>of</strong> the department and performs criminal<br />
investigations related to property and person crimes. Also included in the<br />
division are dispatch and 9-1-1 service, crime and intelligence analysis, and<br />
victim services.<br />
Field Operations - This division is responsible for providing patrol and police response services to<br />
the community utilizing community-based policing methods, beat team<br />
programs, traffic enforcement, the school resource <strong>of</strong>ficer program, animal<br />
control services, the K-9 program, jail transportation, front desk services, and<br />
other directed community policing activities.<br />
Accomplishments, Enhancements, and Efficiencies<br />
• Completed new mission and vision statements, which align with the city <strong>of</strong> <strong>Surprise</strong> values,<br />
mission, and vision.<br />
• Completed facility security enhancements and a full inventory <strong>of</strong> the property and evidence<br />
facility. In addition, two community service <strong>of</strong>ficers achieved certification as property custodians.<br />
Updated and documented all core business processes and achieved a 100% success rate on the<br />
2012 inventory audit.<br />
• Created a neighborhood response unit, from existing staff, to proactively investigate and<br />
aggressively pursue those prolific <strong>of</strong>fenders driving our crime rates. The unit focuses on reducing<br />
Part 1 Uniform Crime Report (UCR) property crime, assisting the Criminal Investigations Division<br />
with violent crime stringers, high-pr<strong>of</strong>ile cases, and addressing and resolving identified property<br />
crime trends.<br />
• Police Department policies became available online in 2012, which eliminated the need to print<br />
thousands <strong>of</strong> pages <strong>of</strong> materials annually and created a more effective, efficient, and timely<br />
method to research policy related information.<br />
Major Initiatives and Policy Issues<br />
• Develop and communicate the new SPD Policing Plan (2-year strategic plan). The plan includes<br />
new values, mission, and vision statements, as well as alignment with the new city <strong>of</strong> <strong>Surprise</strong><br />
values and Strategic Plan.<br />
• Award a contract for the purchase <strong>of</strong> on-<strong>of</strong>ficer cameras and related technology.<br />
• Achieve ISO 9001:2008 international management certification for the Property and Evidence<br />
Unit’s Quality Management System.<br />
• Propose to the Mayor and <strong>City</strong> Council and the community a false alarm ordinance designed to<br />
reduce the frequency <strong>of</strong> commercial and residential false alarm calls requiring patrol <strong>of</strong>ficer<br />
response.<br />
109
Goals, Objectives, and Performance Measures<br />
• Department Goal: Achieve agency reaccreditation for the international law enforcement standards<br />
developed and maintained by the Commission on the Accreditation for Law Enforcement Agencies.<br />
o Objective: Review and revise policies in accordance with CALEA standards and provide<br />
sufficient evidence <strong>of</strong> SPD compliance and institutional use.<br />
Performance Measures<br />
FY2011<br />
Actual<br />
FY2012<br />
Actual<br />
FY2013<br />
Target<br />
FY2013<br />
Estimate<br />
<strong>FY2014</strong><br />
Target<br />
Reviewed/revised policies 35 88 15 35 50+*<br />
Completed AQA August August August April N/A<br />
Successful reaccreditation** N/A N/A N/A N/A August<br />
*Reviews/Revisions during <strong>FY2014</strong> will not commence until after Reaccreditation process; thereafter, a complete<br />
review <strong>of</strong> approximately 150 Policies will begin in November 2013.<br />
**Formal CALEA reaccreditation process begins in August 2013 and will conclude by November 2013.<br />
• Department Goal: Provide rapid response to service calls, maintain high visibility in<br />
neighborhoods and business locations, and enforce traffic safety laws throughout the city.<br />
o Objective: Respond quickly (under 5 min) to police calls for service, increase proactive patrol<br />
volume, and continue to enforce traffic safety.<br />
Performance Measures<br />
FY2011<br />
Actual<br />
FY2012<br />
Actual<br />
FY2013<br />
Target<br />
FY2013<br />
Estimate<br />
<strong>FY2014</strong><br />
Target<br />
Calls for service 40,779 42,007 44,000 39,750 41,000<br />
Number <strong>of</strong> report actions*** 17,908 19,066 25,000 24,038 25,000<br />
Priority 1 average response times<br />
4min<br />
52sec<br />
4min<br />
50sec<br />
4min<br />
55sec<br />
4min<br />
23sec<br />
4min<br />
40sec<br />
Officer initiated call volume 66,943 84,278 90,000 88,288 90,000<br />
***Arrests, Incident Reports, Accident Reports, and Citations<br />
• Department Goal: Prevent, reduce, and disrupt crime<br />
o Objective: Increase arrest volume and maintain or reduce UCR Part 1 Violent and Property<br />
Crimes<br />
Performance Measures<br />
FY2011<br />
Actual<br />
FY2012<br />
Actual<br />
FY2013<br />
Target<br />
FY2013<br />
Estimate<br />
<strong>FY2014</strong><br />
Target<br />
Number <strong>of</strong> arrests 3,640 3,872 4,000 3,661 3,800<br />
UCR Part 1 crimes 2,255 2,956 3,000 2,117 2,500<br />
UCR Part 1 crimes per 1,000 19.27 24.80 26.00 17.76 26.00<br />
110
Police Department<br />
General Fund Summary<br />
Major <strong>Budget</strong> Changes<br />
The <strong>FY2014</strong> budget increased 5% over the FY2013 amended budget.<br />
Personnel expenditures were impacted by a 3% increase in the employer contribution for the Public<br />
Safety Retirement System and a 2.2% increase for a cost <strong>of</strong> living adjustment. The total personnel<br />
increase was primarily due to the addition <strong>of</strong> $339,000 in overtime, which was added to bring the<br />
department’s overtime budget into line with historical trends and estimated needs. In addition, one animal<br />
control <strong>of</strong>ficer position was added to satisfy the requirements <strong>of</strong> an intergovernmental agreement with the<br />
city <strong>of</strong> El Mirage to provide animal control services. The department is reimbursed for the position. The<br />
addition <strong>of</strong> shift differential and an increase in the animal control <strong>of</strong>ficer salary range as a result <strong>of</strong> Meet<br />
and Confer negotiations has been added to the budget for <strong>FY2014</strong>.<br />
Non-personnel costs increased 3.1% over the FY2013 budget. This increase was primarily due to<br />
increased costs related to the federally mandated regional wireless conversion and increased booking<br />
and housing fees at Maricopa County Sheriff’s Office jails. The increase was <strong>of</strong>fset by the transfer <strong>of</strong> ITmanaged<br />
service agreements to the Information Technology Department.<br />
FY2011 FY2012 FY2013 <strong>FY2014</strong> Amended to<br />
Expenditures<br />
By category<br />
Actual Actual Amended <strong>Budget</strong> <strong>Budget</strong><br />
Personnel 16,338,499 16,442,270 16,871,700 17,765,900<br />
5%<br />
Supplies 628,993 652,536 544,600 566,500<br />
4%<br />
Services 1,491,789 1,626,919 1,588,500 1,633,000<br />
3%<br />
Capital 10<br />
310<br />
-<br />
-<br />
0%<br />
Total<br />
By division<br />
18,459,291 18,722,035 19,004,800 19,965,400<br />
5%<br />
Administration 3,769,066 3,347,295 3,620,900 2,628,000<br />
-27%<br />
Communications 1,886,165 1,970,523 1,832,300 2,164,300<br />
18%<br />
Investigations 2,681,638 2,835,407 2,729,100 2,842,300<br />
4%<br />
Patrol 9,548,964 10,280,390 10,495,700 12,134,800<br />
16%<br />
Tech Svcs 573,458 288,420 326,800 196,000<br />
-40%<br />
Total 18,459,291 18,722,035 19,004,800 19,965,400<br />
5%<br />
Revenues<br />
By fund source<br />
Charges for Svcs/Oth 645,284 659,972 655,200 655,200 0%<br />
Total 645,284 659,972 655,200 655,200 0%<br />
111
FY2011<br />
Final<br />
FY2012<br />
Adopted<br />
FY2013<br />
Adopted<br />
<strong>FY2014</strong><br />
<strong>Budget</strong><br />
Adopted to<br />
<strong>Budget</strong><br />
Personnel<br />
Administrative Specialist 1.0 1.0 2.5 2.5 0.0<br />
Administrative Support Supervisor 1.0 1.0 1.0 1.0 0.0<br />
Administrative Technician 6.0 6.0 6.0 6.0 0.0<br />
Analyst 1.0 1.0 1.0 1.0 0.0<br />
Animal Control Officer 3.0 3.0 3.0 4.0 1.0<br />
Assistant <strong>City</strong> Attorney I & II 1.0 0.0 0.0 0.0 0.0<br />
Assistant Department Director 2.0 2.0 1.0 1.0 0.0<br />
Community Services Officer 6.0 6.0 6.0 6.0 0.0<br />
De Department Director - Police Chief 1.0 1.0 1.0 1.0 0.0<br />
Div Division Manager (Commander) 2.0 2.0 3.0 3.0 0.0<br />
Division Manager (Lieutenant) 6.0 6.0 6.0 6.0 0.0<br />
Forensic Technician 1.0 1.0 0.0 0.0 0.0<br />
IT Administrator 1.0 0.0 0.0 0.0 0.0<br />
IT Technician 1.0 0.0 0.0 0.0 0.0<br />
Manager 1.0 1.0 1.0 1.0 0.0<br />
Police Officer 106.0 106.0 106.0 105.0 -1.0<br />
Police Sergeant 15.0 15.0 15.0 16.0 1.0<br />
Program Coordinator 1.0 1.0 0.4 0.4 0.0<br />
Pub Public Safety Comm. Officer 19.0 19.0 17.0 17.0 0.0<br />
Pub Public Safety Comm. Supervisor 5.0 5.0 5.0 5.0 0.0<br />
Senior Analyst 2.0 2.0 2.0 2.0 0.0<br />
Senior Financial Analyst 1.0 1.0 1.0 1.0 0.0<br />
Senior HR Consultant 1.0 0.0 0.0 0.0 0.0<br />
Senior IT Administrator 1.0 0.0 0.0 0.0 0.0<br />
Training Coordinator 1.0 1.0 0.0 0.0 0.0<br />
Transportation Officer 2.0 2.0 2.0 2.0 0.0<br />
Total 188.0 183.0 179.9 180.9 1.0<br />
112
Police Department<br />
DEA Fund Summary<br />
Fund Description<br />
The Drug Enforcement Agency (DEA) fund is a special revenue fund established in September 2010 to<br />
account for revenue from the sale <strong>of</strong> seized assets, which is shared among all participating agencies. The<br />
Police Department is able to use this revenue to supplement services and supplies necessary to support<br />
operations.<br />
Major <strong>Budget</strong> Changes<br />
The <strong>FY2014</strong> budget decreased 33% from the FY2013 budget. The total <strong>FY2014</strong> budget includes planned<br />
expenditures <strong>of</strong> $116,000 for fitness facility upgrades. Fund balance and remaining available revenue is<br />
programmed as contingency at $38,400.<br />
FY2011 FY2012 FY2013 <strong>FY2014</strong> Amended to<br />
Expenditures Actual Actual Amended <strong>Budget</strong> <strong>Budget</strong><br />
By category<br />
Personnel 62,476 0 0 0 0%<br />
Supplies 54,951 57,940 0 16,000 0%<br />
Services 11,258 8,517 0 100,000 0%<br />
Capital 0 0 0 0 0%<br />
Contingency 0 0 230,900 38,400 -83%<br />
Total 128,685 66,457 230,900 154,400 -33%<br />
By department<br />
Police 128,685 66,457 230,900 154,400 -33%<br />
Total 128,685 66,457 230,900 154,400 -33%<br />
Revenues<br />
By fund source<br />
Charges for Svcs/Oth 107,496 1,519 1,100 120,000 10809%<br />
Transfer In 0 0 0 0 0%<br />
Fund Balance 21,189 171,400 0 34,400 0%<br />
Total 128,685 172,919 1,100 154,400 13936%<br />
Personnel Summary<br />
There are no dedicated personnel assigned to this fund.<br />
113
Police Department<br />
RICO Fund Summary<br />
Fund Description<br />
The Racketeer Influenced and Corrupt Organizations (RICO) fund is a special revenue fund established<br />
in September 2010 to account for revenue from the sale <strong>of</strong> seized assets, which is shared among all<br />
participating agencies. The <strong>Surprise</strong> Police Department is able to use this revenue to supplement<br />
services and supplies necessary to support operations.<br />
Major <strong>Budget</strong> Changes<br />
The <strong>FY2014</strong> budget increased 57% from the FY2013 budget. The total <strong>FY2014</strong> budget includes $280,000<br />
for department improvements and $120,000 for the purchase <strong>of</strong> on-<strong>of</strong>ficer cameras. Fund balance and<br />
remaining available revenue is programmed as contingency at $406,000.<br />
FY2011 FY2012 FY2013 <strong>FY2014</strong> Amended to<br />
Expenditures<br />
By category<br />
Actual Actual Amended <strong>Budget</strong> <strong>Budget</strong><br />
Supplies 30,835 35,482 200,000 400,000 100%<br />
Services 4,324 9,795 0 0 0%<br />
Capital 0 174,863 0 0 0%<br />
Contingency 0 0 313,200 406,000 30%<br />
Total<br />
By department<br />
35,159 220,140 513,200 806,000 57%<br />
Police 35,159 220,140 513,200 806,000 57%<br />
Total 35,159 220,140 513,200 806,000 57%<br />
Revenues<br />
By fund source<br />
Charges for Svcs/Oth 357,179 360,362 2,800 360,000 12757%<br />
Transfer In 0 0 0 0 0%<br />
Total 357,179 360,362 2,800 360,000 12757%<br />
Personnel Summary<br />
There are no dedicated personnel assigned to this fund.<br />
114
Police Department<br />
Tow Fund Summary<br />
Fund Description<br />
The tow fund is a special revenue fund established in September 2010 to account for the program<br />
expenses and administrative charges (revenues) related to the vehicle impound requirements as<br />
stipulated in ARS §28-3511 and ARS §28-3513. Revenues collected are to be used for the purpose <strong>of</strong><br />
implementing and managing a vehicle impound program pursuant to ARS §28-872.<br />
Major <strong>Budget</strong> Changes<br />
The <strong>FY2014</strong> budget increased 43% from the FY2013 budget.<br />
The total <strong>FY2014</strong> budget includes $32,500 in labor. Funding for a portion <strong>of</strong> the administrative specialist<br />
position that manages this program is budgeted in this fund. Actual expenditures will be transferred to the<br />
fund using labor distribution charges. Fund balance and remaining available revenue is programmed as<br />
contingency at $499,500.<br />
FY2011 FY2012 FY2013 <strong>FY2014</strong> Amended to<br />
Expenditures Actual Actual Amended <strong>Budget</strong> <strong>Budget</strong><br />
By category<br />
Personnel 67,600 66,007 32,500 32,500 0%<br />
Supplies 0 0 0 0 0%<br />
Services 80 60 0 0 0%<br />
Contingency 0 0 340,400 499,500 47%<br />
Total 67,680 66,067 372,900 532,000 43%<br />
By department<br />
Police 67,680 66,067 372,900 532,000 43%<br />
Total 67,680 66,067 372,900 532,000 43%<br />
Revenues<br />
By fund source<br />
Charges for Svcs/Oth 105,800 116,241 34,600 117,000 238%<br />
Transfer In 0 0 0 0 0%<br />
Fund Balance -38,120 337,300 0 415,000 0%<br />
Total 67,680 453,541 34,600 532,000 1438%<br />
FY2011<br />
Final<br />
FY2012<br />
Adopted<br />
FY2013<br />
Adopted<br />
<strong>FY2014</strong><br />
<strong>Budget</strong><br />
Adopted to<br />
<strong>Budget</strong><br />
Personnel<br />
Administrative Specialist 1.0 1.0 0.5 0.5 0.0<br />
Total 1.0 1.0 0.5 0.5 0.0<br />
115
Police Department<br />
SB 1398 Fund<br />
Fund Description<br />
The city receives funds from the state <strong>of</strong> Arizona pursuant to SB 1398, which established funding to pay<br />
for the purchase <strong>of</strong> <strong>of</strong>ficer safety equipment. SB 1398 entitles the city to receive four dollars <strong>of</strong> the<br />
penalties assessed for each criminal <strong>of</strong>fense, civil traffic violation, violation <strong>of</strong> the motor vehicle statues,<br />
violation <strong>of</strong> any vehicle-related local ordinance, or the game and fish statutes in Title 17. In October 2012,<br />
a new special revenue fund was established to manage these funds.<br />
Major <strong>Budget</strong> Changes<br />
The total <strong>FY2014</strong> is a 2% increase over FY2013. Funding varies from year to year based on the penalties<br />
assessed. The <strong>FY2014</strong> budget includes planned expenditures <strong>of</strong> $40,100.<br />
FY2011 FY2012 FY2013 <strong>FY2014</strong> Amended to<br />
Expenditures Actual Actual Amended <strong>Budget</strong> <strong>Budget</strong><br />
By category<br />
Supplies 0 0 39,200 40,100 2%<br />
Total 0 0 39,200 40,100 2%<br />
By department<br />
Police 0 0 39,200 40,100 2%<br />
Total 0 0 39,200 40,100 2%<br />
Revenues<br />
By fund source<br />
Charges for Svcs/Oth 0 0 0 17,000 0%<br />
Total 0 0 0 17,000 0%<br />
Personnel Summary<br />
There are no dedicated personnel assigned to this fund<br />
116
Fire Department<br />
Department Overview<br />
Department Description<br />
The Fire Department is a full-service organization that provides fire suppression, emergency medical<br />
services, hazardous material response, fire prevention services, community educational services, and<br />
crisis response services.<br />
Department-Wide<br />
The fire department is primarily funded by the general fund. In addition, it has several special revenue<br />
funds that provide restricted-use funding including the fire fighter’s pension fund, the helicopter airmedical<br />
logistics operations (HALO) fund, the ambulance contract fund, and the wildland fire fund.<br />
Expenditures and personnel related to these special revenue funds are included in the tables below.<br />
Expenditure <strong>Budget</strong> by Fund<br />
FY2011 FY2012 FY2013 <strong>FY2014</strong> Amended to<br />
Expenditures<br />
By fund<br />
Actual Actual Amended <strong>Budget</strong> <strong>Budget</strong><br />
Gen General Fund 13,719,122 14,324,860 14,526,500 14,983,000 3%<br />
DON Donations Fund 2,209 10,898 1,500 15,000 900%<br />
FIR Fire & EMS Dev Fee Fund 167,203 121,601 414,200 121,500 -71%<br />
GEN General Capital Fund 47,245 637,052 0 475,000 0%<br />
UNF Grants Fund 318,793 33,968 30,500 0 -100%<br />
HA HALO 0 0 0 132,000 0%<br />
Wil Wildland Fire 0 0 0 140,000 0%<br />
Am Ambulance Contract 0 0 0 278,700 0%<br />
Total 14,254,574 15,128,379 14,972,700 16,145,200 8%<br />
FY2011<br />
Final<br />
FY2012<br />
Adopted<br />
FY2013<br />
Adopted<br />
<strong>FY2014</strong><br />
<strong>Budget</strong><br />
Adopted to<br />
<strong>Budget</strong><br />
Personnel<br />
By fund<br />
General Fund 122.0 122.0 118.0 118.0 0.0<br />
Total 122.0 122.0 118.0 118.0 0.0<br />
117
Organizational Chart<br />
Battalion Chief<br />
(Logistics/Support Svc,<br />
Emergency Mgmt.)<br />
Service Worker<br />
Assistant Department<br />
Director<br />
(Administrative Svcs)<br />
Division Manager<br />
(Fire Prevention)<br />
Inspector/<br />
Investigator<br />
Plans Examiner<br />
Senior Financial<br />
Analyst<br />
Administrative<br />
Specialist<br />
Administrative<br />
Technician’s<br />
Fire Captain<br />
(Community Life<br />
Safety Education)<br />
(Crisis Response )<br />
Primary Functions<br />
• Administrative services<br />
• All hazard emergency response<br />
• Automatic aid consortium participant<br />
• Crisis Response volunteer program<br />
• Community Life Safety Education<br />
• Emergency Operations Center (EOC)<br />
• Emergency Medical Services (EMS)<br />
• Facility and Apparatus management<br />
• Fire inspections and investigations<br />
Department Director<br />
Fire Chief<br />
Battalion Chief<br />
(Shift Commander<br />
A Shift)<br />
Fire Captains (8)<br />
Fire Engineers (8)<br />
Firefighters (17)<br />
Battalion Chief<br />
(Shift Commander<br />
C Shift)<br />
Fire Captains (8)<br />
Fire Engineers (8)<br />
Firefighters (17)<br />
Assistant Department<br />
Director<br />
(Emergency Svcs)<br />
Battalion Chief<br />
(Shift Commander<br />
C Shift)<br />
Fire Captains (8)<br />
Fire Engineers (8)<br />
Firefighters (18)<br />
Battalion Chief<br />
(Training/EMS)<br />
Fire Captain<br />
(Training)<br />
Fire Captain<br />
(EMS)<br />
• Lockbox Program management<br />
• Personal Protective Equipment (PPE)<br />
inspections<br />
• Records management<br />
• Self-Contained Breathing Apparatus<br />
(SCBA) maintenance and replacement<br />
• Smoke detector installs/replacement<br />
• Training Division management<br />
Divisions<br />
Administration - Provides leadership, fiscal management, long-range planning,<br />
budget development, grant management, payroll,<br />
interdepartmental coordination, and administrative support to all<br />
divisions.<br />
Community Life Safety Education - Identifies, develops, and provides a variety <strong>of</strong> needed public<br />
education and life safety programs to the citizens <strong>of</strong> <strong>Surprise</strong>.<br />
Crisis Response - The division provides a support system to the citizens <strong>of</strong> <strong>Surprise</strong><br />
24 hours a day, seven days a week. Incidents are turned over to<br />
Crisis Response putting essential resources back in service, thus<br />
decreasing fire and police on scene times.<br />
Emergency Medical Services - Provides basic and advanced life support services to the<br />
community 24 hours a day, seven days a week while maintaining<br />
compliance with the Arizona Department <strong>of</strong> Health Services<br />
mandates for personnel and equipment resources.<br />
Operations - Responsible for maintaining an all hazards response to the city,<br />
its citizens, and all regional aid partners while ensuring the safety<br />
<strong>of</strong> operational staff at all times.<br />
Fire Prevention - Supports programs designed to reduce the loss <strong>of</strong> life and<br />
property through education, prevention, and code enforcement.<br />
118
Support Services - Provides oversight for all fire facilities, apparatus, and safety<br />
equipment maintenance ensuring compliance with federal and<br />
state mandates while maintaining the continuity <strong>of</strong> critical service<br />
delivery.<br />
Training - Coordinates training programs, inter-agency and multi-company<br />
drills, and develops training academy curriculum while<br />
maintaining compliance with safety mandates.<br />
Accomplishments, Enhancements, and Efficiencies<br />
• The Fire Department successfully procured and implemented the 800 MHz radio conversion<br />
project.<br />
• Fire received Assistance to Firefighter’s Grant (AFG), for fire prevention and safety, to conduct a<br />
community wide risk assessment for approximately $36,000. The grant allowed the Fire<br />
Department to conduct a risk assessment on 550 structures within the city <strong>of</strong> <strong>Surprise</strong>. In<br />
addition, the department received two grants from the Arizona Department <strong>of</strong> Homeland Security<br />
in conjunction with the Urban Area Security Initiative (UASI). Fire received $17,000 for meter<br />
enhancements plus $33,000 from the Chemical, Biological, Radiological, Nuclear, and High-Yield<br />
Explosives (CBRNE) program for satellite enhancements.<br />
• The department replaced nine outdated thermal imaging cameras with new equipment.<br />
• The department has procured a new pumper to replace one <strong>of</strong> the aging units in the fleet. This<br />
new pumper will be outfitted with a 1500 gallon per minute (gpm) pump, new advanced life<br />
support equipment, and all equipment needed for fire suppression activities. Fire is expecting<br />
delivery <strong>of</strong> the truck sometime in late August <strong>of</strong> 2013.<br />
• The Fire department participated in and prepared a comprehensive workforce analysis.<br />
Major Initiatives and Policy Issues<br />
• A new company <strong>of</strong>ficer tactical training program is under development for larger complex<br />
incidents. Phase 1 has been initiated with companies conducting building walk- throughs on big<br />
box structures. Phase 2 and 3 will involve the development <strong>of</strong> table top exercises and tactical<br />
simulation evaluations using tactical simulation s<strong>of</strong>tware.<br />
• Enhance FireView GIS s<strong>of</strong>tware to optimize and enhance response standards, resource<br />
allocation, and deployment strategies within the department.<br />
• Review the 2012 Fire Code for adoption in <strong>FY2014</strong>.<br />
Goals, Objectives, and Performance Measures<br />
• Department Goal: Annually review existing training curriculum, programs, facilities, inter-agency<br />
agreements, and new training opportunities to ensure the department continues to utilize the most<br />
effective training delivery plan<br />
o Objective: Ensure department personnel receive sufficient annual training to maintain<br />
compliance with applicable National Fire Protection Association standards.<br />
Performance Measures<br />
Number <strong>of</strong> target training hours<br />
per firefighter<br />
FY2011<br />
Actual<br />
FY2012<br />
Actual<br />
FY2013<br />
Target<br />
FY2013<br />
Estimate<br />
<strong>FY2014</strong><br />
Target<br />
292 238 250 200 250<br />
Number <strong>of</strong> training hours 31,518 25,783 27,000 20,000 27,000<br />
Percent <strong>of</strong> target hours attained 116% 95% 100% 74% 100%<br />
119
• Department Goal: Ensure the <strong>City</strong> <strong>of</strong> <strong>Surprise</strong> remains a viable location for new business.<br />
o Objective: Continue on path <strong>of</strong> continuous quality improvement with a long-range goal <strong>of</strong><br />
further reducing the Insurance Services Office (ISO) rating from a 3 to a 2 by FY2016.<br />
Performance Measures<br />
FY2011<br />
Actual<br />
FY2012<br />
Actual<br />
FY2013<br />
Target<br />
FY2013<br />
Estimate<br />
ISO rating 3 3 3 3 3<br />
<strong>FY2014</strong><br />
Target<br />
• Department Goal: Maintain efficient and timely inspections/plan reviews to <strong>Surprise</strong> businesses<br />
and citizens.<br />
o Objective: Inspect all commercial structures annually.<br />
o Objective: Conduct plan reviews according to department standards (20 days for new plans<br />
and 10 days for tenant improvements).<br />
o Objective: Inspect new construction in a timely efficient manner.<br />
Performance Measures<br />
FY2011<br />
Actual<br />
FY2012<br />
Actual<br />
FY2013<br />
Target<br />
FY2013<br />
Estimate<br />
<strong>FY2014</strong><br />
Target<br />
Number <strong>of</strong> inspections completed 700 944 800 500 800<br />
Number <strong>of</strong> plans reviewed 361 348 250 250 250<br />
Percent <strong>of</strong> plan review compliance N/A N/A 100% 100% 100%<br />
Number <strong>of</strong> new construction<br />
inspections<br />
N/A 568 350 400 450<br />
• Department Goal: Improve department emergency response times to better serve the needs <strong>of</strong><br />
the residents and citizens living and working in <strong>Surprise</strong>.<br />
o Objective: Review incident response data monthly to identify the nature <strong>of</strong> delays in incident<br />
responses and appropriate remedies for improvement.<br />
Performance Measures<br />
FY2011<br />
Actual<br />
FY2012<br />
Actual<br />
FY2013<br />
Target<br />
FY2013<br />
Estimate<br />
<strong>FY2014</strong><br />
Target<br />
Total incidents 11,176 12,304 12,500 12,600 13,000<br />
Percent <strong>of</strong> time 5 minute response<br />
attained*<br />
36.7% 36.3% 41% 37.7% 41%<br />
90 th percentile response time** 8:37 8:26 8:17 8:29 8:17<br />
Average response time 5:53 5:49 5:40 5:45 5:40<br />
*% <strong>of</strong> total calls where an emergency response unit arrived in 5 minutes or less. One minute for turnout and 4<br />
minutes for travel.<br />
**90% <strong>of</strong> all calls had an emergency response unit on-scene within the stated time frame.<br />
Note: Response times are an aggregate <strong>of</strong> all fire, emergency medical and special operations calls (Omega,<br />
FireView 2013).<br />
120
Fire Department<br />
General Fund Summary<br />
Major <strong>Budget</strong> Changes<br />
The <strong>FY2014</strong> budget increased by 3.79% from the FY2013 amended budget.<br />
Personnel expenditures were impacted by a 3% increase in the employer contribution for the Public<br />
Safety Retirement System and a 2.2% increase for a cost <strong>of</strong> living adjustment. In addition, the allowance<br />
for uniforms increased by $200 per employee as a result <strong>of</strong> Meet and Confer negotiations. The increase<br />
was partially <strong>of</strong>fset by a transfer <strong>of</strong> overtime to two new special revenue funds.<br />
Non-personnel costs increased 18%. This was primarily due to increases in service agreements to<br />
complete mandatory testing and maintenance, which was previously performed by a position eliminated<br />
in FY2013; increases necessary due to mandatory regional wireless conversion maintenance; and<br />
additional maintenance required on three aging cascade systems.<br />
FY2011 FY2012 FY2013 <strong>FY2014</strong> Amended to<br />
Expenditures<br />
By category<br />
Actual Actual Amended <strong>Budget</strong> <strong>Budget</strong><br />
Personnel 12,116,849 12,645,499 12,754,600 13,006,200 2%<br />
Supplies 371,143 389,713 392,300 485,900 24%<br />
Services 1,195,920 1,289,647 1,364,600 1,584,500 16%<br />
Capital 35,210 0 15,000 0 -100%<br />
Total<br />
By division<br />
13,719,122 14,324,860 14,526,500 15,076,600 4%<br />
Administration 1,559,875 1,747,947 1,808,100 2,030,600 12%<br />
Community Svcs 63,462 109,031 91,400 94,300 3%<br />
Community Life Safety Ed. 0 0 0 27,400 0%<br />
Crisis Response 106,305 115,947 26,400 30,300 15%<br />
EMS 126,129 205,266 230,800 243,500 6%<br />
Fire Ops 10,854,412 11,219,146 11,572,600 11,806,100 2%<br />
Prevention 411,387 408,036 354,400 341,800 -4%<br />
Support Svcs 417,451 340,301 268,200 313,200 17%<br />
Training 180,101 179,185 174,600 189,400 8%<br />
Total 13,719,122 14,324,860 14,526,500 15,076,600 4%<br />
Revenues<br />
By fund source<br />
Charges for Svcs/Oth 684,647 881,135 731,100 754,100 3%<br />
Total 684,647 881,135 731,100 754,100 3%<br />
121
FY2011<br />
Final<br />
FY2012<br />
Adopted<br />
FY2013<br />
Adopted<br />
<strong>FY2014</strong><br />
<strong>Budget</strong><br />
Adopted to<br />
<strong>Budget</strong><br />
Personnel<br />
Administrative Specialist 0.0 0.0 1.0 1.0 0.0<br />
Administrative Technician 2.0 2.0 1.0 1.0 0.0<br />
Assistant Department Director 2.0 2.0 2.0 2.0 0.0<br />
Battalion Chief 5.0 5.0 5.0 5.0 0.0<br />
De Department Director - Fire Chief 1.0 1.0 1.0 1.0 0.0<br />
Division Manager 1.0 1.0 1.0 1.0 0.0<br />
Fire Captain 27.0 27.0 27.0 27.0 0.0<br />
Fire Engineer 24.0 24.0 24.0 24.0 0.0<br />
Firefighter 52.0 52.0 52.0 52.0 0.0<br />
Inspector 2.0 2.0 1.0 1.0 0.0<br />
Maintenance & Operations Tech 1.0 1.0 0.0 0.0 0.0<br />
Plans Examiner 1.0 1.0 1.0 1.0 0.0<br />
Program Coordinator 1.0 1.0 0.0 0.0 0.0<br />
Program Supervisor 1.0 1.0 0.0 0.0 0.0<br />
Senior Analyst 0.0 0.0 0.0 0.0 0.0<br />
Senior Financial Analyst 1.0 1.0 1.0 1.0 0.0<br />
Service Worker/Groundskeeper 1.0 1.0 1.0 1.0 0.0<br />
Total 122.0 122.0 118.0 118.0 0.0<br />
122
Fire Department<br />
Firefighter’s Pension Fund<br />
Description<br />
The firefighter’s pension fund was established to temporarily hold or collect resources on behalf <strong>of</strong> a third<br />
party (firefighters). However, the city no longer has volunteer firefighters. Per Arizona Revised Statutes §<br />
9-981, the city may use the monies in the firefighter pension fund to pay alternative pension and benefits<br />
to firefighters not covered by Arizona State Retirement System (ASRS) or Public Safety Personnel<br />
Retirement System (PSPRS). Employees who are not eligible for ASRS, PSPRS, and are not<br />
participating in the PSPRS Drop program are eligible for an alternative pension benefit contribution.<br />
Accordingly, the city passed Resolution 09-87 in order to expend the remainder <strong>of</strong> the fund with<br />
alternative pension benefit contributions.<br />
Major <strong>Budget</strong> Changes<br />
The firefighter’s pension fund has been programmed with estimated expenditures in the fire department<br />
for alternative pension contributions. Remaining fund balance has been programmed in contingency.<br />
Revenues for this fund are comprised <strong>of</strong> a beginning fund balance and investment earnings.<br />
FY2011 FY2012 FY2013 <strong>FY2014</strong> Amended to<br />
Expenditures<br />
By category<br />
Actual Actual Amended <strong>Budget</strong> <strong>Budget</strong><br />
Personnel 0 0 0 18,000 0%<br />
Contingency 0 0 100,900 7,600 -92%<br />
Total<br />
By department<br />
0 0 100,900 25,600 -75%<br />
General Operations 0 0 100,900 7,600 -92%<br />
Fire-Emergency Services 0 0 0 18,000 0%<br />
Total 0 0 100,900 25,600 -75%<br />
Revenues<br />
By fund source<br />
Charges for Svcs/Oth 786 763 600 100 -83%<br />
Fund Balance 0 43,200 0 25,500 0%<br />
Total 786 43,963 600 25,600 4167%<br />
Personnel Summary<br />
There are no dedicated personnel assigned to this fund.<br />
123
Fire Department<br />
HALO Fund<br />
Fund Description<br />
The city is a participating partner in an intergovernmental agreement (IGA), with the city <strong>of</strong> Glendale, to<br />
cooperatively provide necessary firefighter paramedics, emergency medical services, and special<br />
operations personnel services in support <strong>of</strong> the Helicopter Air-Medical Logistics Operations (HALO)<br />
program. The Fire Department is reimbursed for the costs associated with providing these services. A<br />
new special revenue fund was established during FY2013 to manage these funds.<br />
Major <strong>Budget</strong> Changes<br />
The HALO fund was established after the adoption <strong>of</strong> the FY2013 budget. The <strong>FY2014</strong> budget consists <strong>of</strong><br />
labor charges, which occur when the city provides staffing for the HALO program. The wages incurred are<br />
fully reimbursable under the HALO contract. The <strong>FY2014</strong> budget includes an increase to allow the city to<br />
staff additional shifts on the HALO flights.<br />
FY2011 FY2012 FY2013 <strong>FY2014</strong> Amended to<br />
Expenditures Actual Actual Amended <strong>Budget</strong> <strong>Budget</strong><br />
By category<br />
Personnel 0 0 0 132,000 0%<br />
Total 0 0 0 132,000 0%<br />
By department<br />
Fire-Emergency Services 0 0 0 132,000 0%<br />
Total 0 0 0 132,000 0%<br />
Revenues<br />
By fund source<br />
Charges for Svcs/Oth 0 0 0 132,000 0%<br />
Total 0 0 0 132,000 0%<br />
Personnel Summary<br />
There are no dedicated personnel assigned to this fund.<br />
124
Fire Department<br />
Wildland Fire Fund<br />
Fund Description<br />
The wildland fire fund was set up during FY2013, as a special revenue fund, to separately manage funds<br />
related to the city’s deployment on wildland fire operations. The city is reimbursed for overtime and backfill<br />
costs incurred when <strong>Surprise</strong> Fire deploys red card certified firefighters on state or federal fires. In<br />
addition, the Fire Department recovers costs for the use <strong>of</strong> fire apparatus resources deployed on those<br />
fires.<br />
Major <strong>Budget</strong> Changes<br />
The <strong>FY2014</strong> budget consists <strong>of</strong> overtime, which allows the city to deploy to wildland fire operations. The<br />
overtime incurred is fully reimbursable by the state <strong>of</strong> Arizona. The <strong>FY2014</strong> budget includes an increase<br />
in reimbursable overtime to allow the city to deploy on additional wildland fires, as necessary.<br />
FY2011 FY2012 FY2013 <strong>FY2014</strong> Amended to<br />
Expenditures Actual Actual Amended <strong>Budget</strong> <strong>Budget</strong><br />
By category<br />
Personnel 0 0 0 118,800 0%<br />
Supplies 0 0 0 21,200 0%<br />
Total 0 0 0 140,000 0%<br />
By department<br />
Fire-Emergency Services 0 0 0 140,000 0%<br />
Total 0 0 0 140,000 0%<br />
Revenues<br />
By fund source<br />
Charges for Svcs/Oth 0 0 0 140,000 0%<br />
Total 0 0 0 140,000 0%<br />
Personnel Summary<br />
There are no dedicated personnel assigned to this fund.<br />
125
Fire Department<br />
Ambulance Contract Fund<br />
Fund Description<br />
The city is planning to enter into a contract with an ambulance company to establish and house an<br />
ambulance at one <strong>of</strong> the fire stations during peak activity times. The Fire Department will provide some<br />
staffing for the ambulance and will be reimbursed for the overtime and all other costs associated with this<br />
contract. A new special revenue fund is being established to manage these funds.<br />
Major <strong>Budget</strong> Changes<br />
The ambulance contract fund was established after the adoption <strong>of</strong> the FY2013 budget. The <strong>FY2014</strong><br />
budget includes overtime, computer and computer automated dispatch (CAD) equipment, dispatch fees,<br />
and technical fees. All expenditures related to this contract are fully reimbursable.<br />
FY2011 FY2012 FY2013 <strong>FY2014</strong> Amended to<br />
Expenditures<br />
By category<br />
Actual Actual Amended <strong>Budget</strong> <strong>Budget</strong><br />
Personnel 0 0 0 185,100 0%<br />
Services 0 0 0 40,000 0%<br />
Supplies 0 0 0 53,600 0%<br />
Total<br />
By department<br />
0 0 0 278,700 0%<br />
Fire-Emergency Services 0 0 0 278,700 0%<br />
Total 0 0 0 278,700 0%<br />
Revenues<br />
By fund source<br />
Charges for Svcs/Oth 0 0 0 278,700 0%<br />
Total 0 0 0 278,700 0%<br />
Personnel Summary<br />
There are no dedicated personnel assigned to this fund.<br />
126
Community and Economic Development<br />
Department Overview<br />
Department Description<br />
The Community and Economic Development Department provides development services, planning and<br />
zoning, building safety, code enforcement, neighborhood services, welcome center, and economic<br />
development. The department is charged with ensuring responsible planning within the current and future<br />
city limits, long range transportation planning, and that new and existing structures are safe for<br />
occupancy.<br />
Department-Wide<br />
The Community and Economic Development department is primarily funded by the general fund. In<br />
addition, it has a special revenue funds that provide restricted-use funding to support the neighborhood<br />
revitalization program. Expenditures and personnel related to the special revenue fund are included in<br />
the tables below.<br />
Expenditure <strong>Budget</strong> by Fund<br />
FY2011 FY2012 FY2013 <strong>FY2014</strong> Amended to<br />
Expenditures<br />
By fund<br />
Actual Actual Amended <strong>Budget</strong> <strong>Budget</strong><br />
General Fund 4,243,604 6,205,505 6,890,500 7,258,100 5%<br />
Donations Fund 68 0 0 0 0%<br />
General Capital Fund 194,804 0 1,100,000 1,100,000 0%<br />
NEI Neighborhood Revit. 965,271 745,552 699,000 670,000 -4%<br />
RIS Risk Management Fund 0 9,657 15,100 0 -100%<br />
SEW Wastewater Fund 0 349,383 10,000 251,000 2410%<br />
SEW Wastewater Dev Fund 0 0 0 25,000 0%<br />
TRA Transportation Improve. 29,516 51,549 300,000 260,000 -13%<br />
WAT Water Dev Fund 0 0 0 450,000 0%<br />
WAT Water Fund 1,770 20,692 40,000 30,000 -25%<br />
Total 5,435,032 7,382,337 9,054,600 10,044,100 11%<br />
FY2011<br />
Final<br />
FY2012<br />
Adopted<br />
FY2013<br />
Adopted<br />
<strong>FY2014</strong><br />
<strong>Budget</strong><br />
Adopted to<br />
<strong>Budget</strong><br />
Personnel<br />
By fund<br />
General Fund 34.2 34.8 34.1 38.6 4.5<br />
Neighborhood Revitalization Fund 1.0 1.0 1.4 1.4 0.0<br />
Total 35.2 35.8 35.5 40.0 4.5<br />
127
Organizational Chart<br />
Primary Functions<br />
• Building plan review and approval<br />
• Inspections<br />
• Code enforcement<br />
• Business attraction<br />
• Development center – one stop shop<br />
• Development coordination<br />
• Code administration<br />
• General plan development and<br />
implementation<br />
• Development review<br />
• Business retention<br />
• AZ TechCelerator<br />
• Economic development higher<br />
education<br />
• Long range transportation planning<br />
• Community clean up<br />
• Revitalization planning and<br />
implementation<br />
• Block party trailer<br />
• Welcome Center<br />
• Design development – in house<br />
• Civic education<br />
• Business outreach<br />
Divisions<br />
Administration - The Administration Division is responsible for the overall coordination <strong>of</strong> the<br />
department’s activities and performance in relation to the organization.<br />
Building Safety - The Building Safety Division reviews, approves, and inspects new<br />
developments, tenant improvements, and restorations.<br />
Code Enforcement - The Code Enforcement Division is charged with ensuring the health and safety<br />
<strong>of</strong> residents as it relates to property maintenance and zoning regulations.<br />
These activities are completed through education and enforcement.<br />
Development Services - The Development Services Division provides a single point <strong>of</strong> contact for city<br />
services to the customer so they may complete their development project in a<br />
faster, more cost efficient manner.<br />
Economic Development - The Economic Development Division provides services for business attraction,<br />
retention, and expansion. The division also provides small business assistance<br />
and administers the city’s business innovation center, the AZ TechCelerator.<br />
The Economic Development Division was shown as a separate department in<br />
fiscal year 2010.<br />
128
Neighborhood Services - Neighborhood Services is committed to improving the condition <strong>of</strong><br />
neighborhoods through reinvestment. Staff works closely with community<br />
members in implementing revitalization programs that include homeownership,<br />
housing rehabilitation, social service assistance, community education, and<br />
event coordination.<br />
Planning & Zoning - The Planning Division ensures projects are developed in accordance with city<br />
standards to promote a vibrant community. The division fosters long range<br />
planning through the creation and implementation <strong>of</strong> the general plan, village<br />
planning, and long-range transportation planning.<br />
Accomplishments, Enhancements, and Efficiencies<br />
• Successful integration <strong>of</strong> Transportation Planning into Community and Economic Development<br />
• Initiation <strong>of</strong> <strong>Surprise</strong> Transportation Plan Update<br />
• Completion <strong>of</strong> the Summer Youth Employment Program with 18 participants throughout program<br />
• Initiation <strong>of</strong> the Neighborhood Stabilization Program 3 to include the purchase <strong>of</strong> five homes to be<br />
re-sold<br />
• Created an online no-fee permit application process which allows residents and contractors the<br />
ability to apply for all water heater, water s<strong>of</strong>tener, and solar photovoltaic permits 24 hours per<br />
day, 7 days per week from their home or <strong>of</strong>fice<br />
• Allow online inspection requests and status inquiries for all permit types<br />
• AZ TechCelerator tenant winner <strong>of</strong> statewide $250,000 innovation grant<br />
• Agreement with developer to build largest building in <strong>Surprise</strong><br />
Major Initiatives and Policy Issues<br />
• Completion <strong>of</strong> travel demand forecasts and needs assessment for <strong>Surprise</strong> Transportation Plan<br />
Update<br />
• Completion <strong>of</strong> Bell Road/Grand Avenue Design Concept Report and Environmental Assessment,<br />
and selection <strong>of</strong> Preferred Alternative for intersection improvements<br />
• Expend the full initial allocation amount <strong>of</strong> the Neighborhood Stabilization Program 3 grant<br />
• Completion <strong>of</strong> Village 5 plan<br />
• Implement Council’s Strategic Framework initiatives including medical, renewable energy,<br />
economic development and recruitment <strong>of</strong> a new four year residential college or university<br />
• Completion and adoption <strong>of</strong> the General Plan 2035<br />
• Adoption <strong>of</strong> 2012 Building codes<br />
• Implementation <strong>of</strong> Self Certification Building Permit process<br />
Goals, Objectives, and Performance Measures<br />
• Department Goal: Provide accurate planning and development information to customers so they<br />
can make knowledgeable development decisions and receive timely delivery <strong>of</strong> property based<br />
services.<br />
o Objective: Assist 95% <strong>of</strong> development center customers within 15 minutes <strong>of</strong> sign-in.<br />
Performance Measures<br />
FY2011<br />
Actual<br />
FY2012<br />
Actual<br />
FY2013<br />
Target<br />
FY2013<br />
Estimate<br />
<strong>FY2014</strong><br />
Target<br />
Number <strong>of</strong> customers anticipated 7,500 8,000 8,500 8,700 8,900<br />
Number <strong>of</strong> customers assisted 7,639 8,385 8,500 8,700 8,900<br />
Average time spent per customer 11 minutes 25 minutes 20 minutes 20 minutes 20 minutes<br />
Percent <strong>of</strong> customers assisted<br />
within 15 minutes <strong>of</strong> sign in<br />
95% 81% 95% 96% 97%<br />
129
• Department Goal: The Code Enforcement Division ensures the health and safety <strong>of</strong> residents as it<br />
relates to property maintenance, zoning regulations, education and enforcement.<br />
o Objective: The number <strong>of</strong> cases opened, resolved, and inspections completed directly reflects<br />
the primary work by the Code Enforcement Division to meet the department goal.<br />
Performance Measures<br />
FY2011<br />
Actual<br />
FY2012<br />
Actual<br />
FY2013<br />
Target<br />
FY2013<br />
Estimate<br />
<strong>FY2014</strong><br />
Target<br />
Number <strong>of</strong> new cases opened 4,001 4,879 4,700 4,300 4,300<br />
Number <strong>of</strong> cases resolved 4,000 4,346 4,620 4,000 4,000<br />
Number <strong>of</strong> inspections 9,006 12,027 12,050 12,100 12,000<br />
Proactive inspections 1,812 2,675 3,000 3,150 3,150<br />
• Department Goal: The Building Safety Division reviews, approves, and inspects new development,<br />
tenant improvements and restoration<br />
o Objective: The number <strong>of</strong> plan sheets reviewed and inspections completed demonstrates the<br />
output to meet the department goal<br />
Performance Measures<br />
Average number <strong>of</strong> inspections<br />
performed (per inspector per day)<br />
Number <strong>of</strong> building permit<br />
inspections performed<br />
Number <strong>of</strong> building plan sheets<br />
reviewed<br />
Number <strong>of</strong> building reviews<br />
completed<br />
FY2011<br />
Actual<br />
FY2012<br />
Actual<br />
FY2013<br />
Target<br />
FY2013<br />
Estimate<br />
<strong>FY2014</strong><br />
Target<br />
14 16 14 23 15<br />
11,106 13,280 12,200 19,500 21,840<br />
27,561 39,802 40,000 40,000 4,400<br />
2,786 4,358 4,400 4,600 5,050<br />
• Department Goal: The Economic Development Division will assist small companies, increase large<br />
employment and retail opportunities, and aid AZ TechCelerator program tenants.<br />
o Objective: Help 20+ new small businesses, 4 large businesses, and 15 program tenants.<br />
Performance Measures<br />
FY2011<br />
Actual<br />
FY2012<br />
Actual<br />
FY2013<br />
Target<br />
FY2013<br />
Estimate<br />
<strong>FY2014</strong><br />
Target<br />
Small business start-up successes 20 22 25 35 28<br />
Large business and retail<br />
successes<br />
5 4 3 4 4<br />
AZ TechCelerator program tenants 14 15 16 14 15<br />
AZ TechCelerator<br />
events/programs<br />
4 5 4 8 8<br />
130
Community and Economic Development<br />
General Fund Summary<br />
Major <strong>Budget</strong> Changes<br />
The <strong>FY2014</strong> budget increased by 5% from the FY2013 amended budget. The increases in personnel are<br />
due to added positions <strong>of</strong> a fiscal support assistant, an inspector, and two plans examiner positions. The<br />
department is experiencing increasing workloads due to growth; therefore, these positions were added to<br />
maintain the current level <strong>of</strong> service. In addition, the conversion <strong>of</strong> a contracted part time position to a full<br />
time economic development coordinator was programmed due to the city’s efforts to decrease the use <strong>of</strong><br />
employment contracts. Personnel expenditures were also impacted by a 3% increase in the employer<br />
contribution for the Arizona State Retirement System and a 2.2% increase for a cost <strong>of</strong> living adjustment.<br />
Supplies expenditures increased by 13% for new code cycle books and subscriptions, General Plan<br />
marketing and meetings, and fuel.<br />
Services expenditures increased by 1% due to increases in travel/training and dues/memberships for<br />
added staff, printing charges, electricity rate changes, and the transfer <strong>of</strong> the TechCelerator operating<br />
budget from Public Works, Facilities Management Division. The increases were <strong>of</strong>fset by a reduction in<br />
outside services for the General Plan, contractual reimbursement <strong>of</strong> tenant electricity charges, and<br />
developer agreements.<br />
Development agreements primarily represent payments to developers for sales tax incentive agreements.<br />
Additional development agreements include expenditure authority for the payment <strong>of</strong> permit fees on<br />
behalf <strong>of</strong> job-growth related agreements.<br />
Economic development contingency <strong>of</strong> $1,000,000 is available for expenditure authority.<br />
FY2011 FY2012 FY2013 <strong>FY2014</strong> Amended to<br />
Expenditures<br />
By category<br />
Actual Actual Amended <strong>Budget</strong> <strong>Budget</strong><br />
Personnel 2,708,436 2,726,704 2,948,800 3,110,700 5%<br />
Supplies 84,806 92,936 77,900 88,400 13%<br />
Services 416,840 500,092 490,900 496,300 1%<br />
Capital 2,057 0 0 0 0%<br />
Targeted Savings 0 0 0 0 0%<br />
Dev. Agreements 1,031,464 2,885,772 2,592,900 2,562,700 -1%<br />
ED Contingency 0 0 780,000 1,000,000 28%<br />
Total<br />
By division<br />
4,243,604 6,205,505 6,890,500 7,258,100 5%<br />
Administration 192,438 262,985 223,700 229,300 3%<br />
Building Safety 785,686 794,756 784,400 1,041,100 33%<br />
Code Enforcement 525,273 528,065 551,800 566,600 3%<br />
Development Services 480,376 524,462 484,100 488,000 1%<br />
Economic Development 1,489,472 3,412,984 3,899,200 4,155,900 7%<br />
Neighborhood Svcs 186,827 138,856 302,300 171,600 -43%<br />
Planning and Zoning 583,532 543,397 645,000 605,600 -6%<br />
Total 4,243,604 6,205,505 6,890,500 7,258,100 5%<br />
131
FY2011<br />
Final<br />
FY2012<br />
Adopted<br />
FY2013<br />
Adopted<br />
<strong>FY2014</strong><br />
<strong>Budget</strong><br />
Adopted to<br />
<strong>Budget</strong><br />
Personnel<br />
Administrative Assistant 1.0 1.0 1.0 1.0 0.0<br />
Administrative Specialist 2.0 2.0 2.0 2.0 0.0<br />
Administrative Support Supervisor 0.0 0.0 0.0 0.0 0.0<br />
Ass Asst. <strong>City</strong> Manager/Dept Director 0.0 0.0 1.0 1.0 0.0<br />
Assistant Department Director 1.0 1.0 1.0 1.0 0.0<br />
Department Director 1.0 1.0 0.0 0.0 0.0<br />
Economic Dev. Coordinator 1.0 0.0 0.0 1.0 1.0<br />
Rec Economic Dev. Supervisor 0.0 0.0 1.0 1.0 0.0<br />
Fiscal Support Assistant 2.0 2.0 3.0 4.0 1.0<br />
Fiscal Support Specialist 3.0 3.0 2.0 2.0 0.0<br />
Inspector 5.0 5.0 5.0 6.0 1.0<br />
Manager 1.0 1.0 1.0 1.0 0.0<br />
Planner 5.0 5.0 3.0 3.0 0.0<br />
Plans Examiner 3.0 3.0 3.0 5.0 2.0<br />
Program Assistant 0.0 0.0 0.6 0.6 0.0<br />
Program Coordinator 1.0 1.0 1.0 1.0 0.0<br />
Program Manager 1.0 1.0 1.0 1.0 0.0<br />
Program Supervisor 1.0 1.0 1.0 1.0 0.0<br />
Senior Inspector 4.0 4.0 4.0 4.0 0.0<br />
Senior Planner 0.0 1.0 1.0 1.0 0.0<br />
Part Time 2.2 2.8 2.5 1.7 -0.8<br />
Total 34.2 34.8 34.1 38.3 4.2<br />
132
Community and Economic Development<br />
Neighborhood Revitalization Fund<br />
Description<br />
The neighborhood revitalization fund is established to track revenues and expenses associated with the<br />
city’s neighborhood revitalization program. This special revenue fund includes a combination <strong>of</strong> federal,<br />
state, and local funding sources. The neighborhood services division <strong>of</strong> the Community and Economic<br />
Development Department administers the programs associated with this fund.<br />
Accomplishments, Enhancements, and Efficiencies<br />
• Assisted 20 buyers with home purchase assistance<br />
• Purchased eight properties to be sold under the Neighborhood Stabilization Program (NSP)<br />
• Assisted 35 qualified families under the Emergency Rehabilitation Assistance<br />
• Implemented a Summer Youth Employment Program that consisted <strong>of</strong> 19 qualified youths<br />
Major <strong>Budget</strong> Changes<br />
The <strong>FY2014</strong> budget is a 4% decrease from the FY2013 amended budget.<br />
All personnel charges are budgeted in this fund and will be transferred using labor distribution charges<br />
and represent approximately 1.4 full time equivalent positions.<br />
The <strong>FY2014</strong> budget shows personnel expenditures slightly higher and services slightly lower than the<br />
FY2013 budget. The amounts and type <strong>of</strong> work varies from year to year and the numbers below reflect<br />
the estimate for <strong>FY2014</strong>.<br />
FY2011 FY2012 FY2013 <strong>FY2014</strong> Amended to<br />
Expenditures<br />
By category<br />
Actual Actual Amended <strong>Budget</strong> <strong>Budget</strong><br />
Personnel 137,482 220,027 141,100 220,000 56%<br />
Supplies 1 2,120 0 0 0%<br />
Services 450,616 523,405 557,900 450,000 -19%<br />
Capital 377,172 0 0 0 0%<br />
Total<br />
By department<br />
965,271 745,552 699,000 670,000 -4%<br />
Community Development 965,271 745,552 699,000 670,000 -4%<br />
Community Initiatives 0 0 0 0 0%<br />
Total 965,271 745,552 699,000 670,000 -4%<br />
Revenues<br />
By fund source<br />
Charges for Svcs/Oth 971,409 676,772 654,100 670,000 2%<br />
Total 971,409 676,772 654,100 670,000 2%<br />
FY2011<br />
Final<br />
FY2012<br />
Adopted<br />
FY2013<br />
Adopted<br />
<strong>FY2014</strong><br />
<strong>Budget</strong><br />
Adopted to<br />
<strong>Budget</strong><br />
Personnel<br />
Program Assistant 0.0 0.0 0.4 0.4 0.0<br />
Program Coordinator 1.0 1.0 1.0 1.0 0.0<br />
Total 1.0 1.0 1.4 1.4 0.0
<strong>Surprise</strong> <strong>City</strong> Court<br />
Department Overview<br />
Department Description<br />
The <strong>Surprise</strong> <strong>City</strong> Court’s primary function is to fairly and impartially adjudicate all cases filed in the court<br />
and to effectively obtain compliance with the court’s order, as prescribed by the Code <strong>of</strong> Judicial Conduct<br />
and all other standards as set by the Arizona Supreme Court. Court staff answers questions from the<br />
public and provides assistance to those having business at the court and also ensures accounting for<br />
both judicial and financial activities.<br />
Department-Wide<br />
The <strong>Surprise</strong> <strong>City</strong> Court is primarily funded by the general fund. In addition, it has several special revenue<br />
funds that provide restricted-use funding including the municipal count enhancement fund, the fines/fees<br />
and restitution enforcement (FARE) fund, the judicial collection enhancement fund (JCEF), and the<br />
municipal fill the gap (MFTG) fund. Expenditures and personnel related to these special revenue funds<br />
are included in the tables below.<br />
Expenditure <strong>Budget</strong> by Fund<br />
FY2011 FY2012 FY2013 <strong>FY2014</strong> Amended to<br />
Expenditures<br />
By fund<br />
Actual Actual Amended <strong>Budget</strong> <strong>Budget</strong><br />
General Fund 1,992,241 2,029,839 1,886,500 1,928,600 2%<br />
Municipal Court Enhance 82,301 78,790 451,100 491,800 9%<br />
Municipal Court FARE 10,069 0 18,500 14,700 -21%<br />
Municipal Court JCEF 53,945 0 95,800 130,600 36%<br />
Municipal Court MFTG 0 37,765 59,600 20,200 -66%<br />
Total 2,138,556 2,146,394 2,511,500 2,585,900 3%<br />
Personnel<br />
By fund<br />
FY2011<br />
Final<br />
FY2012<br />
Adopted<br />
FY2013<br />
Adopted<br />
<strong>FY2014</strong><br />
<strong>Budget</strong><br />
Adopted to<br />
<strong>Budget</strong><br />
General Fund 22.1 22.1 19.1 19.1 0.0<br />
Total 22.1 22.1 19.1 19.1 0.0<br />
134
Organizational Chart<br />
Primary Functions<br />
Organizational policies, procedures, and reports<br />
Resolution <strong>of</strong> all criminal and civil cases filed in the court<br />
Quality customer service, accurate information, and timely support<br />
Accomplishments, Enhancements, and Efficiencies<br />
working to implement an online payment program which will increase efficiency and provide a<br />
convenience to the public. Implementation is expected the summer <strong>of</strong> 2013.<br />
Major Initiatives and Policy Issues<br />
Implement state legislative changes<br />
Implement federal and state rule and policy Initiatives<br />
Implement new city ordinances<br />
Goals, Objectives, and Performance Measures<br />
Department Goal: Maintain an access and fairness rating <strong>of</strong> the court’s accessibility and treatment<br />
<strong>of</strong> customers in terms <strong>of</strong> fairness, equality, and respect.<br />
o Objective: Maintain court access and fairness.<br />
Performance Measures<br />
FY2011<br />
Actual<br />
FY2012<br />
Actual<br />
FY2013<br />
Target<br />
FY2013<br />
Estimate<br />
<strong>FY2014</strong><br />
Target<br />
Number <strong>of</strong> court visitors 48,412 48,393 46,800 46,000 47,000<br />
Number <strong>of</strong> surveys distributed 500 0* -** -** 300<br />
Number <strong>of</strong> surveys returned 351 303 -** -** 200<br />
Percent <strong>of</strong> court users surveyed with a<br />
positive experience<br />
65% 63% -** -** 75%<br />
*Number actually distributed was not counted<br />
**Survey will not be conducted in FY2013. The Court is in the process <strong>of</strong> retooling the survey and plans to launch new survey in<br />
<strong>FY2014</strong><br />
135
Department Goal: Improve customer service by ensuring case files meet established standards for<br />
completeness and accuracy <strong>of</strong> contents.<br />
o Objective: Maintain reliability and integrity <strong>of</strong> case files.<br />
Performance Measures<br />
FY2011<br />
Actual<br />
FY2012<br />
Actual<br />
FY2013<br />
Target<br />
FY2013<br />
Estimate<br />
<strong>FY2014</strong><br />
Target<br />
Total number <strong>of</strong> filings 17,057 16,167 18,872 16,500 17,000<br />
Number <strong>of</strong> cases audited 2,000 2,000 2,000 2,000 2,000<br />
Percent <strong>of</strong> cases meeting conformance<br />
criteria for timely retrieval<br />
85% 87% 88% 94% 98%<br />
Percent <strong>of</strong> cases accurate and complete 85% 86% 90% 98% 98%<br />
Department Goal: Improve “Time to Disposition” – the percentage <strong>of</strong> cases disposed or otherwise<br />
resolved within established time frames.<br />
o Objective: Resolve DUI cases according to AZ Supreme Court Standards (Administrative<br />
Order 2007-94):<br />
85% <strong>of</strong> all DUI cases must be resolved within 120 days.<br />
93% <strong>of</strong> all DUI cases must be resolved within 180 days.<br />
Performance Measures<br />
FY2011<br />
Actual<br />
FY2012<br />
Actual<br />
FY2013<br />
Target<br />
FY2013<br />
Estimate<br />
<strong>FY2014</strong><br />
Target<br />
Number <strong>of</strong> criminal cases filed 3,108 3,182 3,100 3,100 3,100<br />
Number <strong>of</strong> criminal cases resolved 4,305 4,067 3,900 3,900 3,900<br />
Percent <strong>of</strong> criminal cases resolved 139% 128% 126% 126% 126%<br />
Percent <strong>of</strong> DUI’s resolved within 120<br />
days<br />
Percent <strong>of</strong> DUI’s resolved within 180<br />
days<br />
86% 79% 85% 80% 85%<br />
96% 92% 93% 92% 93%<br />
136
<strong>City</strong> Court<br />
General Fund Summary<br />
Major <strong>Budget</strong> Changes<br />
The <strong>FY2014</strong> budget increased by 2% from the FY2013 amended budget.<br />
Personnel expenditures increased 3% overall. This increase was impacted by a 3% increase in the<br />
employer contribution for the Arizona State Retirement System and a 2.2% increase for a cost <strong>of</strong> living<br />
adjustment.<br />
FY2011 FY2012 FY2013 <strong>FY2014</strong> Amended to<br />
Expenditures Actual Actual Amended <strong>Budget</strong> <strong>Budget</strong><br />
By category<br />
Personnel 1,682,843 1,741,818 1,585,600 1,627,700 3%<br />
Supplies 28,241 29,336 28,900 28,900 0%<br />
Services 281,157 258,685 272,000 272,000 0%<br />
Total 1,992,241 2,029,839 1,886,500 1,928,600 2%<br />
By division<br />
General Ops 1,992,241 2,029,839 1,886,500 1,928,600 2%<br />
Total 1,992,241 2,029,839 1,886,500 1,928,600 2%<br />
Revenues<br />
By fund source<br />
Charges for Svcs/Oth 1,266,929 1,275,954 1,256,200 1,256,200 0%<br />
Total 1,266,929 1,275,954 1,256,200 1,256,200 0%<br />
FY2011<br />
Final<br />
FY2012<br />
Adopted<br />
FY2013<br />
Adopted<br />
<strong>FY2014</strong><br />
<strong>Budget</strong><br />
Adopted to<br />
<strong>Budget</strong><br />
Personnel<br />
Accountant/Tax Auditor 1.0 1.0 1.0 1.0 0.0<br />
Administrative Specialist 8.0 8.0 7.0 7.0 0.0<br />
Administrative Support Supervisor 2.0 2.0 2.0 2.0 0.0<br />
Administrative Technician 6.0 6.0 5.0 5.0 0.0<br />
Assistant Analyst 0.0 0.0 0.0 0.0 0.0<br />
Associate Judge 0.0 0.0 0.0 0.0 0.0<br />
Division Manager 1.0 1.0 1.0 1.0 0.0<br />
Executive Administrative Specialist 1.0 1.0 1.0 1.0 0.0<br />
Presiding Judge 1.0 1.0 1.0 1.0 0.0<br />
Program Manager 1.0 1.0 0.0 0.0 0.0<br />
Part Time 1.1 1.1 1.1 1.1 0.0<br />
Total 22.1 22.1 19.1 19.1 0.0<br />
137
<strong>City</strong> Court<br />
Municipal Court Enhancement Fund<br />
Fund Description<br />
The municipal court enhancement fund is established to account for the inflow <strong>of</strong> municipal court<br />
enhancement fees added to all fines levied by the <strong>Surprise</strong> <strong>City</strong> Court. Funds collected by this fee are to<br />
be used exclusively for capital acquisitions and court enhancements. Ordinance 02-19 established this<br />
fee effective on July 13, 2003, in order to recover the costs <strong>of</strong> administration and enforcement <strong>of</strong> court<br />
orders.<br />
Major <strong>Budget</strong> Changes<br />
The <strong>FY2014</strong> budget increased 9% over the FY2013 budget. The total <strong>FY2014</strong> budget includes planned<br />
expenditures <strong>of</strong> $109,000. The planned expenditures will be used to pay for x-ray machine registration<br />
and computer and security service agreements. Fund balance and remaining available revenue is<br />
programmed as contingency at $382,800.<br />
FY2011 FY2012 FY2013 <strong>FY2014</strong> Amended to<br />
Expenditures Actual Actual Amended <strong>Budget</strong> <strong>Budget</strong><br />
By category<br />
Supplies 0 0 0 0 0%<br />
Services 82,301 78,790 100,000 109,000 9%<br />
Capital 0 0 0 0 0%<br />
Contingency 0 0 351,100 382,800 9%<br />
Total 82,301 78,790 451,100 491,800 9%<br />
By department<br />
<strong>City</strong> Court 82,301 78,790 451,100 491,800 9%<br />
Information Services 0 0 0 0 0%<br />
Total 82,301 78,790 451,100 491,800 9%<br />
Revenues<br />
By fund source<br />
Charges for Svcs/Oth 110,161 108,075 106,900 113,000 6%<br />
Fund Balance 0 351,800 344,200 378,800 10%<br />
Total 110,161 459,875 451,100 491,800 9%<br />
Personnel Summary<br />
There are no dedicated personnel assigned to this fund.<br />
138
<strong>City</strong> Court<br />
FARE Fund<br />
Fund Description<br />
Throughout the year, the <strong>Surprise</strong> <strong>City</strong> Court may receive funds from the state pursuant to Arizona<br />
Supreme Court Administrative Order No. 2003-126 which established the Fines/Fees and Restitution<br />
Enforcement Program (FARE). FARE is a private/public partnership between the Arizona Supreme Court,<br />
Administrative Office <strong>of</strong> the Court, and Affiliated Computer Services to provide enhanced collection<br />
services to Arizona courts.<br />
In September 2010, a new special revenue fund was established to manage the funds received through<br />
participation in this program. These funds are the remaining balance <strong>of</strong> any revenues which have been<br />
divided between the Administrative Office <strong>of</strong> the Courts and local courts to recover costs incurred to<br />
administer the FARE program. Presently, no restrictions have been issued on the court’s use <strong>of</strong> these<br />
funds.<br />
Major <strong>Budget</strong> Changes<br />
The <strong>FY2014</strong> budget increased 21% over the FY2013 budget. There are no planned expenditures. Fund<br />
balance and remaining available revenue is programmed as contingency at $14,700.<br />
FY2011 FY2012 FY2013 <strong>FY2014</strong> Amended to<br />
Expenditures Actual Actual Amended <strong>Budget</strong> <strong>Budget</strong><br />
By category<br />
Services 0 0 9,000 0 -100%<br />
Capital 10,069 0 0 0 0%<br />
Contingency 0 0 9,500 14,700 55%<br />
Total 10,069 0 18,500 14,700 -21%<br />
By department<br />
<strong>City</strong> Court 10069 0 18,500 14,700 -21%<br />
Total 10,069 0 18,500 14,700 -21%<br />
Revenues<br />
By fund source<br />
Charges for Svcs/Oth 6,646 94 9,100 4,400 -52%<br />
Fund Balance 0 -94 0 10,300 0%<br />
Total 6,646 0 9,100 14,700 62%<br />
Personnel Summary<br />
There are no dedicated personnel assigned to this fund.<br />
139
<strong>City</strong> Court<br />
JCEF Fund<br />
Fund Description<br />
The <strong>City</strong> Court generates revenue through the collection <strong>of</strong> monies pursuant to the judicial collection<br />
enhancement fund (JCEF) established in A.R.S. §12-113 et seq. In September 2010, a new special<br />
revenue fund was established to manage this revenue source. Revenues generated may be used to<br />
improve the administration <strong>of</strong> justice by enhancing the enforcement <strong>of</strong> court orders. JCEF funds may also<br />
be used to train court personnel, improve, maintain, and enhance the ability to collect and manage<br />
monies assessed or received by the courts, and to improve court automation projects likely to improve<br />
case processing or the administration <strong>of</strong> justice.<br />
Major <strong>Budget</strong> Changes<br />
The <strong>FY2014</strong> budget increased 36% over the FY2013 budget. The <strong>FY2014</strong> budget includes planned<br />
expenditures <strong>of</strong> $53,300. The planned expenditures will be used to pay for travel and training, as well as<br />
computer maintenance for the courtroom computer system. Fund balance and remaining available<br />
revenue is programmed as contingency at $77,300.<br />
FY2011 FY2012 FY2013 <strong>FY2014</strong> Amended to<br />
Expenditures Actual Actual Amended <strong>Budget</strong> <strong>Budget</strong><br />
By category<br />
Personnel 18,945 0 0 0 0%<br />
Services 35,000 0 13,300 53,300 301%<br />
Contingency 0 0 82,500 77,300 -6%<br />
Total 53,945 0 95,800 130,600 36%<br />
By department<br />
<strong>City</strong> Court 53,945 0 95,800 130,600 36%<br />
Total 53,945 0 95,800 130,600 36%<br />
Revenues<br />
By fund source<br />
Charges for Svcs/Oth 22,064 22,947 500 23,000 4500%<br />
Fund Balance 0 -22,947 0 107,600 0%<br />
Total 22,064 0 500 130,600 26020%<br />
Personnel Summary<br />
There are no dedicated personnel assigned to this fund.<br />
140
<strong>City</strong> Court<br />
MFTG Fund<br />
Fund Description<br />
The <strong>Surprise</strong> <strong>City</strong> Court receives funds from the State <strong>of</strong> Arizona pursuant to the Municipal Fill the Gap<br />
Fund (MFTG) program established by A.R.S § 41-2421(J)(6) and (K). In September 2010, a new special<br />
revenue fund was established to manage these funds. Municipal courts may use these funds to improve,<br />
maintain, and enhance the ability to collect and manage monies assessed or received by the courts, to<br />
improve court automation, and to improve case processing or the administration <strong>of</strong> justice.<br />
Major <strong>Budget</strong> Changes<br />
The <strong>FY2014</strong> budget decreased 66% over the FY2013 budget. There are no planned expenditures. Fund<br />
balance and remaining available revenue is programmed as contingency at $20,200.<br />
FY2011 FY2012 FY2013 <strong>FY2014</strong> Amended to<br />
Expenditures Actual Actual Amended <strong>Budget</strong> <strong>Budget</strong><br />
By category<br />
Services 0 37,765 31,000 0 -100%<br />
Contingency 0 0 28,600 20,200 -29%<br />
Total 0 37,765 59,600 20,200 -66%<br />
By department<br />
<strong>City</strong> Court 0 37765 59,600 20,200 -66%<br />
Total 0 37,765 59,600 20,200 -66%<br />
Revenues<br />
By fund source<br />
Charges for Svcs/Oth 20,653 8,779 31,200 8,900 -71%<br />
Fund Balance 0 33,300 0 11,300 0%<br />
Total 20,653 42,079 31,200 20,200 -35%<br />
Personnel Summary<br />
There are no dedicated personnel assigned to this fund.<br />
141
Human Resources<br />
Department Overview<br />
Department Description<br />
The Human Resources Department provides service and support to city departments in recruitment/<br />
selection, compensation/classification, benefits, employee organizational planning/development and an<br />
interactive employee relations component.<br />
Additional services are risk management to include general liability and worker’s compensation<br />
insurance, Americans with Disability Act (ADA) compliance for employees and citizens.<br />
The focus <strong>of</strong> the department budget is the development and revision <strong>of</strong> effective personnel policies and<br />
procedures, effective programs in recruitment/selection, compensation/classification, self-insured medical,<br />
dental and vision benefits, and supervisory/management employee relations development and training.<br />
Staff will focus activities and provide guidance to management, supervisors, and employees in these<br />
target areas to facilitate operational consistency and excellence, legal compliance, and accurate<br />
employee data.<br />
Department-Wide<br />
The Human Resources department is primarily funded by the general fund. In addition, it has several<br />
special revenue funds that provide restricted-use funding including the employee healthcare self<br />
insurance fund, and risk management fund.<br />
Expenditure <strong>Budget</strong> by Fund<br />
FY2011 FY2012 FY2013 <strong>FY2014</strong> Amended to<br />
Expenditures<br />
By fund<br />
Actual Actual Amended <strong>Budget</strong> <strong>Budget</strong><br />
Ge General Fund 1,216,840 1,441,955 1,567,300 1,631,000 4%<br />
EMPEmployee Healthcare Fund 7,614,231 7,004,899 10,310,100 10,827,700 5%<br />
RIS Risk Management Fund 20,000 1,402,497 3,309,700 3,838,700 16%<br />
Total 8,851,071 9,849,352 15,187,100 16,297,400 7%<br />
FY2011<br />
Final<br />
FY2012<br />
Adopted<br />
FY2013<br />
Adopted<br />
<strong>FY2014</strong><br />
<strong>Budget</strong><br />
Adopted to<br />
<strong>Budget</strong><br />
Personnel<br />
By fund<br />
General Fund 10.0 11.0 10.0 10.0 0.0<br />
Healthcare Self Insurance Fund 1.0 1.0 1.0 1.0 0.0<br />
Risk Management Fund 1.0 2.0 2.0 2.0 0.0<br />
Total 12.0 14.0 13.0 13.0 0.0<br />
142
Organizational Chart<br />
The chart below reflects the organizational structure for the Human Resources Department. Three <strong>of</strong> the<br />
positions shown on the chart, a program supervisor and two senior human resources analysts, are funded<br />
in the employee healthcare self insurance fund and the risk management fund and are detailed on<br />
separate pages <strong>of</strong> this document. The remaining positions are funded in the general fund and are<br />
reflected in the personnel and expenditure tables.<br />
Primary Functions<br />
Compensation and classification system administration<br />
Employee benefits administration<br />
Federal and state regulations compliance<br />
Employee development and training<br />
Employment relations<br />
Workforce planning and development<br />
Risk management<br />
Americans with Disabilities Act administration<br />
Accomplishments, Enhancements, and Efficiencies<br />
Increased employee investigations that are conducted in-house<br />
Administrator for five boards and commissions:<br />
1. Public Safety Retirement Board - Police<br />
2. Public Safety Retirement Board - Fire<br />
3. Personnel Appeals Board<br />
4. Judicial Selection Advisory Commission<br />
5. Disability Advisory Board<br />
Enhanced city-wide training program to include supervisor academy, additional skill-based, and<br />
compliance curriculum<br />
Implemented department-wide workforce planning to assist departments in identifying required<br />
staffing and employee skill sets to ensure departmental goals and objectives are achieved<br />
143
Contributing participants in the Health and Wellness committee and the Employee Appreciation<br />
committee and serve as ex <strong>of</strong>ficio member on the Loss Trust Fund Board<br />
Effectively conducted executive recruitments for Chief Financial Officer and Presiding Judge<br />
Major Initiatives and Policy Issues<br />
Continued enhancement to existing human resource information systems to leverage self-service<br />
efficiencies and automated interfacing with other support s<strong>of</strong>tware<br />
Continued enhancement to employee development with city-wide training programs<br />
<strong>City</strong>-wide volunteer program policy and administration to continue to augment existing staff’s ability<br />
to provide quality service to citizens<br />
Creation and implementation <strong>of</strong> new Employee Policy Manual<br />
Creation and effective application <strong>of</strong> departmental standard operating procedures (SOP)<br />
Development and implementation <strong>of</strong> Memorandum <strong>of</strong> Understanding for Police and Fire<br />
departments<br />
Administration <strong>of</strong> whistleblower program<br />
Developed Fire Department salary transition step plan for future implementation<br />
Executive recruitment for Public Works Director<br />
Goals, Objectives, and Performance Measures<br />
Department Goal: Excellence in Customer Service<br />
o Objective: Provide customers with responsive, accurate, and efficient service<br />
Performance Measures<br />
Number <strong>of</strong> HR customer service<br />
contact<br />
Customer overall satisfaction<br />
rating with HR excellent or good<br />
FY2011<br />
Actual<br />
FY2012<br />
Actual<br />
FY2013<br />
Target<br />
FY2013<br />
Estimate<br />
<strong>FY2014</strong><br />
Target<br />
2,695 3,551 3,400 3,400 3,450<br />
99% 97% 95% 97% 95%<br />
Department Goal: Provide employee and organizational training and development opportunities<br />
o Objective: Present city-wide training programs in three categories: compliance, skill based,<br />
and employee engagement<br />
Performance Measures<br />
Number <strong>of</strong> compliance trainings<br />
<strong>of</strong>fered/number <strong>of</strong> attendees<br />
Number <strong>of</strong> skill based trainings<br />
<strong>of</strong>fered/number <strong>of</strong> attendees<br />
Number <strong>of</strong> employee engagement<br />
trainings <strong>of</strong>fered/number <strong>of</strong><br />
attendees<br />
*New measure, data not available.<br />
FY2011<br />
Actual<br />
FY2012<br />
Actual<br />
FY2013<br />
Target<br />
FY2013<br />
Estimate<br />
<strong>FY2014</strong><br />
Target<br />
7/150 31/529 40/540 55/1,655 50/1,500<br />
8/150 8/145 10/165 40/350 36/360<br />
---* 10/63 15/80 26/110 20/100<br />
144
Department Goal: Comply with Arizona Records Retention law<br />
o Objective: Define and implement department strategy for effective document storage and<br />
records retention<br />
Performance Measures<br />
Number <strong>of</strong> Standard Operating<br />
Procedures (SOP) developed<br />
Percentage <strong>of</strong> HR staff trained on<br />
department SOPs<br />
Number <strong>of</strong> duplicate records<br />
eliminated<br />
*New measure, data not available.<br />
FY2011<br />
Actual<br />
FY2012<br />
Actual<br />
FY2013<br />
Target<br />
FY2013<br />
Estimate<br />
<strong>FY2014</strong><br />
Target<br />
---* ---* ---* ---* 5<br />
---* ---* ---* ---* 100%<br />
---* ---* ---* ---* 15,000<br />
Department Goal: Effective management <strong>of</strong> employee relations and compliance matters<br />
o Objective: To successfully and appropriately apply policies and maintain legal compliance with<br />
Equal Employment Opportunity (EEO) related to employee matters and legislative requirements<br />
Performance Measures<br />
Number <strong>of</strong> elevated employee<br />
matters<br />
FY2011<br />
Actual<br />
FY2012<br />
Actual<br />
FY2013<br />
Target<br />
FY2013<br />
Estimate<br />
<strong>FY2014</strong><br />
Target<br />
18 74 50 50 45<br />
145
Human Resources Department<br />
General Fund Summary<br />
Major <strong>Budget</strong> Changes<br />
The <strong>FY2014</strong> budget increased by 4% from the FY2013 amended budget. Personnel expenditures were<br />
impacted by a 3% increase in the employer contribution for the Arizona State Retirement System and a<br />
2.20% increase for a cost <strong>of</strong> living adjustment.<br />
Non-personnel costs increased primarily due to the s<strong>of</strong>tware licenses for SuccessFactors. The increase<br />
was partially <strong>of</strong>fset by transfer <strong>of</strong> the service agreement expenditure for the flexible spending account<br />
administration to the Employee Healthcare fund.<br />
FY2011 FY2012 FY2013 <strong>FY2014</strong> Amended to<br />
Expenditures<br />
By category<br />
Actual Actual Amended <strong>Budget</strong> <strong>Budget</strong><br />
Personnel 765,303 874,112 884,900 941,200 6%<br />
Supplies 42,082 67,088 127,600 50,100 -61%<br />
Services 409,455 500,756 554,800 639,700 15%<br />
Total<br />
By division<br />
1,216,840 1,441,955 1,567,300 1,631,000 4%<br />
Administration 632,405 1,441,955 1,567,300 1,631,000 4%<br />
People Development 213,340<br />
0 0 0 0%<br />
People Employment 371,095<br />
0 0 0 0%<br />
Total 1,216,840 1,441,955 1,567,300 1,631,000 4%<br />
FY2011<br />
Final<br />
FY2012<br />
Adopted<br />
FY2013<br />
Adopted<br />
<strong>FY2014</strong><br />
<strong>Budget</strong><br />
Adopted to<br />
<strong>Budget</strong><br />
Personnel<br />
Administrative Specialist 0.0 0.0 0.0 0.0 0.0<br />
Department Director 1.0 1.0 1.0 1.0 0.0<br />
Human Resources Consultant 5.0 5.0 0.0 0.0 0.0<br />
Human Resources Specialist 3.0 3.0 3.0 3.0 0.0<br />
Human Resources Analyst 0.0 0.0 4.0 2.0 -2.0<br />
Manager 0.0 0.0 1.0 2.0 1.0<br />
Senior Human Resources Analyst 0.0 0.0 1.0 2.0 1.0<br />
Senior HR Consultant 1.0 2.0 0.0 0.0 0.0<br />
Total 10.0 11.0 10.0 10.0 0.0<br />
146
Human Resources<br />
Risk Management Fund<br />
Fund Description<br />
The risk management fund is established to provide general liability and workers compensation insurance<br />
coverage as well as risk management, loss control, and safety programs citywide. The fund operates as<br />
an internal service fund <strong>of</strong> the city. The costs <strong>of</strong> these services are charged directly back to appropriate<br />
funds. Risk Management is a division under the Human Resources Department.<br />
Primary Functions<br />
• Research and analysis on exposure to losses<br />
• Assist in procuring insurance coverage for such loss exposures<br />
• Investigate claims made against the city<br />
• Assist the insurance administrator in resolving claims<br />
• Provide on-going safety related training to city employees and citizens and develop city policies<br />
• Ensure compliance with current and future Americans with Disabilities (ADA) standards to both<br />
internal and external customers<br />
• Provide ADA training and ensure continuing support <strong>of</strong> the city’s Disability Advisory Commission<br />
Major <strong>Budget</strong> Changes<br />
The <strong>FY2014</strong> budget increased 6% over the FY2013 amended budget.<br />
Personnel costs decreased 37% overall. The decrease was due to the expiration <strong>of</strong> temporary<br />
employment contracts associated with the city’s post audit work. The decrease was partially <strong>of</strong>fset by a<br />
3% increase in the employer contribution for the Arizona State Retirement System and a 2.2% increase<br />
for a cost <strong>of</strong> living adjustment.<br />
Supplies decreased 100% and services increased 254% over FY2013. This was due to the<br />
reclassification <strong>of</strong> insurance coverage and claims settlement fees as a service rather than a supply.<br />
Contingency increased 32% over the FY2013 amended budget. Fund balance and remaining available<br />
revenue is programmed as contingency at $2,269,000.<br />
FY2011 FY2012 FY2013 <strong>FY2014</strong> Amended to<br />
Expenditures<br />
By category<br />
Actual Actual Amended <strong>Budget</strong> <strong>Budget</strong><br />
Personnel 137,929 158,492 270,700 171,800 -37%<br />
Supplies 1,043,037 1,038,763 1,253,700 3,700 -100%<br />
Services 139,670 274,812 394,200 1,394,200 254%<br />
Capital 54,419 0 0 0 0%<br />
Contingency 0 0 1,713,300 2,269,000 32%<br />
Total<br />
By department<br />
1,375,056 1,472,067 3,631,900 3,838,700 6%<br />
Community Development 0 9,657 15,100 0 -100%<br />
Finance 1,355,056 59,913 307,100 0 -100%<br />
Human Resources 20,000 1,402,497 3,309,700 3,838,700 16%<br />
Management & <strong>Budget</strong> 0 0 0 0 0%<br />
Total 1,375,056 1,472,067 3,631,900 3,838,700 6%<br />
Revenues<br />
By fund source<br />
Charges for Svcs/Oth 1,182,054 1,558,410 1,609,500 1,647,100 2%<br />
Total 1,182,054 1,558,410 1,609,500 1,647,100 2%
There is one human resources analyst and one program supervisor assigned to the risk management<br />
fund in <strong>FY2014</strong>. These positions are shown on the Human Resources Department organizational chart.<br />
Accomplishments, Enhancements, and Efficiencies<br />
Continued interaction between Risk Management and city departments concerning Occupational<br />
Safety and Health Administration (OSHA), ADA, worker’s compensation, and Family and Medical<br />
Leave Act (FMLA) issues<br />
Assisted in having the Disability Advisory Commission monthly meetings become televised on<br />
Channel 11<br />
Corrected recording process <strong>of</strong> recordable injury cases<br />
Developed safety reporting program Employees Yielding Effective Safety (EYES) and the Circle<br />
<strong>of</strong> Safety – Safe Backing Program supporting the awareness initiatives<br />
Initiated safety breakfast program for Public Works Departments including Water/Waste Water,<br />
Streets and Solid Waste<br />
Enhanced investigatory forms and related documents to better assist all departments’<br />
management staff in conducting administrative investigations<br />
Major Initiatives and Policy Issues<br />
Implement pro-active safety/ADA audit program to mitigate potential workplace hazards and<br />
safety issues, and comply with regulations<br />
Provide OSHA required safety training to employees<br />
Reduce worker’s compensation injury and lost day rates for <strong>FY2014</strong> by the following: Incident<br />
Rate from 4.02 to 3.8, Frequency Rate from 2.06 to 1.8, and Severity Rate from 66.42 to 62.0<br />
Continue to expand safety awareness throughout the city and capitalize on the current programs<br />
Work with new medical providers to control time loss from work, and tighten the Return to Work<br />
Program to reduce the time loss from work and restricted duty days from 1,243 days lost to 1,120<br />
Goals, Objectives, and Performance Measures<br />
Department Goal: Reduce accident and injury days<br />
o Objective: Encouraging employees to act and be safe both on and <strong>of</strong>f the job<br />
Performance Measures<br />
Number <strong>of</strong> Safety Breakfast no<br />
accident injury days (all city<br />
departments)<br />
Number <strong>of</strong> Disability Advisory<br />
Commission meetings and work<br />
study sessions<br />
FY2011<br />
Actual<br />
FY2012<br />
Actual<br />
FY2013<br />
Target<br />
FY2013<br />
Estimate<br />
<strong>FY2014</strong><br />
Target<br />
0 565 565 565 600<br />
12 18 12 12 12<br />
Number <strong>of</strong> ADA citizen inquires 0 24 12 12 12<br />
Number <strong>of</strong> ADA accommodation<br />
requests<br />
FY2011<br />
Final<br />
FY2012<br />
Adopted<br />
FY2013<br />
Adopted<br />
<strong>FY2014</strong><br />
<strong>Budget</strong><br />
Adopted to<br />
<strong>Budget</strong><br />
Personnel<br />
Manager 0.0 1.0 0.0 0.0 0.0<br />
Program Supervisor 1.0 1.0 1.0 1.0 0.0<br />
Senior Human Resources Analyst 0.0 0.0 1.0 0.0 -1.0<br />
Human Resources Analyst 0.0 0.0 0.0 1.0 1.0<br />
Total 1.0 2.0 2.0 2.0 0.0<br />
0 2 0 0 0<br />
148
Department Goal: Continue interaction between Risk Management and Human Resources<br />
concerning OSHA, ADA, and FMLA issues<br />
o Objective: Provide a safe work place for all city employees<br />
Performance Measures<br />
Reduce Experience Modifier rate<br />
(Emod)<br />
Reduce recordable injury/illness<br />
rate<br />
FY2011<br />
Actual<br />
FY2012<br />
Actual<br />
FY2013<br />
Target<br />
FY2013<br />
Estimate<br />
<strong>FY2014</strong><br />
Target<br />
.09 1.07 1.01 1.01 1.0<br />
5.37 6.72 6.0 6.0 5.5<br />
Reduce lost workday incident rate 4.23 4.75 4.5 4.5 4.25<br />
149
Human Resources<br />
Healthcare Self Insurance Fund<br />
Fund Description<br />
The healthcare self insurance fund is an internal service fund established to provide health insurance<br />
claims, plan administration, stop loss premiums, and fund reserves. The costs <strong>of</strong> these services are<br />
charged directly back to appropriate funds. Employee health insurance fund is managed by the Loss<br />
Trust Fund Board. Employee health insurance administration is managed by the Human Resources<br />
Department.<br />
Major <strong>Budget</strong> Changes<br />
The <strong>FY2014</strong> general fund budget represents a 12% increase from the FY2013 amended budget.<br />
Personnel costs increased 10% overall. The increase was due to a 3% increase in the employer<br />
contribution for the Arizona State Retirement System and a 2.2% increase for a cost <strong>of</strong> living adjustment.<br />
There is one senior human resources analyst assigned to the healthcare self insurance fund. This<br />
position is shown on the Human Resources Department organizational chart.<br />
Supplies increased 84% over FY2013 due to increases in books/subscriptions and wellness programs.<br />
Services increased 4% due to additional amounts programmed for administration <strong>of</strong> the citywide flexible<br />
spending account contract formerly budgeted in the general fund.<br />
Contingency increased 50% over the FY2013 amended budget. Fund balance and remaining available<br />
revenue is programmed as contingency at $2,498,300.<br />
FY2011 FY2012 FY2013 <strong>FY2014</strong> Amended to<br />
Expenditures<br />
By category<br />
Actual Actual Amended <strong>Budget</strong> <strong>Budget</strong><br />
Personnel 68,059 85,779 86,500 95,200 10%<br />
Supplies 11,623 15,242 25,000 46,000 84%<br />
Services 7,534,549 6,903,878 8,533,500 8,871,400 4%<br />
Contingency 0 0 1,665,100 2,498,300 50%<br />
Total<br />
By department<br />
7,614,231 7,004,899 10,310,100 11,510,900 12%<br />
Human Resources 7,614,231 7,004,899 10,310,100 11,510,900 12%<br />
Total 7,614,231 7,004,899 10,310,100 11,510,900 12%<br />
Revenues<br />
By fund source<br />
Charges for Svcs/Oth 7,571,450 8,227,342 9,033,700 9,956,900 10%<br />
Total 7,571,450 8,227,342 9,033,700 9,956,900 10%<br />
FY2011<br />
Final<br />
FY2012<br />
Adopted<br />
FY2013<br />
Adopted<br />
<strong>FY2014</strong><br />
<strong>Budget</strong><br />
Adopted to<br />
<strong>Budget</strong><br />
Personnel<br />
Human Resources Consultant 1.0 1.0 0.0 0.0 0.0<br />
Human Resources Analyst 0.0 0.0 1.0 0.0 -1.0<br />
Senior Human Resources Analyst 0.0 0.0 1.0 1.0 0.0<br />
Total 1.0 1.0 1.0 0.0 -1.0
Accomplishments, Enhancements, and Efficiencies<br />
Reduced employees’ risk factors from high to low/moderate by 8.6% as identified by the annual<br />
health risk assessment through wellness programs<br />
Attained 50% participation in Health Risk Assessments for the third year in a row from overall<br />
employee population<br />
The city’s Wellness Program has been recognized as a Fit Friendly Organization for the second<br />
year in a row by American Heart Association. The city is one <strong>of</strong> 2,776 organizations that have<br />
earned this recognition out <strong>of</strong> the 7.7 million employers nationwide<br />
Increased awareness resulted in a shift <strong>of</strong> employees’ behavior change towards health<br />
improvement by 11.9% from the previous year. The city <strong>of</strong>fered 50 Wellness events<br />
Provided Stress Management programs averaging 12% participation from total employee<br />
population with a goal <strong>of</strong> improving work/life balance<br />
o Lunchtime onsite Fitness Classes, including Yoga, Bootcamp, Nutritional/Cooking<br />
Workshops, Workshops on Parenting, Caring for Older Adults, Work/Life Balance, as well<br />
as Hiking Club on weekends<br />
Launched <strong>Surprise</strong> Community Garden and increased employee’s aptitude in nutrition, physical<br />
fitness, and reducing stress while improving the environment<br />
Major Initiatives and Policy Issues<br />
Continued development <strong>of</strong> city-wide wellness program with the goal <strong>of</strong> containing costs through<br />
health, education, and training <strong>of</strong> city employees<br />
Oversight <strong>of</strong> city’s healthcare plans to ensure continued compliance with federal healthcare<br />
reform to prevent potential penalties<br />
Development <strong>of</strong> city-wide wellness program to include Dental Wellness for employees and their<br />
dependents<br />
Continue development <strong>of</strong> Fitness Classes by adding evening classes for employees with the goal<br />
<strong>of</strong> lowering risk <strong>of</strong> chronic disease<br />
o Studies indicate that physical inactivity costs employers 15% <strong>of</strong> total healthcare<br />
expenditures<br />
Develop Nutritional Counseling Program to assist employees in strengthening long-term behavior<br />
change to attain health goals<br />
Goals, Objectives, and Performance Measures<br />
Department Goal: Contribute to cost containment measures by continuing wellness program<br />
initiatives<br />
o Objective: Provide custom wellness programs to educate, empower, and support better health<br />
among employees and family members and comply with $25,000 incentive provided by Blue<br />
Cross Blue Shield<br />
Performance Measures<br />
Number <strong>of</strong> medical wellness<br />
programs<br />
Percentage <strong>of</strong> participants <strong>of</strong> total<br />
employee benefit population at<br />
medical wellness programs<br />
Percentage <strong>of</strong> employees who<br />
complete medical Health Risk<br />
Assessment (HRA)<br />
FY2011<br />
Actual<br />
FY2012<br />
Actual<br />
FY2013<br />
Target<br />
FY2013<br />
Estimate<br />
<strong>FY2014</strong><br />
Target<br />
12 9 9 12 12<br />
17% 18% 18% 18% 19%<br />
50% 50% 50% 52% 50%<br />
151
Department Goal: Oversight <strong>of</strong> city’s healthcare plan to ensure continued compliance with<br />
healthcare reform through 2018<br />
o Objective: Apply applicable compliance laws to city’s health plan to avoid costly penalties<br />
Performance Measures<br />
FY2011<br />
Actual<br />
FY2012<br />
Actual<br />
FY2013<br />
Target<br />
100%<br />
complete<br />
FY2013<br />
Estimate<br />
100%<br />
complete<br />
Complete employer reporting <strong>of</strong><br />
health coverage on form W-2<br />
---* ---*<br />
Limit <strong>of</strong> health care flexible<br />
spending account (FSA)<br />
contribution to $2,500<br />
Employer distribution <strong>of</strong> uniform<br />
---* ---*<br />
100%<br />
complete<br />
100%<br />
complete<br />
summary <strong>of</strong> benefits to<br />
participants<br />
Federal Insurance Exchange<br />
---* ---* ---* ---*<br />
information distributed to<br />
participants<br />
*New measure, data not available<br />
---* ---* ---* ---*<br />
**Date subject to change, pending Federal Exchange completion<br />
<strong>FY2014</strong><br />
Target<br />
----<br />
---<br />
100%<br />
distributed<br />
by 7/1/13<br />
100%<br />
distributed<br />
by 1/1/14*<br />
Department Goal: Develop Dental Wellness Program for employees and dependents<br />
o Objective: Increase education and awareness for dental wellness to contain dental healthcare<br />
costs to city’s plan<br />
Performance Measures<br />
Implementation <strong>of</strong> HRA for dental<br />
wellness<br />
Percentage <strong>of</strong> participants in<br />
dental HRA<br />
Dental wellness information<br />
distributed to participants<br />
FY2011<br />
Actual<br />
FY2012<br />
Actual<br />
FY2013<br />
Target<br />
FY2013<br />
Estimate<br />
<strong>FY2014</strong><br />
Target<br />
---* ---* ---* ---* 1<br />
---* ---* ---* ---* 5%<br />
---* ---* ---* ---* 100%<br />
152
Employee Dependent<br />
Scholarship Fund<br />
Fund Description<br />
The employee dependant scholarship fund is established to temporarily hold and collect assets for a third<br />
party (employees). These assets are then awarded as scholarships to dependants <strong>of</strong> employees who are<br />
attending or plan to attend college. Two scholarships are planned for award to city <strong>of</strong> <strong>Surprise</strong> employee<br />
dependants on a merit basis prior to the commencement <strong>of</strong> fall 2013 classes.<br />
Major <strong>Budget</strong> Changes<br />
For <strong>FY2014</strong>, the employee dependent scholarship fund has been programmed with expenditures equal to<br />
the anticipated amounts <strong>of</strong> the two scholarships to be awarded. Additional fund balance is programmed<br />
as contingency. Resources for this fund are comprised <strong>of</strong> a beginning fund balance, investment earnings<br />
and revenues from a portion <strong>of</strong> the vending machine concessions in <strong>City</strong> Hall. All expenditures are<br />
dedicated to scholarships.<br />
FY2011 FY2012 FY2013 <strong>FY2014</strong> Amended to<br />
Expenditures Actual Actual Amended <strong>Budget</strong> <strong>Budget</strong><br />
By category<br />
Services 3,000 6,000 6,000 6,000 0%<br />
Contingency 0 0 3,300 100 -97%<br />
Total 3,000 6,000 9,300 6,100 -34%<br />
By department<br />
General Operations 3,000 6,000 9,300 6,100 -34%<br />
Total 3,000 6,000 9,300 6,100 -34%<br />
Revenues<br />
By fund source<br />
Charges for Svcs/Oth 1,894 1,379 1,300 1,400 8%<br />
Fund Balance 0 4,621 8,000 4,700 -41%<br />
Total 1,894 6,000 9,300 6,100 -34%<br />
Personnel Summary<br />
There are no dedicated personnel assigned to this fund.<br />
153
<strong>City</strong> Attorney’s Office<br />
Department Description<br />
The <strong>City</strong> Attorney’s Office protects the legal rights and interests <strong>of</strong> the city at all times; and provides the<br />
highest quality legal support to the city <strong>of</strong> <strong>Surprise</strong> and its residents, elected <strong>of</strong>ficials, management, and<br />
employees.<br />
Organizational Chart<br />
Deputy <strong>City</strong> Attorney<br />
Prosecution<br />
Assistant <strong>City</strong><br />
Attorney I/II<br />
(2)<br />
Assistant Analyst<br />
Administrative<br />
Specialist (3)<br />
<strong>City</strong> Attorney<br />
Analyst Deputy <strong>City</strong> Attorney<br />
Executive<br />
Administrative<br />
Specialist<br />
Assistant <strong>City</strong><br />
Attorney III<br />
Assistant <strong>City</strong><br />
Attorney I/II (2)<br />
Primary Functions<br />
• In-house legal work<br />
• Prompt and knowledgeable legal services<br />
• Advice to the Mayor and <strong>City</strong> Council and all city departments<br />
• Prepare legal forms for departmental use<br />
• Ensures compliance with applicable laws<br />
Divisions<br />
Civil- The Civil Division <strong>of</strong> the <strong>City</strong> Attorney’s Office is responsible for providing advisory and<br />
transactional legal support, which includes preparing opinions, contracts, deeds, ordinances,<br />
and resolutions. The division also defends and prosecutes civil actions on behalf <strong>of</strong> the city.<br />
Criminal- The Criminal Division <strong>of</strong> the <strong>City</strong> Attorney’s Office is responsible for prosecuting all<br />
misdemeanors and civil <strong>of</strong>fenses that occur within the city. The division also provides support<br />
and notification services to crime victims and witnesses as well as on-going support and<br />
training to the <strong>City</strong>’s Police Department and other departments as needed.<br />
154
Major <strong>Budget</strong> Changes<br />
The <strong>FY2014</strong> budget increased by 2% from the FY2013 amended budget in personnel expenditures only.<br />
Personnel expenditures were impacted by a 3% increase in the employer contribution for the Arizona<br />
State Retirement System and a 2.2% increase for a cost <strong>of</strong> living adjustment. Additionally, the conversion<br />
<strong>of</strong> two contracted attorney positions to assistant city attorney I and II positions had no budgetary impact.<br />
FY2011 FY2012 FY2013 <strong>FY2014</strong> Amended to<br />
Expenditures<br />
By category<br />
Actual Actual Amended <strong>Budget</strong> <strong>Budget</strong><br />
Personnel 1,406,440 1,530,760 1,561,600 1,597,600 2%<br />
Supplies 25,320 14,251 27,400 27,400 0%<br />
Services 114,146 106,889 160,100 160,100 0%<br />
Total<br />
By division<br />
1,545,905 1,651,900 1,749,100 1,785,100 2%<br />
Criminal 642,431 651,958 693,800 710,100 2%<br />
General Ops 903,475 999,942 1,055,300 1,075,000 2%<br />
Total 1,545,905 1,651,900 1,749,100 1,785,100 2%<br />
FY2011<br />
Final<br />
FY2012<br />
Adopted<br />
FY2013<br />
Adopted<br />
<strong>FY2014</strong><br />
<strong>Budget</strong><br />
Adopted to<br />
<strong>Budget</strong><br />
Personnel<br />
Administrative Specialist 3.0 3.0 3.0 3.0 0.0<br />
Analyst 1.0 1.0 1.0 1.0 0.0<br />
Assistant Analyst 1.0 1.0 1.0 1.0 0.0<br />
Assistant <strong>City</strong> Attorney I & II 1.0 2.0 2.0 4.0 2.0<br />
Assistant <strong>City</strong> Attorney (Contract) 2.0 2.0 2.0 0.0 -2.0<br />
Assistant <strong>City</strong> Attorney III 1.0 1.0 1.0 1.0 0.0<br />
<strong>City</strong> Attorney 1.0 1.0 1.0 1.0 0.0<br />
Department Director 0.0 0.0 0.0 0.0 0.0<br />
Deputy <strong>City</strong> Attorney 2.0 2.0 2.0 2.0 0.0<br />
Executive Administrative Specialist 1.0 1.0 1.0 1.0 0.0<br />
Total 13.0 14.0 14.0 14.0 0.0<br />
Accomplishments, Enhancements, and Efficiencies<br />
• Continued partnership with Phoenix School <strong>of</strong> Law, accepting one legal intern in the fall and<br />
spring semesters.<br />
• Participated in a series <strong>of</strong> Legal Files trainings to make more efficient use <strong>of</strong> the system to meet<br />
the growing needs <strong>of</strong> the department.<br />
• Continued participation in the West Valley Domestic Violence Fatality Review Team which was<br />
established under the National Domestic Violence Fatality Review Initiative (NDVFRI)<br />
spearheaded by Pr<strong>of</strong>essor Neil Websdale from Northern Arizona University.<br />
• Update the Request for Legal Services s<strong>of</strong>tware to better serve our customers.<br />
• Participated with consultants and auditors regarding development agreement review for accuracy<br />
<strong>of</strong> recording <strong>of</strong> information.<br />
Major Initiatives and Policy Issues<br />
• Working with the Human Resources Department to overhaul the Employee Policy Manual.<br />
• Verifying that all departments are in compliance with the Federal Labor Standards Act (FLSA).<br />
155
Community and Recreation Services<br />
Department Overview<br />
Department Description<br />
The city <strong>of</strong> <strong>Surprise</strong> Community and Recreation Services (CRS) Department is responsible for<br />
recreational programming, sports tourism events, signature and community special events, recreational<br />
facility operations, and ground maintenance <strong>of</strong> city parks. Recreation programming includes aquatics,<br />
youth and adult sports, tennis programming, library services, senior programs, teen programming, and<br />
adaptive programming. Special event and sports tourism includes spring training, regional and national<br />
tennis tournaments, as well as community and signature events such as annual surprise party event and<br />
performances in the park.<br />
Mission Statement<br />
The mission <strong>of</strong> the city <strong>of</strong> <strong>Surprise</strong> Community and Recreation Services Department is to enrich and<br />
complement the lives <strong>of</strong> <strong>Surprise</strong> residents through stewardship <strong>of</strong> our resources while providing<br />
responsive programs which promote and prioritize diversity, cultural, neighborhood, family, education,<br />
recreation, and wellness opportunities.<br />
Department-Wide<br />
The Community and Recreation Services Department is primarily funded by the general fund. In addition,<br />
it has several special revenue funds that provide restricted-use funding including the tourism fund, the net<br />
premium seating fund, and the spring training ticket surcharge fund. Expenditures and personnel related<br />
to these special revenue funds are included in the tables below.<br />
Expenditure <strong>Budget</strong> by Fund<br />
FY2011 FY2012 FY2013 <strong>FY2014</strong> Amended to<br />
Expenditures<br />
By fund<br />
Actual Actual Amended <strong>Budget</strong> <strong>Budget</strong><br />
General Fund 12,136,761 13,196,598 12,564,800 14,520,300 16%<br />
Donations Fund 517,379 119,123 180,200 267,300 48%<br />
General Capital Fund 144,062 0 0 150,000 0%<br />
Library Dev Fee Fund 0 0 0 4,589,800 0%<br />
Parks and Rec Dev Fund 833,896 795,234 795,000 4,348,200 447%<br />
Tourism Fund 0 15,000 100,000 0 -100%<br />
Grants Fund 50,000 41,724 50,000 50,000 0%<br />
Net Premium Seating 0 26,721 0 77,400 0%<br />
Spring Training Ticket Sur 0 0 100,300 301,500 201%<br />
Total 13,682,098 14,194,400 13,790,300 24,304,500 76%<br />
156
Organizational Chart<br />
Primary Functions<br />
• Provide quality, cost-effective and safe recreational programs to the community <strong>of</strong> <strong>Surprise</strong><br />
• Offer safe and clean facilities to the residents <strong>of</strong> <strong>Surprise</strong><br />
• Facilitate quality, affordable special events<br />
• Promotion <strong>of</strong> community, recreation, and sports tourism programs enhancing and creating quality<br />
<strong>of</strong> life opportunities for the residents in <strong>Surprise</strong><br />
• Parks and recreation open space and facility master planning<br />
• Oversight <strong>of</strong> personnel, budget, resources, program development, and policy development<br />
• Provides human resources support, internal and external customer service, fiscal management,<br />
and departmental marketing and promotions<br />
• Operational, organizational, and daily general facility maintenance and parks maintenance<br />
• Staff liaisons for Tourism Advisory Commission, CRS Advisory Commission, Teen Advisory<br />
Commission, Arts and Cultural Advisory Commission, and <strong>Surprise</strong> Sundancers Board<br />
Divisions<br />
Administration - The Administration Division provides leadership and overall department<br />
oversight for Community and Recreation Services, including 62 full time<br />
employees and 44 full time equivalents (FTE) in part time employee support,<br />
and five boards and commissions. The division provides fiscal oversight for<br />
an operating budget <strong>of</strong> $13.9 million and ensures revenue recovery <strong>of</strong> at<br />
least $4.4 million.<br />
157
Aquatics - The Aquatics Division manages the <strong>Surprise</strong> Aquatic Center and the<br />
Hollyhock Community Pool. Water safety, lessons, open swim, special<br />
events, swim and dive teams, and pool rentals are <strong>of</strong>fered at the pools.<br />
Campus & Park<br />
Maintenance -<br />
The Campus and Park Maintenance Division oversee turf and ground<br />
maintenance <strong>of</strong> the 140-acre <strong>Surprise</strong> Recreation Campus and 400 acres<br />
within 15 parks and recreation center grounds. Parks Maintenance supports<br />
a variety <strong>of</strong> recreational activities and provides an overall aesthetically<br />
pleasing appearance for the community. Activity includes ramada/private<br />
rental support, aquatics and splash pad maintenance, lake quality, special<br />
event support, CRS recreation sports and practice leagues support, routine<br />
grounds maintenance, maintain parks playground units, dog park, graffiti/<br />
vandalism/storm reports and repairs, and capital improvement support.<br />
Library - The Library Division provides for a service agreement with the Maricopa<br />
County Library District which operates the Northwest <strong>Surprise</strong> Regional<br />
Library and the Hollyhock Branch Library.<br />
Recreation - The Recreation Division manages programming that includes youth and adult<br />
sports, adaptive recreation, tennis, senior programs, special interest classes,<br />
summer camp, tot time, and teens totaling over 1,500 programs.<br />
Sports Tourism & Events - The Sports Tourism and Events Division is responsible for sports tourism and<br />
events as well as the operation and facility maintenance <strong>of</strong> the 145-acre<br />
<strong>Surprise</strong> Recreation Campus, specifically stadium operations. This division<br />
markets, plans, and implements events, as well as acquires<br />
sponsorships/donations for the entire department. The primary focus is to<br />
bring forward activities and events that provide an economic impact to the<br />
city which attracts local, regional, and national participants. Regular activities<br />
include Spring Training, year round Major League Baseball (MLB) training<br />
operations, Arizona Fall League, six National United States Tennis<br />
Association (USTA) events, the Cancer Treatment Centers <strong>of</strong> America<br />
(CTCA) Tennis Championships, <strong>Surprise</strong> Party, Performances in the Park,<br />
Memorial Day, Spring Eggstravaganza, and the annual 4th <strong>of</strong> July<br />
celebration.<br />
Support Services Support Services provides human resources support, internal and external<br />
customer service, procurement and contractual services, bookkeeping and<br />
departmental support to all divisions <strong>of</strong> the Community and Recreation<br />
Services department. This activity supports the recreation department as a<br />
whole.<br />
Recreation Centers Sierra Montana and Countryside Recreation Centers <strong>of</strong>fer quality, costeffective,<br />
safe, and enjoyable recreational programs and facilities to <strong>Surprise</strong><br />
residents <strong>of</strong> all ages and abilities so they can recreate, learn a variety <strong>of</strong> new<br />
skills, improve health and/or self-esteem, and socialize. Activities include<br />
facility operations and maintenance, drop-in recreation for youth and teens,<br />
special events such as father daughter dance, a variety <strong>of</strong> special interest<br />
classes, preschool programs, and teen dances. Countryside Elementary<br />
uses the gym for physical education classes and sports programs as well.<br />
Teens Teen programs provide quality, cost-effective, safe, and enjoyable teen<br />
programs to <strong>Surprise</strong> residents age 13 – 17 so they can learn lifelong skills,<br />
have a voice in their community, gain leadership skills, showcase their skills,<br />
and socialize at teen events and activities. Activities include a 15 member<br />
teen advisory commission, a youth leadership summit and program for 160<br />
youth, art competitions such as battle <strong>of</strong> the bands and teen talent, and<br />
tournaments.<br />
158
Accomplishments, Enhancements, and Efficiencies<br />
• The Community and Recreation Services Department delivered over 1,600 recreation and special<br />
events programs, servicing nearly 450,000 participants. Additionally, CRS assisted with over (20)<br />
unforeseen 3rd party events/activities during the year bringing in $200,000 in additional general<br />
fund revenue.<br />
• The 5th Annual Cancer Treatment Centers <strong>of</strong> America Tennis Championships returned to<br />
<strong>Surprise</strong>. The players that competed for the title in this leg <strong>of</strong> the Powershares Series were Tracy<br />
Austin, Martina Navratilova, Jimmy Connors, John McEnroe, Jim Courier, and Todd Martin.<br />
• All <strong>of</strong> the advisory commissions completed an annual work plan and presented an update to<br />
Council. Highlights for commissions included the selection <strong>of</strong> an all new <strong>Surprise</strong> Youth Advisory<br />
commission after updates to the bylaws and creation <strong>of</strong> a commission handbook, which now<br />
consists <strong>of</strong> 15 youth from the various schools in <strong>Surprise</strong>. Also the <strong>Surprise</strong> Tourism Commission<br />
recommended funds through the transient lodging tax (bed tax) to assist with costs <strong>of</strong> the CTCA<br />
event and the Thunderbird Artists Fine Art and Wine Festival Event.<br />
• The <strong>Surprise</strong> Stadium hosted three Korean pr<strong>of</strong>essional baseball teams one in the fall and two for<br />
spring training; the Kia Tigers, SK Wyverns, and the Nexen Heroes. The Kia Tigers and Nexen<br />
Heroes contend in the Korean Baseball Organization which is the highest level <strong>of</strong> baseball in<br />
South Korea.<br />
• <strong>Surprise</strong> hosted a record number <strong>of</strong> Sports Tournaments at the <strong>Surprise</strong> Recreation Campus. A<br />
total <strong>of</strong> 6 State Baseball tournaments featuring 53 teams. A total <strong>of</strong> 17 teams competed for the<br />
chance to advance to their respective World Series. Two American Amateur Baseball Congress<br />
World Series capped <strong>of</strong>f the summer tournament season with teams competing for a National<br />
Championship in the Gil Hodges (11 year olds) and Ken Griffey Jr. (15 year olds) divisions. A<br />
total <strong>of</strong> 16 teams between the two events generated over 450 room nights.<br />
Goals, Objectives, and Performance Measures<br />
• Department Goal: Provide quality recreation programs to residents and visitors <strong>of</strong> <strong>Surprise</strong><br />
o Objective: Provide recreation programs at a 50% revenue recovery rate or greater<br />
Performance Measures<br />
FY2011<br />
Actual<br />
FY2012<br />
Actual<br />
FY2013<br />
Target<br />
FY2013<br />
Estimate<br />
<strong>FY2014</strong><br />
Target<br />
Number <strong>of</strong> programs <strong>of</strong>fered 1,600 1,604 1,690 1,700 1,700<br />
Number <strong>of</strong> participants 178,832 185,232 187,331 190,000 190,000<br />
Revenue $1,702,301 $1,702,949 $1,612,800 $1,738,300 $1,739,800<br />
Revenue recovery (net revenue<br />
less expenses)<br />
63% 63% 64% 65% 65%<br />
• Department Goal: To provide Cactus League Spring Training Major League Baseball in the city <strong>of</strong><br />
<strong>Surprise</strong> generating an economic impact <strong>of</strong> over $30 million dollars<br />
o Objective: <strong>Surprise</strong> Stadium to have annual attendance <strong>of</strong> at least 180,000 and generate<br />
gross revenue <strong>of</strong> 4.4 million<br />
Performance Measures<br />
FY2011<br />
Actual<br />
FY2012<br />
Actual<br />
FY2013<br />
Target<br />
FY2013<br />
Estimate<br />
<strong>FY2014</strong><br />
Target<br />
Gross revenue $4,141,945 $4,799,507 $4,400,000 $4,800,000 $4,400,000<br />
Attendance 176,407 180,681 180,000 190,991 180,000<br />
Number <strong>of</strong> games 31 29 29 35 29<br />
•<br />
159
• Department Goal: Provide safe and well-maintained facilities that protect public safety, maximize<br />
the usability <strong>of</strong> facilities, and instill community pride in its parks<br />
o Objective: Maintain parks at an average level <strong>of</strong> service <strong>of</strong> 2.5 or better<br />
Performance Measures<br />
FY2011<br />
Actual<br />
FY2012<br />
Actual<br />
FY2013<br />
Target<br />
FY2013<br />
Estimate<br />
<strong>FY2014</strong><br />
Target<br />
Total park acres 392.5 392.5 392.5 392.5 392.5<br />
Actual hours <strong>of</strong> parks maintenance 66,600 66,600 68,900 65,500 68,900<br />
Maintenance cost per acre $10,015 $10,015 $9,913 $9,500 $10,000<br />
160
Community and Recreation Services<br />
General Fund Summary<br />
Major <strong>Budget</strong> Changes<br />
The <strong>FY2014</strong> budget increased by 16% from the FY2013 amended budget. The increases in personnel<br />
are due to added positions <strong>of</strong> maintenance and operations technician and three service workers for the<br />
maintenance <strong>of</strong> Asante Park, the conversion <strong>of</strong> a manager position to an administrative specialist and<br />
recreation specialist for sports tourism and special events, and increased part time positions to maintain<br />
current service levels. Personnel expenditures were also impacted by a 3% increase in the employer<br />
contribution for the Arizona State Retirement System and a 2.2% increase for a cost <strong>of</strong> living adjustment.<br />
Supplies expenditures increased by 10% to maintain current service levels and operational supplies for<br />
Asante Park.<br />
Services expenditures increased by 22% to maintain current service levels, stadium build out for CTCA<br />
tournament, library operating agreement, services for Asante Park, Spring Training team agreements,<br />
water rate changes, and electricity rate changes.<br />
Under capital, equipment is programmed for the maintenance and operations <strong>of</strong> Asante Park.<br />
FY2011 FY2012 FY2013 <strong>FY2014</strong> Amended to<br />
Expenditures<br />
By category<br />
Actual Actual Amended <strong>Budget</strong> <strong>Budget</strong><br />
Personnel 5,948,957 6,231,834 5,663,600 6,210,100 10%<br />
Supplies 1,805,795 1,973,556 1,721,400 1,889,000 10%<br />
Services 4,326,740 4,960,249 5,179,800 6,322,200 22%<br />
Capital 0 0 0 99,000 0%<br />
Targeted Savings 0 0 0 0 0%<br />
Transfer Out 55,269 30,960 0 0 0%<br />
Total<br />
By division<br />
12,136,761 13,196,598 12,564,800 14,520,300 16%<br />
Administration 431,654 476,076 610,900 567,200 -7%<br />
Aquatics 473,706 515,778 557,400 63,700 -89%<br />
Campus Operations 3,188,140 4,101,804 3,338,900 4,119,800 23%<br />
Community Promo 170,314 37,858 129,400 136,600 6%<br />
Countryside Rec 0 220,277 183,700 234,000 27%<br />
Hollyhock Comm. Pool 0 0 0 109,600 0%<br />
Library 119,318 122,871 587,300 1,064,600 81%<br />
Park Maintenance 2,274,374 2,528,405 2,212,100 2,504,400 13%<br />
Recreation 3,763,587 3,374,881 3,208,500 3,337,500 4%<br />
Sierra Montana Rec 0 290,417 246,900 256,600 4%<br />
Special Events 494,821 537,831 525,700 556,000 6%<br />
<strong>Surprise</strong> Aquatic Center 0 0 0 527,100 0%<br />
Tennis 1,220,847 990,400 964,000 1,043,200 8%<br />
Total 12,136,761 13,196,598 12,564,800 14,520,300 16%<br />
Revenues<br />
By fund source<br />
Charges for Svcs/Oth 4,073,203 4,732,333 4,452,800 4,452,800 0%<br />
Total 4,073,203 4,732,333 4,452,800 4,452,800 0%<br />
161
FY2011<br />
Final<br />
FY2012<br />
Adopted<br />
FY2013<br />
Adopted<br />
<strong>FY2014</strong><br />
<strong>Budget</strong><br />
Adopted to<br />
<strong>Budget</strong><br />
Personnel<br />
Administrative Specialist 4.0 4.0 4.0 5.0 1.0<br />
Administrative Technician 2.0 2.0 2.0 2.0 0.0<br />
Analyst 0.0 0.0 0.0 0.0 0.0<br />
Assistant Department Director 0.0 0.0 1.0 1.0 0.0<br />
Department Director 1.0 1.0 1.0 1.0 0.0<br />
Division Manager 6.0 6.0 3.0 3.0 0.0<br />
Fiscal Support Supervisor 1.0 1.0 1.0 1.0 0.0<br />
Maintenance & Operations Sup. 2.0 2.0 2.0 2.0 0.0<br />
Maintenance & Operations Tech. 14.0 14.0 8.0 9.0 1.0<br />
Manager 2.0 2.0 4.0 3.0 -1.0<br />
Program Supervisor 1.0 1.0 1.0 1.0 0.0<br />
Recreation Aide 0.0 0.0 0.0 0.0 0.0<br />
Recreation Coordinator 6.0 6.0 5.0 5.0 0.0<br />
Recreation Specialist 2.0 2.0 1.0 2.0 1.0<br />
Recreation Supervisor 5.0 5.0 5.0 5.0 0.0<br />
Senior Financial Analyst 1.0 1.0 1.0 1.0 0.0<br />
Sen Senior Maintenance & Ops. Tech. 13.0 13.0 7.0 7.0 0.0<br />
Service Worker/Groundskeeper 4.0 4.0 12.0 15.0 3.0<br />
Part Time 33.4 36.5 38.8 47.3 8.6<br />
Total 97.4 100.5 96.8 110.3 13.6<br />
162
Community and Recreation Services<br />
Tourism Fund<br />
Description<br />
The tourism fund is established to track expenses and revenue associated with the dedicated 1.52%<br />
transient lodging tax (bed tax). The fund was a newly established special revenue fund for FY2010. The<br />
city <strong>of</strong> <strong>Surprise</strong> Tourism Board recommended on January 5, 2010, as part <strong>of</strong> the on-going strategic plan<br />
development, a 1.52% increase to the transient lodging tax. The Mayor and <strong>City</strong> Council approved the<br />
increase on January 28, 2010 with Ordinance No. 2010-04. Its use is restricted to promoting and<br />
marketing tourism for the city <strong>of</strong> <strong>Surprise</strong>.<br />
Major <strong>Budget</strong> Changes<br />
Fund balance and estimated revenues are programmed as Contingency at $506,400 and is available for<br />
expenditure authority if an eligible program is brought before the Tourism Board for consideration and<br />
recommendation to the Mayor and <strong>City</strong> Council.<br />
FY2011 FY2012 FY2013 <strong>FY2014</strong> Amended to<br />
Expenditures Actual Actual Amended <strong>Budget</strong> <strong>Budget</strong><br />
By category<br />
Contingency 0 0 158,900 506,400 219%<br />
Transfer Out 0 0 0 0 0%<br />
Total 0 0 158,900 506,400 219%<br />
By department<br />
General Operations 0 0 158,900 506,400 219%<br />
Total 0 0 158,900 506,400 219%<br />
Revenues<br />
By fund source<br />
Local Sales Tax 152,605 167,852 0 172,000 0%<br />
Charges for Svcs/Oth 820 1,896 1,300 1,800 38%<br />
Fund Balance -153,425 326,700 0 332,600 0%<br />
Total 0 496,448 1,300 506,400 38854%<br />
Personnel Summary<br />
There are no dedicated personnel assigned to this fund.<br />
163
Community and Recreation Services<br />
Net Premium Seating Surcharge Fund<br />
Fund Description<br />
The net premium seating surcharge fund is a special revenue fund established in June 2012 to account<br />
for revenue and expenditures related to a ticket surcharge on the sale <strong>of</strong> spring training tickets in<br />
premium seating areas. These premium seating areas are located in the upper deck sections 201-206.<br />
The Community and Recreation Services Department is able to use this revenue to <strong>of</strong>fset expenditures<br />
related to requests made by the Texas Rangers or Kansas <strong>City</strong> Royals.<br />
Major <strong>Budget</strong> Changes<br />
The Net Premium Seating Surcharge fund was established after the adoption <strong>of</strong> the FY2013 budget. A<br />
contingency was established as no expenditures were expected. The <strong>FY2014</strong> budget request did not<br />
include a specific request for expenditures, so all fund balance and projected revenues were programmed<br />
as contingency. Requests to spend these funds will be brought before the Mayor and <strong>City</strong> Council for a<br />
transfer from the fund contingency.<br />
FY2011 FY2012 FY2013 <strong>FY2014</strong> Amended to<br />
Expenditures Actual Actual Amended <strong>Budget</strong> <strong>Budget</strong><br />
By category<br />
Services 0 26,721 0 0 0%<br />
Supplies 0 0 0 10,400 0%<br />
Contingency 0 0 0 67,000 0%<br />
Total 0 26,721 0 77,400 0%<br />
By department<br />
Community and Rec Svcs 0 26,721 0 77,400 0%<br />
Total 0 26,721 0 77,400 0%<br />
Revenues<br />
By fund source<br />
Charges for Svcs/Oth 0 25,419 0 25,500 0%<br />
Transfers In 0 30,960 0 0 0%<br />
Total 0 56,379 0 25,500 0%<br />
Personnel Summary<br />
There are no dedicated personnel assigned to this fund.<br />
164
Community and Recreation Services<br />
Spring Training Ticket Surcharge Fund<br />
Fund Description<br />
The Spring Training Ticket Surcharge fund is a special revenue fund established in June 2012 to account<br />
for revenue from a $1 per ticket surcharge on the sale <strong>of</strong> spring training tickets. The Community and<br />
Recreation Services Department is able to use this revenue to address future facility operational<br />
improvements at the stadium.<br />
Major <strong>Budget</strong> Changes<br />
The spring training ticket surcharge fund was established after the adoption <strong>of</strong> the FY2013 budget. A<br />
contingency was established as no expenditures were expected. The <strong>FY2014</strong> budget request did not<br />
include a specific request for expenditures, so all fund balance and projected revenues were programmed<br />
as contingency. Requests to spend these funds will be brought before the Mayor and <strong>City</strong> Council for a<br />
transfer from the fund contingency.<br />
FY2011 FY2012 FY2013 <strong>FY2014</strong> Amended to<br />
Expenditures Actual Actual Amended <strong>Budget</strong> <strong>Budget</strong><br />
By category<br />
Capital 0 0 100,300 0 -100%<br />
Contingency 0 0 0 301,500 0%<br />
Total 0 0 100,300 301,500 201%<br />
By department 0<br />
Community and Rec Svcs 0 0 100,300 301,500 201%<br />
Total 0 0 100,300 301,500 201%<br />
Revenues<br />
By fund source<br />
Charges for Svcs/Oth 0 100,266 0 100,600 0%<br />
Total 0 100,266 0 100,600 0%<br />
Personnel Summary<br />
There are no dedicated personnel assigned to this fund.<br />
165
Public Works<br />
Department Overview<br />
Department Description<br />
The Public Works Department includes internal city operations for vehicle maintenance and facilities<br />
management, as well as engineering, traffic engineering functions, and streets maintenance functions,<br />
and the management <strong>of</strong> the city’s water, wastewater and solid waste enterprises.<br />
Department-Wide<br />
The Public Works department is primarily funded by the general fund. In addition, it has several special<br />
revenue funds that provide restricted-use funding including the highway user revenue fund (HURF), the<br />
local transportation assistance fund II (LTAF II), the proposition 400 fund, the transportation improvement<br />
fund, the water enterprise fund, and the wastewater enterprise fund. Expenditures and personnel related<br />
to these special revenue funds are included in the tables below.<br />
Expenditure <strong>Budget</strong> by Fund<br />
FY2011 FY2012 FY2013 <strong>FY2014</strong> Amended to<br />
Expenditures<br />
By fund<br />
Actual Actual Amended <strong>Budget</strong> <strong>Budget</strong><br />
Ge General Fund 5,370,953 6,372,017 5,808,000 6,160,500 6%<br />
GEN General Capital Fund 2,013,028 1,158,409 4,406,400 3,156,100 -28%<br />
PUB Public Works Dev Fee 266,764 335,559 626,991 9,798,700 1463%<br />
SET Set-A-Side 10% Fund 0 0 0 0 0%<br />
TRA Transportation Improve. 2,765,638 1,291,490 4,145,100 5,042,000 22%<br />
GEN General Govt Dev Fee 665,466 667,359 667,000 666,500 0%<br />
HIG HURF 7,667,142 5,776,602 5,790,900 7,730,600 33%<br />
MAR Marley Park Cfd 0 0 0 0 0%<br />
STR Street Lighting Districts 2,331,732 2,406,586 2,643,700 2,743,000 4%<br />
SAN Sanitation Fund 4,739,214 7,001,503 5,656,858 8,849,800 56%<br />
WAT Water Fund 10,046,877 9,162,519 9,162,519 9,814,600 7%<br />
SEW Wastewater Fund 13,200,219 12,685,521 12,685,521 14,849,400 17%<br />
VEH Vehicle Replacement 726,680 835,650 0 1,998,000 0%<br />
LTA LTAF II 0 0 0 350,000 0%<br />
PRO Proposition 400 0 0 0 19,600 0%<br />
TRATransit 1,085,998 0 0 0 0%<br />
UNF Grants Fund 105,541 135,790 132,900 0 -100%<br />
Total 50,985,253 47,829,007 51,725,889 71,178,800 38%<br />
FY2011<br />
Final<br />
FY2012<br />
Adopted<br />
FY2013<br />
Adopted<br />
<strong>FY2014</strong><br />
<strong>Budget</strong><br />
Adopted to<br />
<strong>Budget</strong><br />
Personnel<br />
By fund<br />
General Fund 45.2 51.9 45.7 43.0 -2.7<br />
HURF 45.0 44.6 40.3 39.0 -1.3<br />
Transportation Improvement Fund 0.0 0.0 1.0 1.0 0.0<br />
Water Enterprise Fund 32.7 32.6 29.4 25.0 -3.2<br />
Wastewater Enterprise Fund 38.7 36.5 36.3 36.2 -0.1<br />
Total 204.3 199.3 186.3 175.2 -13.0<br />
166
Organizational Chart<br />
Due to the intricacies <strong>of</strong> the reporting structure within the Public Works Department, a high-level<br />
organizational chart, summarized at the division level, is provided below. Actual personnel budgeted in<br />
the general fund are detailed in the personnel table under the Major <strong>Budget</strong> Changes section by position<br />
title.<br />
Operations<br />
Assistant Director<br />
Water/Wastewater Division<br />
Environmental/Regulatory<br />
Division<br />
Solid Waste / Customer<br />
Service Division<br />
Internal Services<br />
Assistant Director<br />
Facilities Division<br />
Fleet Division<br />
Administrative Division<br />
Transit Division<br />
Public Works Director<br />
Engineering / Transportation<br />
Assistant Director<br />
Streets Division<br />
CIP Division<br />
Civil Engineering Division<br />
Traffic Engineering Division<br />
Employee Relations<br />
Division Manager<br />
Primary Functions<br />
• Civil plan review, permitting, assurance, acceptance and inspections for infrastructure to be<br />
added to city asset base built by developers<br />
• <strong>City</strong> Fleet Maintenance and Operations including all motorized equipment<br />
• <strong>City</strong> Facilities Maintenance and Operations related to HVAC, electrical, general maintenance and<br />
custodial services<br />
• Civil Infrastructure and capital projects for city including city funded and other agency funded<br />
projects<br />
• Administration <strong>of</strong> the city transit services and represent city on regional boards and commissions<br />
• Administration <strong>of</strong> city’s MS4 permit addressing storm water pollution prevention program<br />
• Regional representation involving storm water management to monitor changes and updates in<br />
federal, state, and county regulations<br />
Divisions<br />
Engineering Services - The Engineering Development Services Division provides engineering<br />
development review, civil engineering plan review, permit issuance, and<br />
construction inspection within the public right <strong>of</strong> way.<br />
Facilities Management - The Facilities Management Division is comprised <strong>of</strong> custodians and building<br />
maintenance personnel and is tasked with maintaining city buildings and<br />
facilities as well as project management <strong>of</strong> new construction.<br />
Vehicle Maintenance - The Vehicle Maintenance Division maintains and repairs the city’s fleet <strong>of</strong><br />
vehicles and equipment.<br />
Storm Water - The storm water program component <strong>of</strong> the Environmental Division is<br />
responsible for compliance with the Federal Clean Water Act (CWA), the<br />
Arizona Pollution Discharge Elimination System (AZPDES), Water Quality<br />
Permits, and enforcement <strong>of</strong> regulations regarding illegal discharges to the<br />
MS4.<br />
167
Transit - Administers city transit services and represents city on regional boards and<br />
commissions.<br />
The departmental operating structure may vary from the budgeted division structure due to current<br />
constraints in the budgetary system.<br />
Accomplishments, Enhancements, and Efficiencies<br />
• Received the Job Access and Reverse Commute (JARC) award for Federal <strong>of</strong>fset to the 571<br />
Express Route which will allow the city to add a fourth trip in each direction beginning in July<br />
2013, without increasing cost <strong>of</strong> service<br />
• Fleet and Solid Waste completed evaluation <strong>of</strong> super single operations for improved mileage and<br />
loads<br />
• Completed transition to Regionalized Dial-a-Ride service<br />
• Connected Chamber <strong>of</strong> Commerce to Central Utility Plant chill water lines, thus removing air<br />
cooled chiller<br />
• Installed two new scroll air compressors and completed new air piping for Fleet Maintenance<br />
shop<br />
Major Initiatives and Policy Issues<br />
• Determine if city intends to pursue a circulator route and identify funding options<br />
• Review the engineering development standards for minor edits or updates<br />
• Continue efforts on forming street light improvement districts in all areas<br />
• Work with <strong>City</strong> Manager’s Office to complete a Facility Use Policy<br />
Goals, Objectives, and Performance Measures<br />
• Facilities Goal: Ensure all city facilities are properly maintained and functional in the most efficient<br />
and effective manner<br />
o Objective: Emergency maintenance requests (i.e., air conditioning down, loss <strong>of</strong> power,<br />
elevator malfunction, smoke/fire alarm, continuous leak, broken window, door that can’t be<br />
secured) to be addressed within 30 minutes<br />
o Objective: Perform all maintenance work order requests within 30 day time frame<br />
o Objective: Perform custodial services within 95% <strong>of</strong> industry standard<br />
Performance Measures<br />
Percentage <strong>of</strong> emergency<br />
response – on time completion<br />
Percentage <strong>of</strong> maintenance – on<br />
time completion<br />
Custodial expenditures per sq’ for<br />
administrative/<strong>of</strong>fice facilities as<br />
compared to ICMA mean (In-<br />
house services)<br />
Custodial Expenditures per sq’ for<br />
administrative/<strong>of</strong>fice facilities as<br />
compared to ICMA Mean<br />
(Contracted services)<br />
FY2011<br />
Actual<br />
FY2012<br />
Actual<br />
FY2013<br />
Target<br />
FY2013<br />
Estimate<br />
<strong>FY2014</strong><br />
Target<br />
99% 98% 98% 96% 98%<br />
97% 95% 98% 90% 95%<br />
98% 98% 99% 97% 98%<br />
100% 100% 100% 100% 100%<br />
168
• Engineering Goal: Improve the public’s knowledge <strong>of</strong> the review process and maintain staff<br />
presence on active construction sites<br />
o Objective: Reduce the number <strong>of</strong> “third and subsequent submittals approved” by increasing<br />
approvals in the “initial submittal approval”<br />
o Objective: Maintain percentage <strong>of</strong> inspector time on site at 45% despite expected increase in<br />
permit load<br />
Performance Measures<br />
Plan review – number <strong>of</strong> sheets<br />
reviewed<br />
Plan review – percent <strong>of</strong><br />
submittals approved on first or<br />
second review<br />
Inspections – number <strong>of</strong> permits<br />
issued for civil inspection<br />
Inspection – percent <strong>of</strong> time on<br />
site<br />
* New measure, data not available<br />
FY2011<br />
Actual<br />
FY2012<br />
Actual<br />
FY2013<br />
Target<br />
FY2013<br />
Estimate<br />
<strong>FY2014</strong><br />
Target<br />
1,332 619 1,800 1,500 1,650<br />
---* ---* ---* 84% 85%<br />
174 302 400 315 350<br />
---* 48% ---* 45% 45%<br />
• Fleet Goal: Perform preventive maintenance, scheduled and unscheduled vehicle repairs and<br />
diagnostic services<br />
o Objective: Maintain service level by completing all preventative maintenance (PM) in four<br />
hours for heavy vehicles and one hour for light vehicles<br />
o Objective: Maintain standard using American Public Works Association (APWA) data <strong>of</strong> 1,415<br />
billable hours for each mechanic annually<br />
o Objective: Maintain current cost <strong>of</strong> providing services<br />
o Objective: Set and maintain a fleet miles per gallon (MPG) standard <strong>of</strong> 70%<br />
Performance Measures<br />
Percentage <strong>of</strong> PM’s completed in<br />
allowable time<br />
Percentage <strong>of</strong> billable hours for<br />
each mechanic<br />
Percentage <strong>of</strong> budget for<br />
maintenance <strong>of</strong> police and fire<br />
vehicles<br />
Percentage <strong>of</strong> fleet vehicles<br />
meeting MPG standards<br />
* New measure, data not available<br />
FY2011<br />
Actual<br />
FY2012<br />
Actual<br />
FY2013<br />
Target<br />
FY2013<br />
Estimate<br />
<strong>FY2014</strong><br />
Target<br />
94% 68% 100% 100% 100%<br />
98% 60% 88% 90% 95%<br />
49% 52% 56% 60% 60%<br />
---* ---* ---* 70% 70%<br />
169
Public Works<br />
General Fund Summary<br />
Major <strong>Budget</strong> Changes<br />
The <strong>FY2014</strong> budget increased by 6% from the FY2013 amended budget. The decreases in personnel<br />
expenditures are due to the movement <strong>of</strong> positions formerly funded directly by water, wastewater, and<br />
solid waste operations being moved back to the general fund for <strong>FY2014</strong>. Instead <strong>of</strong> direct funding, the<br />
cost <strong>of</strong> these positions will be recovered through the city’s indirect cost allocation plan. In addition, the<br />
regionalization <strong>of</strong> the Dial-A-Ride program resulted in the elimination <strong>of</strong> over ten full time equivalent<br />
positions during FY213. These decreases were <strong>of</strong>fset by a 3% increase in the employer contribution for<br />
the Arizona State Retirement System and a 2.2% increase for a cost <strong>of</strong> living adjustment.<br />
Supplies expenditures decreased by 21% due to the regionalization <strong>of</strong> Dial-A-Ride, and reductions in<br />
operating equipment and safety/first aid supplies. The decrease is <strong>of</strong>fset by the increase in repairs and<br />
maintenance.<br />
Services expenditures increased by 33% for the Valley Metro Transit contract that replaced the Dial-A-<br />
Ride program, water rate changes, electricity rate changes, and increase in lease payments for Fire<br />
Station 304. The increases were <strong>of</strong>fset by the decreases in s<strong>of</strong>tware licenses, propane/natural gas, radio<br />
equipment maintenance, generator inspection and compliance testing, and contracted janitorial services.<br />
FY2011 FY2012 FY2013 <strong>FY2014</strong> Amended to<br />
Expenditures<br />
By category<br />
Actual Actual Amended <strong>Budget</strong> <strong>Budget</strong><br />
Personnel 3,478,571 3,652,681 3,285,800 3,208,900 -2%<br />
Supplies 634,030 710,692 734,000 579,100 -21%<br />
Services 1,251,900 1,909,447 1,788,200 2,372,500 33%<br />
Capital 6,451 99,198 0 0 0%<br />
Total<br />
By division<br />
5,370,953 6,372,017 5,808,000 6,160,500 6%<br />
Development Engineering 913,230 1,026,937 906,700 1,560,200 72%<br />
Facilities Management 2,880,907 2,707,853 2,499,900 2,720,400 9%<br />
Vehicle Maintenance 1,484,833 1,557,758 1,405,900 1,552,700 10%<br />
Storm Water 90,617 118,718 23,600 22,400 -5%<br />
Transportation 1,365 960,751 971,900 304,800 -69%<br />
Total 5,370,953 6,372,017 5,808,000 6,160,500 6%<br />
Revenues<br />
By fund source<br />
Charges for Svcs/Oth 437,397 457,765 699,400 837,500 20%<br />
Total 437,397 457,765 699,400 837,500 20%<br />
170
FY2011<br />
Final<br />
FY2012<br />
Adopted<br />
FY2013<br />
Adopted<br />
<strong>FY2014</strong><br />
<strong>Budget</strong><br />
Adopted to<br />
<strong>Budget</strong><br />
Personnel<br />
Administrative Specialist 3.0 3.0 3.0 4.0 1.0<br />
Administrative Technician 0.0 0.0 0.0 1.0 1.0<br />
Assistant Department Director 0.0 0.2 0.4 1.0 0.6<br />
Associate Civil Engineer 1.0 1.0 1.0 1.0 0.0<br />
Civil Engineer 2.0 2.0 1.0 1.0 0.0<br />
Civil Engineering Supervisor 1.0 1.0 1.0 1.0 0.0<br />
Department Director 1.0 0.2 0.2 1.0 0.8<br />
Division Manager 4.0 1.8 0.0 0.0 0.0<br />
Fiscal Support Specialist 1.0 1.0 1.0 1.0 0.0<br />
IT Administrator 1.0 1.2 1.2 2.0 0.8<br />
Inspector 1.0 1.0 1.0 1.0 0.0<br />
Maintenance & Operations Spec'l. 9.0 9.0 9.0 9.0 0.0<br />
Maintenance & Operations Sup. 2.0 3.0 0.0 0.0 0.0<br />
Maintenance & Operations Tech. 1.0 1.0 1.0 1.0 0.0<br />
Manager 0.0 0.0 2.3 5.0 2.7<br />
Program Assistant 0.0 8.0 8.0 0.0 -8.0<br />
Program Supervisor 0.0 1.0 1.0 0.0 -1.0<br />
Project Manager 1.0 1.0 0.0 0.0 0.0<br />
Senior Civil Engineer 1.0 0.0 0.0 0.0 0.0<br />
Senior Financial Analyst 0.0 0.2 0.2 1.0 0.8<br />
Senior Inspector 1.0 1.0 1.0 1.0 0.0<br />
Sen Senior Maintenance & Ops. Tech. 8.0 7.0 7.0 7.0 0.0<br />
Service Worker/Groundskeeper 6.0 6.0 5.0 5.0 0.0<br />
Utilities Analyst 1.0 1.0 0.0 0.0 0.0<br />
Part Time 0.2 1.3 1.3 0.0 -1.3<br />
Total 45.2 51.9 45.7 43.0 -2.7<br />
171
Highway User Revenue Fund<br />
Fund Description<br />
The highway user revenue fund (HURF) is established to track non-transit transportation related activities.<br />
HURF is the only fund other than the general fund required by state law. The transportation, traffic<br />
engineering workgroups, and the streets division <strong>of</strong> the Public Works Department are funded by HURF.<br />
The streets division is structured in eight functions as follows: operations, asphalt, concrete, crack<br />
sealing, right <strong>of</strong> way, street sweeping, striping/signs, and pavement preservation. The transportation<br />
division is structured in three primary functions as follows: general operations, traffic management, and<br />
signals.<br />
Primary Functions<br />
Street maintenance services including asphalt patching, surface repairs and milling, level up<br />
and deep patching, pothole repairs, and crack sealing<br />
Construct, repair, and maintain sidewalks, ramps, curbs, gutters, truncated domes, utility<br />
access covers, guardrails, and barricades<br />
Street preservation including systematically applying a series <strong>of</strong> preventative maintenance<br />
treatments over the life <strong>of</strong> the pavement areas<br />
Right <strong>of</strong> way maintenance including landscaping, weed abatement, graffiti removal, response<br />
to road hazards and accidents, including street sweeping<br />
Intelligent Transportation System operation, traffic signal service and maintenance<br />
Traffic signs and markings service and maintenance<br />
Traffic engineering, planning, management, and control services<br />
Divisions<br />
Streets - Responsible for the care and maintenance <strong>of</strong> dedicated pavement,<br />
sidewalks, and rights <strong>of</strong> way within the city <strong>of</strong> <strong>Surprise</strong><br />
Traffic Engineering - Responsible for the traffic engineering operations, signal operations, signing,<br />
marking, traffic control, and Intelligent Transportation Systems for the city<br />
The departmental operating structure may vary from the budgeted division structure due to current<br />
constraints in the budgetary system.<br />
Accomplishments, Enhancements, and Efficiencies<br />
Developed performance measures for the signing and stripping workgroups that track<br />
achievements towards goals as recorded in the GPS evaluation program<br />
Placed surface treatments on 64 lane miles (26 center lane miles) <strong>of</strong> pavement as part <strong>of</strong> the<br />
annual Pavement Preservation Program at a cost <strong>of</strong> $12,048/mile<br />
Retr<strong>of</strong>itted 35 ramps at 15 arterial intersections to meet ADA requirements<br />
Redesigned street sweeper routes to increase efficiency and PM10 compliance<br />
Created a certified arborist position in the Streets Division to oversee Urban Forestry Activities,<br />
including Bell Road, and to participate in the development <strong>of</strong> a <strong>Surprise</strong> Urban Forestry Manual<br />
Enhanced the High Intensity Activated Crosswalk (HAWK) operations at the stadium to increase<br />
ease <strong>of</strong> use by the civilian patrol<br />
Established a long term signage replacement plan successful at installing 928 new traffic and<br />
street name signs in the following neighborhoods: NW Ranch, Royal Ranch, Tash, Veramonte,<br />
Orchards, and a portion <strong>of</strong> Sun <strong>City</strong> Grand<br />
172
Major Initiatives and Policy Issues<br />
Develop a long term stripping replacement program in concert with the ongoing Pavement<br />
Preservation Program<br />
Conduct a pilot study on Wireless Solar Radar Speed Displays and analyze data on the<br />
effectiveness <strong>of</strong> slowing traffic through school zones<br />
Enhance the “Traffic Signal Pre-emption” technology to more effectively clear intersections<br />
automatically for approaching emergency vehicles<br />
Conduct a pilot study on the use <strong>of</strong> radar detection at signalized intersections as a method <strong>of</strong><br />
more accurately identifying traffic flows and enhancing traffic flow during peak periods<br />
Major <strong>Budget</strong> Changes<br />
The <strong>FY2014</strong> budget increased by 33% from the FY2013 amended budget. The decreases in personnel<br />
expenditures are due to the movement <strong>of</strong> positions formerly funded directly by HURF being moved back<br />
to the general fund for <strong>FY2014</strong>. Instead <strong>of</strong> direct funding, the cost <strong>of</strong> these positions will be allocated<br />
through the city’s indirect cost allocation plan. These decreases were <strong>of</strong>fset by a 3% increase in the<br />
employer contribution for the Arizona State Retirement System and a 2.2% increase for a cost <strong>of</strong> living<br />
adjustment.<br />
Supplies expenditures increased by 6% for vehicle maintenance and street repair material.<br />
Services expenditures increased by 10% for landscape services for overseeding on Bell Road, water rate<br />
changes and usage for Loop 303 landscaping, electricity rate changes, and landfill fees. The increases<br />
were <strong>of</strong>fset by decreases in vehicle maintenance and by changing cell service carrier.<br />
FY2011 FY2012 FY2013 <strong>FY2014</strong> Amended to<br />
Expenditures<br />
By category<br />
Actual Actual Amended <strong>Budget</strong> <strong>Budget</strong><br />
Personnel 2,997,476 3,158,277 2,939,200 2,870,900 -2%<br />
Supplies 831,379 862,533 858,800 912,600 6%<br />
Services 1,717,078 1,755,792 1,992,900 2,182,500 10%<br />
Capital 49,409 0 0 0 0%<br />
Contingency 0 0 0 1,764,600 0%<br />
Transfer Out 2,071,800 0 0 0 0%<br />
Total<br />
By department<br />
7,667,142 5,776,602 5,790,900 7,730,600 33%<br />
Public Works 7,667,142 5,776,602 5,790,900 7,730,600 33%<br />
Total 7,667,142 5,776,602 5,790,900 7,730,600 33%<br />
Revenues<br />
By fund source<br />
State Shared 5,275,645 5,906,800 6,613,600 6,617,500 0%<br />
Charges for Svcs/Oth 119,679 25,377 11,400 11,600 2%<br />
Transfer In 0 0 0 0 0%<br />
Fund Balance 0 -155,575 -834,100 0 -100%<br />
Total 5,395,324 5,776,602 5,790,900 6,629,100 14%<br />
173
FY2011<br />
Final<br />
FY2012<br />
Adopted<br />
FY2013<br />
Adopted<br />
<strong>FY2014</strong><br />
<strong>Budget</strong><br />
Adopted to<br />
<strong>Budget</strong><br />
Personnel<br />
Administrative Specialist 3.0 2.4 2.4 2.0 -0.4<br />
Assistant Department Director 1.0 0.6 0.8 1.0 0.2<br />
Civil Engineering Supervisor 1.0 1.0 1.0 1.0 0.0<br />
Department Director 0.0 0.2 0.2 0.0 -0.2<br />
Division Manager 1.0 1.9 0.0 0.0 0.0<br />
IT Administrator 0.0 0.2 0.2 0.0 -0.2<br />
Maintenance & Operations Spec'l. 2.0 2.0 2.0 2.0 0.0<br />
Maintenance & Operations Sup. 4.0 3.0 1.0 1.0 0.0<br />
Maintenance & Operations Tech. 14.0 14.0 14.0 14.0 0.0<br />
Manager 0.0 0.0 1.5 1.0 -0.5<br />
Program Coordinator 2.0 2.0 3.0 3.0 0.0<br />
Program Supervisor 1.0 1.0 0.0 0.0 0.0<br />
Senior Financial Analyst 0.0 0.2 0.2 0.0 -0.2<br />
SenSenior Maintenance & Ops. Tech. 8.0 8.0 8.0 8.0 0.0<br />
Senior Planner 1.0 1.0 0.0 0.0 0.0<br />
Service Worker/Groundskeeper 7.0 7.0 6.0 6.0 0.0<br />
Total 45.0 44.6 40.3 39.0 -1.3<br />
174
Public Works<br />
Local Transportation Assistance Fund II<br />
(LTAF II)<br />
Fund Description<br />
The city receives funds from the state <strong>of</strong> Arizona pursuant to A.R.S. §28-8103, which established the<br />
local transportation assistance fund II (LTAF II) fund. The city receives a distribution <strong>of</strong> lottery money<br />
based on population. The funds may be used to fund transit operations, facilities, and equipment<br />
purchases. In June 2012, a new special revenue fund was established to manage these funds.<br />
Major <strong>Budget</strong> Changes<br />
The total FY2013 budget included expenditures <strong>of</strong> $344,000. The FY2013 budget will be established with<br />
a year-end budget amendment. The <strong>FY2014</strong> budget includes planned expenditures <strong>of</strong> $330,000. The<br />
decrease is due to a reduction in the funding allocated to the city, which varies from year to year.<br />
FY2011 FY2012 FY2013 <strong>FY2014</strong> Amended to<br />
Expenditures Actual Actual Amended <strong>Budget</strong> <strong>Budget</strong><br />
By category<br />
Personnel 0 0 0 350,000 0%<br />
Total 0 0 0 350,000 0%<br />
By department<br />
Public Works 0 0 0 350,000 0%<br />
Total 0 0 0 350,000 0%<br />
Revenues<br />
By fund source<br />
State Shared 0 0 0 350,000 0%<br />
Total 0 0 0 350,000 0%<br />
Personnel Summary<br />
There are no dedicated personnel assigned to this fund.<br />
175
Proposition 400 Fund<br />
Fund Description<br />
On November 2, 2004, Proposition 400 was passed by the voters <strong>of</strong> Maricopa County, which authorized<br />
the continuation <strong>of</strong> a countywide, half-cent sales tax for regional transportation improvements (Maricopa<br />
County Transportation Excise Tax). Proposition 400 is the major funding sources for the Maricopa<br />
Association <strong>of</strong> Governments’ (MAG) Regional Transportation Plan (RTP). The city receives funding for<br />
capital improvement projects and transportation operations as part <strong>of</strong> the RTP. In June 2012, a new<br />
special revenue fund was established to manage these funds<br />
Major <strong>Budget</strong> Changes<br />
The total FY2013 budget included expenditures <strong>of</strong> $357,000. The FY2013 budget will be established with<br />
a year-end budget amendment. The <strong>FY2014</strong> budget includes planned expenditures <strong>of</strong> $50,000. The<br />
decrease is due to a reduction in the funding allocated to the city, due to the completion <strong>of</strong> the park and<br />
ride capital improvement project.<br />
FY2011 FY2012 FY2013 <strong>FY2014</strong> Amended to<br />
Expenditures Actual Actual Amended <strong>Budget</strong> <strong>Budget</strong><br />
By category<br />
Personnel 0 0 0 19,600 0%<br />
Total 0 0 0 19,600 0%<br />
By department<br />
Public Works 0 0 0 19,600 0%<br />
Total 0 0 0 19,600 0%<br />
Revenues<br />
By fund source<br />
Charges for Svcs/Oth 0 0 0 19,600 0%<br />
Total 0 0 0 19,600 0%<br />
Personnel Summary<br />
There are no dedicated personnel assigned to this fund.<br />
176
Public Works<br />
Water Operations Fund<br />
Fund Description<br />
The water operations fund is established as an enterprise fund to account for the provision <strong>of</strong> water<br />
services to users. The Public Works Department manages this fund to provide the city and customers<br />
water for drinking, irrigation, commercial, and industrial uses in a quantity and quality that meets or<br />
exceeds standards. The department also provides water infrastructure that supports a long-term assured<br />
water supply and sustainable operations through the planning, implementation, operation, and<br />
maintenance <strong>of</strong> city <strong>of</strong> <strong>Surprise</strong> owned water facilities and systems.<br />
The Public Works Department is responsible for oversight <strong>of</strong> an agreement with Arizona American Water<br />
Company for the billing services <strong>of</strong> city <strong>of</strong> <strong>Surprise</strong> water customers. The citizens <strong>of</strong> <strong>Surprise</strong> are serviced<br />
by several water systems including EPCOR Utilities Inc., the c ity <strong>of</strong> El Mirage, the Beardsley<br />
Water Company, and the city <strong>of</strong> <strong>Surprise</strong>. The city owned system serves about one-third <strong>of</strong> the total<br />
citizens in <strong>Surprise</strong>.<br />
Primary Functions<br />
Coordinates and provides centralized administrative and management services including<br />
purchasing, budget, information technology, and management support<br />
Oversees maintenance, operation, process engineering, and administrative support services<br />
related to the drinking and reclaimed water systems<br />
Operates and maintains the drinking and reclaimed water pipeline infrastructure systems<br />
Participates in development reviews and management and planning <strong>of</strong> architectural<br />
and engineering design and construction <strong>of</strong> city capital projects<br />
Operates a centralized call center to provide one location for customer services<br />
Provides utility locating services to ensure legal compliance with the Arizona Blue Stake<br />
laws requiring all facility owners to accurately mark all underground facilities within specified<br />
time frames<br />
Ensures environmental regulatory compliance in such areas as drinking water quality, air<br />
quality, cross connection controls, water conservation and water resource management, water<br />
quality control and assurance, and data administration<br />
Divisions<br />
Administration - Maintains all the centralized administrative functions<br />
Operations - Oversees all the day-to-day operations and maintenance <strong>of</strong> the production,<br />
treatment, and distribution <strong>of</strong> drinking water<br />
CIP – Utilities - Responsible for city related water infrastructure construction projects and utility<br />
locations<br />
Customer Service - Responds to customer’s water service requests, complaints and customer<br />
needs.<br />
Utility Locating - Performs utility locating - blue stake activities<br />
Environmental - Oversees compliance and reporting aspects <strong>of</strong> the government regulations<br />
regarding reclaimed water quality, drinking water quality and supply, storm water<br />
quality, and air quality relating specifically to the city’s water facilities<br />
177
Major <strong>Budget</strong> Changes<br />
The <strong>FY2014</strong> budget decreased by 8% from the FY2013 amended budget. The decreases in personnel<br />
expenditures are due to the movement <strong>of</strong> positions formerly funded directly by water, wastewater, and<br />
solid waste operations being moved back to the general fund for <strong>FY2014</strong>. Instead <strong>of</strong> direct funding, the<br />
cost <strong>of</strong> these positions will be recovered through the city’s indirect cost allocation plan. These decreases<br />
were <strong>of</strong>fset by a 3% increase in the employer contribution for the Arizona State Retirement System and a<br />
2.2% increase for a cost <strong>of</strong> living adjustment.<br />
Supplies expenses increased by 11% for minor equipment/ tools and auto parts/lubricants. The increases<br />
were <strong>of</strong>fset by decreases in training and education supplies.<br />
Services expenses decreased by 6% for pr<strong>of</strong>essional services, equipment maintenance for water tank<br />
repair, water service billing contract relating to a reduction in miscellaneous charge billings. The<br />
decreases were <strong>of</strong>fset by increases in water rate changes, electricity rate changes, and infrastructure<br />
repairs to rehabilitate two wells and setup permanent drinking water system sample stations.<br />
Under capital, expenditures include a variable frequency drive non-potable pumps, water storage<br />
reservoir coating, and site/security improvements are programmed for the <strong>FY2014</strong> budget.<br />
Payments to the general fund in the amount <strong>of</strong> $1,244,100 are programmed in <strong>FY2014</strong> to cover<br />
the indirect costs associated with general fund personnel provided services and support to the<br />
water fund. Also programmed in the transfer to the general fund are payments in lieu <strong>of</strong> property<br />
tax (PILOT) assessments and franchise in lieu payment.<br />
The <strong>FY2014</strong> contingency budget <strong>of</strong> $1,087,100 represents a two-month operating reserve.<br />
FY2011 FY2012 FY2013 <strong>FY2014</strong> Amended to<br />
Expenditures<br />
By category<br />
Actual Actual Amended <strong>Budget</strong> <strong>Budget</strong><br />
Personnel 2,361,414 2,476,574 2,376,400 1,935,400 -19%<br />
Supplies 374,288 633,891 578,800 643,700 11%<br />
Services 4,685,252 4,095,819 4,233,000 3,980,500 -6%<br />
Capital 10,685 163,037 554,000 569,500 3%<br />
Debt Service 5,176 0 0 0 0%<br />
Depreciation 2,381,536 0 0 0 0%<br />
Contingency 0 0 1,161,000 1,087,100 -6%<br />
Transfer Out 1,758,720 1,793,198 1,763,900 1,598,400 -9%<br />
Development Agreemen 1,770 20,692 40,000 30,000 -25%<br />
Total<br />
By department<br />
11,578,841 9,183,212 10,707,100 9,844,600 -8%<br />
Community Development 1,770 20,692 40,000 30,000 -25%<br />
Economic Development 0 0 0 0 0%<br />
Finance 0 0 77,600 0 -100%<br />
General Operations 1,530,195 0 0 0 0%<br />
Information Services 0 0 0 0 0%<br />
Public Works 10,046,877 9,162,519 10,589,500 9,814,600 -7%<br />
Total 11,578,841 9,183,212 10,707,100 9,844,600 -8%<br />
Revenues<br />
By fund source<br />
Charges for Svcs/Oth 19,992,748 10,008,042 9,942,300 10,087,000 1%<br />
Transfer In 800,363 7,277 0 0 0%<br />
Total 20,793,111 10,015,318 9,942,300 10,087,000 1%
FY2011<br />
Final<br />
FY2012<br />
Adopted<br />
FY2013<br />
Adopted<br />
<strong>FY2014</strong><br />
<strong>Budget</strong><br />
Accomplishments, Enhancements, and Efficiencies<br />
Constructed 15 new vadose zone recharge wells<br />
Completed the first phase <strong>of</strong> improvements recommended by the Site and Security Master Plan<br />
for the city’s water facilities<br />
Completed rehabilitation <strong>of</strong> the Ashton Ranch Well<br />
Increased permitted volume <strong>of</strong> Sierra Verde Well and Roseview Well<br />
Recoated the interior <strong>of</strong> the Rancho Gabriela Water Supply Facility 3.5 million gallon storage<br />
reservoir.<br />
Abandonment <strong>of</strong> one agricultural well<br />
Completed rehabilitation <strong>of</strong> the Rancho Gabriela Water Tank<br />
Major Initiatives and Policy Issues<br />
Work with Finance to update development fees study for compliance with new legislation<br />
Present to Council update on Water Resources planning for policy direction<br />
Implemented the upgrade <strong>of</strong> the <strong>City</strong>’s computerized maintenance management system<br />
Rehabilitation <strong>of</strong> Ashton Ranch Tank<br />
Adopted to<br />
<strong>Budget</strong><br />
Personnel<br />
Accountant/Tax Auditor 0.0 0.0 0.0 0.0 0.0<br />
Administrative Specialist 0.0 0.2 0.2 0.0 -0.2<br />
Administrative Technician 2.0 2.4 1.4 1.0 -0.4<br />
Analyst 0.0 0.0 0.0 0.0 0.0<br />
Assistant Analyst 0.3 0.3 0.0 0.0 0.0<br />
Assistant Department Director 0.0 0.3 0.5 0.0 -0.5<br />
<strong>Budget</strong>/Accounting Manager 0.0 0.0 0.3 0.0 -0.3<br />
Department Director 0.0 0.2 0.2 0.0 -0.2<br />
Division Manager 1.0 2.4 0.5 0.0 -0.5<br />
IT Administrator 1.0 0.2 0.2 0.0 -0.2<br />
Inspector 1.0 1.0 1.0 1.0 0.0<br />
Lead Utility Technician 2.0 2.0 2.0 2.0 0.0<br />
Maintenance & Operations Spec'l. 1.0 1.0 1.0 1.0 0.0<br />
Maintenance & Operations Sup. 2.0 2.0 1.0 1.0 0.0<br />
Maintenance & Operations Tech. 3.0 3.0 3.0 3.0 0.0<br />
Manager 1.0 1.0 2.9 1.0 -1.9<br />
Program Supervisor 0.0 0.0 1.0 1.0 0.0<br />
Project Manager 2.0 2.0 1.0 1.0 0.0<br />
Senior Financial Analyst 1.3 0.5 0.2 0.0 -0.2<br />
SenSenior Maintenance & Ops. Tech. 2.0 1.0 1.0 1.0 0.0<br />
Senior Utilities Technician 4.0 4.0 4.0 4.0 0.0<br />
Utilities Analyst 5.0 5.0 4.0 4.0 0.0<br />
Utilities Supervisor 1.0 1.0 1.0 1.0 0.0<br />
Utilities Technician 3.0 3.0 3.0 3.0 0.0<br />
Total 32.7 32.6 29.4 25.0 -4.4<br />
179
Goals, Objectives, and Performance Measures<br />
Water Department Goal: Operate and maintain the drinking water facilities and distribution<br />
systems in a safe, efficient, and effective manner according American Water and Wastewater<br />
Association (AWWA)<br />
o Objective: Successfully meet the drinking water demand by placing wells in/out <strong>of</strong> service,<br />
treating high arsenic water, maintaining storage tank level, and distributing drinking water at<br />
needed volumes and pressure. Monitor flow to determine when additional facilities should be<br />
constructed.<br />
o Objective: Achieve the median value <strong>of</strong> 61.6% for preventative maintenance <strong>of</strong> assets as cited<br />
in the AWWA Benchmarking Performance Indicators<br />
o Objective: Demonstrates successful implementation <strong>of</strong> safety programs, training, and work<br />
practices<br />
o Objective: Achieve the median value <strong>of</strong> $272 per active customer to measure the operation<br />
and maintenance efficiency for the active customer accounts as cited in the AWWA<br />
Benchmarking Performance Indicators<br />
Performance Measures<br />
SPA1 WRF: Millions <strong>of</strong> gallons <strong>of</strong><br />
drinking water produced per day<br />
Preventative maintenance to total<br />
maintenance ratio (hours)<br />
FY2011<br />
Actual<br />
FY2012<br />
Actual<br />
FY2013<br />
Target<br />
FY2013<br />
Estimate<br />
<strong>FY2014</strong><br />
Target<br />
6.1 6.6 6.5 6.7 6.8<br />
---* ---* ---* ---* 61.6%<br />
OSHA recordable accidents 2 2 ---* 0 0<br />
Operations and maintenance cost<br />
per account<br />
* New measure, data not available<br />
---* ---* ---* ---* $272<br />
Water Department Goal: Provide efficient customer service to <strong>City</strong>’s water customers<br />
o Objective: Provide developers prompt response for design submittals<br />
o Objective: Provide prompt response to contractors for utility locating requests<br />
o Objective: Maintain current standard <strong>of</strong> two minutes for response on all customer service calls.<br />
o Objective: New residential water meters installed within standard timeframe <strong>of</strong> seven days<br />
upon completion <strong>of</strong> contractors requirements<br />
Performance Measures<br />
Percentage <strong>of</strong> master plans<br />
reviewed within allotted time<br />
Percent <strong>of</strong> utility locating requests<br />
completed within 48 hours<br />
Call center average speed <strong>of</strong><br />
answer<br />
Percent <strong>of</strong> new residential water<br />
meters installed within allotted<br />
time<br />
* New measure, data not available<br />
FY2011<br />
Actual<br />
FY2012<br />
Actual<br />
FY2013<br />
Target<br />
FY2013<br />
Estimate<br />
<strong>FY2014</strong><br />
Target<br />
100% 100% 95% 95% 95%<br />
97% 97% 98% 97% 98%<br />
0:32 1:53 2:00 1:53 2:00<br />
---* ---* ---* ---* 100%<br />
180
Water Department Goal: Provide high quality drinking water to our customers while complying with<br />
local, state, and federal regulations<br />
o Objective: Meet all monitoring and reporting requirements to comply with the Safe Drinking<br />
Water Act and Arizona Administrative Code<br />
o Objective: Reduce lost and unaccounted for water through proper documentation <strong>of</strong> all water<br />
uses from the city’s water system<br />
o Objective: Purchase Central Arizona Project (CAP) allotment for recharge to build city’s long<br />
term water bank.<br />
Performance Measures<br />
Compliance with federal, state,<br />
and local wastewater and water<br />
reuse regulations<br />
Lost and unaccounted water<br />
percentage<br />
Central Arizona Project (CAP)<br />
water allotment recharged<br />
FY2011<br />
Actual<br />
FY2012<br />
Actual<br />
FY2013<br />
Target<br />
FY2013<br />
Estimate<br />
<strong>FY2014</strong><br />
Target<br />
100% 100% 100% 100% 100%<br />
3.2% 6.9%
Public Works<br />
Wastewater Operations Fund<br />
Fund Description<br />
The wastewater operations fund is established as an enterprise fund to account for the provision <strong>of</strong><br />
wastewater services for the users and to protect the city and its residents from exposure to health related<br />
diseases and issues caused by inadequately treated sewage. The fund is used to plan, design,<br />
implement, operate, and maintain the city’s wastewater infrastructure in a cost effective and efficient<br />
manner. The Public Works Department strives to satisfy all federal, state, county, and local agency<br />
permits, regulations, and requirements related to the treatment <strong>of</strong> wastewater and use <strong>of</strong> the subsequent<br />
effluent. The department is also responsible for the planning, implementation, operation, and<br />
maintenance <strong>of</strong> the city’s wastewater facilities and pipes.<br />
Primary Functions<br />
• Operation and maintenance <strong>of</strong> the wastewater collections pipeline infrastructure systems<br />
• Participation in development reviews and management and planning <strong>of</strong> architectural<br />
and engineering design and construction <strong>of</strong> city capital projects<br />
• Operation <strong>of</strong> centralized call center to provide efficient customer services<br />
• Provides utility locating services to ensure legal compliance with the Arizona Blue Stake laws<br />
requiring facility owners to accurately mark underground facilities within specified time frames<br />
• Ensures environmental regulatory compliance wastewater treatment and aquifer protection, bio-<br />
solids, pretreatment, wastewater quality control and assurance, and data administration<br />
Divisions<br />
Administration - Maintains all the centralized administrative functions<br />
Operations - Management and operation <strong>of</strong> <strong>City</strong> reclaimed water system; Management and<br />
operation <strong>of</strong> <strong>City</strong> wastewater treatment and sewer collection system.<br />
CIP – Utilities - Responsible for city related sewer infrastructure construction projects and utility<br />
Locating and blue stake activities.<br />
Customer Service - Responds to customer’s wastewater service requests, complaints and customer<br />
needs<br />
Collections - Responsible for all the day-to-day operations and maintenance activities for the<br />
wastewater collection system<br />
Utility Locating - Performs utility locating - blue stake activities<br />
Environmental - Assures all regulated PW operations remain in compliance with all federal, state,<br />
county and city regulations, and hazardous materials management for all<br />
wastewater operations.<br />
Major <strong>Budget</strong> Changes<br />
The <strong>FY2014</strong> budget decreased by 13% from the FY2013 amended budget. The decreases in personnel<br />
expenditures are due to the movement <strong>of</strong> positions formerly funded directly by water, wastewater, and<br />
solid waste operations being moved back to the general fund for <strong>FY2014</strong>. Instead <strong>of</strong> direct funding, the<br />
cost <strong>of</strong> these positions will be recovered through the city’s indirect cost allocation plan. These decreases<br />
were <strong>of</strong>fset by a 3% increase in the employer contribution for the Arizona State Retirement System and a<br />
2.2% increase for a cost <strong>of</strong> living adjustment. Additionally, a utilities technician position was reclassified<br />
as a maintenance and operations technician.<br />
Supplies expenses decreased by 2% for operational supplies, furniture/equipment, and chemical<br />
supplies. The decreases were <strong>of</strong>fset by increases in fuel charges and auto parts/lubricants.<br />
Services expenses increased by 9% in pr<strong>of</strong>essional services for biosolids study, chlorine generation unit,<br />
and disinfection byproduct reduction, electricity rate changes, machinery maintenance for equipment<br />
maintenance for water tank repair, water service billing contract relating to a reduction in miscellaneous<br />
charge billings, repairs to rehabilitate two wet wells at plants one and two, removal and replacement <strong>of</strong><br />
manhole at intersection <strong>of</strong> Citrus and Peoria, travel/training, and developer reimbursements. The<br />
increases were <strong>of</strong>fset by decreases in water charges for conversion <strong>of</strong> SPA 1 to utilize plant water for<br />
processes, wastewater billing contract, and equipment crane rental for SPA 2.<br />
Under capital, expenditures include a disinfection byproduct reduction, SPA 1 WRF stabilization and dust<br />
control, SPA 1 sludge gate/wet well repairs, wet wells re-coating, site and security improvements, convert
thickening centrifuge #1 to dewatering centrifuge, SPA 2 WRF plant water system, and SPA 2 overhead<br />
crane are programmed for the <strong>FY2014</strong> budget.<br />
Payments to the general fund in the amount <strong>of</strong> $1,552,400 are programmed in <strong>FY2014</strong> to cover the<br />
indirect costs associated with general fund personnel provided services and support to the water fund.<br />
Also programmed in the transfer to the general fund are payments in lieu <strong>of</strong> property tax (PILOT)<br />
assessments and franchise in lieu payments.<br />
The <strong>FY2014</strong> contingency budget <strong>of</strong> $1,318,900 represents a two-month operating reserve.<br />
FY2011 FY2012 FY2013 <strong>FY2014</strong> Amended to<br />
Expenditures<br />
By category<br />
Actual Actual Amended <strong>Budget</strong> <strong>Budget</strong><br />
Personnel 2,933,209 2,851,461 2,919,400 2,736,700 -6%<br />
Supplies 835,753 1,170,812 1,321,800 1,296,000 -2%<br />
Services 2,836,506 3,547,284 3,753,000 4,090,100 9%<br />
Capital 31,655 3,169,086 5,154,500 3,152,800 -39%<br />
Debt Service -56,288 0 735,900 0 -100%<br />
Depreciation 6,305,168 0 0 0 0%<br />
Development Agreements 0 349,383 10,000 251,000 2410%<br />
Contingency 0 0 1,333,000 1,318,900 -1%<br />
Targeted Savings 0 0 64,500 0 -100%<br />
Transfer Out 1,959,971 1,946,879 2,034,800 2,254,900 11%<br />
Total<br />
By department<br />
14,845,974 13,034,904 17,326,900 15,100,400 -13%<br />
Community Development 0 349,383 10,000 251,000 2410%<br />
Finance 0 0 79,800 0 -100%<br />
General Operations 1,645,755 0 0 0 0%<br />
Information Services 0 0 0 0 0%<br />
Public Works 13,200,219 12,685,521 17,237,100 14,849,400 -14%<br />
Total 14,845,974 13,034,904 17,326,900 15,100,400 -13%<br />
Revenues<br />
By fund source<br />
Charges for Svcs/Oth 14,994,264 16,364,869 17,906,800 16,046,900 -10%<br />
Transfer In 2,628,287 0 0 0 0%<br />
Total 17,622,551 16,364,869 17,906,800 16,046,900 -10%
FY2011<br />
Final<br />
FY2012<br />
Adopted<br />
FY2013<br />
Adopted<br />
<strong>FY2014</strong><br />
<strong>Budget</strong><br />
Adopted to<br />
<strong>Budget</strong><br />
Personnel<br />
Accountant/Tax Auditor 0.0 0.0 0.0 0.0 0.0<br />
Administrative Specialist 1.0 1.2 1.2 1.0 -0.2<br />
Administrative Technician 3.0 2.4 2.4 2.0 -0.4<br />
Assistant Analyst 0.3 0.3 0.0 0.0 0.0<br />
Assistant Department Director 1.0 0.5 0.7 1.0 0.3<br />
<strong>Budget</strong>/Accounting Manager 0.0 0.0 0.3 0.0 -0.3<br />
Department Director 0.0 0.2 0.2 0.0 -0.2<br />
Division Manager 3.0 2.1 0.5 1.0 0.5<br />
IT Administrator 0.0 0.2 0.2 0.0 -0.2<br />
Lead Utility Technician 2.0 2.0 3.0 3.0 0.0<br />
Maintenance & Operations Spec'l. 3.0 3.0 3.0 3.0 0.0<br />
Maintenance & Operations Sup. 3.0 2.0 2.0 2.0 0.0<br />
Maintenance & Operations Tech. 2.0 1.0 1.0 2.0 1.0<br />
Manager 1.0 1.0 2.5 2.0 -0.5<br />
Project Manager 1.0 1.0 1.0 1.0 0.0<br />
Senior Financial Analyst 0.3 0.5 0.2 0.0 -0.2<br />
SenSenior Maintenance & Ops. Tech. 5.0 5.0 5.0 5.0 0.0<br />
Senior Project Manager 1.0 1.0 1.0 1.0 0.0<br />
Senior Utilities Technician 3.0 3.0 2.0 2.0 0.0<br />
Service Worker/Groundskeeper 2.0 2.0 2.0 2.0 0.0<br />
Utilities Analyst 1.0 1.0 1.0 1.0 0.0<br />
Utilities Supervisor 1.0 2.0 2.0 2.0 0.0<br />
Utilities Technician 5.0 5.0 5.0 4.0 -1.0<br />
Part Time 0.0 0.0 0.0 1.2 1.2<br />
Total 38.7 36.5 36.3 36.2 -0.1<br />
Accomplishments, Enhancements, and Efficiencies<br />
Completed the construction <strong>of</strong> 15 additional Vadose Zone Recharge Wells at the SPA1 WRF.<br />
Completed the first phase <strong>of</strong> improvements recommended by the Site and Security Master Plan<br />
for the <strong>City</strong>’s Wastewater Facilities.<br />
Completed annual refurbishment <strong>of</strong> a centrifuge.<br />
At SPA1 WRF, removed Plant 4 from service for cleaning and placed Plant 5 in service.<br />
Major Initiatives and Policy Issues<br />
Install TTHM reduction methods at SPA1 WRF.<br />
Implemented the upgrade <strong>of</strong> the <strong>City</strong>’s computerized maintenance management system (Hansen<br />
8.0).<br />
Initiate mobile solutions for utilizing tablets to collect field data and access computer programs<br />
from the field.<br />
Public Works Safety Committee implemented a working safely recognition program.<br />
Complete inventory and asset<br />
184
Goals, Objectives, and Performance Measures<br />
Wastewater Department Goal: Operate and maintain the SPA 1 and SPA2 water reclamation<br />
facilities (WRF) and wastewater collection systems in an effective manner.<br />
o Objective: Successfully treat all <strong>of</strong> the wastewater received at the WRF and monitor influent<br />
flow to determine when additional facilities should be placed in service or constructed.<br />
o Objective: Achieve the median value <strong>of</strong> 66.5% for investing in preventative maintenance <strong>of</strong><br />
assets as cited in the AWWA Benchmarking Performance Indicators.<br />
o Objective: Clean 100 miles <strong>of</strong> the <strong>City</strong>’s sewer system annually so that the entire system is<br />
cleaned in a 5 year period by following the EPA’s capacity, management, operations, and<br />
maintenance (CMOM) program to prevent sanitary sewer overflows (SSOs).<br />
Performance Measures<br />
SPA1 WRF: Percentage <strong>of</strong><br />
millions <strong>of</strong> gallons <strong>of</strong> wastewater<br />
treated per day vs. capacity<br />
SPA2 WRF: millions <strong>of</strong> gallons <strong>of</strong><br />
wastewater treated per day<br />
Preventative maintenance to total<br />
maintenance ratio (hours)<br />
Percentage <strong>of</strong> miles <strong>of</strong> wastewater<br />
collection system cleaned<br />
FY2011<br />
Actual<br />
FY2012<br />
Actual<br />
FY2013<br />
Target<br />
FY2013<br />
Estimate<br />
<strong>FY2014</strong><br />
Target<br />
40% 41% 44% 42% 44%<br />
.03% .05% .06% .06% .06%<br />
---* ---* ---* ---* 66.5%<br />
61% 98% 100% 100% 100%<br />
* New measure, data not available<br />
Wastewater Department Goal: Maximize use <strong>of</strong> effluent from Water Reclamation Facilities (WRF)<br />
through various applications.<br />
o Objective: Recharge 80% <strong>of</strong> wastewater treatment facility effluent per day.<br />
o Objective: Provide customers with reclaimed water.<br />
o Objective: Produce grade A+ reclaimed water quality.<br />
Performance Measures<br />
Percentage <strong>of</strong> effluent recharged<br />
vs. wastewater treated<br />
Percentage <strong>of</strong> effluent recharged<br />
vs. groundwater withdrawal<br />
Percentage <strong>of</strong> reclaimed water<br />
provided to customers<br />
FY2011<br />
Actual<br />
FY2012<br />
Actual<br />
FY2013<br />
Target<br />
FY2013<br />
Estimate<br />
<strong>FY2014</strong><br />
Target<br />
---* 66% 79% 82% 80%<br />
54% 66% 75% 78% 80%<br />
---* 34% 21% 18% 20%<br />
Percentage <strong>of</strong> days at grade rating ---* ---* ---* ---* 99%<br />
185
Wastewater Department Goal: Protect the <strong>City</strong>’s groundwater, reclaimed water, environment and<br />
public health through programs designed to achieve regulatory compliance with local, state, and<br />
federal regulations associated with the <strong>City</strong>’s wastewater systems.<br />
o Objective: Meet all monitoring and reporting requirements to comply with wastewater<br />
regulations.<br />
o Objective: Demonstrate compliant operation and maintenance <strong>of</strong> facilities with permit<br />
conditions and regulatory requirements to avoid agency issued violations and penalties.<br />
o Objective: Achieve the median value <strong>of</strong> 2.73 when operating and maintaining the wastewater<br />
collection system to minimize blockages and pipe breaks that result in a report <strong>of</strong> a sanitary<br />
sewer overflow to the governing agency as cited in the AWWA Benchmarking Performance<br />
Indicators.<br />
Performance Measures<br />
Compliance with federal, state,<br />
and local wastewater and water<br />
reuse regulatory reporting<br />
Wastewater Effluent Compliance<br />
Rate <strong>of</strong> No Violations Issued (%<br />
Days)<br />
FY2011<br />
Actual<br />
FY2012<br />
Actual<br />
FY2013<br />
Target<br />
FY2013<br />
Estimate<br />
<strong>FY2014</strong><br />
Target<br />
100% 100% 100% 100% 100%<br />
0 0 ---* 0 0<br />
Sanitary Sewer Overflow Rate ---* ---* ---* ---* 2.73<br />
* New measure, data not available<br />
186
Public Works<br />
Sanitation Operations Fund<br />
Fund Description<br />
The sanitation operations fund is established as an enterprise fund to account for the collection <strong>of</strong> trash<br />
and recyclable materials. The Solid Waste Division <strong>of</strong> the Public Works Department manages this fund to<br />
provide solid waste and recycling services within <strong>Surprise</strong>. Commercial solid waste services and<br />
residential service to non-city customers is provided by private companies.<br />
The city provides curbside collections twice per week, once per week for trash and once per week for<br />
recyclable materials. Each customer is provided with a 95 gallon trash and recycle container. Customers<br />
also receive on-demand curbside bulk trash pickup <strong>of</strong> up to 20 cubic-yards per year. The city household<br />
hazardous waste collection program and recycle drop-<strong>of</strong>f programs are available to all city residents. The<br />
Solid Waste Division also provides trash, recycle, and roll-<strong>of</strong>f services to city departments and weekly<br />
recycle service to public schools within the city.<br />
Organizational Chart<br />
The Solid Waste Division is managed by the Public Works Department as a division under the assistant<br />
director <strong>of</strong> operations. A division level organizational chart can be viewed on the Public Works<br />
Department general fund budget section <strong>of</strong> this document. The personnel who are directly funded by<br />
the sanitation operations fund are detailed in the personnel table within the Major <strong>Budget</strong> Changes.<br />
Primary Functions<br />
Residential curbside trash and recycle collection services<br />
Residential curbside brush and bulk collection services<br />
Trash, recycle, and roll-<strong>of</strong>f collection services for city departments<br />
Recycle drop-<strong>of</strong>f centers and residential household hazardous waste drop-<strong>of</strong>f services<br />
Divisions<br />
Operations - Conducts the residential curbside solid waste collection operations <strong>of</strong> the division<br />
Bulk Trash - Handles operations and issues related to bulk trash and roll-<strong>of</strong>f collection services<br />
Recycling - Conducts the recycling education and waste inspection program for the city as well as the<br />
household hazardous waste events<br />
Major <strong>Budget</strong> Changes<br />
The <strong>FY2014</strong> budget increased by 37% from the FY2013 amended budget. The decreases in personnel<br />
expenditures are due to the movement <strong>of</strong> positions formerly funded directly by water, wastewater, and<br />
solid waste operations being moved back to the general fund for <strong>FY2014</strong>. Instead <strong>of</strong> direct funding, the<br />
cost <strong>of</strong> these positions will be recovered through the city’s indirect cost allocation plan. These decreases<br />
were <strong>of</strong>fset by a 3% increase in the employer contribution for the Arizona State Retirement System and a<br />
2.2% increase for a cost <strong>of</strong> living adjustment.<br />
Supplies expenses increased by 1% for safety/first aid supplies and auto parts/lubricants. The increases<br />
are <strong>of</strong>fset by decreases in sanitation and recycle containers replacements.<br />
Services expenses increased by 3% for Maricopa County solid waste hauler’s fee, county contract for<br />
radio equipment maintenance, vehicle maintenance, dues and memberships, and uniform/laundry<br />
services.<br />
Under capital, expenditures include six new sanitation vehicles and diesel exhaust fluid dispenser are<br />
programmed for the <strong>FY2014</strong> budget.<br />
Payments to the general fund in the amount <strong>of</strong> $1,886,400 are programmed in <strong>FY2014</strong> to cover the<br />
indirect costs associated with general fund personnel provided services and support to the sanitation<br />
fund. Additionally, an annual sanitation hauler’s license fee <strong>of</strong> $1,000 per sanitation vehicle is assessed<br />
on all sanitation companies providing service in the city <strong>of</strong> <strong>Surprise</strong>, including the <strong>Surprise</strong> sanitation<br />
operations. Also programmed in the transfer to the general fund are payments in lieu <strong>of</strong> property tax<br />
(PILOT) assessments.<br />
187
The <strong>FY2014</strong> contingency budget <strong>of</strong> $794,400 represents a two-month operating reserve.<br />
FY2011 FY2012 FY2013 <strong>FY2014</strong> Amended to<br />
Expenditures Actual Actual Amended <strong>Budget</strong> <strong>Budget</strong><br />
By category<br />
Personnel 2,052,559 2,441,395 2,421,200 2,078,500 -14%<br />
Supplies 836,254 885,589 882,400 893,900 1%<br />
Services 1,418,986 1,441,106 1,477,000 1,524,000 3%<br />
Capital 0 1,344,646 0 1,640,000 0%<br />
Depreciation 431,416 0 0 0 0%<br />
Contingency 0 0 792000 794,400 0%<br />
Transfer Out 888,827 888,767 890,300 1,919,000 116%<br />
Total 5,628,041 7,001,503 6,462,900 8,849,800 37%<br />
By department<br />
Finance 0 0 155,200 0 -100%<br />
General Operations 888,827 0 0 0 0%<br />
Information Services 0 0 0 0 0%<br />
Public Works 4,739,214 7,001,503 6,385,300 8,849,800 39%<br />
Total 5,628,041 7,001,503 6,540,500 8,849,800 35%<br />
Revenues<br />
By fund source<br />
Charges for Svcs/Oth 6,704,530 6,693,448 6,835,800 6,958,100 2%<br />
Transfer In 0 0 0 0 0%<br />
Total 6,704,530 6,693,448 6,835,800 6,958,100 2%<br />
FY2011<br />
Final<br />
FY2012<br />
Adopted<br />
FY2013<br />
Adopted<br />
<strong>FY2014</strong><br />
<strong>Budget</strong><br />
Adopted to<br />
<strong>Budget</strong><br />
Personnel<br />
Accountant/Tax Auditor 0.0 0.0 0.0 0.0 0.0<br />
Administrative Specialist 0.0 0.2 0.2 0.0 -0.2<br />
Administrative Technician 2.0 1.2 1.2 1.0 -0.2<br />
Assistant Analyst 0.3 0.3 0.0 0.0 0.0<br />
Assistant Department Director 0.0 0.3 0.5 0.0 -0.5<br />
<strong>Budget</strong>/Accounting Manager 0.0 0.0 0.3 0.0 -0.3<br />
Department Director 0.0 0.2 0.2 0.0 -0.2<br />
Division Manager 2.0 1.8 0.0 0.0 0.0<br />
IT Administrator 0.0 0.2 0.2 0.0 -0.2<br />
Maintenance & Operations Sup. 2.0 2.0 2.0 2.0 0.0<br />
Maintenance & Operations Tech. 20.0 21.0 21.0 21.0 0.0<br />
Manager 0.0 0.0 1.8 1.0 -0.8<br />
Senior Financial Analyst 0.3 0.5 0.2 0.0 -0.2<br />
SenSenior Maintenance & Ops. Tech. 3.0 3.0 3.0 3.0 0.0<br />
Service Worker/Groundskeeper 3.0 3.0 3.0 3.0 0.0<br />
Total 32.7 33.8 33.6 31.0 -2.6<br />
188
Accomplishments, Enhancements, and Efficiencies<br />
Continued cost savings over private contracted service for the transport <strong>of</strong> refuse and wastewater<br />
sludge<br />
Increased availability <strong>of</strong> residential bulk collection<br />
<strong>Surprise</strong> residents ranked garbage collection 8 th out <strong>of</strong> 353 communities surveyed according to<br />
the National Citizens Survey<br />
<strong>Surprise</strong> residents ranked recycling collection 12 th out <strong>of</strong> 333 communities surveyed according to<br />
the Nation Citizens Survey<br />
Major Initiatives and Policy Issues<br />
Improve Recycling Outreach<br />
Evaluate equipment options to improve capacity for better efficiency<br />
Continue providing exceptional customer service to our residents<br />
Increase bulk trash efficiency through improved routing<br />
Goals, Objectives, and Performance Measures<br />
Solid Waste Department Goal: Improve recycling collection, outreach, and education<br />
o Objective: Increase Residential and roll-<strong>of</strong>f recycling participation<br />
Performance Measures<br />
FY2011<br />
Actual<br />
FY2012<br />
Actual<br />
FY2013<br />
Target<br />
FY2013<br />
Estimate<br />
<strong>FY2014</strong><br />
Target<br />
Recycling tons collected 6,903 7,200 7,567 7,630 7,730<br />
Recycling diversion 18.36% 19.94% 20.40% 21.97% 21.99%<br />
Roll-<strong>of</strong>f recycling collected 347 412 424 494 500<br />
Education outreach events 5 8 10 13 15<br />
Solid Waste Department Goal: Provide value added services to ensure customers are receiving<br />
a good value<br />
o Objective: Promote and provide Christmas tree drop <strong>of</strong>f services<br />
o Objective: Promote and provide household hazardous waste events<br />
o Objective: Promote and provide fall and spring cleaning events with the landfill<br />
o Objective: Promote and provide an annual E-Waste event with AZStRUT and APS<br />
Performance Measures<br />
FY2011<br />
Actual<br />
FY2012<br />
Actual<br />
FY2013<br />
Target<br />
FY2013<br />
Estimate<br />
<strong>FY2014</strong><br />
Target<br />
Christmas Tree Drop Off (Trees) 1872 2103 1900 1550 2000<br />
Household Hazardous Waste<br />
Participation (Tons)<br />
Fall and Spring Cleaning Events at<br />
Landfill Participation (Tons)<br />
AZ StRUT E-Waste Participation<br />
(Tons)<br />
39.8 64.8 45 47.7 50<br />
88.8 92.4 100 115 130<br />
3.7 2.5 3.0 3.1 3.5<br />
189
Solid Waste Department Goal: Maintain a high level <strong>of</strong> customer service<br />
o Objective: Continue scoring high on the National Citizens Survey<br />
o Objective: Minimize customer complaints<br />
o Objective: Schedule on demand bulk services within 10 days on average<br />
Performance Measures<br />
National Citizen Survey garbage<br />
collection service quality score<br />
(Good or Excellent)<br />
National Citizen Survey recycling<br />
service quality score<br />
(Good or Excellent)<br />
FY2011<br />
Actual<br />
FY2012<br />
Actual<br />
FY2013<br />
Target<br />
FY2013<br />
Estimate<br />
<strong>FY2014</strong><br />
Target<br />
87% 88% 80% 87% 80%<br />
80% 87% 80% 84% 80%<br />
Annual missed pickups* 16 25 20 7 20<br />
Maintain a 10 day annual average<br />
service level for on demand bulk<br />
trash collection<br />
4 5 10 7 10<br />
* For reference, the Solid Waste Division interacts with customers over 3,500,000 times annually<br />
190
Information Technology Department<br />
Department Description<br />
The Information Technology Department provides world-class, technology-based solutions to effectively<br />
manage city assets. The department provides service excellence in the support <strong>of</strong> internal and external<br />
customers, develops highly skilled and knowledgeable staff, and provides training in the effective use <strong>of</strong><br />
computer technology and applications. The department collaborates with other departments and<br />
organizations to provide the delivery <strong>of</strong> effective and efficient government services.<br />
Organizational Chart<br />
Primary Functions<br />
Provide and support a secure centralized network, telephony, and computer technology<br />
Integrate and maintain existing applications and development <strong>of</strong> new applications<br />
Mitigate risk <strong>of</strong> loss to the city’s information and computer resources, and develop security<br />
policies and guidelines<br />
Provide a spatial data repository, tools, and services for city departments so they can create,<br />
maintain, represent, and analyze geographic information<br />
Provide timely right <strong>of</strong> way, leasing, property, and land management services<br />
Provide pr<strong>of</strong>essional cadastral surveys and research<br />
Divisions<br />
Information Services - Provides centralized information technology services required<br />
by all city departments<br />
Geographical Information Systems (GIS) - Provides centralized geographical information services, real<br />
estate, and surveying services to all city departments<br />
191
Major <strong>Budget</strong> Changes<br />
The <strong>FY2014</strong> budget increased by 6% from the FY2013 amended budget. The increases in personnel are<br />
due to a 3% increase in the employer contribution for the Arizona State Retirement System and a 2.2%<br />
increase for a cost <strong>of</strong> living adjustment. These increases were <strong>of</strong>fset by a position change downgrading a<br />
manager position to a program manager position.<br />
Supplies expenditures increased 3% for additional costs <strong>of</strong> repair and maintenance <strong>of</strong> security equipment.<br />
Services expenditures increased by 13% which includes the transfer <strong>of</strong> service agreement management<br />
from the Police Department, new service agreements and bandwidth costs from an intergovernmental<br />
agreement with the city <strong>of</strong> El Mirage for dispatch services, s<strong>of</strong>tware licenses, and computer maintenance.<br />
The services increases are <strong>of</strong>fset by a reduction in telephone/internet service expenditures.<br />
FY2011 FY2012 FY2013 <strong>FY2014</strong> Amended to<br />
Expenditures Actual Actual Amended <strong>Budget</strong> <strong>Budget</strong><br />
By category<br />
Personnel 2,122,616 2,189,442 2,307,200 2,324,600 1%<br />
Supplies 163,773 144,003 97,800 100,700 3%<br />
Services 1,235,638 1,158,576 1,455,300 1,648,800 13%<br />
Capital 106,368 78,890 20,000 20,000 0%<br />
Total 3,628,395 3,570,910 3,880,300 4,094,100 6%<br />
By division<br />
GIS 938,111 929,117 959,800 970,300 1%<br />
Info. Technology 2,690,284 2,641,793 2,920,500 3,123,800 7%<br />
Total 3,628,395 3,570,910 3,880,300 4,094,100 6%<br />
FY2011<br />
Final<br />
FY2012<br />
Adopted<br />
FY2013<br />
Adopted<br />
<strong>FY2014</strong><br />
<strong>Budget</strong><br />
Adopted to<br />
<strong>Budget</strong><br />
Personnel<br />
Administrative Specialist 1.0 1.0 1.0 1.0 0.0<br />
Chief Land Surveyor 1.0 1.0 1.0 1.0 0.0<br />
Department Director 1.0 1.0 1.0 1.0 0.0<br />
Division Manager 1.0 1.0 1.0 1.0 0.0<br />
IT Administrator 4.0 5.0 6.0 6.0 0.0<br />
IT Security Analyst 1.0 1.0 1.0 1.0 0.0<br />
IT Supervisor 1.0 1.0 0.0 0.0 0.0<br />
IT Technician 1.0 2.0 1.0 1.0 0.0<br />
Manager 2.0 2.0 2.0 1.0 -1.0<br />
Program Manager 1.0 1.0 2.0 3.0 1.0<br />
Senior IT Administrator 2.0 3.0 2.0 2.0 0.0<br />
Senior IT Technician 6.0 6.0 5.0 5.0 0.0<br />
Survey Specialist 0.0 0.0 1.0 1.0 0.0<br />
Survey Technician 1.0 1.0 0.0 0.0 0.0<br />
Total 23.0 26.0 24.0 24.0 0.0<br />
Accomplishments, Enhancements, and Efficiencies<br />
Upgraded enterprise asset management/customer service/work order system allowing for<br />
personalization, integration and mobility in the field<br />
Administration <strong>of</strong> the El Mirage Police Records Management System<br />
Storage Area Network (SAN) Replacement and server consolidation<br />
Exchange (mail) server and voice mail server upgrades<br />
Enhanced safety and security at multiple city facilities<br />
192
Major Initiatives and Policy Issues<br />
Data integration and data warehousing <strong>of</strong> existing systems to provide improved business<br />
analytics<br />
Identify data backup and recovery options for Business Continuity<br />
Continue asset replacement and technology refresh<br />
Continue to analyze and identify data security compliance<br />
Analyze and identify an enterprise document management solution<br />
Goals, Objectives, and Performance Measures<br />
Department Goal: Provide effective and efficient Information Technology support and improve city<br />
services by maintaining reliable up to date technology ensuring those technologies are highly<br />
available, recoverable, and the integrity <strong>of</strong> data is maintained.<br />
o Objective: Integrate new technologies and replace obsolete equipment/services and financial<br />
systems to meet an ever-changing environment. Limit risks and any negative impacts to<br />
existing systems.<br />
Performance Measures<br />
FY2011<br />
Actual<br />
FY2012<br />
Actual<br />
FY2013<br />
Target<br />
FY2013<br />
Estimate<br />
<strong>FY2014</strong><br />
Target<br />
End user devices supported ---* 2,664 2,731 2,731 2,852<br />
Network devices supported ---* 221 230 230 230<br />
Security devices supported ---* 431 549 549 549<br />
Applications supported ---* ---* 59 59 63<br />
*New measure, data not available<br />
Department Goal: Utilize technology to link transportations and land use planning.<br />
o Objective: Develop an active vertical and horizontal control network increasing density by 8%<br />
to ensure continuity between existing infrastructure and new construction.<br />
Performance Measures<br />
Number <strong>of</strong> vertical and horizontal<br />
survey controls<br />
FY2011<br />
Actual<br />
FY2012<br />
Actual<br />
FY2013<br />
Target<br />
FY2013<br />
Estimate<br />
<strong>FY2014</strong><br />
Target<br />
127 127 127 127 127<br />
Department Goal: Update the GIS service.<br />
o Objective: Develop and implement an accurate, comprehensive, and up-to-date geographic<br />
information system in order to improve department efficiency and decision processes.<br />
Performance Measures<br />
FY2011<br />
Actual<br />
FY2012<br />
Actual<br />
FY2013<br />
Target<br />
FY2013<br />
Estimate<br />
<strong>FY2014</strong><br />
Target<br />
GIS data layers maintained 159 159 162 162 162<br />
New GIS applications developed 10 10 11 11 11<br />
193
Finance Department<br />
Mission Statement<br />
The city <strong>of</strong> <strong>Surprise</strong> Finance Department strives to be proactive leaders, identifying issues, and <strong>of</strong>fering<br />
innovative solutions while providing excellent customer service.<br />
Organizational Chart<br />
Primary Functions<br />
Financial analysis and general ledger accounting and reporting<br />
Preparing and monitoring operating and capital budgets to comply with financial policies and legal<br />
requirements<br />
Bi-weekly payroll processing<br />
Contract and purchasing services and support<br />
Business license processing, sales tax audits, and city cashiering<br />
Processing and distribution <strong>of</strong> city payments<br />
Fiscal management <strong>of</strong> city grants<br />
Divisions<br />
Administration - The Administration Division is primarily responsible for department oversight and<br />
policy development.<br />
Accounting - The Accounting Division is responsible for the city’s comprehensive annual<br />
financial report (CAFR), assistance with development agreement preparation and<br />
tracking, construction project expense tracking, and fixed assets.<br />
<strong>Budget</strong> - The <strong>Budget</strong> Division provides research, budget, and special projects services.<br />
The division is responsible for delivering accurate, reliable, and timely information<br />
and advice that will assist in making informed decisions.<br />
Payroll - The Payroll Division is responsible for processing employee payroll.<br />
Procurement - The Procurement Division is responsible for processing all city payments and<br />
managing the contract and procurement services <strong>of</strong> the city.<br />
Revenue - The Revenue Division is responsible for issuing business licenses, managing the<br />
cashiering and accounts receivable functions <strong>of</strong> the city, tracking and auditing<br />
transaction privilege tax, and providing investment oversight and reporting.<br />
194
Major <strong>Budget</strong> Changes<br />
The <strong>FY2014</strong> budget is 10% higher than the FY2013 amended budget.<br />
Personnel expenditures were 5% lower than the FY2013 amended budget. The decrease was due to the<br />
transfer <strong>of</strong> the internal auditor position to the <strong>City</strong> Manager’s Office. The decrease was partially <strong>of</strong>fset by the<br />
addition <strong>of</strong> a senior financial analyst in the budget division to maintain current levels <strong>of</strong> services. Part-time<br />
funding for 0.5 FTE was also added to maintain levels <strong>of</strong> service in the mail room that is staffed by procurement.<br />
This position was formerly funded by a federal Title V grant worker.<br />
Two other positions formerly funded directly by water, wastewater, and solid waste operations were moved back<br />
to the general fund for <strong>FY2014</strong>. Instead <strong>of</strong> direct funding, the cost <strong>of</strong> these positions will be recovered through<br />
the city’s indirect cost allocation plan.<br />
Further <strong>of</strong>fsets include a 3% increase in the employer contribution for the Arizona State Retirement System and<br />
a 2.2% increase for a cost <strong>of</strong> living adjustment.<br />
Non-personnel expenditures were 33% higher than the FY2013 amended budget. The increase was primarily<br />
due to the addition <strong>of</strong> $50,000 for the purchase <strong>of</strong> a budget preparation and monitoring system and $80,000 in<br />
contractual services for citywide policy and procedure documentation. Additionally, $30,000 was added for<br />
fiduciary oversight and vendor selection related to the optional 457 plan.<br />
FY2011 FY2012 FY2013 <strong>FY2014</strong> Amended to<br />
Expenditures Actual Actual Amended <strong>Budget</strong> <strong>Budget</strong><br />
By category<br />
Personnel 2,377,226 2,319,694 2,170,500 2,271,800 5%<br />
Supplies 30,030 33,955 28,400 32,100 13%<br />
Services 485,395 512,531 470,300 627,800 33%<br />
Total 2,892,651 2,866,179 2,669,200 2,931,700 10%<br />
By division<br />
Accounting 276 0 0 0 0%<br />
Administration 362,831 406,041 379,300 324,700 -14%<br />
<strong>Budget</strong> & Accounting 1,183,684 1,066,811 958,700 1,368,600 43%<br />
Internal Audit 81,314 140,247 113,400 0 -100%<br />
Management & <strong>Budget</strong> 907 0 0 0 0%<br />
Revenue 555,497 569,389 474,300 492,600 4%<br />
Procurement & Payroll 708,142 683,691 743,500 745,800 0%<br />
Purchasing 0 0 0 0 0%<br />
Total 2,892,651 2,866,179 2,669,200 2,931,700 10%<br />
Revenues<br />
By fund source<br />
Local Sales Tax 195,099 389,496 300,000 400,000 33%<br />
Franchise Fees 625,705 625,919 662,000 680,000 3%<br />
Charges for Svcs/Oth 40,284 43,520 46,100 46,100 0%<br />
Total 861,088 1,058,935 1,008,100 1,126,100 12%<br />
195
FY2011<br />
Final<br />
FY2012<br />
Adopted<br />
FY2013<br />
Adopted<br />
<strong>FY2014</strong><br />
<strong>Budget</strong><br />
Adopted to<br />
<strong>Budget</strong><br />
Personnel<br />
Accountant/Tax Auditor 3.0 3.0 2.0 2.0 0.0<br />
Administrative Specialist 1.0 1.0 1.0 1.0 0.0<br />
Assistant Department Director 1.0 1.0 1.0 0.0 -1.0<br />
<strong>Budget</strong>/Accounting Manager 0.0 0.0 2.0 0.0 -2.0<br />
Buyer 1.0 1.0 1.0 1.0 0.0<br />
Cashier 1.0 1.0 1.0 1.0 0.0<br />
De Asst. <strong>City</strong> Manager/Dept Director 1.0 1.0 1.0 1.0 0.0<br />
Fiscal Support Assistant 0.0 0.0 0.0 0.0 0.0<br />
Fiscal Support Specialist 7.0 7.0 6.0 6.0 0.0<br />
Manager 3.0 3.0 1.0 4.0 3.0<br />
Program Manager 2.0 2.0 2.0 0.0 -2.0<br />
Program Supervisor 0.0 0.0 1.0 1.0 0.0<br />
Senior Buyer/Contract Officer 1.0 1.0 1.0 1.0 0.0<br />
Senior Financial Analyst 6.0 6.0 4.0 8.0 4.0<br />
Part Time 0.0 0.0 0.0 0.5 0.5<br />
Total 27.0 27.0 24.0 26.5 2.5<br />
Accomplishments, Enhancements, and Efficiencies<br />
Modified and enhanced the “It’s Your Money” transparency portal to be more informative and efficient.<br />
The site is now compliant with updated Arizona Revised Statutes, Laws 2011, Chapter 119 (HB 2572)<br />
Facilitated completion <strong>of</strong> the post audit work commissioned by the city to assure all records were<br />
reviewed and corrected where necessary<br />
Continued to steer progression <strong>of</strong> the city toward restoration <strong>of</strong> the targeted reserve levels<br />
Began update <strong>of</strong> employee policy manual to enhance the procurement process descriptions and<br />
procedures<br />
Began re-implementation <strong>of</strong> the vendor registration weblink and allowed greater access for vendors<br />
participating in informal procurements<br />
Major Initiatives and Policy Issues<br />
Implement new budget s<strong>of</strong>tware for the efficient and effective preparation and reporting <strong>of</strong> the annual<br />
budget<br />
Identify current citywide financial related policies and procedures. Prepare, update, and enhance<br />
policies and procedures to ensure financial accountability and sound practices<br />
Work with departments to collect and analyze data to prepare an Infrastructure Improvement Plan for<br />
the updated development impact fee study<br />
196
Donations Fund<br />
Fund Description<br />
The donations fund is established to temporarily hold and collect assets that have been donated to the<br />
city for a specific department or purpose. These assets are expended according to the designated use <strong>of</strong><br />
the donation. The establishment <strong>of</strong> a separate fund allows these donations to be carried forward. These<br />
funds will be monitored to ensure adequate revenue is available prior to expenditures being approved.<br />
Major <strong>Budget</strong> Changes<br />
The <strong>FY2014</strong> budget represents a 73% increase from the FY2013 amended budget. In <strong>FY2014</strong>, revenue<br />
has been estimated based on historical trends and will be programmed in contingency. This will provide<br />
adequate budget authority if needed. Requests for budget authority will be brought before the Mayor and<br />
<strong>City</strong> Council for Approval as a transfer from contingency.<br />
FY2011 FY2012 FY2013 <strong>FY2014</strong> Amended to<br />
Expenditures Actual Actual Amended <strong>Budget</strong> <strong>Budget</strong><br />
By category<br />
Personnel 0 105 0 0 0%<br />
Supplies 162,203 63,543 800 296,600 36975%<br />
Services 50,818 133,947 0 0 0%<br />
Capital 0 0 0 0 0%<br />
Transfer Out 316,403 100,300 0 0 0%<br />
Contingency 0 0 363,500 334,400 -8%<br />
Total 529,425 297,896 364,300 631,000 73%<br />
By department<br />
Arts Commission 0 128,323 0 0 0%<br />
Community Development 68 0 0 0 0%<br />
Community and Rec Svcs 517,379 119,123 180,200 267,300 48%<br />
Fire-Emergency Services 2,209 10,898 1,500 15,000 900%<br />
General Operations 0 0 170,800 334,400 96%<br />
Police 9,769 14,249 11,800 14,300 21%<br />
Total 529,425 272,593 364,300 631,000 73%<br />
Revenues<br />
By fund source<br />
Charges for Svcs/Oth 328,281 233,379 1,900 210,100 10958%<br />
Fund Balance 201,144 39,214 362,400 420,900 16%<br />
Total 529,425 272,593 364,300 631,000 73%<br />
Personnel Summary<br />
There are no dedicated personnel assigned to this fund.<br />
197
Grants and Contingency Fund<br />
Fund Description<br />
The grants and contingency fund is used to centralize budget appropriation authority for budget<br />
contingencies and future grant awards. This budget authority allows the city flexibility to address<br />
unplanned expenses and participate in new grant funding opportunities without exceeding the annually<br />
established maximum authorized expenditure limit.<br />
Use <strong>of</strong> this budget appropriation authority requires Mayor and <strong>City</strong> Council approval <strong>of</strong> a budget transfer<br />
for the specific authorized purpose. For example, as grants are awarded to the city and approved by the<br />
<strong>City</strong> Council, budget transfers from unforeseen revenue and expenses into grant project line items are<br />
processed. Previously, these activities were recorded on project line items within the general fund budget<br />
under the respective department managing the grant award.<br />
Major <strong>Budget</strong> Changes<br />
The <strong>FY2014</strong> budget is 61% less FY2013. The <strong>FY2014</strong> budget includes programming for grants and<br />
contingency for unplanned operating and capital expenses. For <strong>FY2014</strong>, contingency programming has<br />
been reduced to more accurately reflect estimated needs and historical trends. In addition, programming<br />
for grants is reduced due to a reduction in the number and amount <strong>of</strong> grants awarded at the time the<br />
budget was prepared. Grants funding is estimated at a reduced level due to federal budget cuts.<br />
FY2011 FY2012 FY2013 <strong>FY2014</strong> Amended to<br />
Expenditures<br />
By category<br />
Actual Actual Amended <strong>Budget</strong> <strong>Budget</strong><br />
Personnel 88,214 158,819 249,800 201,500 -19%<br />
Supplies 398,275 86,740 30,200 26,300 -13%<br />
Services 0 11,306 125,400 0 -100%<br />
Capital 522,961 551,739 54,500 0 -100%<br />
Contingency 0 0 13,109,800 5,000,000 -62%<br />
Total<br />
By department<br />
1,009,450 808,604 13,569,700 5,227,800 -61%<br />
Community and Rec Svcs 50,000 41,724 50,000 50,000 0%<br />
Fire-Emergency Services 318,793 33,968 30,500 0 -100%<br />
General Operations 0 0 13,109,800 5,000,000 -62%<br />
Mayor & Council 0 0 0 0 0%<br />
Police 535,116 592,122 223,200 177,800 -20%<br />
Public Works 105,541 135,790 132,900 0 -100%<br />
Total 1,009,450 803,604 13,546,400 5,227,800 -61%<br />
Revenues<br />
By fund source<br />
Charges for Svcs/Oth 1,009,450 790,540 13,709,200 5,227,800 -62%<br />
Fund Balance 0 0 0 0 0%<br />
Total 1,009,450 790,540 13,709,200 5,227,800 -62%<br />
Personnel Summary<br />
There are no dedicated personnel assigned to this fund.<br />
198
<strong>City</strong> Manager’s Office<br />
Department Description<br />
The city <strong>of</strong> <strong>Surprise</strong> operates under a Council/<strong>City</strong> Manager form <strong>of</strong> government. The Mayor and <strong>City</strong><br />
Council are responsible for appointing a <strong>City</strong> Manager who carries out Council adopted policies and<br />
directs the day-to-day operations <strong>of</strong> city government.<br />
The <strong>City</strong> Manager’s Office is responsible for ensuring operations are running effectively throughout the<br />
entire organization. The <strong>City</strong> Manager is responsible for drafting a balanced budget for Mayor and <strong>City</strong><br />
Council review and approval each year. To that end, the <strong>of</strong>fice focuses on funding programs to achieve<br />
the Mayor and <strong>City</strong> Council’s goals through strategic planning, process improvement assessments, and<br />
improving internal and external customer service.<br />
The city has two Assistant <strong>City</strong> Managers (ACM) who report to the <strong>City</strong> Manager. The ACM oversee the<br />
output and budgets <strong>of</strong> various city departments, assuring high quality work, and facilitating interdepartmental<br />
cooperation on important issues.<br />
Organizational Chart<br />
Public<br />
Information<br />
Officer<br />
Webmaster<br />
Marketing & Communications<br />
Director<br />
Assistant <strong>City</strong> Manager/<br />
Community & Economic<br />
Development Director<br />
Sr. Management Analyst<br />
Sr. Video Production<br />
Coordinator<br />
Video Production<br />
Assistant<br />
Graphic Designer<br />
<strong>City</strong> Manager<br />
<strong>City</strong> Auditor<br />
Assistant to the Mayor<br />
Assistant to the Council 1<br />
Assistant to the Council 1<br />
Assistant <strong>City</strong> Manager/<br />
Chief Financial Officer<br />
Intergovernment Relations<br />
Director<br />
Grants Administrator<br />
Primary Functions<br />
Support the Mayor and <strong>City</strong> Council<br />
Provide financial guidance to maintain the city <strong>of</strong> <strong>Surprise</strong> as a fiscally sustainable organization<br />
Provide leadership and direction to staff<br />
Ensure an enhanced quality <strong>of</strong> life to citizens<br />
Design and implement strategies to engage and inform the community on important issues<br />
Design and implement strategies to maximize residents’ ease <strong>of</strong> access to city service and<br />
information<br />
Create, operate, and/or strategically direct city <strong>of</strong> <strong>Surprise</strong> <strong>of</strong>ficial communications such as:<br />
o News releases, <strong>of</strong>ficial statements, media remarks<br />
o The city’s internet site www.surpriseaz.gov<br />
o The city’s intranet site “Inside <strong>Surprise</strong>”<br />
o The city’s social media sites: multiple Twitter and Facebook accounts/pages<br />
o The city’s government access TV station, <strong>Surprise</strong> 11<br />
199
o The quarterly magazine, Progress<br />
o Event planning and management such as ground breaking and ribbon cutting<br />
ceremonies, news conferences, and other special events<br />
o The creation (design, writing, and printing) <strong>of</strong> brochures, programs, fliers, maps, logos,<br />
informational signage, advertising, and other public relations collateral<br />
o The photography required to execute these functions<br />
Strategically coordinates the communications needs <strong>of</strong> individual city departments, provides<br />
material support, promotion, and publicity <strong>of</strong> programs, events, and activities<br />
Strategically coordinates employee communication and facilitates employee participation so that<br />
city employees are informed and engaged<br />
Liaison to the Mayor, Council, and the <strong>City</strong> Manager’s <strong>of</strong>fice on legislative issues at the local,<br />
state and federal level<br />
Monitor and discuss state and federal legislation impacting the city<br />
Strengthen relationships and partnerships with major regional public policy organizations<br />
Seek funding opportunities through grants and federal appropriations<br />
Monitor grants contractual obligations to ensure compliance<br />
Strengthen relationships and partnerships with local municipalities, non-pr<strong>of</strong>its, and private<br />
organizations through coordinated efforts that maximize resources and funding leverage<br />
Divisions<br />
Administration - responsible for ensuring operations are running effectively throughout<br />
the entire organization and focuses on funding programs to achieve the<br />
Mayor and Council’s goals through strategic planning, process<br />
improvement assessments, and improving internal and external<br />
customer service.<br />
Marketing and Communications - engage and inform <strong>Surprise</strong> residents on activities and issues; achieve<br />
a positive image <strong>of</strong> <strong>Surprise</strong> as a responsive, open government, and a<br />
community <strong>of</strong> connection and opportunity; promote the advancement <strong>of</strong><br />
the city <strong>of</strong> <strong>Surprise</strong> Strategic Plan; assist and advise city departments<br />
and management in their communication needs; and supervise internal<br />
employee communications.<br />
Intergovernmental Relations - develop, represent, and advocate the interests <strong>of</strong> the city <strong>of</strong> <strong>Surprise</strong> by<br />
fostering and maintaining the city’s relationships with other<br />
governmental entities and the community organizations.<br />
Major <strong>Budget</strong> Changes<br />
The <strong>FY2014</strong> budget is 10% higher than the FY2013 amended budget.<br />
Personnel expenditures increased overall by 14%. This increase was impacted by a 3% increase in the<br />
employer contribution for the Arizona State Retirement System and a 2.2% increase for a cost <strong>of</strong> living<br />
adjustment. In addition, the city auditor position was moved from the Finance Department. <strong>FY2014</strong><br />
includes a nominal increase in part-time salaries to accommodate an increased need in the Marketing<br />
and Communications Division. Deferred compensation was decreased to more accurately reflect the<br />
actual expenditures.<br />
A senior communications specialist position was added to develop communications outreach and<br />
coordinate media appearances/interviews on behalf <strong>of</strong> the Mayor and Council. In addition, the position will<br />
prepare and issue news releases and public statements by the Mayor and individual council members,<br />
and coordinate media contacts.<br />
Services decreased by 1% overall. This was due to a reduction in the planned expenditures related to the<br />
shared federal lobbyist contract for Luke Air Force Base. The decrease was partially <strong>of</strong>fset by an increase<br />
in funding for lobbying consultant contracts.<br />
200
FY2011 FY2012 FY2013 <strong>FY2014</strong> Amended to<br />
Expenditures Actual Actual Amended <strong>Budget</strong> <strong>Budget</strong><br />
By category<br />
Personnel 507,780 586,207 1,390,300 1,588,900 14%<br />
Supplies 6,518 3,125 31,700 33,100 4%<br />
Services 137,946 98,251 393,900 388,600 -1%<br />
Grant Match Conting. 0 0 70,000 70,000 0%<br />
Total 652,244 687,582 1,885,900 2,080,600 10%<br />
By division<br />
Administration 652,244 687,582 667,800 751,500 13%<br />
Communications 0 0 799,600 909,400 14%<br />
Intergovernmental 0 0 418,500 419,700 0%<br />
Total 652,244 687,582 1,885,900 2,080,600 10%<br />
FY2011<br />
Final<br />
FY2012<br />
Adopted<br />
FY2013<br />
Adopted<br />
<strong>FY2014</strong><br />
<strong>Budget</strong><br />
Adopted to<br />
<strong>Budget</strong><br />
Personnel<br />
Administrative Specialist 1.0 1.0 0.0 0.0 0.0<br />
Assistant <strong>City</strong> Manager 1.0 1.0 0.0 0.0 0.0<br />
Assistant to the Council I 0.0 0.0 1.0 1.0 0.0<br />
Assistant to the Council II 0.0 0.0 1.0 1.0 0.0<br />
<strong>City</strong> Manager 1.0 1.0 1.0 1.0 0.0<br />
Department Director 0.0 0.0 2.0 2.0 0.0<br />
Executive Administrative Specialist 1.0 1.0 0.0 0.0 0.0<br />
Senior Analyst 0.0 0.0 1.0 1.0 0.0<br />
Senior Communications Specialist 0.0 0.0 4.0 5.0 1.0<br />
Senior Financial Analyst 0.0 0.0 1.0 1.0 0.0<br />
Program Manager 0.0 0.0 0.0 1.0 1.0<br />
Part Time 0.0 0.0 2.2 2.2 0.0<br />
Total 4.0 4.0 13.2 15.2 2.0<br />
Accomplishments, Enhancements, and Efficiencies<br />
Conducted a financial audit to review financial policies and processes<br />
Directed implementation and reporting <strong>of</strong> the National Citizen Survey<br />
Initiated community information strategy and transparency plan regarding city audit findings and<br />
subsequent budget adjustments and additional audits<br />
Implemented web site, communications outreach/community input strategy regarding redistricting<br />
Enhanced and expanded citizen involvement in state, regional, and federal issues<br />
Major Initiatives and Policy Issues<br />
Implement educational campaign to inform residents <strong>of</strong> new voting district boundaries with first<br />
election pending in 2013<br />
Secure external funding sources to augment the city <strong>of</strong> <strong>Surprise</strong>’s capacity to provide quality<br />
services<br />
Create a community and government network that will maintain regional stability through the<br />
effective use <strong>of</strong> local resources, state shared revenue, and construction sales tax<br />
Increase city presence in the community and at the state/federal levels<br />
201
<strong>City</strong> Clerk’s Office<br />
Department Description<br />
The <strong>City</strong> Clerk is appointed by the Mayor and <strong>City</strong> Council and maintains city records in accordance with<br />
Arizona state law. The <strong>City</strong> Clerk also serves as the <strong>City</strong>’s Chief Elections Officer.<br />
Organizational Chart<br />
Primary Functions<br />
Official Records Custodian<br />
Chief Elections Officer<br />
<strong>City</strong> Historian<br />
Administration <strong>of</strong> Mayor and <strong>City</strong> Council meetings<br />
Posting <strong>of</strong> meeting notices and advertisement <strong>of</strong> public hearings<br />
Major <strong>Budget</strong> Changes<br />
The <strong>FY2014</strong> budget is a 59% increase over the FY2013 amended budget.<br />
Personnel expenditures increased 2% overall. This increase was impacted by a 3% increase in the<br />
employer contribution for the Arizona State Retirement System and a 2.2% increase for a cost <strong>of</strong> living<br />
adjustment.<br />
Supplies increased 14% and Services 445% over the FY2013 amended budget. These increases were<br />
primarily due to the costs related to the bi-annual election process and a potential citywide election for the<br />
general plan programmed for <strong>FY2014</strong>.<br />
FY2011 FY2012 FY2013 <strong>FY2014</strong> Amended to<br />
Expenditures Actual Actual Amended <strong>Budget</strong> <strong>Budget</strong><br />
By category<br />
Personnel 347,906 345,276 352,500 361,100 2%<br />
Supplies 6,582 5,667 7,000 8,000 14%<br />
Services 51,311 284,531 52,200 284,300 445%<br />
Total 405,799 635,474 411,700 653,400 59%<br />
By division<br />
General Ops 405,799 635,474 411,700 653,400 59%<br />
Total 405,799 635,474 411,700 653,400 59%<br />
202
Accomplishments, Enhancements and Efficiencies<br />
Organized and completed the launch <strong>of</strong> the <strong>Surprise</strong> Women’s Heritage Trail and ceremony on<br />
April 13, 2013<br />
Completed on-the-road historical presentations and book sales through various communities and<br />
city events<br />
Completed a special election in November 2012 for the Arizona Public Service franchise ballot<br />
issue<br />
Started preparing for the upcoming 2013 primary and general elections for Districts 1, 5, and 6<br />
Major Initiatives and Policy Issues<br />
Continue working on archiving historical documents collected from research for the history book<br />
Continue to stay current with the city records retention changes through Arizona State Library and<br />
Archives<br />
Establish a centralized, up-to-date <strong>City</strong> Records Management program, incorporating archived<br />
materials retrievable by staff within the <strong>City</strong> Clerk’s Office. This is going to be a two-year project<br />
at minimum<br />
Create and implement a <strong>City</strong> Clerk’s Office procedures manual by the end <strong>of</strong> 2013<br />
Goals, Objectives, and Performance Measures<br />
Department Goal: Provide timely public access to city information.<br />
o Objective: Efficient communication <strong>of</strong> city related information and data and effective<br />
management <strong>of</strong> bi-annual election process.<br />
Performance Measures<br />
FY2011<br />
Actual<br />
FY2012<br />
Actual<br />
FY2013<br />
Target<br />
FY2013<br />
Estimate<br />
<strong>FY2014</strong><br />
Target<br />
Mayor and <strong>City</strong> Council agendas 65 50 50 48 50<br />
Posting <strong>of</strong> all <strong>City</strong> agendas including all<br />
Mayor and Council, Boards and<br />
Commissions<br />
150 130 130 125 140<br />
Number <strong>of</strong> city code updates 2 4 4 4 4<br />
Number <strong>of</strong> requests for public records 700 740 740 703 700<br />
Percent <strong>of</strong> public records requests<br />
completed in 3-5 days*<br />
FY2011<br />
Final<br />
* Some requests require document retrieval from storage.<br />
FY2012<br />
Adopted<br />
FY2013<br />
Adopted<br />
<strong>FY2014</strong><br />
<strong>Budget</strong><br />
Adopted to<br />
<strong>Budget</strong><br />
Personnel<br />
Administrative Assistant 1.0 1.0 1.0 1.0 0.0<br />
Administrative Support Supervisor 1.0 1.0 1.0 1.0 0.0<br />
Administrative Technician 1.0 1.0 1.0 1.0 0.0<br />
<strong>City</strong> Clerk 1.0 1.0 1.0 1.0 0.0<br />
Total 4.0 4.0 4.0 4.0 0.0<br />
75% 85% 90% 90% 90%<br />
203
Department Goal: Ensure citizen access to elective process.<br />
o Objective: Increase registered voters, ballots cast, and percentage <strong>of</strong> votes cast for city-wide<br />
elections.<br />
Performance Measures<br />
FY2011<br />
Actual<br />
FY2012<br />
Actual<br />
FY2013<br />
Target<br />
FY2013<br />
Estimate<br />
<strong>FY2014</strong><br />
Target<br />
Number <strong>of</strong> registered voters 60,000 58,000 59,000 59,700 60,000<br />
Number <strong>of</strong> ballots cast in election 30,000 35,181 27,000 27,560 20,000<br />
Percent <strong>of</strong> votes cast in city-wide election 31% 26% 30% 30% 30%<br />
FY2013 – This election will be for Districts 1, 5, and 6 and there may be a ballot issue for November (General Plan).<br />
Department Goal: Continue to memorialize and archive the city’s history.<br />
o Objective: Increase historical documentation collection and educate citizens.<br />
Performance Measures<br />
FY2011<br />
Actual<br />
FY2012<br />
Actual<br />
FY2013<br />
Target<br />
FY2013<br />
Estimate<br />
<strong>FY2014</strong><br />
Target<br />
Collecting historic photos (annually) 450 600 250 200 150<br />
Collection <strong>of</strong> city historic documents<br />
(cumulative)<br />
600 1,000 1,500 1,700 1,800<br />
On-the-road history presentations * 10 10 5 4 4<br />
*Totals include presentations at local schools and various neighborhoods throughout <strong>Surprise</strong>.<br />
204
Mayor and <strong>City</strong> Council<br />
Department Description<br />
The Mayor and <strong>City</strong> Council are the legislative body <strong>of</strong> the city <strong>of</strong> <strong>Surprise</strong>. The Council is comprised <strong>of</strong><br />
seven elected <strong>of</strong>ficials: six council members (one <strong>of</strong> whom is appointed Vice Mayor) and the Mayor.<br />
Organizational Chart<br />
Primary Functions<br />
Set policy for the city <strong>of</strong> <strong>Surprise</strong><br />
Major <strong>Budget</strong> Changes<br />
The <strong>FY2014</strong> budget is 36% higher than the FY2013 amended budget.<br />
Personnel expenditures are impacted by an 11% increase in the employer contribution for the Arizona<br />
Elected Officials Retirement Plan and a 2.2% increase for a cost <strong>of</strong> living adjustment.<br />
Non-personnel expenditures increase by 111% over FY2013 due to an increase in funding for Council<br />
discretionary expenditures, Council outreach, and Boards and Commissions.<br />
FY2011 FY2012 FY2013 <strong>FY2014</strong> Amended to<br />
Expenditures Actual Actual Amended <strong>Budget</strong> <strong>Budget</strong><br />
By category<br />
Personnel 343,519 353,384 289,600 304,100 5%<br />
Supplies 23,758 25,095 18,000 106,000 489%<br />
Services 64,747 73,648 102,100 147,100 44%<br />
Total 432,023 452,126 409,700 557,200 36%<br />
By division<br />
General Ops 432,023 452,126 409,700 557,200 36%<br />
Total 432,023 452,126 409,700 557,200 36%<br />
FY2011<br />
Final<br />
FY2012<br />
Adopted<br />
FY2013<br />
Adopted<br />
<strong>FY2014</strong><br />
<strong>Budget</strong><br />
Adopted to<br />
<strong>Budget</strong><br />
Personnel<br />
Mayor 1.0 1.0 1.0 1.0 0.0<br />
Vice Mayor 1.0 1.0 1.0 1.0 0.0<br />
<strong>City</strong> Council 5.0 5.0 5.0 5.0 0.0<br />
Executive Administrative Specialist 1.0 1.0 0.0 0.0 0.0<br />
Total 8.0 8.0 7.0 7.0 0.0<br />
205
Accomplishments, Enhancements, and Efficiencies<br />
Youth Leadership Summit<br />
Community Pride Day<br />
Walmart development agreement<br />
Major Initiatives and Policy Issues<br />
Transportation: Develop an efficient, cost effective, multi-modal transportation system that<br />
provides connectivity to the region, ease <strong>of</strong> movement into, within, and out <strong>of</strong> <strong>Surprise</strong>, and<br />
supports a high standard <strong>of</strong> community life.<br />
Sustainability: Provide a vibrant and sustainable community for a green <strong>Surprise</strong> today and<br />
tomorrow.<br />
Economic Development: Create a robust business environment that attracts employment,<br />
wealth, capital investment, and enhanced opportunities for investors and residents<br />
Community Lifestyle: Enhance community lifestyle for the current and the future residents <strong>of</strong><br />
<strong>Surprise</strong>.<br />
Tourism: Infuse tourism dollars into <strong>Surprise</strong>’s economy by diversifying the events, programs,<br />
and partnerships <strong>of</strong>fered that make <strong>Surprise</strong> an attractive destination for a wide variety <strong>of</strong><br />
interests.<br />
Public Safety: Public safety departments will work cooperatively with the community to provide<br />
a safe and secure city.<br />
Higher Education: Strive to develop world class education in <strong>Surprise</strong> by seeking and enhancing<br />
educational opportunities that support initiatives, programs, projects, and lifelong learning<br />
opportunities throughout the community.<br />
206
Capital Improvement Plan<br />
Capital Improvement Plan Summary<br />
General Capital Fund<br />
Transportation Improvement Fund<br />
General Government Development Fee Fund<br />
Vehicle Replacement Fund<br />
Fire and EMS Development Fee Fund<br />
Police Development Fee Fund<br />
Parks and Recreation Development Fee Fund<br />
Library Development Fee Fund<br />
Roads <strong>of</strong> Regional Significance Development Fee Fund<br />
Public Works Development Fee Fund<br />
Debt Service Funds<br />
Water System and Replenishment Development Fee Fund<br />
Wastewater System Development Fee Funds
Capital Improvement Plan Summary<br />
<strong>FY2014</strong><br />
The city <strong>of</strong> <strong>Surprise</strong> has transitioned from a small agricultural community to one <strong>of</strong> the fastest growing<br />
communities in the nation. The 2010 census results show a population <strong>of</strong> 118,349, more than triple the<br />
2000 census tabulation <strong>of</strong> approximately 30,000 residents. It is<br />
estimated that the population will increase slightly to 121,000 by<br />
the end <strong>of</strong> FY2016.<br />
Much <strong>of</strong> <strong>Surprise</strong>’s infrastructure was developed with a mix <strong>of</strong><br />
public and private investment. Large master planned<br />
communities like Sun <strong>City</strong> Grand and Marley Park installed<br />
local infrastructure (roads, water, and sewer lines) to service<br />
the projects while the city provides police, fire, and wastewater<br />
treatment infrastructure and services for new residents<br />
expected to be added annually.<br />
Management works with the Mayor and <strong>City</strong> Council and all<br />
departments throughout the Capital Improvement Plan (CIP)<br />
process to develop the adopted CIP. The CIP process runs in<br />
conjunction with the operating budget process and both<br />
culminate with the adoption <strong>of</strong> the recommended budget and CIP by the Mayor and <strong>City</strong> Council in June.<br />
The city is working on a comprehensive, multi-year Infrastructure Improvement Plan that outlines projects<br />
anticipated to fulfill current and future capital and infrastructure needs. The plan incorporates estimated<br />
project costs and associated ongoing operating costs. It addresses both repair and replacement <strong>of</strong><br />
existing infrastructure, purchase <strong>of</strong> capital equipment, and construction <strong>of</strong> new facilities.<br />
The proposed CIP is limited due to minimal growth. During the course <strong>of</strong> <strong>FY2014</strong>, staff will be working<br />
with the Mayor and <strong>City</strong> Council to develop an Infrastructure Improvement Plan and CIP funding<br />
strategies.<br />
Funding<br />
The CIP is broken down into four major functions:<br />
1. general fund CIP<br />
2. transportation improvement CIP<br />
3. development impact fee funds<br />
4. water and wastewater enterprise funds<br />
1. general capital fund<br />
Projects in this fund are paid for primarily by a portion <strong>of</strong> construction sales tax and third party funding<br />
(e.g. grants, intergovernmental revenue, etc.).<br />
2. transportation improvement fund<br />
Projects in this fund are primarily funded by a 1.5% dedicated construction sales tax and third party<br />
funding (e.g. grants, intergovernmental revenue, etc.)<br />
3. water and wastewater enterprise funds<br />
These CIP programs are paid for by a combination <strong>of</strong> user rates and development impact fees<br />
Capital and Operational Finances<br />
In keeping with the city’s policy <strong>of</strong> sustainability, approved capital projects stress continuation <strong>of</strong> current<br />
service levels. <strong>Surprise</strong> citizens deserve, and have come to expect the high level <strong>of</strong> service provided by<br />
the city. In order to maintain this high level <strong>of</strong> service, the city has committed many <strong>of</strong> its one-time sources<br />
<strong>of</strong> funds to pay for capital and infrastructure needs.<br />
The operational costs associated with the massive amount <strong>of</strong> capital built by the city <strong>of</strong> <strong>Surprise</strong> have<br />
impacted the city’s operating budget. With each new completed project there are staffing, maintenance,<br />
supply, and other service costs that must be funded on an ongoing basis. The funding <strong>of</strong> these ongoing<br />
operational costs must be determined before a project is approved. By examining operational<br />
requirements early in the process, the city is assured that when a public building is completed, there is<br />
funding to open and operate the facility without negatively affecting other city services.<br />
207
The majority <strong>of</strong> approved capital projects are directly related to maintaining the current level <strong>of</strong> service.<br />
New residents who move to <strong>Surprise</strong> will be greeted with a high level <strong>of</strong> service and amenities. The<br />
Mayor, <strong>City</strong> Council, and city management have pledged to do what is required to ensure this level <strong>of</strong><br />
service is sustainable.<br />
CIP Development<br />
The following section provides information that served as the background for the development <strong>of</strong> the<br />
Infrastructure Improvement Plan.<br />
What should be addressed in this planning effort?<br />
financial responsibility<br />
improved transportation<br />
expansion <strong>of</strong> public safety facilities<br />
coordination with utilities<br />
allocation <strong>of</strong> funding for advanced organizational planning<br />
maintaining the necessary “tools” to provide quality customer service<br />
expansion <strong>of</strong> parks and recreation facilities<br />
economic development implications<br />
environmental issues<br />
community aesthetics and image<br />
public input<br />
sustainability for <strong>Surprise</strong><br />
208<br />
Community Park
Capital Project Definition<br />
In order to distinguish between true capital items and operating items, the following capital project<br />
definition was developed:<br />
Projects included in the <strong>Surprise</strong> CIP will be those with a cost <strong>of</strong> at least $100,000 with a useful life <strong>of</strong> at<br />
least three years. All other projects shall be included in departmental operating budgets.<br />
The CIP is to be used as a guide in decision-making. The CIP is intentionally developed in the most apolitical<br />
environment possible with the full knowledge that the final decisions will be made in the political<br />
arena. The CIP is an objective basis for making decisions in a very subjective environment.<br />
The process for the CIP’s development is divided into three key components, culminating in the<br />
presentation <strong>of</strong> a Capital Improvement Plan to the Mayor and <strong>City</strong> Council for approval.<br />
1. Needs Assessment. Future needs are outlined utilizing the General Plan, department<br />
master plans, and growth pattern studies.<br />
2. Financial Analysis. Examination <strong>of</strong> the city’s recent revenues, expenditures, current<br />
debt, and bonding capacity are included in the financial analysis.<br />
3. Capital Improvement Plan Policies. The plan document includes policies, an<br />
implementation section, and outlines how the CIP will be updated on an annual<br />
basis.<br />
1. Needs Assessment<br />
The needs assessment encompasses all <strong>of</strong> the anticipated needs for the community within the definition<br />
<strong>of</strong> capital projects.<br />
During the plan development process, an inclusive capital project list is created. However, additional<br />
needs will be identified on a continuing basis and will be included in the annual update process. Some<br />
unanticipated needs will occur during the budget year and will be weighed against needs already<br />
identified in the annually adopted CIP.<br />
2. Financial Analysis<br />
When attempting to determine what resources are available to fund capital improvements, it is important<br />
to carefully examine the current financial condition <strong>of</strong> the city as well as possible funding alternatives. Like<br />
most communities, the city <strong>of</strong> <strong>Surprise</strong> will always have more needs than financial resources.<br />
In developing the CIP, a complete financial analysis is conducted. Funding options, current revenue<br />
trends, the community’s borrowing capacity, and current debt are reviewed.<br />
Funding Options<br />
The city <strong>of</strong> <strong>Surprise</strong> has been funding capital improvement projects for many years. The key to<br />
implementing the CIP is consistent, systematic funding. This is becoming more and more difficult with<br />
today’s political climate, recent legislative changes, shrinking revenue sources, and the demands<br />
presented by <strong>Surprise</strong>’s growth potential. The following options were considered when analyzing potential<br />
funding sources for CIP Projects.<br />
Pay-As-You-Go from current revenues: The city currently receives the bulk <strong>of</strong> its revenues through<br />
local sales taxes, state sales tax, and state income tax. A component <strong>of</strong> the local sales tax is<br />
construction related taxes. The city also receives funding from state fuel taxes and the Arizona<br />
Lottery. These funds are committed for transportation related expenditures.<br />
Municipal bonds: The city can issue bonds for capital projects. Municipal bonds are paid back over<br />
a period <strong>of</strong> time with interest. The city’s ability to use bond financing is discussed in more detail in the<br />
bonding capacity section. The issuance <strong>of</strong> municipal bonds must be approved by the voters.<br />
Certificates <strong>of</strong> participation/municipal property corporations: These are funding mechanisms<br />
used by many municipal governments that allow the municipality to borrow funds without voter<br />
approval. The debt is paid back much like a bond – over time with interest. The city <strong>of</strong> <strong>Surprise</strong><br />
qualifies as having municipal property corporation status, so this option is available.<br />
Lease-purchase agreements: A method <strong>of</strong> financing capital projects that lessens the up-front costs<br />
to the municipality. While interest is paid, the pay<strong>of</strong>f period is typically a shorter period than bonds<br />
and the municipality will own the project at the termination <strong>of</strong> the agreement.<br />
209
Improvement districts: This financing method is used to raise capital for projects in which the<br />
residents, who benefit from the improvements, pay for them over time (e.g. street light improvement<br />
district).<br />
Development impact fees: Fees imposed on new development to defray the impact and additional<br />
costs the development places on municipal infrastructure. The city currently has an impact fee<br />
ordinance that applies fees to new development.<br />
Development agreements: Developers construct infrastructure and convey the asset to the city.<br />
According to the terms <strong>of</strong> the agreement, developers are reimbursed for the infrastructure by the city<br />
through collections <strong>of</strong> development impact fees, permit fees, water and wastewater fees, and/or sales<br />
tax revenue.<br />
Grants: Federal, state, and county grants are available to finance capital projects. Many <strong>of</strong> these<br />
grants require the municipality to participate either financially or through “in kind” matches. The city is<br />
the recipient <strong>of</strong> various federal, state, and county grants and pursues grant funding as opportunities<br />
arise.<br />
User fees: Fees paid by service users to maintain existing facilities and meet regulatory<br />
requirements. Utilities such as water, sewer and sanitation fall under this category.<br />
Borrowing Capacity<br />
While it is the desired goal <strong>of</strong> any organization to finance purchases without borrowing (pay-as-you-go),<br />
sometimes financing is used to leverage opportunities. <strong>Surprise</strong> has used various financing methods in<br />
the past to purchase vehicles and equipment and finance the development <strong>of</strong> other municipal services.<br />
The most commonly utilized large project municipal financing method in the United States <strong>of</strong> America is<br />
the general obligation bond (G.O. bond). This is the most inexpensive way to finance projects because<br />
the bond’s repayment is based on the full taxing authority <strong>of</strong> the municipality and backed up by real<br />
property. Voters have to approve the property taxes (secondary) instituted to pay for the issuance <strong>of</strong> G.O.<br />
bonds.<br />
The state <strong>of</strong> Arizona places limits on this type <strong>of</strong> financing. Under Arizona Law, Article IX, Section 8,<br />
municipalities may issue G.O. bonds for purposes <strong>of</strong> water, wastewater, artificial light, open space<br />
preserves, parks and recreational facilities, public safety, law enforcement, fire and emergency services<br />
facilities, streets, and transportation facilities up to an amount not exceeding 20 percent <strong>of</strong> the secondary<br />
assessed value. Based on <strong>Surprise</strong>’s secondary assessed valuation <strong>of</strong> $854,683,673, a total <strong>of</strong><br />
$170,936,735 could be borrowed utilizing G.O. Bonds. The city currently has no outstanding G.O. Bonds<br />
debt in the 20 percent category.<br />
In addition, Arizona law allows municipalities to issue G.O. Bonds for all other purposes not listed above<br />
up to an amount not exceeding six percent <strong>of</strong> the valuation. This would allow <strong>Surprise</strong> to bond for<br />
$51,281,020 under this category. The city currently has no outstanding G.O. Bonded debt in the six<br />
percent category.<br />
<strong>Surprise</strong>’s other debt does not count against these limits; although, the overall financial position <strong>of</strong> the city<br />
would be considered by lending institutions.<br />
Outstanding Debt<br />
As <strong>of</strong> June 30, 2013, the city <strong>of</strong> <strong>Surprise</strong> held the following outstanding long-term debt obligations. The<br />
total amount <strong>of</strong> outstanding debt and year <strong>of</strong> debt retirement are indicated:<br />
Debt<br />
Retirement<br />
Date<br />
Oustanding<br />
Balance as <strong>of</strong><br />
June, 30 2013<br />
Outstanding Debt<br />
Municipal Property Corporation Bonds: 2000-2003 Issuance 7/1/2020 $ 31,870,000<br />
Municipal Property Corporation Bonds: 2007 Issuance 4/1/2032 50,675,000<br />
Total $ 82,545,000<br />
210
3. Capital Improvement Plan Policies<br />
Policies<br />
When implementing a plan <strong>of</strong> this complexity and magnitude, it is important to adhere to operating<br />
policies and procedures to ensure success. The following policies have been adopted as part <strong>of</strong> the<br />
<strong>Surprise</strong> Capital Improvement Plan.<br />
Regional considerations and intergovernmental relationships will be evaluated as projects are<br />
developed<br />
Legal mandates will be monitored and projects to satisfy the mandates will be developed<br />
The CIP will be updated annually<br />
Pay-as-you-go financing will be the preferred funding mechanism <strong>of</strong> the CIP<br />
Should borrowing be necessary, dedicated revenue streams will jeopardize the long-term<br />
implementation <strong>of</strong> the CIP<br />
Efforts will be continuously made to maintain and improve the city’s credit rating<br />
Capital project and improvement districts financed through debt instruments shall not be financed<br />
for more than the anticipated useful life <strong>of</strong> the project<br />
Department Directors and Managers will meet with the Chief Information Officer as part <strong>of</strong> the CIP<br />
update process to discuss and coordinate purchases in communications equipment and systems<br />
and computer hardware and s<strong>of</strong>tware to ensure citywide compatibility<br />
The city shall periodically review user fees and adjust accordingly to ensure that the fees<br />
adequately cover the cost <strong>of</strong> operation, maintenance, and future expansion<br />
The city shall periodically review development impact fees and adjust accordingly to ensure new<br />
growth continues to pay its fair share <strong>of</strong> impact on the community<br />
The city shall work aggressively with developers to ensure future development pays for itself and is<br />
not a burden on existing residents<br />
Projects will be developed to accommodate coordination with economic development efforts<br />
Implementation<br />
The success <strong>of</strong> a plan or a planning process is measured by the degree <strong>of</strong> its implementation. Since<br />
resources are limited, it is crucial for the city <strong>of</strong> <strong>Surprise</strong> to follow a consistent, objective path to allocate<br />
funding for future capital improvements needs.<br />
The following implementation program outlines the specific steps necessary to implement the CIP and<br />
perform the annual update.<br />
General Implementation Guidelines<br />
The <strong>Surprise</strong> CIP is adopted by the Mayor and <strong>City</strong><br />
Council and is published and widely distributed. The<br />
CIP is updated annually and reviewed and adopted by<br />
the Mayor and <strong>City</strong> Council along with the operating<br />
budget each year<br />
Trenching<br />
Department directors are responsible for preparing<br />
monthly reports on the status <strong>of</strong> current year capital<br />
projects. The reports are posted monthly on the city’s<br />
website www.surpriseaz.gov<br />
Citizen input is sought periodically to determine the<br />
desires <strong>of</strong> the public. Attitudes and circumstances<br />
change and informed decision making requires that the<br />
city have an up-to-date awareness <strong>of</strong> what the public’s<br />
attitudes are toward community facilities and services<br />
and how to pay for them<br />
211
Update Process<br />
Updating the CIP takes place annually along with the development <strong>of</strong> the city’s annual budget. The<br />
annual update includes projects by funding source for presentation to the Mayor and <strong>City</strong> Council.<br />
The prior year process is reviewed annually to discuss the plan’s process and implementation. Project<br />
worksheets are updated in the budget database by the responsible department. The project information<br />
includes: project name and department, description, council district location, funding source(s), cost detail<br />
by category and year, and estimated ongoing operational costs.<br />
Projects are evaluated and prioritized using three funding categories.<br />
1. Prioritized Funding Category: Projects competing for general fund and certain dedicated funding<br />
sources. The majority <strong>of</strong> projects are in this category.<br />
2. Enterprise Fund Category: Utility Projects funded from a dedicated funding source, which are not<br />
able to compete for general fund monies.<br />
3. Developer Funded: Projects funded and constructed by developers that do not compete for<br />
general fund monies. These projects are included in the 5-year CIP to recognize the vast amount<br />
<strong>of</strong> infrastructure that is being put into the ground which the city will assume responsibility for<br />
upon completion.<br />
<strong>City</strong> Hall<br />
212
<strong>City</strong> <strong>of</strong> <strong>Surprise</strong><br />
<strong>FY2014</strong><br />
Summary <strong>of</strong> Capital Improvement Expenditures by Fund<br />
Fund Number Fund Name <strong>FY2014</strong><br />
21112 General Capital Fund $5,018,100<br />
21418 Transportation Improvement Fund 4,917,700<br />
22511 Water Operations 599,500<br />
22512 - 22516 Water Development Fee Funds 2,403,000<br />
22522 Water Replenishment Development Fee Funds 3,364,100<br />
22531 Sewer Operations 3,354,900<br />
22532 - 22537 Sewer Development Fee Funds 1,000,000<br />
Total - All Funds $20,769,800<br />
213
General Capital Fund<br />
Description<br />
The general capital fund is established to provide a centralized location for the acquisition <strong>of</strong> capital with<br />
resources that are not restricted such as a development impact fees. The intent is to remove capital costs<br />
from department operating budgets to better analyze the cost <strong>of</strong> departmental operations as well as the<br />
need for capital and infrastructure.<br />
At the direction <strong>of</strong> the Mayor and <strong>City</strong> Council, the city <strong>of</strong> <strong>Surprise</strong> dedicates the first $1,250,000 <strong>of</strong><br />
construction related sales tax collections to operating expenses. The remaining construction sales tax is<br />
considered a one-time revenue source and is dedicated for capital expenses in this fund. The dedicated<br />
sales tax amount for <strong>FY2014</strong> is estimated at $1,950,000.<br />
Major <strong>Budget</strong> Changes<br />
The expenditures are primarily for capital projects that include asset replacements, multiple transportation<br />
projects, data disaster recovery project, CRS master plan, process to replace the financial system, and<br />
SWAT equipment are programmed for the <strong>FY2014</strong> budget. The <strong>FY2014</strong> budget also includes $2,525,600<br />
in contingency programming.<br />
FY2011 FY2012 FY2013 <strong>FY2014</strong> Amended to<br />
Expenditures<br />
By category<br />
Actual Actual Amended <strong>Budget</strong> <strong>Budget</strong><br />
Personnel 12,091 2,149 0 0 0%<br />
Supplies 25,692 637,052 0 0 0%<br />
Services 329,442 300,217 611,800 901,400 47%<br />
Capital 1,879,796 886,028 4,544,600 4,116,700 -9%<br />
Debt Service 23,759 0 0 0 0%<br />
Contingency 0 0 0 2,525,600 0%<br />
Transfer Out 0 0 0 0 0%<br />
Development Agreements 194,804 0 1,100,000 1,100,000 0%<br />
Total<br />
By department<br />
2,465,585 1,825,446 6,256,400 8,643,700 38%<br />
<strong>City</strong> Manager 0 0 0 50,000 0%<br />
Community and Rec Svcs 144,062 0 0 150,000 0%<br />
Community Development 194,804 0 1,100,000 1,100,000 0%<br />
Fire-Emergency Services 47,245 637,052 0 475,000 0%<br />
Finance 0 0 0 500,000 0%<br />
General Operations 23,759 0 750,000 2,525,600 237%<br />
Information Services 42,686 29,985 0 615,000 0%<br />
Police 0 0 0 72,000 0%<br />
Public Works 2,013,028 1,158,409 4,406,400 3,156,100 -28%<br />
Total 2,465,585 1,825,446 6,256,400 8,643,700 38%<br />
Revenues<br />
By fund source<br />
Charges for Svcs/Oth 1,455,085 222,336 2,465,300 1,950,000 -21%<br />
Transfer In 1,050,837 1,685,089 1,650,000 0 -100%<br />
Total 2,505,922 1,907,425 4,115,300 1,950,000 -53%
Transportation Improvement Fund<br />
Description<br />
The transportation improvement fund is established to provide for the collection and expenditure <strong>of</strong> the<br />
dedicated 1.5% local construction transaction tax adopted by the Mayor and Council through ordinance 05-<br />
13. This tax is dedicated for the improvement <strong>of</strong> existing roadway corridors and the related costs <strong>of</strong> the<br />
construction <strong>of</strong> new roadways.<br />
Major <strong>Budget</strong> Changes<br />
The <strong>FY2014</strong> budget increased by 19% from the FY2013 amended budget. Personnel expenditures are<br />
impacted by a 3% increase in the employer contribution for the Arizona State Retirement System and a 2.2%<br />
increase for a cost <strong>of</strong> living adjustment.<br />
The increases for supplies and services are directly related to the new and ongoing programmed capital<br />
improvement projects.<br />
FY2011 FY2012 FY2013 <strong>FY2014</strong> Amended to<br />
Expenditures<br />
By category<br />
Actual Actual Amended <strong>Budget</strong> <strong>Budget</strong><br />
Personnel 29,335 0 117,500 121,800 4%<br />
Supplies 115 0 1,100 1,000 -9%<br />
Services 1,151,942 59,523 2,226,500 2,366,500 6%<br />
Capital 1,584,446 1,239,784 1,800,000 2,552,700 42%<br />
Transfer Out 0 0 0 0 0%<br />
Development Agreemen 274,934 260,003 300,000 260,000 -13%<br />
Total<br />
By department<br />
3,040,772 1,559,309 4,445,100 5,302,000 19%<br />
Community Development 29,516 51,549 300,000 260,000 -13%<br />
Economic Development 0 0 0 0 0%<br />
Finance 245,619 216,271 0 0 0%<br />
General Operations 0 0 0 0 0%<br />
Information Services 0 0 0 0 0%<br />
Public Works 2,765,638 1,291,490 4,145,100 5,042,000 22%<br />
Total 3,040,772 1,559,309 4,445,100 5,302,000 19%<br />
Revenues<br />
By fund source<br />
Local Sales Tax 1,569,724 2,001,197 1,981,400 2,181,800 10%<br />
State Shared 0 0 0 0 0%<br />
Charges for Svcs/Oth 1,126,801 801,943 1,463,300 46,500 -97%<br />
Transfer In 0 0 0 0 0%<br />
Total 2,696,525 2,803,140 3,444,700 2,228,300 -35%<br />
215
FY2011<br />
Final<br />
FY2012<br />
Adopted<br />
FY2013<br />
Adopted<br />
<strong>FY2014</strong><br />
<strong>Budget</strong><br />
Adopted to<br />
<strong>Budget</strong><br />
Personnel<br />
Civil Engineer 0.0 0.0 1.0 1.0 0.0<br />
Total 0.0 0.0 1.0 1.0 0.0<br />
216
General Government<br />
Development Fee Fund<br />
Description<br />
The general government development fee fund is established to account for the inflow <strong>of</strong> general<br />
government development fees levied on new residential and commercial construction. This fee can only<br />
be used for the purchase, construction, financing, and furnishing <strong>of</strong> new capital or one-time items directly<br />
related to the increased demand on general government services caused by growth. Development fees<br />
cannot be used to subsidize operating needs.<br />
Revenues are based upon an estimated issuance <strong>of</strong> 250 single family residential permits and the<br />
estimated square feet <strong>of</strong> 217,800 non-single family residential permits in FY2013. On April 26, 2011<br />
Senate Bill 1525 was signed into law and changed the method the city used to calculate development<br />
impact fees. Arizona Revised Statutes §9-463.05.K requires municipalities planning to continue assessing<br />
development impact fees complete an interim study effective January 1, 2012 and an updated<br />
development impact fee study effective August 1, 2014. The city has revised fees based on the interim<br />
study and plans on meeting the requirements <strong>of</strong> the August, 2014 deadline. The general government<br />
development fee for single family residential permits was revised from $661 to $661 as <strong>of</strong> January 1,<br />
2012.<br />
Major <strong>Budget</strong> Changes<br />
With minimal forecasted development revenue for the funds, the only programed expenditures are for the<br />
impact fee study and rental payments. The city will continue to review and evaluate potential projects<br />
through the preparation <strong>of</strong> the Infrastructure Improvement Plan (IIP) for the impact fee study update.<br />
FY2011 FY2012 FY2013 <strong>FY2014</strong> Amended to<br />
Expenditures Actual Actual Amended <strong>Budget</strong> <strong>Budget</strong><br />
By category<br />
Supplies 0 0 0 0 0%<br />
Services 13,861 12,731 20,000 20,000 0%<br />
Capital 0 0 0 0 0%<br />
Debt Service 128,947 0 1,837,000 0 -100%<br />
Contingency 0 0 8,500 0 -100%<br />
Transfer Out 665,466 667,359 667,000 666,500 0%<br />
Total 808,274 680,091 2,532,500 686,500 -73%<br />
By department<br />
Communications 0 0 0 0 0%<br />
Finance 13,861 12,731 28,500 20,000 -30%<br />
General Operations 0 0 0 0 0%<br />
Public Works 665,466 667,359 667,000 666,500 0%<br />
Development Fee New Cap 128,947 0 1,837,000 0 -100%<br />
Total 808,274 680,091 2,532,500 686,500 -73%<br />
Revenues<br />
By fund source<br />
Charges for Svcs/Oth 468,620 265,544 2,430,100 537,400 -78%<br />
Total 468,620 265,544 2,430,100 537,400 -78%<br />
217
Vehicle Replacement<br />
Description<br />
Vehicle replacement funding was established to allow the city to replace vehicles and equipment as they<br />
reach the end <strong>of</strong> useful life. The Fleet Management Division <strong>of</strong> the Public Works Department administers<br />
the fleet replacement program. The city’s capital asset policy is the guideline for the replacement timeline<br />
with minor exceptions for reserve vehicles. The fleet manager and department director evaluate vehicles<br />
during the budget process and adjustments in the replacement schedule may be made. All vehicles are<br />
replaced turn key. Adjustments are made annually for inflation. Replacement funds are not used to<br />
upgrade or enhance vehicles.<br />
Major <strong>Budget</strong> Changes<br />
The programed capital expenditures are for motorized vehicle and equipment that have been through the<br />
evaluation process and are being recommended for replacement. Fund balance and remaining available<br />
revenue is programmed as contingency at $1,998,000.<br />
FY2011 FY2012 FY2013 <strong>FY2014</strong> Amended to<br />
Expenditures<br />
By category<br />
Actual Actual Amended <strong>Budget</strong> <strong>Budget</strong><br />
Capital 726,680 835,650 2,051,000 2,281,300 11%<br />
Transfer Out 0 0 0 0 0%<br />
Contingency 0 0 0 1,998,000 0%<br />
Total<br />
By department<br />
726,680 835,650 2,051,000 4,279,300 109%<br />
General Operations 0 0 2,051,000 2,281,300 11%<br />
Public Works 726,680 835,650 0 1,998,000 0%<br />
Total 726,680 835,650 2,051,000 4,279,300 109%<br />
Revenues<br />
By fund source<br />
Charges for Svcs/Oth 2,782 100,614 221,700 65,800 -70%<br />
Transfer In 7,325,896 0 0 0 0%<br />
Total 7,325,896 0 0 0 0%<br />
218
Fire and EMS Development Fee Fund<br />
Description<br />
The fire and emergency medical services (EMS) development fee fund is established to account for the<br />
inflow <strong>of</strong> fire and EMS development fees levied on new residential and commercial construction. This fee<br />
can only be used for the purchase, construction, financing, and furnishing <strong>of</strong> new capital or one-time<br />
items directly related to the increased demand on fire and emergency medical services caused by growth.<br />
Development fees cannot be used to subsidize operational needs.<br />
Revenues are based upon an estimated issuance <strong>of</strong> 250 single family residential permits and the<br />
estimated square feet <strong>of</strong> 217,800 non-single family residential permits in FY2013. On April 26, 2011<br />
Senate Bill 1525 was signed into law and changed the method the city used to calculate development<br />
impact fees. Arizona Revised Statutes §9-463.05.K requires municipalities planning to continue assessing<br />
development impact fees complete an interim study effective January 1, 2012 and an updated<br />
development impact fee study effective August 1, 2014. The city has revised fees based on the interim<br />
study and plans on meeting the requirements <strong>of</strong> the August, 2014 deadline. The fire and EMS<br />
development fee for single family residential permits was revised from $706 to $688 as <strong>of</strong> January 1,<br />
2012.<br />
Major <strong>Budget</strong> Changes<br />
With minimal forecasted development revenue for the funds, the only programed expenditures are for the<br />
impact fee study and rental payments. The city will continue to review and evaluate potential projects<br />
through the preparation <strong>of</strong> the Infrastructure Improvement Plan (IIP) for the impact fee study update.<br />
FY2011 FY2012 FY2013 <strong>FY2014</strong> Amended to<br />
Expenditures Actual Actual Amended <strong>Budget</strong> <strong>Budget</strong><br />
By category<br />
Supplies 0 0 0 0 0%<br />
Services 13,861 8,599 20,000 20,000 0%<br />
Capital 45,947 0 0 0 0%<br />
Debt Service 14,407 0 292,600 0 -100%<br />
Contingency 0 0 8,500 0 -100%<br />
Transfer Out 121,256 121,601 121,600 121,500 0%<br />
Development Agreements 0 3,894 0 0 0%<br />
Total 195,472 134,094 442,700 141,500 -68%<br />
By department<br />
Finance 13,861 8,599 28,500 20,000 -30%<br />
Fire-Emergency Services 167,203 121,601 414,200 121,500 -71%<br />
General Operations 14,407 3,894 0 0 0%<br />
Total 195,472 134,094 442,700 141,500 -68%<br />
Revenues<br />
By fund source<br />
Charges for Svcs/Oth 542,968 295,641 312,600 760,100 143%<br />
Transfer In 0 0 0 0 0%<br />
Total 542,968 295,641 312,600 760,100 143%<br />
219
Police Development Fee Fund<br />
Description<br />
The police development fee fund is established to account for the inflow <strong>of</strong> police development fees levied<br />
on new residential and commercial construction. This fee can only be used for the purchase, construction,<br />
financing, and furnishing <strong>of</strong> new capital or one-time items directly related to the increased demand on<br />
police services caused by growth. Development fees cannot be used to subsidize operational needs.<br />
Revenues are based upon an estimated issuance <strong>of</strong> 250 single family residential permits and the<br />
estimated square feet <strong>of</strong> 217,800 non-single family residential permits in FY2013. On April 26, 2011<br />
Senate Bill 1525 was signed into law and changed the method the city used to calculate development<br />
impact fees. Arizona Revised Statutes §9-463.05.K requires municipalities planning to continue assessing<br />
development impact fees complete an interim study effective January 1, 2012 and an updated<br />
development impact fee study effective August 1, 2014. The city has revised fees based on the interim<br />
study and plans on meeting the requirements <strong>of</strong> the August, 2014 deadline. The police development fee<br />
for single family residential permits was revised from $372 to $371 as <strong>of</strong> January 1, 2012.<br />
Major <strong>Budget</strong> Changes<br />
With minimal forecasted development revenue for the funds, the only programed expenditures are for the<br />
impact fee study and rental payments. Fund balance and remaining available revenue is programmed as<br />
contingency at $978,800. The city will continue to review and evaluate potential projects through the<br />
preparation <strong>of</strong> the Infrastructure Improvement Plan (IIP) for the impact fee study update.<br />
FY2011 FY2012 FY2013 <strong>FY2014</strong> Amended to<br />
Expenditures<br />
By category<br />
Actual Actual Amended <strong>Budget</strong> <strong>Budget</strong><br />
Services 13,861 8,599 20,000 20,000 0%<br />
Capital 0 0 0 0 0%<br />
Contingency 0 0 8,500 978,800 11415%<br />
Transfer Out 245,400 246,098 246,000 245,800 0%<br />
Total<br />
By department<br />
259,261 254,697 274,500 1,244,600 353%<br />
Finance 13,861 8,599 28,500 20,000 -30%<br />
General Operations 0 0 0 0 0%<br />
Police 245,400 246,098 246,000 1,224,600 398%<br />
Total 259,261 254,697 274,500 1,244,600 353%<br />
Revenues<br />
By fund source<br />
Charges for Svcs/Oth 215,053 127,158 107,300 240,700 124%<br />
Transfer In 0 0 0 0 0%<br />
Total 215,053 127,158 107,300 240,700 124%<br />
220
Parks and Recreation<br />
Development Fee Fund<br />
Description<br />
The parks and recreation development fee fund is established to account for the inflow <strong>of</strong> parks and<br />
recreation development fees levied on new residential construction. This fee can only be used for the<br />
purchase, construction, financing, and furnishing <strong>of</strong> new items directly related to the increased demand<br />
on parks and recreation services caused by growth. Development fees cannot be used to subsidize<br />
operational needs.<br />
Revenues are based upon an estimated issuance <strong>of</strong> 250 single family residential permits and the<br />
estimated square feet <strong>of</strong> 217,800 non-single family residential permits in FY2013. On April 26, 2011<br />
Senate Bill 1525 was signed into law and changed the method the city used to calculate development<br />
impact fees. Arizona Revised Statutes §9-463.05.K requires municipalities planning to continue assessing<br />
development impact fees complete an interim study effective January 1, 2012 and an updated<br />
development impact fee study effective August 1, 2014. The city has revised fees based on the interim<br />
study and plans on meeting the requirements <strong>of</strong> the August, 2014 deadline. The parks and recreation<br />
development fee for single family residential permits was revised from $2,114 to $785 as <strong>of</strong> January 1,<br />
2012.<br />
Major <strong>Budget</strong> Changes<br />
With minimal forecasted development revenue for the funds, the only programed expenditures are for the<br />
impact fee study and rental payments. Fund balance and remaining available revenue is programmed as<br />
contingency at $3,554,000. The city will continue to review and evaluate potential projects through the<br />
preparation <strong>of</strong> the Infrastructure Improvement Plan (IIP) for the impact fee study update.<br />
FY2011 FY2012 FY2013 <strong>FY2014</strong> Amended to<br />
Expenditures<br />
By category<br />
Actual Actual Amended <strong>Budget</strong> <strong>Budget</strong><br />
Supplies 0 0 0 0 0%<br />
Services 13,861 8,599 20,000 20,000 0%<br />
Capital 0 0 0 0 0%<br />
Contingency 0 0 8,500 3,554,000 41712%<br />
Transfer Out 792,978 795,234 795,000 794,200 0%<br />
Development Agreements 40,918 0 0 0 0%<br />
Total<br />
By department<br />
847,757 803,833 823,500 4,368,200 430%<br />
Community and Rec Svcs 833,896 795,234 795,000 4,348,200 447%<br />
Finance 13,861 8,599 28,500 20,000 -30%<br />
General Operations 0 0 0 0 0%<br />
Total 847,757 803,833 823,500 4,368,200 430%<br />
Revenues<br />
By fund source<br />
Charges for Svcs/Oth 448,517 372,129 220,700 533,600 142%<br />
Transfer In 0 0 0 0 0%<br />
Total 448,517 372,129 220,700 533,600 142%
Library Development Fee Fund<br />
Description<br />
The library development fee fund is established to account for the inflow <strong>of</strong> library development fees<br />
levied on new residential construction. This fee can only be used for the purchase, construction,<br />
financing, and furnishing <strong>of</strong> new items directly related to the increased demand on library services caused<br />
by growth. Development fees cannot be used to subsidize operational needs.<br />
Revenues are based upon an estimated issuance <strong>of</strong> 250 single family residential permits and the<br />
estimated square feet <strong>of</strong> 217,800 non-single family residential permits in FY2013. On April 26, 2011<br />
Senate Bill 1525 was signed into law and changed the method the city used to calculate development<br />
impact fees. Arizona Revised Statutes §9-463.05.K requires municipalities planning to continue assessing<br />
development impact fees complete an interim study effective January 1, 2012 and an updated<br />
development impact fee study effective August 1, 2014. The city has revised fees based on the interim<br />
study and plans on meeting the requirements <strong>of</strong> the August, 2014 deadline. The library development fee<br />
for single family residential permits was revised from $467 to $133 as <strong>of</strong> January 1, 2012.<br />
Major <strong>Budget</strong> Changes<br />
With minimal forecasted development revenue for the funds, the only programed expenditure is for the<br />
impact fee study. Fund balance and remaining available revenue is programmed as contingency at<br />
$4,589,800. The city will continue to review and evaluate potential projects through the preparation <strong>of</strong> the<br />
Infrastructure Improvement Plan (IIP) for the impact fee study update.<br />
FY2011 FY2012 FY2013 <strong>FY2014</strong> Amended to<br />
Expenditures Actual Actual Amended <strong>Budget</strong> <strong>Budget</strong><br />
By category<br />
Services 13,861 8,599 20,000 20,000 0%<br />
Contingency 0 0 8,500 4,589,800 53898%<br />
Total 13,861 8,599 28,500 4,609,800 16075%<br />
By department<br />
Finance 13,861 8,599 28,500 20,000 -30%<br />
Community and Rec Svcs 0 0 0 4,589,800 0%<br />
Total 13,861 8,599 28,500 4,609,800 16075%<br />
Revenues<br />
By fund source<br />
Charges for Svcs/Oth 142,137 104,745 56,900 136,500 140%<br />
Total 142,137 104,745 56,900 136,500 140%<br />
222
Roads <strong>of</strong> Regional Significance<br />
Development Fee Funds<br />
Description<br />
The roads <strong>of</strong> regional significance development fund are established to account for the inflow <strong>of</strong><br />
development fees levied on new residential and commercial construction. This fee can only be used for<br />
the purchase, construction, financing, and furnishing <strong>of</strong> new capital or one-time items directly related to<br />
the increased demand on roadways caused by growth. Development fees cannot be used to subsidize<br />
operational needs.<br />
Revenues are based upon an estimated issuance <strong>of</strong> single family residential permits and estimated<br />
square feet <strong>of</strong> non-single family residential permits in <strong>FY2014</strong>. The roads <strong>of</strong> regional significance<br />
development fees remains unchanged from FY2008 $5,396 in SPA 3 and 5 per single family residential<br />
permit and FY2008 at $5,715 in Special Planning Area (SPA) 2, 4, and 6 as established July 1, 2007.<br />
Major <strong>Budget</strong> Changes<br />
With no forecasted development revenue for the funds, the only programed expenditures are for the<br />
impact fee study. Fund balance and remaining available revenue is programmed as contingency at<br />
$2,130,900. The city will continue to review and evaluate potential projects through the preparation <strong>of</strong> the<br />
Infrastructure Improvement Plan (IIP) for the impact fee study update.<br />
FY2011 FY2012 FY2013 <strong>FY2014</strong> Amended to<br />
Expenditures<br />
By category<br />
Actual Actual Amended <strong>Budget</strong> <strong>Budget</strong><br />
Services 13,972 2,022 20,000 20,000 0%<br />
Capital 0 0 0 0 0%<br />
Contingency 0 0 9800 2,130,900 21644%<br />
Total<br />
By department<br />
13,972 2,022 29,800 2,150,900 7118%<br />
Finance 13,972 2,022 29,800 20,000 -33%<br />
General Operations 0 0 0 2,130,900 0%<br />
Total 13,972 2,022 29,800 2,150,900 7118%<br />
Revenues<br />
By fund source<br />
Charges for Svcs/Oth 258,570 23,746 11,600 27,400 136%<br />
Total 258,570 23,746 11,600 27,400 136%
Public Works Development Fee Fund<br />
Description<br />
The public works development fee fund is established to account for the inflow <strong>of</strong> public works<br />
development fees levied on new residential and commercial construction. This fee can only be used for<br />
the purchase, construction, financing, and furnishing <strong>of</strong> new capital or one-time items directly related to<br />
the increased demand on public works services caused by growth. Development fees cannot be used to<br />
subsidize operational needs.<br />
Revenues are based upon an estimated issuance <strong>of</strong> 250 single family residential permits and the<br />
estimated square feet <strong>of</strong> 217,800 non-single family residential permits in FY2013. On April 26, 2011<br />
Senate Bill 1525 was signed into law and changed the method the city used to calculate development<br />
impact fees. Arizona Revised Statutes §9-463.05.K requires municipalities planning to continue assessing<br />
development impact fees complete an interim study effective January 1, 2012 and an updated<br />
development impact fee study effective August 1, 2014. The city has revised fees based on the interim<br />
study and plans on meeting the requirements <strong>of</strong> the August, 2014 deadline. The public works<br />
development fee for single family residential permits was revised from $998 to $109 as <strong>of</strong> January 1,<br />
2012.<br />
Major <strong>Budget</strong> Changes<br />
With minimal forecasted development revenue for the funds, the only programed expenditures are for the<br />
impact fee study and purchase <strong>of</strong> sanitation and recycle containers for new solid waste customers. Fund<br />
balance and remaining available revenue is programmed as contingency at $9,734,700. The city will<br />
continue to review and evaluate potential projects through the preparation <strong>of</strong> the Infrastructure<br />
Improvement Plan (IIP) for the impact fee study update.<br />
FY2011 FY2012 FY2013 <strong>FY2014</strong> Amended to<br />
Expenditures<br />
By category<br />
Personnel<br />
Actual Actual Amended <strong>Budget</strong> <strong>Budget</strong><br />
Supplies 15,668 18,391 20,000 64,000 220%<br />
Services 26,076 44,863 41,000 20,000 -51%<br />
Capital 238,881 273,087 587,600 0 -100%<br />
Contingency 0 0 8,500 9,734,700 114426%<br />
Total<br />
By department<br />
280,625 336,341 657,100 9,818,700 1394%<br />
Finance 13,861 782 28,500 20,000 -30%<br />
Public Works 266,764 335,559 628,600 9,798,700 1459%<br />
Total 280,625 336,341 657,100 9,818,700 1394%<br />
Revenues<br />
By fund source<br />
Charges for Svcs/Oth 583,670 191,018 90,100 255,100 183%<br />
Transfer In 0 0 0 0 0%<br />
Total 583,670 191,018 90,100 255,100 183%<br />
224
Debt Service Funds<br />
Description<br />
Municipal property corporation (MPC) debt service funds:<br />
The MPC governmental debt service 2000-03 fund, MPC proprietary debt service 2000-03 fund and MPC<br />
proprietary debt service 2007 fund were established to account for projects funded through the proceeds<br />
<strong>of</strong> the municipal property corporation (MPC) bond sales <strong>of</strong> 2000, 2003 (2000 refunding), and 2007. Bond<br />
proceeds are to be used for the acquisition or construction <strong>of</strong> capital assets for general government,<br />
public safety facilities, sewer facilities, and recreation facilities.<br />
Debt service funds have been created for each municipal property corporation issue. The charts below<br />
summarize each fund.<br />
MPC Governmental Debt Service 2000-03 Fund<br />
<strong>FY2014</strong> FY2015 FY2016 FY2017 FY2018<br />
Beginning Cash Balance $ 2,825,823 $ 2,837,323 $ 2,856,623 $ 2,868,523 $ 2,876,423<br />
Sources<br />
Rental payments $ 3,364,300 $ 3,364,300 $ 3,364,300 $ 3,364,300 $ 3,364,300<br />
Interest Earnings 10,200 10,500 10,800 11,100 11,400<br />
Total Sources $ 3,374,500 $ 3,374,800 $ 3,375,100 $ 3,375,400 $ 3,375,700<br />
Uses<br />
Agency fees<br />
Debt:<br />
$ (1,800) $ (1,800) $ (1,800) $ (1,800) $ (1,800)<br />
MPC Payment (3,361,200) (3,353,700) (3,361,400) (3,365,700) (3,366,600)<br />
Total Uses $ (3,363,000) $ (3,355,500) $ (3,363,200) $ (3,367,500) $ (3,368,400)<br />
Ending Cash Balance $ 2,837,323 $ 2,856,623 $ 2,868,523 $ 2,876,423 $ 2,883,723<br />
MPC Proprietary Debt Service 2000-03 Fund<br />
<strong>FY2014</strong> FY2015 FY2016 FY2017 FY2018<br />
Beginning Cash Balance $ 1,226,112 $ 1,231,712 $ 1,240,712 $ 1,246,612 $ 1,250,812<br />
Sources<br />
Rental payments $ 1,459,000 $ 1,459,000 $ 1,459,000 $ 1,459,000 $ 1,459,000<br />
Interest Earnings 5,100 5,300 5,500 5,700 5,900<br />
Total Sources $ 1,464,100 $ 1,464,300 $ 1,464,500 $ 1,464,700 $ 1,464,900<br />
Uses<br />
Agency fees<br />
Debt:<br />
$ (800) $ (800) $ (800) $ (800) $ (800)<br />
MPC Payment (1,457,700) (1,454,500) (1,457,800) (1,459,700) (1,460,100)<br />
Total Uses $ (1,458,500) $ (1,455,300) $ (1,458,600) $ (1,460,500) $ (1,460,900)<br />
Ending Cash Balance $ 1,231,712 $ 1,240,712 $ 1,246,612 $ 1,250,812 $ 1,254,812<br />
225
MPC Proprietary Debt Service 2007 Fund<br />
<strong>FY2014</strong> FY2015 FY2016 FY2017 FY2017<br />
Beginning Cash Balance $ 1,077,434 $ 1,077,634 $ 1,077,834 $ 1,078,034 $ 1,078,234<br />
Sources<br />
Rental payments $ 7,068,700 $ 2,203,000 $ 2,203,000 $ 8,703,000 $ 1,910,500<br />
Interest Earnings 200 200 200<br />
200<br />
200<br />
Total Sources $ 7,068,900 $ 2,203,200 $ 2,203,200 $ 8,703,200 $ 1,910,700<br />
Uses<br />
Agency fees<br />
Debt:<br />
$ (4,000) $ (4,000) $ (4,000) $ (4,000) $ (4,000)<br />
MPC Payment (7,064,700) (2,199,000) (2,199,000) (8,699,000) (1,906,500)<br />
Total Uses $ (7,068,700) $ (2,203,000) $ (2,203,000) $ (8,703,000) $ (1,910,500)<br />
Ending Cash Balance $ 1,077,634 $ 1,077,834 $ 1,078,034 $ 1,078,234 $ 1,078,434<br />
226
Water System and Replenishment<br />
Development Fee Funds<br />
Description<br />
The water system and replenishment development fee funds are established to account for the inflow <strong>of</strong><br />
water system and replenishment development fees levied on new construction. This fee can only be used<br />
for the purchase, construction, financing, and furnishing <strong>of</strong> new items directly related to the increased<br />
demand on the water system caused by growth. Development fees cannot be used to subsidize<br />
operational needs.<br />
Revenues are based upon an estimated issuance <strong>of</strong> single family residential permits and the estimated<br />
square feet <strong>of</strong> non-single family residential permits in FY2013. On April 26, 2011 Senate Bill 1525 was<br />
signed into law and changed the method the city used to calculate development impact fees. Arizona<br />
Revised Statutes §9-463.05.K requires municipalities planning to continue assessing development impact<br />
fees complete an interim study effective January 1, 2012 and an updated development impact fee study<br />
effective August 1, 2014. The city has revised fees based on the interim study and plans on meeting the<br />
requirements <strong>of</strong> the August, 2014 deadline. The water system development fee that was established July<br />
1, 2007, remains unchanged at $3,895 for drinking water and $3,923 for dual water per single family<br />
residential permit. The water replenishment system development fee that was established July 1, 2007,<br />
remains unchanged at $2,100 in Special Planning Area (SPA) 1 per single family residential permit and<br />
$796 in Special Planning Area (SPA) 2-6 per single family residential permit.<br />
Major <strong>Budget</strong> Changes<br />
The expenditures are primarily for capital projects that include CAP water allocation, Mountain Vista<br />
Ranch well #2, Desert Oasis WSF arsenic treatment, Greenway Road improvments – reclaimed line, SPA<br />
1 effluent storage reservoir covers, and developer reimbursements. Fund balance and remaining<br />
available revenue is programmed as contingency at $3,122,300. The city will continue to review and<br />
evaluate potential projects through the preparation <strong>of</strong> the Infrastructure Improvement Plan (IIP) for the<br />
impact fee study update.<br />
FY2011 FY2012 FY2013 <strong>FY2014</strong> Amended to<br />
Expenditures<br />
By category<br />
Actual Actual Amended <strong>Budget</strong> <strong>Budget</strong><br />
Services 27,722 17,634 90,800 716,900 690%<br />
Capital -518,188 575,387 1,240,500 5,091,000 310%<br />
Contingency 0 0 18,000 3,122,300 17246%<br />
Debt Service 1550.9 26,274 1,300,000 0 -100%<br />
Transfer Out 800,363 7,280 0 0 0%<br />
Development Agreements 103,002 268,406 0 450,000 0%<br />
Total<br />
By department<br />
414,450 894,982 2,649,300 9,380,200 254%<br />
Community Development 0 0 0 450,000 0%<br />
Finance 27,722 4,043 58,800 40,800 -31%<br />
Not Used <strong>City</strong> <strong>of</strong> <strong>Surprise</strong> 107,589 0 0 0 0%<br />
Public Works 279,138 890,939 2,590,500 8,889,400 243%<br />
Total 414,450 894,982 2,649,300 9,380,200 254%<br />
Revenues<br />
By fund source<br />
Charges for Svcs/Oth 573,647 738,758 438,300 1,700,700 288%<br />
Transfer In 0 0 0 0 0%<br />
Total 573,647 738,758 438,300 1,700,700 288%<br />
227
Wastewater System<br />
Development Fee Funds<br />
Description<br />
The wastewater system development fee funds are established to account for the inflow <strong>of</strong> wastewater<br />
service development fees levied on new residential, commercial, and industrial development. This fee can<br />
only be used for the purchase, construction, financing, and furnishing <strong>of</strong> new items directly related to the<br />
increased demand on wastewater services caused by growth. Development fees cannot be used to<br />
subsidize operational needs. The city provides these services to the entire city.<br />
Revenues are based upon an estimated issuance <strong>of</strong> single family residential permits and the estimated<br />
square feet <strong>of</strong> non-single family residential permits in FY2013. On April 26, 2011 Senate Bill 1525 was<br />
signed into law and changed the method the city used to calculate development impact fees. Arizona<br />
Revised Statutes §9-463.05.K requires municipalities planning to continue assessing development impact<br />
fees complete an interim study effective January 1, 2012 and an updated development impact fee study<br />
effective August 1, 2014. The city has revised fees based on the interim study and plans on meeting the<br />
requirements <strong>of</strong> the August, 2014 deadline. The wastewater system development fees that were<br />
established July 1, 2007, remain unchanged at $3,853 in Special Planning Area (SPA) 1 per single family<br />
residential permit and at $3,039 in Special Planning Area (SPA) 2-6 per single family residential permit.<br />
Major <strong>Budget</strong> Changes<br />
The expenditures are for the Greenway Road improvements-wastewater line capital project, rental<br />
payments, and developer reimbursements, and debt service. Fund balance and remaining available<br />
revenue is programmed as contingency at $273,000. The city will continue to review and evaluate<br />
potential projects through the preparation <strong>of</strong> the Infrastructure Improvement Plan (IIP) for the impact fee<br />
study update.<br />
FY2011 FY2012 FY2013 <strong>FY2014</strong> Amended to<br />
Expenditures<br />
By category<br />
Actual Actual Amended <strong>Budget</strong> <strong>Budget</strong><br />
Supplies 0 0 0 0 0%<br />
Services 13,861 8,948 170,400 20,400 -88%<br />
Capital 0 4,531 0 1,025,000 0%<br />
Debt Service 37,551 0 1,071,500 0 -100%<br />
Contingency 0 0 9,000 273,000 2933%<br />
Transfer Out 6,485,532 3,861,431 3856700 8,530,500 121%<br />
Development Agreements 3,156 0 0 0 0%<br />
Total<br />
By department<br />
6,540,100 3,874,911 5,107,600 9,848,900 93%<br />
Finance 13,861 2,022 29,400 20,400 -31%<br />
General Operations 0 0 0 0 0%<br />
Public Works 6,526,239 3,872,889 5,078,200 9,803,500 93%<br />
Community Development 0 0 0 25,000 0%<br />
Total 6,540,100 3,874,911 5,107,600 9,848,900 93%<br />
Revenues<br />
By fund source<br />
Charges for Svcs/Oth 4,219,212 2,017,507 1,051,800 2,356,100 124%<br />
Transfer In 0 0 0 0 0%<br />
Total 4,219,212 2,017,507 1,051,800 2,356,100 124%<br />
228
Appendix<br />
<strong>Budget</strong> Transfer Policies and Procedures<br />
Comprehensive Financial Management Policies FY2013<br />
Glossary<br />
State Forms
<strong>Budget</strong> Transfer Policies<br />
and Procedures<br />
A. Purpose<br />
The following policy and procedures are established to implement a consistent and efficient process by<br />
which the adopted city budget may be amended.<br />
B. Policy<br />
Throughout the course <strong>of</strong> the fiscal year, amendments to the budget are necessary to address new<br />
issues, increased prices, and changes in scope <strong>of</strong> existing projects. This policy applies to all budget<br />
amendments initiated by the Mayor and <strong>City</strong> Council, the <strong>City</strong> Manager’s Office, and/or departments. The<br />
Finance Department will process budget amendments in the financial management system, following<br />
appropriate authorization by the Mayor and <strong>City</strong> Council, the <strong>City</strong> Manager, or a Department Director.<br />
Adopted Level <strong>of</strong> <strong>Budget</strong>ary Control<br />
The budget is appropriated by department in the general fund. All other funds are appropriated in total;<br />
and the Capital Improvement Plan (CIP) is appropriated by project.<br />
C. Procedure<br />
1. The requesting department shall prepare and submit to the <strong>Budget</strong> Manager with a copy to the<br />
respective budget liaison in the Finance Department:<br />
a. The <strong>Budget</strong> Amendment Request form (must include the department director signature)<br />
including the description/background, budget amendment type, Council action information,<br />
and financial impact statement,<br />
b. The draft <strong>Budget</strong> Amendment Resolution, and<br />
c. The <strong>Budget</strong> Amendment Entry form.<br />
2. The budget liaison shall review the request for availability <strong>of</strong> budget to be amended, appropriate<br />
authorization level, accuracy, and general reasonableness. The budget liaison shall communicate<br />
any questions or comments to the department and recommend revisions as necessary. The<br />
budget liaison shall then advance the request to the <strong>Budget</strong> Manager if approved.<br />
3. The <strong>Budget</strong> Manager shall review and approve the request by signing the <strong>Budget</strong> Amendment<br />
Request form. The form shall then be advanced for the next approval as appropriate.<br />
a. Requests requiring Chief Financial Officer approval shall be reviewed and approved by<br />
signing the <strong>Budget</strong> Amendment Request and returning to the <strong>Budget</strong> Manager.<br />
b. Requests requiring <strong>City</strong> Manager approval shall be reviewed and approved by signing the<br />
<strong>Budget</strong> Amendment Request form and returning such form to Finance.<br />
c. Amendments requiring Mayor and <strong>City</strong> Council approval shall be returned to the submitting<br />
department to initiate a Request for Legal Services and <strong>City</strong> Council agenda item.<br />
4. Upon approval <strong>of</strong> the budget amendment request, the Finance Department shall execute the<br />
amendment in the financial management system and notify the requesting department <strong>of</strong><br />
completion.<br />
229
D. Authorization Levels:<br />
Type <strong>of</strong> Amendment Category Sub-Category Authorization<br />
Between Funds All All<br />
Between Departments<br />
(in general fund)<br />
Grants<br />
All All<br />
Revenue<br />
Expense<br />
Personnel Full Time Personnel<br />
Commodities/Supplies<br />
Contractual Services<br />
Capital<br />
Within a Department<br />
Establishment <strong>of</strong> a grant<br />
budget<br />
Mayor and <strong>City</strong><br />
Council<br />
Mayor and <strong>City</strong><br />
Council<br />
Mayor and <strong>City</strong><br />
Council<br />
Between divisions Department Director<br />
Between part time and<br />
full time<br />
(no change in total FTE)<br />
To/from any other category<br />
(Change in total FTE)<br />
Between divisions or<br />
within a division<br />
<strong>City</strong> Manager<br />
Mayor and <strong>City</strong><br />
Council<br />
Department Director<br />
Non-CIP or minor CIP Between divisions <strong>City</strong> Manager<br />
Major CIP<br />
(including change in total<br />
amount and/or change in<br />
scope)<br />
Contingency All All<br />
All<br />
Mayor and <strong>City</strong><br />
Council<br />
Mayor and <strong>City</strong><br />
Council<br />
Targeted Savings All All Chief Financial Officer<br />
E. Relationship to Previously Established Policy<br />
No qualifying statement, previously established rules or procedures shall be used to negate the spirit<br />
or intent <strong>of</strong> this statement <strong>of</strong> policy.<br />
230
Introduction<br />
<strong>City</strong> <strong>of</strong> <strong>Surprise</strong>, Arizona<br />
Comprehensive Financial Management Policies<br />
FY 2013<br />
The <strong>City</strong> Council’s Strategic Plan Framework, goals and objectives provide the foundation for the<br />
comprehensive financial management policies. The <strong>City</strong>’s comprehensive financial policies<br />
provide the roadmap to achieve financial resiliency and demonstrate the <strong>City</strong>’s commitment to<br />
sound financial management practices. As defined by the Government Finance Officers <strong>of</strong><br />
America (GFOA), the <strong>City</strong> Council strives to build a financially resilient government through<br />
financial policies and long-term financial planning. The GFOA has identified eight characteristics<br />
<strong>of</strong> a financially resilient government:<br />
1. Diversity. Avoid reliance on a single solution.<br />
2. Redundancy: Avoid having only one path <strong>of</strong> rescue.<br />
3. Decentralization: Centralized systems look strong, but failure is catastrophic.<br />
4. Transparency: Make it easier to figure out where a problem may lie. Share plans and<br />
listen when people point out flaws.<br />
5. Collaboration: Working together to become stronger.<br />
6. Fail Gracefully: Failure happens. Make sure failure won’t make things worse.<br />
7. Flexibility: Be ready to change when plans aren’t working. Don’t expect stability.<br />
8. Foresight. Think and prepare.<br />
Financial policies contribute to increased public confidence and trust as well as provide clear<br />
direction to <strong>City</strong> staff concerning the diligence and stewardship with which public monies are to be<br />
managed. Adopted financial policies show our citizens, the credit rating industry, and prospective<br />
investors (bond buyers) the <strong>City</strong>’s commitment to financial resiliency. These policies are<br />
presented in the following five areas:<br />
1. Operating Management<br />
2. Capital Management<br />
3. Debt Management<br />
4. Minimum Fund Balance<br />
5. Financial Reporting<br />
Operating Management Policies<br />
1. All departments will participate in the responsibility <strong>of</strong> meeting policy goals and ensuring<br />
long-term financial resiliency.<br />
2. The budget shall be considered balanced if revenues plus use <strong>of</strong> fund balance are equal<br />
to or exceed total expenses, by fund. The budget process is intended to weigh all<br />
competing requests for <strong>City</strong> resources, within expected fiscal constraints.<br />
3. Long-range financial plans will be prepared to guide the <strong>City</strong> and ensure the delivery <strong>of</strong><br />
needed services due to changes in the economy, service demands, and capital<br />
improvements.<br />
4. Regional considerations and intergovernmental relationships will be evaluated to fund<br />
both operating services and capital projects.<br />
5. The <strong>City</strong> Council will consider citizen input and review the operating and capital budget<br />
recommendations from an outcome and goals perspective.<br />
6. A diversified revenue system will be developed to protect <strong>City</strong> services.<br />
231<br />
1
7. The <strong>City</strong> Council will set the amount to be received from primary property taxes annually.<br />
The amount is limited to 102% <strong>of</strong> the prior fiscal year’s maximum allowable levy plus new<br />
construction and reimbursement for the prior calendar year’s tort liability payments.<br />
8. To ensure that the <strong>City</strong> does not become overly reliant on “growth” revenues for<br />
operating needs, the first $1.25 million received in construction sales tax revenues will be<br />
retained in the General Fund and any additional amount will be transferred to the General<br />
Capital Projects Fund for one-time capital project use (related to Capital Management<br />
policy #23).<br />
9. The <strong>City</strong> currently imposes a 2.52% transient lodging tax. Of the total tax, 1.52% is to be<br />
recorded in the Tourism Fund to be used for promoting tourism and 1.0% is to be<br />
recorded in the General Fund. Of the 1.52% recorded in the Tourism Fund, 0.52% is<br />
restricted by A.R.S. 9-500.06 and 1.0% has been committed by <strong>City</strong> Council to be used<br />
for promoting tourism. Of the amount recorded in the Tourism Fund the Tourism<br />
Advisory Board has designated that 60% is spent for special events and 40% is spent for<br />
marketing, planning and capital.<br />
10. Water, Wastewater, and Solid Waste user fees and charges will be examined annually to<br />
ensure they recover all direct and indirect costs <strong>of</strong> service and will be approved by the<br />
<strong>City</strong> Council.<br />
11. All user fees (excluding water, wastewater, and solid waste) will be examined periodically<br />
to determine the direct and indirect cost <strong>of</strong> service recovery rate. The acceptable<br />
recovery rate and any associated changes to user fees and charges will be approved by<br />
the <strong>City</strong> Council.<br />
12. Grant funding will be considered to leverage <strong>City</strong> funds and requires <strong>City</strong> Council<br />
approval prior to acceptance. In situations where the timing does not permit <strong>City</strong> Council<br />
approval prior to acceptance, the grant funding will be approved by the <strong>City</strong> Manager.<br />
13. Cash and investment programs will be maintained in accordance with the State law and<br />
the adopted investment policy and will ensure that proper controls and safeguards are<br />
maintained. <strong>City</strong> funds will be managed with an emphasis on safety <strong>of</strong> principal, liquidity,<br />
and financial return on principal, in that order.<br />
14. Employee compensation and benefits will be administered in accordance with the policy<br />
given by the <strong>City</strong> Council. Healthcare costs will be shared between the <strong>City</strong> and<br />
employees and this allocation will be evaluated annually.<br />
15. The <strong>City</strong> will optimize the efficiency and effectiveness <strong>of</strong> its services to reduce costs and<br />
improve service quality.<br />
16. The <strong>City</strong> will maintain a methodology for allocating the <strong>City</strong>’s indirect costs to service<br />
departments. A consultant will be hired to update the plan during FY 2013.<br />
17. All cash transfers between funds must be approved by <strong>City</strong> Council (excluding those<br />
related capital assets).<br />
18. All interfund loans must be approved by <strong>City</strong> Council.<br />
19. All use <strong>of</strong> budgetary contingency accounts must be approved by <strong>City</strong> Council prior to<br />
being expended.<br />
232<br />
2
Capital Management Policies<br />
20. The <strong>City</strong> shall use an integrated approach to capital planning and financing in preparing a<br />
five-year Capital Improvement Plan. Only the first year <strong>of</strong> the plan will be adopted by the<br />
<strong>City</strong> Council.<br />
21. The Capital Improvement Plan will include funding to support repair and replacement <strong>of</strong><br />
capital equipment and infrastructure. A high priority should be placed on those items<br />
where deferring maintenance will result in greater cost to restore or replace.<br />
22. Proposed capital projects will be prioritized based on the <strong>City</strong> Council’s goals and<br />
objectives, the General Plan, and master plans.<br />
23. Future operating, maintenance and replacement costs associated with new capital<br />
improvements will be included as a schedule within the annual budget document. Capital<br />
project contract awards will include a fiscal impact statement disclosing the expected<br />
operating impact <strong>of</strong> the project and when such cost is expected to occur.<br />
24. The annual amount in excess <strong>of</strong> $1.25 million received from the <strong>City</strong>’s construction sales<br />
tax will be transferred to the General Capital Projects Fund and used to fund the Capital<br />
Improvement Plan (related to Operational Policy #8).<br />
25. Effective July 1, 2005, the <strong>City</strong> implemented a dedicated 1.5% construction sales tax to<br />
be used solely for the purposes <strong>of</strong> paying costs related to new roadways and to refurbish<br />
existing transportation corridors.<br />
26. As permitted by State law, the <strong>City</strong> shall maintain a financial structure to ensure future<br />
development pays for itself and is not a burden on existing residents (e.g. “growth pays<br />
for growth”). Elements <strong>of</strong> this financial structure include impact fees, development<br />
agreements, Improvement Districts (IDs) and Community Facility Districts (CFDs).<br />
27. Impact fees for infrastructure attributable to new development will be reviewed at least<br />
every other year to ensure that fees recover all direct and indirect development-related<br />
expenses, as permitted by state law and will be approved by the <strong>City</strong> Council. The <strong>City</strong> is<br />
currently preparing for the requirements <strong>of</strong> the new State impact fee law and will be in<br />
compliance by its effective date, August 1, 2014.<br />
Debt Management Policies<br />
28. The <strong>City</strong> will seek to maintain and, if possible, improve our current bond rating in order to<br />
minimize borrowing costs and preserve access to credit.<br />
29. An analysis showing how a new debt issue combined with current outstanding debt<br />
impacts the <strong>City</strong>’s debt capacity and conformance with <strong>City</strong> debt policies will accompany<br />
every proposal.<br />
30. General Obligation debt, which is supported by property tax revenues, will be utilized as<br />
authorized by voters. Other types <strong>of</strong> voter-approved debt (e.g. water and wastewater)<br />
may also be utilized when they are supported by dedicated revenue sources (e.g. fees<br />
and user charges).<br />
31. Municipal Property Corporation, trust agreements and contractual debt, all <strong>of</strong> which are<br />
non-voter approved, will be utilized only when approved by <strong>City</strong> Council.<br />
32. Improvement District (ID) and Community Facility District (CFD) bonds shall be permitted<br />
only when there is a general <strong>City</strong> benefit as defined and approved by the <strong>City</strong> Council.<br />
33. Utility rates will be established to ensure the ratio <strong>of</strong> revenue to debt service meets bond<br />
indenture requirements.<br />
233<br />
3
Minimum Fund Balance Policies<br />
34. Minimum fund balances are not intended to be spent. The purpose <strong>of</strong> the minimum fund<br />
balance is to ensure the <strong>City</strong> has adequate resources to meet its needs. If the necessity<br />
arises to draw down a fund balance below the minimum requirements that have been set,<br />
a plan to replenish the minimum fund balance will be presented to the Council for<br />
approval.<br />
35. Minimum fund balance requirements will be evaluated annually for long-term adequacy<br />
and use requirements.<br />
36. There is no affect on the presentation <strong>of</strong> fund balance on the fact <strong>of</strong> the financial<br />
statements within the Comprehensive Annual Financial Report (CAFR). The minimum<br />
fund balance policy will be disclosed within the notes <strong>of</strong> the CAFR.<br />
37. The <strong>City</strong> has formally adopted a minimum fund balance policy for the following<br />
governmental funds:<br />
a. The minimum fund balance in the General Fund is updated annually by calculating an<br />
average <strong>of</strong> budgeted personnel, supplies and services expenses over a two month period<br />
for the operating budget (approximately $13M).<br />
b. General Capital Projects Fund <strong>of</strong> $1.0M<br />
c. Transportation Capital Improvement Fund <strong>of</strong> $0.5M<br />
d. Street Light Improvement Districts (SLIDs). SLIDs have a maximum levy limit <strong>of</strong> $1.20<br />
per $100 <strong>of</strong> assessed valuation in accordance with A.R.S. 48-616. To the extent that the<br />
levy limit has not been exceeded, taxes will be levied at a rate that will approach an<br />
individual ending fund balance reserve <strong>of</strong> 10% <strong>of</strong> its budgeted annual expenses.<br />
e. Tourism Fund <strong>of</strong> $5,000.<br />
38. The <strong>City</strong> intends to maintain the following net asset balances for the proprietary funds.<br />
a. Within the Water, Sewer, and Solid Waste Funds, net assets are to be<br />
maintained at an amount equal to the average budgeted personnel, supplies and<br />
services expenses over a two month period. An additional amount will be kept<br />
for repair and replacement and will be maintained at a minimum <strong>of</strong> 2% <strong>of</strong> all<br />
tangible capital assets <strong>of</strong> the system.<br />
b. The Risk Management Fund will maintain net assets at an amount that, together<br />
with purchased insurance policies, will adequately indemnify the <strong>City</strong>. An<br />
actuarial evaluation will be performed annually to recommend appropriate<br />
funding levels, which will be approved by the <strong>City</strong> Council.<br />
c. The Healthcare Self-Insurance Trust Fund was created under the authority <strong>of</strong><br />
Arizona Revised Statute Section 11-981. The Board <strong>of</strong> Trustees is charged with<br />
administering the trust fund and “make recommendations to the <strong>City</strong> Council<br />
regarding trust fund programs, including amount <strong>of</strong> appropriations to assure<br />
stability and security <strong>of</strong> the trust fund.<br />
The Healthcare Self-Insurance Trust Fund will maintain net assets at a level<br />
which, together with purchased insurance policies (individual and aggregate stop<br />
loss), will adequately indemnify the <strong>City</strong>. An actuarial evaluation will be<br />
performed annually to determine the Incurred but Not Reported (IBNR) claim<br />
reserve. This amount is required by accounting practices and represents the<br />
cost <strong>of</strong> unpaid claims (claims run out), assuming the <strong>City</strong> stops being selfinsured.<br />
In addition to the IBNR reserve, the <strong>City</strong> has established an Adverse Times<br />
Reserve. This amount is not required by accounting practices but represents a<br />
sound financial practice. The purpose <strong>of</strong> this reserve is to address cash flow<br />
needs caused by periods in which claim payments exceed projections. The<br />
target amount <strong>of</strong> this reserve is at least ten percent <strong>of</strong> annual claims, or about<br />
$700,000.<br />
234<br />
4
Financial Reporting Policies<br />
39. The <strong>City</strong>’s accounting and financial reporting systems will be maintained in conformance<br />
with all state and federal laws, generally accepted accounting principles (GAAP) and the<br />
standards <strong>of</strong> the Governmental Accounting Standards Board (GASB).<br />
40. An annual audit will be performed by an independent public accounting firm. The <strong>City</strong> will<br />
prepare a Comprehensive Annual Financial Report (CAFR) with the objective <strong>of</strong> receiving<br />
an unqualified (“clean”) audit opinion. The independent auditor will present and discuss<br />
audit findings regarding internal controls and operational issues at a public meeting.<br />
CAFR Fund Balance Reporting<br />
1. The hierarchy from least spendable to most spendable fund balance for<br />
governmental funds <strong>of</strong> the <strong>City</strong> shall be: nonspendable, restricted,<br />
committed, assigned and unassigned. When funds are available from<br />
multiple classifications <strong>of</strong> fund balance to meet the <strong>City</strong>’s obligations, it is the<br />
<strong>City</strong>’s policy to charge the least spendable fund balance available.<br />
2. Nonspendable and restricted fund balances are determined solely by the<br />
nature <strong>of</strong> the fund balance itself.<br />
3. Committed fund balance represents amounts that have been constrained to<br />
a specific use by the formal action <strong>of</strong> the <strong>City</strong>’s highest level <strong>of</strong> decisionmaking<br />
authority, the <strong>City</strong> Council. A majority vote <strong>of</strong> the <strong>City</strong> Council is<br />
necessary to establish, modify or rescind a fund balance commitment.<br />
4. The <strong>City</strong> has elected the following commitments <strong>of</strong> fund balance to be<br />
standardized from year to year.<br />
a. A commitment for repair and replacement <strong>of</strong> general government<br />
vehicles and other rolling stock will be maintained based upon<br />
lifecycle replacement plans prepared annually. This commitment<br />
shall be maintained in the General Capital Projects Fund.<br />
b. A commitment <strong>of</strong> a 1.5% construction sales tax to be used solely for<br />
the purposes <strong>of</strong> paying costs related to new roadways and to<br />
refurbish existing transportation corridors, to be maintained in the<br />
Transportation Improvement Fund (related to Capital Management<br />
policy #24; Ordinance No. 05-13).<br />
c. In addition to the 0.52% transient lodging tax restricted by state<br />
statute a commitment <strong>of</strong> a 1.0% transient lodging tax will be used to<br />
promote tourism and be maintained in the Tourism Fund (related to<br />
Operating Management policy #9; Ordinance No. 2010-04).<br />
5. In order to be reported as committed fund balance in the CAFR the <strong>City</strong><br />
Council must approve the commitments prior to June 30 th . However, the<br />
amount <strong>of</strong> the commitment may be determined after June 30 th .<br />
6. Amounts that have been constrained by the <strong>City</strong>’s intent to be used for a<br />
specific purpose and are neither restricted nor committed are reported as<br />
assigned fund balance. The <strong>City</strong> Council has designated the authority to<br />
assign amounts to be used for specific purposes to the Chief Financial<br />
Officer (CFO).<br />
41. The <strong>City</strong>’s CAFR will be submitted to the Government Finance Officers Association<br />
(GFOA) Certificate <strong>of</strong> Achievement for Excellence in Financial Reporting program.<br />
42. The <strong>City</strong>’s <strong>Budget</strong> will be submitted to the Government Finance Officers Association<br />
(GFOA) Distinguished <strong>Budget</strong> Presentation program.<br />
43. A monthly financial report will be presented to and accepted by the <strong>City</strong> Council.<br />
235<br />
5
Glossary<br />
Accrual Basis A basis <strong>of</strong> accounting in which transactions are recognized at the time they<br />
are incurred, as opposed to when cash is received or spent.<br />
ADA Americans with Disabilities Act - A wide-ranging civil rights law that<br />
prohibits, under certain circumstances, discrimination based on disability.<br />
Disability is defined by the ADA as "a physical or mental impairment that<br />
substantially limits a major life activity."<br />
ADOT Arizona Department <strong>of</strong> Transportation - An Arizona state government<br />
agency charged with facilitating mobility within the state.<br />
Adoption Formal action by the Mayor and Council that sets the spending limits for the<br />
fiscal year.<br />
AOC Administrative Office <strong>of</strong> the Courts - The Arizona Constitution authorizes an<br />
administrative director and staff to assist the Chief Justice with<br />
administrative duties. Under the direction <strong>of</strong> the Chief Justice, the<br />
administrative director and the staff <strong>of</strong> the AOC provide the necessary<br />
support for the supervision and administration <strong>of</strong> all state courts.<br />
Appropriation Specific amount <strong>of</strong> monies authorized by the Mayor and Council for the<br />
purposes <strong>of</strong> incurring obligations and acquiring goods and services.<br />
APS Arizona Public Service – A utility provider <strong>of</strong> retail and wholesale electric<br />
services primarily in the state <strong>of</strong> Arizona.<br />
ARRA American Recovery and Reinvestment Act <strong>of</strong> 2009 - The primary objective<br />
for ARRA was to save and create jobs almost immediately. Secondary<br />
objectives were to provide temporary relief programs for those most<br />
impacted by the recession and invest in infrastructure, education, health,<br />
and ‘green’ energy.<br />
Assessed Valuation A value set upon real property by the County Assessor for the purpose <strong>of</strong><br />
levying property taxes.<br />
Automatic Aid In emergency services, mutual aid (automatic aid) is an agreement among<br />
emergency responders to lend assistance across jurisdictional boundaries.<br />
Resources are dispatched by the nearest fire apparatus, regardless <strong>of</strong><br />
which side <strong>of</strong> the jurisdictional boundary the incident is located.<br />
AVL Automatic Vehicle Locator – A device for automatically determining the<br />
geographic location <strong>of</strong> a vehicle.<br />
AZPDES Arizona Pollution Discharge Elimination System – A permit program for all<br />
facilities that discharge pollutants from any point source into waters <strong>of</strong> the<br />
United States (navigable waters) and requires the facility to obtain or seek<br />
coverage under an AZPDES permit.<br />
AZ TechCelerator A four building, nearly 60,000 square feet campus, serving as a business<br />
incubator. Designed to grow businesses by providing affordable space,<br />
tools and resources.<br />
236
Base <strong>Budget</strong> The ongoing expense for personnel, contractual services, commodities, to<br />
maintain service levels.<br />
Bonds Debt instruments that require repayment <strong>of</strong> a specified principal amount on<br />
a certain date (maturity date), along with interest at a stated rate or<br />
according to a formula for determining the interest rate.<br />
<strong>Budget</strong> Financial plan <strong>of</strong> estimated expenditures and anticipated resources adopted<br />
for a specific period <strong>of</strong> time outlining a plan for achieving Mayor and Council<br />
goals and objectives.<br />
CALEA Commission on Accreditation for Law Enforcement Agencies - The<br />
purpose <strong>of</strong> CALEA’s programs is to improve the delivery <strong>of</strong> public safety<br />
services, primarily by: maintaining a body <strong>of</strong> standards, developed by public<br />
safety practitioners, covering a wide range <strong>of</strong> up-to-date public safety<br />
initiatives; establishing and administering an accreditation process; and<br />
recognizing pr<strong>of</strong>essional excellence.<br />
CAP Central Arizona Project – CAP was designed to bring about 1.5 million<br />
acre-feet <strong>of</strong> Colorado River water per year to Pima, Pinal and Maricopa<br />
counties. CAP carries water from Lake Havasu near Parker to the southern<br />
boundary <strong>of</strong> the San Xavier Indian Reservation southwest <strong>of</strong> Tucson. It is a<br />
336-mile long system <strong>of</strong> aqueducts, tunnels, pumping plants and pipelines<br />
and is the largest single resource <strong>of</strong> renewable water supplies in the state<br />
<strong>of</strong> Arizona.<br />
Capital Items Includes the purchase <strong>of</strong> land, the purchase or construction <strong>of</strong> buildings,<br />
structures, and facilities <strong>of</strong> all types, plus machinery and equipment. It<br />
includes expenditures that result in the acquisition or addition <strong>of</strong> a fixed<br />
asset or increase the capacity, efficiency, span <strong>of</strong> life, or economy <strong>of</strong><br />
operating an existing fixed asset. For an item to qualify as a capital item, it<br />
must meet all <strong>of</strong> the following requirements:(1) have an estimated useful life<br />
<strong>of</strong> greater than two years;(2) typically have a unit cost <strong>of</strong> $10,000 or more;<br />
and (3) be a betterment or improvement.<br />
Capital Projects <strong>Budget</strong> The expenditures <strong>of</strong> revenues for major capital projects and items such as<br />
city buildings, parks, acquisition <strong>of</strong> land, major street construction, and<br />
reconstruction, water and sewer lines, and any other project which adds to<br />
the capital assets or infrastructure <strong>of</strong> the city.<br />
Capital Project Funds These funds account for resources providing for the acquisition or<br />
construction <strong>of</strong> capital facilities and items.<br />
CAFR Comprehensive Annual Financial Report - A CAFR is the financial report <strong>of</strong><br />
a state, municipal or other governmental entity that contains at a minimum,<br />
three sections: introductory, financial, and statistical. Additionally, the<br />
financial section provides information on each individual fund and<br />
component unit.<br />
CAWCD Central Arizona Water Conservation District - The purpose <strong>of</strong> the CAWCD<br />
is to provide a mechanism for landowners and water providers to<br />
demonstrate an assured 100-year water supply.<br />
CCTV Closed-Circuit Television - The use <strong>of</strong> video cameras to transmit a signal to<br />
a specific place, on a limited set <strong>of</strong> monitors.<br />
237
CD-ED Community and Economic Development Department – The department<br />
provides development services, planning and zoning, building safety, code<br />
enforcement, neighborhood services, welcome center, and economic<br />
development. The department is charged with ensuring responsible<br />
planning within the current and future city limits, long-range transportation<br />
planning, and that new and existing structures are safe for occupancy.<br />
CDBG Community Development Block Grant – The grant program is administered<br />
by the U.S. Department <strong>of</strong> Housing and Urban Development and funds<br />
local community development activities such as affordable housing, antipoverty<br />
programs, and infrastructure development.<br />
CDBG-R Community Development Block Grant-Recovery- This is the grant portion <strong>of</strong><br />
the Title XII <strong>of</strong> Division A <strong>of</strong> the American Recovery and Reinvestment Act<br />
<strong>of</strong> 2009 and appropriates $1 billion to carry out the CDBG program under<br />
Title I <strong>of</strong> the Housing and Community Development Act <strong>of</strong> 1974 on an<br />
expedited basis. These funds will be distributed to grantees that received<br />
CDBG funding in Fiscal Year 2008 in accordance with the provisions <strong>of</strong> 42<br />
U.S.C. 5306. The grant program under Title XII is commonly referred to as<br />
the CDBG Recovery (CDBG-R) program.<br />
CDR Community Development and Regulation - The rules and regulations<br />
governing the activities <strong>of</strong> community development programs are broken<br />
down into three categories: the Laws as enacted by Congress, the<br />
Regulations created by HUD to achieve the result prescribed by the Laws,<br />
and the Policy Memoranda that address specific instances and questions.<br />
CFD Community Facility District – A special assessment district established by<br />
the Mayor and Council to levy taxes to pay for new infrastructure<br />
improvements associated with growth.<br />
CIP Capital Improvement Plan – A plan that identifies: (a) all capital<br />
improvements which are proposed to be undertaken during a five fiscal<br />
year period; (b) the cost estimate for each improvement; (c) the method <strong>of</strong><br />
financing each improvement; (d) the recommended time schedule for each<br />
project; and (e) the estimated annual operating and maintenance costs.<br />
CMAQ Congestion Mitigation and Air Quality – The program is a federally funded<br />
program <strong>of</strong> surface transportation improvements designed to improve air<br />
quality and mitigate congestion.<br />
COBRA Consolidated Omnibus <strong>Budget</strong> Reconciliation Act - COBRA gives workers<br />
and their families who lose their health benefits the right to choose to<br />
continue group health benefits provided by their group health plan for<br />
limited periods <strong>of</strong> time under certain circumstances such as voluntary or<br />
involuntary job loss, reduction in the hours worked, transition between jobs,<br />
death, divorce, and other life events.<br />
Contingency Monies which have not been allocated to any specific purpose and may<br />
only be utilized after receiving Mayor and Council approval.<br />
CTCA Cancer Treatment Centers <strong>of</strong> America - CTCA is a private, for-pr<strong>of</strong>it<br />
operator <strong>of</strong> cancer treatment hospitals and outpatient clinics which provide<br />
both conventional and alternative medical treatments.<br />
238
CRS Community and Recreation Services –The department is responsible for<br />
recreational programming, sports tourism events, signature and community<br />
special events, recreational facility operations and ground maintenance <strong>of</strong><br />
city parks.<br />
CWA Clean Water Act – The act establishes the basic structure for regulating<br />
discharges <strong>of</strong> pollutants into the waters <strong>of</strong> the United States and regulating<br />
quality standards for surface waters.<br />
DEA Drug Enforcement Administration – The DEA’s mission is to enforce the<br />
controlled substances laws and regulations <strong>of</strong> the United States and bring<br />
to the criminal and civil justice system <strong>of</strong> the United States, or any other<br />
competent jurisdiction, those organizations and principal members <strong>of</strong><br />
organizations, involved in the growing, manufacture, or distribution <strong>of</strong><br />
controlled substances appearing in or destined for illicit traffic in the United<br />
States; and to recommend and support non-enforcement programs aimed<br />
at reducing the availability <strong>of</strong> illicit controlled substances on the domestic<br />
and international markets.<br />
Debt Service Payment <strong>of</strong> principal, interest, and related service charges on obligations<br />
resulting from the issuance <strong>of</strong> bonds.<br />
Debt Service Funds Funds that are used to account for the accumulation <strong>of</strong> resources and the<br />
payment <strong>of</strong> general long-term debt principal and interest.<br />
DUI Driving Under the Influence – The act <strong>of</strong> a person driving or being in actual<br />
physical control <strong>of</strong> a vehicle while under the influence <strong>of</strong> intoxicating liquor,<br />
any drug, a vapor releasing substance containing a toxic substance or any<br />
combination <strong>of</strong> liquor, drugs or vapor releasing substances if the person is<br />
impaired to the slightest degree.<br />
DVR Digital Vehicle Repeater – DVR is a radio system component that provides<br />
repeater capability between portable subscribers and the RF base station<br />
infrastructure. It extends the portable radio coverage in areas where only<br />
mobile radio coverage is available and portable radio coverage is either<br />
intermittent or nonexistent.<br />
ED7 Electrical District Number Seven- ED7 is an electrical district formed<br />
pursuant to Arizona Revised Statutes for the purpose <strong>of</strong> providing water<br />
and electricity to agricultural, municipal and industrial customers throughout<br />
Arizona.<br />
Emod<br />
Experience modifier rate - EMOD is a premium modifier that reflects the<br />
loss experience <strong>of</strong> a policyholder compared with payroll exposure during<br />
the same time period. The modifier increases or decreases the current<br />
premium depending on how the actual exposure and losses, for the past<br />
three years, compares with expected losses for the same amount <strong>of</strong><br />
exposure.<br />
EMS Emergency Medical Services - Provides basic and advanced life support<br />
services to the community 24 hours a day, seven days a week while<br />
maintaining compliance with the Arizona Department <strong>of</strong> Health Services<br />
mandates with personnel and equipment resources.<br />
239
Encumbrance A reservation <strong>of</strong> funds to cover purchase orders, contracts, or other funding<br />
commitments that are yet to be fulfilled. The budget basis <strong>of</strong> accounting<br />
considers an encumbrance to be the equivalent <strong>of</strong> an expenditure.<br />
Enterprise Fund Funds that are established to account for operations, including debt service<br />
that are financed and operated similarly to private businesses - where the<br />
intent is the service is self-sufficient, with all costs supported predominantly<br />
by user charges.<br />
Estimated Revenue The amount <strong>of</strong> projected revenue to be collected during the fiscal year.<br />
Expenditure Represents a decrease in fund resources for the acquisition <strong>of</strong> goods or<br />
services.<br />
Expenditure Limitation An amendment to the Arizona State Constitution that limits annual<br />
expenditures <strong>of</strong> all municipalities. The Economic Estimates Commission<br />
sets the limit based upon population growth and inflation.<br />
FARE Fines/Fees and Restitution Enforcement – The program is a statewide<br />
initiative <strong>of</strong> the Arizona Judicial branch. The program was developed in<br />
2003 to assist Arizona courts with the compliance <strong>of</strong> monetary court orders.<br />
Courts are given the ability to assign outstanding debt associated to civil<br />
traffic, criminal traffic and criminal violations. The program is a<br />
public/private partnership between the Administrative Office <strong>of</strong> the Courts,<br />
the Motor Vehicle Division, Arizona Department <strong>of</strong> Revenue and a private<br />
vendor.<br />
FFE Furniture, Fixtures, and Equipment – FFE is movable furniture, fixtures or<br />
other equipment that have no permanent connection to the structure <strong>of</strong> a<br />
building.<br />
FMS Financial Management S<strong>of</strong>tware – FMS is an information system used for<br />
collecting, processing, and reporting data about financial events.<br />
FTE Full Time Equivalent – Represents a conversion <strong>of</strong> hours worked to a count<br />
<strong>of</strong> positions. 2,080 hours worked annually equates to 1.0 full time<br />
equivalent position. The 2,080 hours may represent a single individual<br />
working 40 hours per week or the sum <strong>of</strong> two part time employees each<br />
working 20 hours per week.<br />
Fiscal Year Any period <strong>of</strong> twelve consecutive months that establishes the beginning<br />
and the ending <strong>of</strong> financial transactions. For the city <strong>of</strong> <strong>Surprise</strong> this period<br />
begins July 1 and ends June 30.<br />
FMLA Family and Medical Leave Act – FMLA is a United States federal law<br />
requiring covered employers to provide employees job-protected and<br />
unpaid leave for qualified medical and family reasons. Qualified medical<br />
and family reasons include: personal or family illness, family military leave,<br />
pregnancy, adoption, or the foster care placement <strong>of</strong> a child.<br />
FY Fiscal Year<br />
240
Fund A fiscal and accounting entity with a self–balancing set <strong>of</strong> accounts.<br />
Records cash and other financial resources together with all related<br />
liabilities and residual equities or balances and changes therein. These are<br />
segregated for the purpose <strong>of</strong> carrying on specific activities or attaining<br />
certain objectives in accordance with special regulations, restrictions, or<br />
limitations.<br />
Fund Balance As used in the budget, the excess <strong>of</strong> resources over expenditures. The<br />
beginning fund balance is residual funds brought forward from the previous<br />
fiscal year.<br />
GAAP Generally Accepted Accounting Principles - A collection <strong>of</strong> rules,<br />
procedures, and conventions that define accepted accounting practice;<br />
includes broad guidelines as well as detailed procedures.<br />
General Fund Primary operating fund <strong>of</strong> the <strong>City</strong>. It exists to account for the resources<br />
devoted to finance the services traditionally associated with local<br />
government. Included in these services are police and fire protection, parks<br />
and recreation, community and economic development, general<br />
administration <strong>of</strong> the <strong>City</strong>, and any other activity for which a special fund<br />
has not been created.<br />
GFOA Government Finance Officers Association - The purpose <strong>of</strong> the Government<br />
Finance Officers Association is to enhance and promote the pr<strong>of</strong>essional<br />
management <strong>of</strong> governments for the public benefit by identifying and<br />
developing financial policies and practices and promoting them through<br />
education, training, and leadership.<br />
GIS Geographic Information Systems - is a system <strong>of</strong> hardware and s<strong>of</strong>tware<br />
used for storage, retrieval, mapping, and analysis <strong>of</strong> geographic data.<br />
GL General Ledger – The central repository <strong>of</strong> the accounting information in<br />
which the summaries <strong>of</strong> all financial transactions are recorded. The<br />
repository tracks assets, liabilities, revenues, and expenditures.<br />
G.O. Bond General Obligation Bond - A bond that requires voter approval and finance<br />
a variety <strong>of</strong> public capital projects. The bond is backed by the “full faith and<br />
credit” <strong>of</strong> the issuing government.<br />
Goal A statement <strong>of</strong> broad direction, purpose, or intent on the needs <strong>of</strong> the<br />
community. A goal is general and timeless.<br />
GPM Gallons Per Minute - A unit <strong>of</strong> measurement that indicates the flow<br />
capabilities <strong>of</strong> a hydraulic component.<br />
Grant A contribution by the state or federal government or other organization to<br />
support a particular function.<br />
HOA Homeowners Association –A common interest organization to which all the<br />
owners <strong>of</strong> lots in a planned community or owners <strong>of</strong> units in a condominium<br />
must belong. The defining characteristics <strong>of</strong> all HOAs are all owners are<br />
automatically members, governing documents create mutual obligations,<br />
mandatory fees or assessments are generally levied against owners and<br />
used for the operation <strong>of</strong> the association, and owners share a property<br />
interest in the community.<br />
241
HR Human Resources – HR is the department that provides service and<br />
support to city departments in recruitment and selection, compensation and<br />
benefits, employee and organizational development, and employee<br />
relations.<br />
HVAC Heating, Ventilation And Cooling – The systems control the ambient<br />
environment (temperature, humidity, air flow, and air filtering)<br />
HURF Highway Users Revenue Fund - This revenue source consists <strong>of</strong> state<br />
taxes collected on gasoline, vehicle licenses, and a number <strong>of</strong> other<br />
additional transportation related fees. These funds must be used for street<br />
and highway purposes.<br />
ICMA CPM International <strong>City</strong>/County Management Association, Center for Performance<br />
Measurement - A results-oriented system that allows local governments to:<br />
1) set appropriate targets and assess whether they are being met, 2)<br />
distinguish success from failure, 3) highlight accomplishments, and 4)<br />
demonstrate results to win support.<br />
IDDE Illicit Discharge Detection Elimination – The process to locate and resolve<br />
instances <strong>of</strong> discharges into a municipal separate storm sewer that are not<br />
composed entirely <strong>of</strong> stormwater.<br />
Infrastructure The large-scale public systems, services, and facilities that are necessary<br />
for economic activity, including water supplies, sewers, public buildings,<br />
parks, and roads.<br />
IGA Intergovernmental Agreement – A contract between governmental entities<br />
as authorized by State law.<br />
Intergovernmental<br />
Revenue (Shared)<br />
The funds received from federal, state and other local government sources<br />
in the form <strong>of</strong> grants, shared revenue, and payments in lieu <strong>of</strong> taxes. (e.g.,<br />
state sales tax, state income tax, gasoline tax, motor vehicle license)<br />
Internal Service Funds Established to account for the financing <strong>of</strong> goods or services provided by<br />
one department or agency to other departments or agencies <strong>of</strong> a<br />
government, on a cost-reimbursement basis.<br />
IS Information Systems – Any combination <strong>of</strong> information technology and<br />
people's activities that support operations, management and decision<br />
making.<br />
ISO Insurance Services Office - ISO collects information on municipal fireprotection<br />
efforts in communities throughout the United States. In each <strong>of</strong><br />
those communities, ISO analyzes the relevant data using our Fire<br />
Suppression Rating Schedule. ISO then assigns a Public Protection<br />
Classification from 1 to 10. Class 1 generally represents superior property<br />
fire protection, and Class 10 indicates that the area's fire-suppression<br />
program doesn't meet ISO’s minimum criteria.<br />
IT Information Technology - The use <strong>of</strong> computers and telecommunications<br />
equipment to store, retrieve, transmit and manipulate data.<br />
242
ITS Intelligent Transportation System – ITS is the application <strong>of</strong> advanced<br />
sensor, computer, electronics, and communication technologies and<br />
management strategies to improve the safety and efficiency <strong>of</strong> the surface<br />
transportation.<br />
LAN Local Area Network – A computer network that interconnects computers in<br />
a limited area.<br />
LIS Land Information System - A system that designed specifically to create,<br />
visualize, analyze, report and publish land-based data such as parcel<br />
information, zoning, land use, ownership and general property information.<br />
Long Term Debt Debt with a maturity <strong>of</strong> more than one year after the date <strong>of</strong> issuance.<br />
LTAF Local Transportation Assistance Fund—State lottery funds shared with<br />
cities for the purposes <strong>of</strong> transportation and transit. Also included in this<br />
funding source is LTAF II which are grants distributed to cities when and if<br />
all other funding requirements <strong>of</strong> state lottery funds are met.<br />
MAG Maricopa Association <strong>of</strong> Governments - An association <strong>of</strong> governments<br />
that represents the bulk <strong>of</strong> the metropolitan area <strong>of</strong> Phoenix, Arizona and<br />
is responsible for developing policy in the areas <strong>of</strong> regional development<br />
and transportation, air and water quality, and human services.<br />
Maint Maintenance – The purpose <strong>of</strong> maintaining equipment and facilities in<br />
satisfactory operating condition by providing for systematic inspection,<br />
detection, and correction <strong>of</strong> incipient failures either before they occur or<br />
before they develop into major defects.<br />
Management Indicators A measurable means <strong>of</strong> evaluating impact <strong>of</strong> budget on achieving stated<br />
objects.<br />
MCDOT Maricopa County Department <strong>of</strong> Transportation - Plans, designs,<br />
constructs, and maintains roadways within the county’s unincorporated<br />
areas.<br />
MCT Mobile Computer Terminal – A mobile computer system that provides full<br />
system access through wireless mobile data terminals.<br />
Membrane Treatment<br />
Process<br />
Membrane technology utilizes a semipermeable membrane for the<br />
separation <strong>of</strong> suspended and dissolved solids from water.<br />
MGD Millions <strong>of</strong> Gallons per Day – MGD is a rate <strong>of</strong> flow <strong>of</strong> water equal to<br />
133,680.56 cubic feet per day, or 1.5472 cubic feet per second, or 3.0689<br />
acre-feet per day. A flow <strong>of</strong> one million gallons per day for one year equals<br />
1,120 acre-feet (365 million gallons).<br />
MHZ Megahertz - A measurement <strong>of</strong> transmission frequency, either over the<br />
airwaves or through a copper wire; also, a measurement <strong>of</strong> the clock speed<br />
on a computer. One megahertz is one million times a second.<br />
MPC Municipal Property Corporation - A non-pr<strong>of</strong>it corporation established for<br />
issuing debt to purchase municipal facilities and equipment that it leases to<br />
the city.<br />
243
MS4 Municipal Separate Storm Sewer System – A system <strong>of</strong> conveyances<br />
(including roads with drainage systems, municipal streets, catch basins,<br />
curbs, gutters, ditches, man-made channels, or storm drains). An MS4 is<br />
owned by a state, city, town, village, or other public entity that discharges to<br />
waters <strong>of</strong> the U.S., designed or used to collect or convey stormwater<br />
(including storm drains, pipes, ditches, etc.), not a combined sewer, and is<br />
not part <strong>of</strong> a publicly owned wastewater treatment plant.<br />
MWD Maricopa Water District - The district was formally organized in 1925, as a<br />
political subdivision, and latter an irrigation and water conservation district<br />
under Arizona state statutes was successfully completed in 1927. MWD is<br />
the only privately financed reclamation project <strong>of</strong> its kind and provides water<br />
and power to service an area <strong>of</strong> approximately 60 square miles.<br />
O&M Operation and Maintenance - The day-to-day operating and maintenance<br />
cost <strong>of</strong> a municipality including such things as personnel, gas, electric utility<br />
bills, telephone expense, reproduction costs, postage, and vehicle<br />
maintenance.<br />
Operating <strong>Budget</strong> A budget for the delivery <strong>of</strong> ongoing city services, to include expenditures<br />
such as personal services, contractual services, commodities, and<br />
operating capital items.<br />
OSHA Occupational Safety and Health Administration - OSHA is an agency <strong>of</strong> the<br />
United States Department <strong>of</strong> Labor. OSHA's mission is to "assure safe and<br />
healthful working conditions for working men and women by setting and<br />
enforcing standards and by providing training, outreach, education and<br />
assistance.<br />
P&R Parks and Recreation Development - The parks and recreation<br />
development fee fund was established to account for the inflow <strong>of</strong> parks<br />
and recreation development fees levied on new residential construction.<br />
Permanent Adjustment<br />
<strong>of</strong> Expenditure Base<br />
Any city or town can permanently adjust its State imposed expenditure<br />
limitation base if a majority <strong>of</strong> the qualified electors voting on the issue at a<br />
regular city/town election vote in favor <strong>of</strong> the adjustment. A base adjustment<br />
may be referred to the voters by an affirmative vote <strong>of</strong> two-thirds <strong>of</strong> the<br />
members <strong>of</strong> the city/town council, or qualified electors <strong>of</strong> the city/town may<br />
propose an adjustment through the initiative process.<br />
Performance Measures Measurable means <strong>of</strong> evaluating the effectiveness <strong>of</strong> an activity,<br />
department, or division in achieving its objectives, goals, or policy.<br />
PILOT Payment in Lieu <strong>of</strong> Taxes – The payments made to compensate a local<br />
government for some or all <strong>of</strong> the tax revenue that it loses because <strong>of</strong> the<br />
nature <strong>of</strong> the ownership or use <strong>of</strong> a particular piece <strong>of</strong> real property.<br />
PM Particulate Matter - The small, distinct solids suspended in a liquid or gas.<br />
PPE Personal Protective Equipment – PPE refers to protective clothing, helmets,<br />
goggles, or other garment designed to protect the wearer's body from injury<br />
by blunt impacts, electrical hazards, heat, chemicals, and infection, for jobrelated<br />
occupational safety and health purposes.<br />
244
Primary Property Tax A limited tax levy used for general government operations. State statute<br />
restricts the total levy to a 2% annual increase plus an increase for any new<br />
construction and / or annexation.<br />
Pro Tempore (Pro Tem)<br />
Judge<br />
A pro tempore judge is a judge who serves or expects to serve once or only<br />
sporadically on a part-time basis under a separate appointment for each<br />
period <strong>of</strong> service.<br />
Property Tax Rate The amount <strong>of</strong> tax levied for each $100 <strong>of</strong> assessed valuation.<br />
PW Public Works - The divisions <strong>of</strong> the Public Works Department funded by the<br />
general fund include: vehicle maintenance, facilities management,<br />
sustainability, engineering development, and storm water services. Other<br />
divisions and funds managed by the Public Works Department and detailed<br />
on separate pages include streets and transportation funded by the<br />
highway user revenue fund (HURF), transit funded by the transit fund, and<br />
water, wastewater, and sanitation.<br />
Reserves Money that has been set aside in the event <strong>of</strong> revenue shortfalls.<br />
Resources Total monies available for appropriation purposes to include revenues, fund<br />
balances, transfers, and other financing services (i.e. bond proceeds).<br />
Revenue Bond Bonds that are backed by revenues from a specific system (i.e. Water and<br />
Sewer Revenue Bonds are payable from water and sewer revenues).<br />
Revenue Resources achieved from taxes, user charges/fees, and other levels <strong>of</strong><br />
government.<br />
RFP Request for Proposal - A RFP is a formal invitation to a potential<br />
respondent to submit a proposal to provide a good or service to fulfill a<br />
need that the city has identified.<br />
ROW Right <strong>of</strong> Way - A general term denoting land, property, or interest therein,<br />
usually in a strip, acquired for or devoted to transportation purposes.<br />
RPTA Regional Public Transportation Authority - The Arizona Legislature passed<br />
a law enabling the citizens <strong>of</strong> Maricopa County to vote in 1985 on a sales<br />
tax increase to fund regional freeway improvements and to provide for the<br />
creation <strong>of</strong> the Regional Public Transportation Authority.<br />
SB 1598 Senate Bill 1598 –This is a “Regulatory Bill <strong>of</strong> Rights” that grants regulated<br />
private parties a series <strong>of</strong> rights in their dealings with cities, counties, and<br />
flood control districts. The bill imposes significant obligations on<br />
municipalities regarding applications for permits and licenses, as well as the<br />
protocol <strong>of</strong> compliance inspections.<br />
SCBA Self-Contained Breathing Apparatus - An atmosphere-supplying respirator<br />
for which the breathing air source is designed to be carried by the user.<br />
245
SPA Special Planning Area - Designated areas within a city <strong>of</strong> <strong>Surprise</strong> planning<br />
area designed to ensure that land resources are utilized efficiently and that<br />
the community’s long-term development needs are addressed. The goal <strong>of</strong><br />
each SPA is to ensure a balanced mix <strong>of</strong> land uses, adequate support<br />
resources, proper ratio <strong>of</strong> people to jobs, and an efficient and effective<br />
multi-modal transportation network. There are six SPAs in the city <strong>of</strong><br />
<strong>Surprise</strong>.<br />
SPD <strong>Surprise</strong> Police Department – The department, in partnership with the<br />
community, provides the delivery <strong>of</strong> progressive crime prevention and<br />
protection.<br />
Secondary Property Tax Voter approved tax levy that can only be used to retire general bonded debt<br />
obligations.<br />
Special Revenue Funds Used to record the receipt <strong>of</strong> funding from specific revenue sources (other<br />
than special assessments, trusts, or major capital projects) which are<br />
legally restricted to expenditure for specific purposes.<br />
SLID Streetlight Improvement District - Special taxing district established to pay<br />
the costs <strong>of</strong> electricity associated with streetlights within a specific subdivision.<br />
Tax rate is limited to a maximum <strong>of</strong> $1.20 per $100 <strong>of</strong> assessed<br />
value.<br />
SPM Street Preservation and Maintenance Program - Road preservation for all<br />
city streets including repair, crack sealing, fog seal with seal master, mill<br />
and overlay, and reconstruction.<br />
SR State Route - A broad highway designed for high-speed traffic.<br />
SWPPP Stormwater Pollution Prevention Plan - A plan that describes the strategies<br />
and steps that will be taken to prevent nonpoint source pollution<br />
discharging from a construction/industrial site into a municipal storm sewer<br />
system.<br />
Tax Levy The total amount to be raised by general property taxes for purposes<br />
specified in the Tax Levy ordinance.<br />
TE Traffic Engineering – The division is responsible for the operations <strong>of</strong> the<br />
intelligent transportation system, traffic signal service and maintenance,<br />
traffic signs and markings service and maintenance, and traffic engineering,<br />
planning, management, and control services.<br />
TTHM Total Trihalomethanes – Is the total concentration <strong>of</strong> the four chief<br />
constituents (chlor<strong>of</strong>orm, brom<strong>of</strong>orm, bromodichloromethane, and<br />
dibromochloromethane). Trihalomethanes are formed as a by-product<br />
predominantly when chlorine is used to disinfect water for drinking. They<br />
represent one group <strong>of</strong> chemicals generally referred to as disinfection byproducts.<br />
They result from the reaction <strong>of</strong> chlorine and/or bromine with<br />
organic matter present in the water being treated.<br />
Transfer An inter-fund transaction where one fund contributes resources to another<br />
fund where the resources are expended.<br />
Trust Fund Used to account for resources held by the city as a trustee for a private<br />
party such as volunteer firefighters’ pension boards.<br />
246
Turn key Supplied, installed, or purchased in a condition ready for immediate use,<br />
occupation, or operation.<br />
UASI Urban Areas Security Initiative - UASI provides funding support for targethardening<br />
activities to nonpr<strong>of</strong>it organizations that are at high risk <strong>of</strong><br />
terrorist attack and are located within one <strong>of</strong> the specific UASI-eligible<br />
Urban Areas.<br />
UCR Uniform Crime Reports – The UCR are <strong>of</strong>ficial data on crime in the United<br />
States, published by the Federal Bureau <strong>of</strong> Investigation. UCR is a a<br />
nationwide, cooperative statistical effort <strong>of</strong> nearly 18,000 city, university and<br />
college, county, state, tribal, and federal law enforcement agencies<br />
voluntarily reporting data on crimes brought to their attention.<br />
USTA United States Tennis Association – The USTA is the national governing<br />
body for the sport <strong>of</strong> tennis and the recognized leader in promoting and<br />
developing the sport’s growth on every level in the United States, from local<br />
communities to the crown jewel <strong>of</strong> the pr<strong>of</strong>essional game, the US Open.<br />
VFD Variable Frequency Drive - a type <strong>of</strong> adjustable-speed drive used in electromechanical<br />
drive systems to control alternating current motor speed and<br />
torque by varying motor input frequency and voltage.<br />
WRF Water Reclamation Facility – A facility that utilizes processes to separate,<br />
modify, remove, and destroy objectionable, hazardous, and pathogenic<br />
substances carried by wastewater in solution or suspension in order to<br />
render the water fit and safe for intended uses.<br />
WSF Water Supply Facility - A facility that provides a source <strong>of</strong> water for drinking,<br />
irrigation, commercial, and industrial uses in a quantity and quality that<br />
meets or exceeds standards.<br />
247
FUND<br />
1. General Fund<br />
2. Special Revenue Funds<br />
3. Debt Service Funds Available<br />
4. Less: Amounts for Future Debt<br />
Retirement<br />
5. Total Debt Service Funds<br />
6. Capital Projects Funds<br />
7. Fiduciary Fund<br />
8. Enterprise Funds Available<br />
9. Less: Amounts for Future Debt<br />
Retirement<br />
10. Total Enterprise Funds<br />
11. Internal Service Funds<br />
12. TOTAL ALL FUNDS<br />
7,220,500<br />
7,220,500<br />
22,255,400<br />
100,900<br />
29,807,900<br />
29,807,900<br />
13,942,000<br />
7,220,500<br />
7,220,500<br />
11,081,600<br />
18,000<br />
28,162,600<br />
28,162,600<br />
10,425,400<br />
CITY OF SURPRISE<br />
Summary Schedule <strong>of</strong> Estimated Revenues and Expenditures/Expenses<br />
Fiscal Year 2014<br />
ADOPTED<br />
FUND<br />
ESTIMATED<br />
REVENUES<br />
TOTAL<br />
BUDGETED ACTUAL BALANCE/<br />
OTHER THAN<br />
FINANCIAL BUDGETED<br />
EXPENDITURES/ EXPENDITURES/ NET PROPERTY TAX PROPERTY<br />
OTHER FINANCING<br />
INTERFUND TRANSFERS RESOURCES EXPENDITURES/<br />
EXPENSES* EXPENSES** POSITION*** REVENUES TAXES<br />
2014 2014<br />
AVAILABLE EXPENSES<br />
2013 2013 July 1, 2013** 2014<br />
Primary:<br />
2014 SOURCES IN 2014 2014<br />
$ 74,722,100 $ 73,998,600 $ $ 6,407,100<br />
Secondary:<br />
$ 75,992,800 $ $<br />
$ 5,772,300 $ 1,533,400 $ 86,638,800 $ 78,550,500<br />
22,596,900 9,512,200<br />
2,312,700 14,721,900<br />
17,034,600 18,260,900<br />
143,900<br />
143,900<br />
10,791,700<br />
33,092,000<br />
33,092,000<br />
11,604,000<br />
11,965,600<br />
11,965,600<br />
73,700<br />
73,700<br />
1,828,000<br />
14,302,800<br />
14,302,800<br />
12,035,800<br />
12,035,800<br />
8,963,700<br />
18,789,200<br />
18,789,200<br />
11,604,000<br />
11,898,100<br />
11,898,100<br />
52,858,800<br />
25,600<br />
28,022,500<br />
28,022,500<br />
15,349,600<br />
$ 170 170,645,700 645 700 $ 140 140,418,900 418 900 $ $ 88,719,800 719 800 $ 146 146,346,300 346 300 $ $ $ 17 17,737,900 737 900 $ 17 17,737,900 737 900 $ 155 155,066,100 066 100 $ 204 204,966,000 966 000<br />
EXPENDITURE LIMITATION COMPARISON 2013 2014<br />
1. <strong>Budget</strong>ed expenditures/expenses $ 170,645,700 $ 204,966,000<br />
2. Add/subtract: estimated net reconciling items (7,190,000)<br />
(7,190,000)<br />
3. <strong>Budget</strong>ed expenditures/expenses adjusted for reconciling items 163,455,700 197,776,000<br />
4. Less: estimated exclusions 12,100,000<br />
12,100,000<br />
5. Amount subject to the expenditure limitation $ 151,355,700 $ 185,676,000<br />
6. EEC or voter-approved alternative expenditure limitation $ 888,445,600 $ 912,481,200<br />
The city/town does not levy property taxes and does not have special assessment districts for which property taxes are levied. Therefore, Schedule B has been omitted.<br />
* Includes Expenditure/Expense Adjustments Approved in current year from Schedule E.<br />
** Includes actual amounts as <strong>of</strong> the date the proposed budget was prepared, adjusted for estimated activity for the remainder <strong>of</strong> the fiscal year.<br />
*** Amounts in this column represent Fund Balance/Net Position amounts except for amounts not in spendable form (e.g., prepaids and inventories) or legally or contractually required to be maintained intact<br />
(e.g., principal <strong>of</strong> a permanent fund).<br />
248<br />
SCHEDULE A
1.<br />
2.<br />
2013 2014<br />
$ 7,974,599 $ 8,285,245<br />
3. Property tax levy amounts<br />
A. Primary property taxes $ 6,290,000 $ 6,407,100<br />
B. Secondary property taxes 2,408,000 2,312,700<br />
C. Total property tax levy amounts $ 8,698,000 $ 8,719,800<br />
4. Property taxes collected*<br />
A. Primary property taxes<br />
(1) Current year's levy $ 6,147,100<br />
(2) Prior years’ levies 133,900<br />
(3) Total primary property taxes $ 6,281,000<br />
B. Secondary property taxes<br />
(1) Current year's levy $ 2,408,000<br />
(2) Prior years’ levies<br />
(3) Total secondary property taxes $ 2,408,000<br />
C. Total property taxes collected $ 8,689,000<br />
5. Property tax rates<br />
A. <strong>City</strong>/Town tax rate<br />
(1) Primary property tax rate<br />
(2) Secondary property tax rate<br />
0.7383 0.7784<br />
(3) Total city/town tax rate<br />
B. Special assessment district tax rates<br />
0.7383 0.7784<br />
Secondary property tax rates - As <strong>of</strong> the date the proposed budget was prepared, the<br />
*<br />
Maximum allowable primary property tax levy.<br />
A.R.S. §42-17051(A)<br />
city/town was operating<br />
CITY OF SURPRISE<br />
Tax Levy and Tax Rate Information<br />
Fiscal Year 2014<br />
Amount received from primary property taxation in<br />
the current year in excess <strong>of</strong> the sum <strong>of</strong> that year's<br />
maximum allowable primary property tax levy.<br />
A.R.S. §42-17102(A)(18)<br />
$<br />
106 special assessment districts for which secondary<br />
property taxes are levied. For information pertaining to these special assessment districts<br />
and their tax rates, please contact the city/town.<br />
Includes actual property taxes collected as <strong>of</strong> the date the proposed budget was prepared, plus<br />
estimated property tax collections for the remainder <strong>of</strong> the fiscal year.<br />
249<br />
SCHEDULE B
GENERAL FUND<br />
SOURCE OF REVENUES<br />
CITY OF SURPRISE<br />
Revenues Other Than Property Taxes<br />
Fiscal Year 2014<br />
ESTIMATED<br />
ACTUAL<br />
ESTIMATED<br />
REVENUES REVENUES* REVENUES<br />
2013 2013 2014<br />
Local taxes<br />
LOCLocal sales tax $ 32,295,000 $ 32,619,800 $ 33,301,500<br />
Be Bed tax 101,500 107,000 114,000<br />
Licenses and permits<br />
APSElectric Franchise Fee 2,179,800 2,230,800 2,186,500<br />
CA Cable Franchise Fee 1,085,200 990,400 990,400<br />
BU Business Licenses 657,000 662,000 680,000<br />
SO Natural Gas Franchise Fee 325,400 292,000 292,000<br />
CITWater Franchise Fee 357,600 465,200 490,600<br />
SANSanitation Hauler's License 43,600 38,900 40,000<br />
Intergovernmental<br />
STAState Shared Income Tax 12,003,000 12,003,000 13,111,000<br />
STAState Shared Sales Tax 9,826,800 9,671,700 10,154,400<br />
AU Vehicle License Tax 3,895,900 3,910,900 3,917,200<br />
STALTAF II 330,000<br />
Fines and foreits<br />
# Court 1,290,400 1,256,200 1,256,200<br />
Charges for services<br />
## Parks & Recreation 3,817,500 4,452,800 4,452,800<br />
## Fire 838,600 731,100 754,100<br />
# Police 679,600 655,200 655,200<br />
## Community Development 944,700 1,985,800 2,052,500<br />
All other 750,000 495,200 500,000<br />
LGIInterest Income 14,000<br />
## Public Works Fees 215,600 451,000 633,100<br />
## Facilities 303,200 385,700 397,300<br />
TRATransit Fees 28,300 50,000<br />
Total General Fund $ 71,968,700 $ 73,454,700 $ 75,992,800<br />
* Includes actual revenues recognized on the modified accrual or accrual basis as <strong>of</strong> the date the proposed budget was<br />
prepared, plus estimated revenues for the remainder <strong>of</strong> the fiscal year.<br />
250<br />
SCHEDULE C
SOURCE OF REVENUES<br />
SPECIAL REVENUE FUNDS<br />
CITY OF SURPRISE<br />
Revenues Other Than Property Taxes<br />
Fiscal Year 2014<br />
ESTIMATED<br />
ACTUAL<br />
ESTIMATED<br />
REVENUES REVENUES* REVENUES<br />
2013 2013 2014<br />
Highway User Revenue Fund<br />
StaState Shared $ 6,613,600 $ 6,522,800 $ 6,617,500<br />
ChCharges for Services/Other 11,400 11,400 11,600<br />
$ 6,625,000 $ 6,534,200 $ 6,629,100<br />
Employee Dep Scholarship<br />
ChCharges for Services/Other $ 1,300 $ 1,400 $ 1,400<br />
1,300 $ 1,400 $ 1,400<br />
Donations Fund<br />
ChCharges for Services/Other $ 1,900 $ 223,500 $ 210,100<br />
$ 1,900 $ 223,500 $ 210,100<br />
Municipal Court Enhancement<br />
ChCharges for Services/Other $ 106,900 $ 112,000 $ 113,000<br />
$ 106,900 $ 112,000 $ 113,000<br />
Neighborhood Revitalization<br />
ChCharges for Services/Other $ 699,000 $ 449,000 $ 670,000<br />
$ 699,000 $ 449,000 $ 670,000<br />
Tourism<br />
ChCharges for Services/Other $ 1,300 $ 1,800 $ 1,800<br />
LocLocal Sales Tax 162,600 172,000<br />
$ 1,300 $ 164,400 $ 173,800<br />
Unforeseen Grants<br />
ChCharges for Services/Other $ 13,709,200 $ $ 5,227,800<br />
$ 13,709,200 $ $ 5,227,800<br />
SPD RICO Fund<br />
ChCharges for Services/Other $ 2,800 $ 2,000 $ 360,000<br />
$ 2,800 $ 2,000 $ 360,000<br />
SPD Towing Fund<br />
ChCharges for Services/Other $ 34,600 $ 117,000 $ 117,000<br />
$ 34,600 $ 117,000 $ 117,000<br />
SP SPD DEA Fund<br />
ChCharges for Services/Other $ 1,100 $ 13,000 $ 120,000<br />
$ 1,100 $ 13,000 $ 120,000<br />
Municipal Court JCEF<br />
ChCharges for Services/Other $ 500 $ 22,500 $ 23,000<br />
$ 500 $ 22,500 $ 23,000<br />
Municipal Court MFTG<br />
ChCharges for Services/Other $ 31,200 $ 9,000 $ 8,900<br />
$ 31,200 $ 9,000 $ 8,900<br />
Municipal Court FARE<br />
ChCharges for Services/Other $ 9,100 $ 900 $ 4,400<br />
$ 9,100 $ 900 $ 4,400<br />
Net Premium Seating<br />
ChCharges for Services/Other $ $ 22,200 $ 25,500<br />
$ $ 22,200 $ 25,500<br />
Spring Training Ticket Surcharge<br />
ChCharges for Services/Other $ $ 100,600 $ 100,600<br />
$ $ 100,600 $ 100,600<br />
SB1398 Fines<br />
ChCharges for Services/Other $ $ 19,000 $ 17,000<br />
$ $ 19,000 $ 17,000<br />
251<br />
SCHEDULE C
CITY OF SURPRISE<br />
Revenues Other Than Property Taxes<br />
Fiscal Year 2014<br />
ESTIMATED<br />
ACTUAL<br />
ESTIMATED<br />
REVENUES REVENUES* REVENUES<br />
SOURCE OF REVENUES<br />
2013 2013 2014<br />
LTAF II<br />
StaState Shared $ $ 345,000 $ 350,000<br />
Proposition 400<br />
$ $ 345,000 $ 350,000<br />
ChCharges for Services/Other $ $ $ 19,600<br />
Wildland Fire<br />
$ $ $ 19,600<br />
ChCharges for Services/Other $ $ 100,000 $ 140,000<br />
HALO<br />
$ $ 100,000 $ 140,000<br />
ChCharges for Services/Other $ $ 125,000 $ 132,000<br />
Ambulance Contract<br />
$ $ 125,000 $ 132,000<br />
ChCharges for Services/Other $ $ $ 278,700<br />
$ $ $ 278,700<br />
Total Special Revenue Funds $ 21,223,900 $ 8,360,700 $ 14,721,900<br />
* Includes actual revenues recognized on the modified accrual or accrual basis as <strong>of</strong> the date the proposed budget was<br />
252<br />
SCHEDULE C
DEBT SERVICE FUNDS<br />
SOURCE OF REVENUES<br />
CITY OF SURPRISE<br />
Revenues Other Than Property Taxes<br />
Fiscal Year 2014<br />
ESTIMATED<br />
ACTUAL<br />
ESTIMATED<br />
REVENUES REVENUES* REVENUES<br />
2013 2013 2014<br />
GO2000-03 Government Debt Service Fund<br />
ChCharges for Services/Other $ 19,500 $ 48,800 $ 48,800<br />
$ 19,500 $ 48,800 $ 48,800<br />
PR2000-03 Proprietary Debt Service Fund<br />
ChCharges for Services/Other $ 8,500 $ 21,200 $ 21,200<br />
$ 8,500 $ 21,200 $ 21,200<br />
PRProp Reserve 2007<br />
ChCharges for Services/Other 30,500 73,700<br />
$ $ 30,500 $ 73,700<br />
ProProp Debt Service 2000-2003<br />
ChCharges for Services/Other 100 100<br />
$ $ 100 $ 100<br />
GOGov Debt Service 2000-2003<br />
ChCharges for Services/Other 100 100<br />
$ $ 100 $ 100<br />
Total Debt Service Funds $ 28,000 $ 100,700 $ 143,900<br />
FIDUCIARY FUNDS<br />
FIRFirefighters Pension Fund<br />
ChCharges for Services/Other $ 600 $ 300 $ 100<br />
$ 600 $ 300 $ 100<br />
Total Fiduciary Funds 600 $ 300 $ 100<br />
CAPITAL PROJECTS FUNDS<br />
General Capital Fund<br />
ChCharges for Services/Other $ 2,465,300 $ 163,800 $<br />
LocLocal Sales Tax 2,913,000 1,950,000<br />
$ 2,465,300 $ 3,076,800 $ 1,950,000<br />
TraTransportation Improvement Fund<br />
ChCharges for Services/Other $ 1,463,300 $ 46,500 $ 46,500<br />
LocLocal Sales Tax 1,981,400 2,838,400 2,181,800<br />
$ 3,444,700 $ 2,884,900 $ 2,228,300<br />
Vehicle Replacement Fund<br />
ChCharges for Services/Other $ 221,700 $ 3,806,100 $ 65,800<br />
$ 221,700 $ 3,806,100 $ 65,800<br />
GEGeneral Government Development Fund<br />
ChCharges for Services/Other $ 227,100 $ 559,300 $ 537,400<br />
$ 227,100 $ 559,300 $ 537,400<br />
RORoads <strong>of</strong> Regional Signficiance Development Fund<br />
ChCharges for Services/Other $ 11,600 $ 27,400 $ 27,400<br />
$ 11,600 $ 27,400 $ 27,400<br />
POPolice Development Fee Fund<br />
ChCharges for Services/Other $ 107,300 $ 278,800 $ 240,700<br />
$ 107,300 $ 278,800 $ 240,700<br />
PA Parks and Recreation Development Fee Fund<br />
ChCharges for Services/Other $ 220,700 $ 84,100 $ 533,600<br />
$ 220,700 $ 84,100 $ 533,600<br />
253<br />
SCHEDULE C
SOURCE OF REVENUES<br />
CITY OF SURPRISE<br />
Revenues Other Than Property Taxes<br />
Fiscal Year 2014<br />
ESTIMATED<br />
ACTUAL<br />
ESTIMATED<br />
REVENUES REVENUES* REVENUES<br />
2013 2013 2014<br />
FIRFire and EMS Development Fee Fund<br />
ChCharges for Services/Other $ 247,800 $ 737,100 $ 760,100<br />
$ 247,800 $ 737,100 $ 760,100<br />
LIBLibrary Development Fee Fund<br />
ChCharges for Services/Other $ 56,900 $ 116,900 $ 136,500<br />
$ 56,900 $ 116,900 $ 136,500<br />
PUPublic Works Development Fee Fund<br />
ChCharges for Services/Other $ 90,100 $ 260,400 $ 255,100<br />
$ 90,100 $ 260,400 $ 255,100<br />
SE Sewer Development Fee Fund<br />
ChCharges for Services/Other $ 1,051,800 $ 2,240,100 $ 2,356,100<br />
$ 1,051,800 $ 2,240,100 $ 2,356,100<br />
WAWater Development Fee Fund<br />
ChCharges for Services/Other $ 438,300 $ 1,022,300 $ 1,700,700<br />
$ 438,300 $ 1,022,300 $ 1,700,700<br />
Total Capital Projects Funds $ 8,583,300 $ 15,094,200 $ 10,791,700<br />
* Includes actual revenues recognized on the modified accrual or accrual basis as <strong>of</strong> the date the proposed budget was<br />
254<br />
SCHEDULE C
ENTERPRISE FUNDS<br />
SOURCE OF REVENUES<br />
CITY OF SURPRISE<br />
Revenues Other Than Property Taxes<br />
Fiscal Year 2014<br />
ESTIMATED<br />
ACTUAL<br />
ESTIMATED<br />
REVENUES REVENUES* REVENUES<br />
2013 2013 2014<br />
WAWater Fund<br />
ChCharges for Services/Other $ 9,942,300 $ 10,114,800 $ 10,087,000<br />
$ 9,942,300 $ 10,114,800 $ 10,087,000<br />
SE Wastewater Fund<br />
ChCharges for Services/Other $ 17,906,800 $ 15,953,900 $ 16,046,900<br />
$ 17,906,800 $ 15,953,900 $ 16,046,900<br />
SA Sanitation Fund<br />
ChCharges for Services/Other $ 6,835,800 $ 6,420,000 $ 6,958,100<br />
$ 6,835,800 $ 6,420,000 $ 6,958,100<br />
INTERNAL SERVICE FUNDS<br />
Total Enterprise Funds $ 34,684,900 $ 32,488,700 $ 33,092,000<br />
RISRisk Management Fund<br />
ChCharges for Services/Other $ 1,609,500 $ 1,632,300 $ 1,647,100<br />
$ 1,609,500 $ 1,632,300 $ 1,647,100<br />
EMEmployee Healthcare Fund<br />
ChCharges g for Services/Other $ 9,033,700 , , $ 9,541,000 , , $ 9,956,900 , ,<br />
$ 9,033,700 $ 9,541,000 $ 9,956,900<br />
Total Internal Service Funds $ 10,643,200 $ 11,173,300 $ 11,604,000<br />
TOTAL ALL FUNDS $ 147,132,600 $ 140,672,600 $ 146,346,400<br />
* Includes actual revenues recognized on the modified accrual or accrual basis as <strong>of</strong> the date the proposed budget was<br />
255<br />
SCHEDULE C
CITY OF SURPRISE<br />
Other Financing Sources/ and Interfund Transfers<br />
Fiscal Year 2014<br />
OTHER FINANCING INTERFUND TRANSFERS<br />
2014 2014<br />
FUND SOURCES IN <br />
GENERAL FUND<br />
2003 MPC Rental Payments $ $ $ $ 1,533,400<br />
Sanitation Hauler's License 24,000<br />
Franchise Fees 514,700<br />
Indirect Cost Allocation 4,682,900<br />
Payments in Lieu <strong>of</strong> Property Taxes 550,700<br />
Total General Fund<br />
DEBT SERVICE FUNDS<br />
$ $ $ 5,772,300 $ 1,533,400<br />
2000-03 Government Debt Service $ $ $ 3,361,300 $<br />
2000-03 Proprietary Debt Service 7,072,700<br />
2007 Debt Service 1,457,900<br />
Prop Reserve 2007 73,700<br />
Prop Debt Service 2007 73,700<br />
Total Debt Service Funds<br />
CAPITAL PROJECTS FUNDS<br />
$ $ $ 11,965,600 $ 73,700<br />
Police Development Fee $ $ $ $ 245,800<br />
Parks and Recreation Development Fee 794,200<br />
General Government Development Fee 666,500<br />
Fire and EMS Development Fee 121,500<br />
Total Capital Projects Funds<br />
ENTERPRISE FUNDS<br />
$ $ $ $ 1,828,000<br />
Water $ $ $ $ 1,598,400<br />
Wastewater 10,785,400<br />
Sanitation 1,919,000<br />
Total Enterprise Funds $ $ $ $ 14,302,800<br />
TOTAL ALL FUNDS $ $ $ 17,737,900 $ 17,737,900<br />
256<br />
SCHEDULE D
FUND/DEPARTMENT<br />
CITY OF SURPRISE<br />
Expenditures/Expenses by Fund<br />
Fiscal Year 2014<br />
ADOPTED<br />
BUDGETED<br />
EXPENDITURES/<br />
EXPENSES<br />
EXPENDITURE/<br />
EXPENSE<br />
ADJUSTMENTS<br />
APPROVED<br />
ACTUAL<br />
EXPENDITURES/<br />
EXPENSES*<br />
BUDGETED<br />
EXPENDITURES/<br />
EXPENSES<br />
2013 2013 2013 2014<br />
GENERAL FUND<br />
<strong>City</strong> Clerk $ 411,700 $ $ 409,500 $ 653,400<br />
<strong>City</strong> Court 1,886,500 1,838,200 1,928,600<br />
<strong>City</strong> Manager 1,815,900 1,707,500 2,010,600<br />
ComCommunity and Rec Services 12,564,800 14,552,100 14,520,300<br />
Community Development 5,890,500 (220,000) 6,209,500 6,258,100<br />
Finance 2,669,200 2,521,800 2,931,700<br />
Fire-Emergency Services 14,526,500 14,166,800 14,983,000<br />
General Operations 2,467,800<br />
Human Resources 1,567,300 1,627,800 1,631,000<br />
Information Services 3,880,300 3,922,100 4,095,600<br />
Legal 1,749,100 1,766,600 1,785,100<br />
Mayor & Council 409,700 428,300 557,200<br />
Police 19,004,800 19,382,500 19,965,400<br />
Public Works 5,808,000 5,465,900 6,160,500<br />
Contingency 70,000 220,000 1,070,000<br />
Total General Fund<br />
SPECIAL REVENUE FUNDS<br />
$ 74,722,100 $ $ 73,998,600 $ 78,550,500<br />
Employee Dep Scholarship Fund 23211 23211 23211<br />
General Operations $ 6,000 $ $ 6,000 $ 6,000<br />
Contingency 3,300 100<br />
Donations Fund 21214 21214 21214<br />
General Operations 14 14 14<br />
ComCommunity and Rec Services 800 14 14 108,800 14 267,300<br />
Fire-Emergency Services 14 14 100 14 15,000<br />
Police 14 14 11,000 14 14,300<br />
Contingency 363,500 334,400<br />
Municipal Court Enhancement 21215 21215 21215<br />
<strong>City</strong> Court<br />
Information Services<br />
100,000 15 15 85,000 15 109,000<br />
Contingency 351,100 382,800<br />
Neighborhood Revitalization 21216 21216 21216<br />
Comm Community nit De Development elopment<br />
Community Initiatives<br />
Contingency<br />
699 699,000 000 16 16 631 631,300 300 16 670 670,000 000<br />
Tourism 21218 21218 21218<br />
ComCommunity and Rec Services<br />
General Operations<br />
100,000 18 158,500 18<br />
Contingency 158,900 506,400<br />
Grants 21219 21219 21219<br />
ComCommunity and Rec Services 50,000 19 19 26,300 19 50,000<br />
Fire-Emergency Services 19 (30,500) 19 20,500 19<br />
Police 141,000 19 (82,200) 19 73,600 19 177,800<br />
PWPublic Works 132,900 19 19 132,900 19<br />
Contingency 13,385,300 275,500 5,000,000<br />
SPD RICO 21220 21220 21220<br />
Police 200,000 200,000 400,000<br />
Contingency 313,200 406,000<br />
SPD DEA 21221 21221 21221<br />
Police 150,000 116,000<br />
Contingency 230,900 38,400<br />
SPD Towing 21222 21222 21222<br />
Police 32,500 39,300 32,500<br />
Contingency 340,400 499,500<br />
Municipal Court JCEF 21223 21223 21223<br />
<strong>City</strong> Court (13,300) 13,300 53,300<br />
Contingency 95,800 13,300 77,300<br />
Municipal Court MFTG 21224 21224 21224<br />
<strong>City</strong> Court 31,000 31,000<br />
Contingency 28,600 20,200<br />
Municipal Court FARE 21225 21225 21225<br />
<strong>City</strong> Court 9,000<br />
Contingency 9,500 14,700<br />
Net Premium Seating 21226 21226 21226<br />
ComCommunity and Rec Services 10,400<br />
Contingency 67,000<br />
Spring Training Ticket Surcharge 21227 21227 21227<br />
ComCommunity and Rec Services (100,300)<br />
Contingency 301,500<br />
SB1398 Fines 21228 21228 21228<br />
Police<br />
Contingency<br />
(39,200) 12,800 40,100<br />
257<br />
SCHEDULE E
CITY OF SURPRISE<br />
Expenditures/Expenses by Fund<br />
Fiscal Year 2014<br />
ADOPTED<br />
BUDGETED<br />
EXPENDITURES/<br />
EXPENSES<br />
EXPENDITURE/<br />
EXPENSE<br />
ADJUSTMENTS<br />
APPROVED<br />
ACTUAL<br />
EXPENDITURES/<br />
EXPENSES*<br />
BUDGETED<br />
EXPENDITURES/<br />
EXPENSES<br />
FUND/DEPARTMENT<br />
2013 2013 2013 2014<br />
LTAFII 21229 21229 21229<br />
PWPublic Works<br />
Contingency<br />
350,000<br />
Proposition 400 21230 21230 21230<br />
PWPublic Works<br />
Contingency<br />
19,600<br />
Wildland Fire 21231 21231 21231<br />
Fire-Emergency Services<br />
Contingency<br />
100,000 140,000<br />
HALO 21232 21232 21232<br />
Fire-Emergency Services<br />
Contingency<br />
125,000 132,000<br />
Ambulance Contract 21233 21233 21233<br />
Fire-Emergency Services<br />
Contingency<br />
278,700<br />
Highway User Revenue Fund 21212 21212 21212<br />
PWPublic Works 5,790,900 12 12 5,822,200 12 5,966,000<br />
PWContingency 1,764,600 1,764,600<br />
Total Special Revenue Funds<br />
DEBT SERVICE FUNDS<br />
$ 22,573,600 $ 23,300 $ 9,512,200 $ 18,260,900<br />
2000-03 Government Debt Service Fund 31301 31301 31301<br />
General Operations $ 3,361,100 $ $ 3,361,100 $ 3,362,900<br />
2000-03 Proprietary Debt Service Fund 31303 31303 31303<br />
General Operations 2,401,700 2,401,700 7,076,700<br />
2007 Proprietary Debt Service Fund 31403 31403 31403<br />
General Operations 1,457,700 1,457,700 1,458,500<br />
Total Debt Service Funds<br />
CAPITAL PROJECTS FUNDS<br />
$ 7,220,500 $ $ 7,220,500 $ 11,898,100<br />
General Capital Fund 21112 21112 21112<br />
Community Development $ 1,100,000 $ $ $ 1,100,000<br />
<strong>City</strong> Manager 12 12 12 50,000<br />
ComCommunity and Rec Services 12 12 30,000 12 150,000<br />
Fire-Emergency Services 12 12 12 475,000<br />
Information Services 12 12 12 615,000<br />
Police 12 12 100 12 72,000<br />
Finance 12 12 12 500,000<br />
PWGeneral Operations 750,000 12 12 12<br />
PWPublic Works 4,406,400 12 12 538,200 12 3,156,100<br />
PWContingency 2,525,600<br />
Transportation Improvement Fund 21418 21418 21418<br />
PWCommunity Development 300,000 21 21 260,000 21 260,000<br />
PWPublic Works<br />
PWContingency<br />
4,145,100 21 21 2,124,300 21 5,042,000<br />
Vehicle Replacement Fund 21114 21114 21114<br />
General Operations<br />
PWPublic Works<br />
2,051,000 21 21 2,055,000 21 2,281,300<br />
Contingency 1,998,000<br />
Roads <strong>of</strong> Regional Significance SPA 2, 4, 6 21411 21411 21411<br />
Finance<br />
General Operations<br />
10,000 21 21 10,000 21 10,000<br />
Contingency 4,900 2,126,000<br />
Roads <strong>of</strong> Regional Significance SPA 3, 5 21411 21411 21411<br />
Finance 10,000 21 21 10,000 21 10,000<br />
Contingency 4,900 4,900<br />
General Government Development Fee 21412 21412 21412<br />
DeGeneral Operations 1,837,000 21 21 21<br />
Finance<br />
PWPublic Works<br />
20,000 21 20,000 20,000<br />
Contingency 8,500<br />
Police Development Fee 21413 21413 21413<br />
Police 21 21 21<br />
Finance 20,000 20,000 20,000<br />
Contingency 8,500 978,800<br />
Parks and Recreation Development Fee 21414 21414 21414<br />
Community and Rec Services 21 21 21<br />
Finance 20,000 20,000 20,000<br />
Contingency<br />
Public Works Development Fee<br />
8,500 3,554,000<br />
PWPublic Works 628,600 15 15 719,100 15 64,000<br />
PWFinance 20,000 15 21415 20,000 15 20,000<br />
PWContingency 8,500 9,734,700<br />
258<br />
SCHEDULE E
FUND/DEPARTMENT<br />
CITY OF SURPRISE<br />
Expenditures/Expenses by Fund<br />
Fiscal Year 2014<br />
ADOPTED<br />
BUDGETED<br />
EXPENDITURES/<br />
EXPENSES<br />
EXPENDITURE/<br />
EXPENSE<br />
ADJUSTMENTS<br />
APPROVED<br />
ACTUAL<br />
EXPENDITURES/<br />
EXPENSES*<br />
BUDGETED<br />
EXPENDITURES/<br />
EXPENSES<br />
2013 2013 2013 2014<br />
Fire & EMS Development Fee<br />
Fire-Emergency Services 292,600 16 16 16<br />
Finance 20,000 16 16 20,000 16 20,000<br />
General Operations 16 16 16<br />
Contingency 8,500<br />
Library Development Fee<br />
Community and Rec Services 17 17 17<br />
Finance 20,000 17 17 20,000 17 20,000<br />
Contingency 8,500 4,589,800<br />
Water Development Fee<br />
ComCommunity Development 450,000<br />
Finance 20,400 20,400 20,400<br />
PWPublic Works 1,190,500 1,394,500 2,403,000<br />
Contingency 9,000 2,199,000<br />
Water Replenishment Development Fee<br />
Finance 20,400 20,400 20,400<br />
PWPublic Works 1,400,000 105,000 3,364,100<br />
Contingency 9,000 923,300<br />
Sewer Development Fee<br />
Community Development 25,000<br />
Finance 20,400 20,400 20,400<br />
PWPublic Works 1,221,500 1,221,500 1,000,000<br />
Contingency 9,000 273,000<br />
Street Lights Improvement District<br />
Public Works 2,643,700 2,432,700 2,679,800<br />
Contingency 63,200<br />
Total Capital Projects Funds $ 22,255,400 $ $ 11,081,600 $ 52,858,800<br />
FIDUCIARY FUNDS<br />
Firefighters Pension Fund 23312 23312 23312<br />
Fire-Emergency Services $ $ $ 18,000 $ 18,000<br />
Contingency 100,900 7,600<br />
Total Fiduciary Funds<br />
ENTERPRISE FUNDS<br />
Water Fund<br />
$ 100,900 $ $ 18,000 $ 25,600<br />
Community Development $ 40,000 $ $ 40,000 $ 30,000<br />
Finance 77,600 28,100<br />
PWPublic Works 7,664,600 7,919,400 7,129,100<br />
Contingency<br />
Wastewater Fund<br />
1,161,000 1,087,100<br />
Community Development 10,000 220,000 251,000<br />
Finance 79,800 28,800<br />
PWPublic Works 13,869,300 64,500 15,134,400 11,275,600<br />
Contingency<br />
Sanitation<br />
1,333,000 (64,500) 1,318,900<br />
PWFinance 77,600 28,100<br />
PWPublic Works 4,703,000 4,763,800 6,136,400<br />
Contingency 792,000 794,400<br />
Total Enterprise Funds<br />
INTERNAL SERVICE FUNDS<br />
Risk Management Fund<br />
$ 29,807,900 $ $ 28,162,600 $ 28,022,500<br />
Community Development $ 15,100 $ $ 84,600 $<br />
Finance 307,100 386,100<br />
Human Resources 1,596,400 1,488,900 1,569,700<br />
Contingency<br />
Employee Healthcare Fund<br />
1,713,300 2,269,000<br />
Human Resources 8,645,000 8,465,800 9,012,600<br />
Contingency 1,665,100 2,498,300<br />
Total Internal Service Funds $ 13,942,000 $ $ 10,425,400 $ 15,349,600<br />
TOTAL ALL FUNDS $ 170,622,400 $ 23,300 $ 140,418,900 $ 204,966,000<br />
* Includes actual expenditures/expenses recognized on the modified accrual or accrual basis as <strong>of</strong> the date the proposed<br />
budget was prepared, plus estimated expenditures/expenses for the remainder <strong>of</strong> the fiscal year.<br />
259<br />
SCHEDULE E
CITY OF SURPRISE<br />
Expenditures/Expenses by Department<br />
Fiscal Year 2014<br />
ADOPTED<br />
BUDGETED<br />
EXPENDITURES/<br />
EXPENSES<br />
EXPENDITURE/<br />
EXPENSE<br />
ADJUSTMENTS<br />
APPROVED<br />
ACTUAL<br />
EXPENDITURES/<br />
EXPENSES*<br />
BUDGETED<br />
EXPENDITURES/<br />
EXPENSES<br />
DEPARTMENT/FUND<br />
Cit<strong>City</strong> Clerk<br />
2013 2013 2013 2014<br />
General Fund $ 411,700 $ $ 409,500 $ 653,400<br />
Department Total $ 411,700 $ $ 409,500 $ 653,400<br />
MaMayor & Council<br />
General Fund $ 409,700 $ $ 428,300 $ 557,200<br />
Department Total $ 409,700 $ $ 428,300 $ 557,200<br />
Cit<strong>City</strong> Court<br />
CitGeneral Fund $ 1,886,500 $ $ 1,838,200 $ 1,928,600<br />
CitMunicipal Court Enhancement 451,100 85,000 491,800<br />
CitMunicipal Court FARE 18,500 14,700<br />
CitMunicipal Court JCEF 95,800 13,300 130,600<br />
Municipal Court MFTG 59,600 31,000 20,200<br />
Department Total $ 2,511,500 $ $ 1,967,500 $ 2,585,900<br />
Cit<strong>City</strong> Manager<br />
CitGeneral Fund $ 1,885,900 $ $ 1,707,500 $ 2,080,600<br />
General Capital Fund 50,000<br />
Department Total $ 1,885,900 $ $ 1,707,500 $ 2,130,600<br />
Co Community Development<br />
Co General Fund $ 6,890,500 $ $ 6,209,500 $ 7,258,100<br />
Co General Capital Fund 1,100,000 1,100,000<br />
Co Neighborhood Revitalization 699,000 631,300 670,000<br />
Co Risk Management Fund 15,100 84,600<br />
Co Sewer Fund 10 10,000 000 220 220,000 000 251 251,000 000<br />
Co Sewer System Dev Fee Fund 25,000<br />
Co Transportation Improvement 300,000 260,000 260,000<br />
Co Water Fund 40,000 40,000 30,000<br />
Water System Dev Fee Fund 450,000<br />
Department Total $ 9,054,600 $ $ 7,445,400 $ 10,044,100<br />
FinFinance<br />
FinGeneral Fund $ 2,669,200 $ $ 2,521,800 $ 2,931,700<br />
FinFire & EMS Dev Fee Fund 28,500 20,000 20,000<br />
FinGeneral Capital Fund 500,000<br />
FinGeneral Govt Dev Fee Fund 28,500 20,000 20,000<br />
FinLibrary Dev Fee Fund 28,500 20,000 20,000<br />
FinParks & Recreation Dev Fee Fund 28,500 20,000 20,000<br />
FinPolice Dev Fee Fund 28,500 20,000 20,000<br />
FinPublic Works Dev Fee Fund 28,500 20,000 20,000<br />
FinRisk Management Fund 307,100 386,100<br />
FinRoads Of Regional Dev Fee Fund 29,800 20,000 20,000<br />
FinSanitation Fund 77,600 28,100<br />
FinSewer Fund 79,800 28,800<br />
FinSewer System Dev Fee Fund 29,400 20,400 20,400<br />
FinTransportation Improvement<br />
FinWater Fund 77,600 28,100<br />
Water System Dev Fee Fund 58,800 40,800 40,800<br />
Department Total $ 3,500,300 $ $ 3,194,100 $ 3,632,900<br />
260<br />
SCHEDULE F
Fir Fire<br />
Fir General Fund $ 14,526,500 $ $ 14,166,800 $ 14,983,000<br />
Fir Ambulance Contract 278,700<br />
Fir Donations Fund 1,500 100 15,000<br />
Fir Fire & EMS Dev Fee Fund 292,600<br />
Fir General Capital Fund 475,000<br />
Fir HALO 125,000 132,000<br />
Fir Unforeseen Grants (30,500) 20,500<br />
Fir Wildland Fire 100,000 140,000<br />
Firefighters Pension Fund 18,000 18,000<br />
Department Total $ 14,820,600 $ (30,500) $ 14,430,400 $ 16,041,700<br />
GeGeneral Operations<br />
GeGeneral Fund $ 1,467,800 $ $ $<br />
GeDonations Fund 170,800 334,400<br />
GeEmployee Dep Scholarship 9,300 6,000 6,100<br />
GeGeneral Capital Fund 750,000 2,525,600<br />
GeGov Debt Service 2000-2003 3,361,100 3,361,100 3,362,900<br />
GeProp Debt Service 2000-2003 1,457,700 1,457,700 1,458,500<br />
GeProp Debt Service 2007 2,401,700 2,401,700 7,076,700<br />
GeRoads Of Regional Dev Fee Fund 2,130,900<br />
GeTourism 158,900 506,400<br />
GeUnforeseen Grants 13,385,300 275,500 5,000,000<br />
GeVehicle Replacement Fund 2,051,000 2,055,000 2,281,300<br />
Firefighters Pension Fund 100,900 7,600<br />
General Govt Dev Fee Fund 1,837,000<br />
Department Total $ 27,151,500 $ 275,500 $ 9,281,500 $ 24,690,400<br />
HuHuman Resources<br />
HuGeneral Fund $ 1,567,300 $ $ 1,627,800 $ 1,631,000<br />
HuEmployee Healthcare Fund 10,310,100 8,465,800 11,510,900<br />
Risk Management Fund 3,309,700 1,488,900 3,838,700<br />
Department Total $ 15,187,100 $ $ 11,582,500 $ 16,980,600<br />
Inf Information Services<br />
Inf General Fund $ 3,880,300 $ $ 3,922,100 $ 4,095,600<br />
IInffGGeneral l CCapital it l Fund F d 615 615,000 000<br />
Department Total $ 3,880,300 $ $ 3,922,100 $ 4,710,600<br />
Le Legal<br />
General Fund $ 1,749,100 $ $ 1,766,600 $ 1,785,100<br />
Department Total $ 1,749,100 $ $ 1,766,600 $ 1,785,100<br />
CoCommunity and Recreation Services<br />
CoGeneral Fund $ 12,564,800 $ $ 14,552,100 $ 14,520,300<br />
CoDonations Fund 180,200 108,800 267,300<br />
CoGeneral Capital Fund 30,000 150,000<br />
CoLibrary Dev Fee Fund 4,589,800<br />
CoNet Premium Seating 77,400<br />
CoParks & Recreation Dev Fee Fund 3,554,000<br />
CoSpring Training Ticket Surcharge (100,300) 301,500<br />
CoTourism 100,000 158,500<br />
Unforeseen Grants 50,000 26,300 50,000<br />
Department Total $ 12,895,000 $ (100,300) $ 14,875,700 $ 23,510,300<br />
PoPolice<br />
PoGeneral Fund $ 19,004,800 $ $ 19,382,500 $ 19,965,400<br />
PoDonations Fund 11,800 11,000 14,300<br />
PoGeneral Capital Fund 100 72,000<br />
PoPolice Dev Fee Fund 978,800<br />
PoSB1398 Fines (39,200) 12,800 40,100<br />
PoSPD DEA Fund 230,900 150,000 154,400<br />
PoSPD RICO Fund 513,200 200,000 806,000<br />
PoSPD Towing Fund 372,900 39,300 532,000<br />
Unforeseen Grants 141,000 (82,200) 73,600 177,800<br />
Department Total $ 20,274,600 $ (121,400) $ 19,869,300 $ 22,740,800<br />
261<br />
SCHEDULE F
Public Works<br />
General Fund $ 5,808,000 $ $ 5,465,900 $ 6,160,500<br />
General Capital Fund 4,406,400 538,200 3,156,100<br />
Public Works Dev Fee Fund 628,600 719,100 9,798,700<br />
Transportation Improvement 4,145,100 2,124,300 5,042,000<br />
General Govt Dev Fee Fund<br />
Water System Dev Fee Fund 2,590,500 1,499,500 8,889,400<br />
Sanitation Fund 5,495,000 4,763,800 6,930,800<br />
Sewer Fund 15,202,300 15,134,400 12,594,500<br />
Sewer System Dev Fee Fund 1,221,500 1,221,500 1,273,000<br />
Highway User Revenue Fund 5,790,900 7,586,800 7,730,600<br />
Marley Park CFD<br />
Street Lighting Districts 2,643,700 2,432,700 2,743,000<br />
LTAF II 350,000<br />
Proposition 400 19,600<br />
Transit<br />
Unforeseen Grants 132,900 132,900<br />
Vehicle Replacement Fund 1,998,000<br />
Water Fund 8,825,600 7,919,400 8,216,200<br />
Department Total $ 56,890,500 $ $ 49,538,500 $ 74,902,400<br />
Total All Departments $ 170,622,400 $ 23,300 $ 140,418,900 $ 204,966,000<br />
* Includes actual expenditures/expenses recognized on the modified accrual or accrual basis as <strong>of</strong> the date the<br />
proposed budget was prepared, plus estimated expenditures/expenses for the remainder <strong>of</strong> the fiscal year.<br />
262<br />
SCHEDULE F
FUND<br />
CITY OF SURPRISE<br />
Full-Time Employees and Personnel Compensation<br />
Fiscal Year 2014<br />
Full-Time Employee Salaries<br />
Other Benefit<br />
Total Estimated<br />
Personnel<br />
Equivalent (FTE) and Hourly Costs Retirement Costs Healthcare Costs<br />
Costs<br />
Compensation<br />
2014 2014 2014 2014 2014 2014<br />
GENERAL FUND 610.3 $ 39,694,200 $ 5,420,800 $ 5,882,800 $ 3,321,000 = $ 54,318,800<br />
SPECIAL REVENUE FUNDS<br />
Neighborhood Revitalization 1.4 $ 220,000 $ $ $ = $ 220,000<br />
SPD Towing Fund 0.5 32,500 32,500<br />
Highway User Revenue Fund 39.0 1,955,400 225,700 436,300 253,500 2,870,900<br />
Unforeseen Grants 0.6 173,300 17,800 10,400 201,500<br />
HALO 132,000 132,000<br />
LTAF II 350,000 350,000<br />
Proposition 400 19,600 19,600<br />
Wildland Fire 100,000 14,700 4,100 118,800<br />
Ambulance Contract 185,100 185,100<br />
Total Special Revenue Funds 41.5 $ 3,167,900 $ 258,200 $ 436,300 $ 268,000 = $ 4,130,400<br />
FIDUCIARY FUNDS<br />
Firefighters Pension Fund 0 $ 18,000 $ $ $ = $ 18,000<br />
Total Debt Service Funds $ 18,000 $ $ $ = $ 18,000<br />
CAPITAL PROJECTS FUNDS<br />
Transportation Improvement 1.0 $ 88,900 $ 10,300 $ 14,300 $ 8,300 = $ 121,800<br />
Total Capital Projects Funds 1.0 $ 88,900 $ 10,300 $ 14,300 $ 8,300 = $ 121,800<br />
INTERNAL SERVICE FUNDS<br />
Employee Healthcare Fund 1.0 $ 67,500 $ 7,800 $ 14,300 $ 5,600 = $ 95,200<br />
Risk Management Fund 2.0 137,500 15,900 7,100 11,300 171,800<br />
Total Permanent Funds 3.0 $ 205,000 $ 23,700 $ 21,400 $ 16,900 = $ 267,000<br />
ENTERPRISE FUNDS<br />
Water Fund 25.0 $ 1,392,300 $ 160,600 $ 242,300 $ 140,200 = $ 1,935,400<br />
Se Wastewater Fund 36.2 1,977,300 228,300 329,900 201,200 2,736,700<br />
Sanitation Fund 31.0 1,420,200 163,900 318,300 176,100 2,078,500<br />
Total Enterprise Funds 92.2 $ 4,789,800 $ 552,800 $ 890,500 $ 517,500 = $ 6,750,600<br />
TOTAL ALL FUNDS 748.0 $ 47,963,800 $ 6,265,800 $ 7,245,300 $ 4,131,700 = $ 65,606,600<br />
263<br />
SCHEDULE G