
You also want an ePaper? Increase the reach of your titles
YUMPU automatically turns print PDFs into web optimized ePapers that Google loves.
Commodities<br />
Commodities: Daily<br />
China data for commodities marginally better<br />
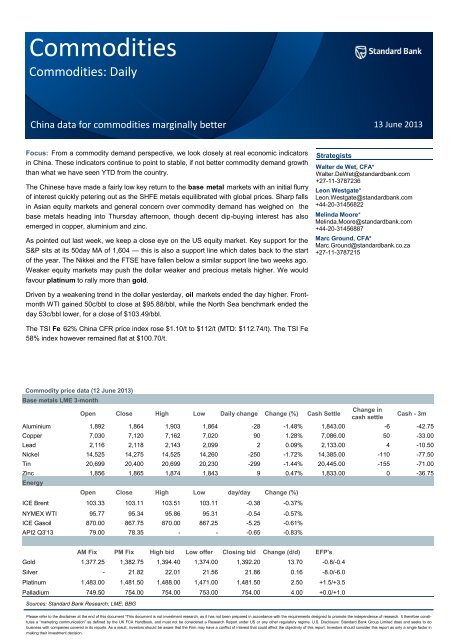
Focus: From a commodity demand perspective, we look closely at real economic indicators<br />
in China. These indicators continue to point to stable, if not better commodity demand growth<br />
than what we have seen YTD from the country.<br />
The Chinese have made a fairly low key return to the base metal markets with an initial flurry<br />
of interest quickly petering out as the SHFE metals equilibrated with global prices. Sharp falls<br />
in Asian equity markets and general concern over commodity demand has weighed on the<br />
base metals heading into Thursday afternoon, though decent dip-buying interest has also<br />
emerged in copper, aluminium and zinc.<br />
As pointed out last week, we keep a close eye on the US equity market. Key support for the<br />
S&P sits at its 50day MA of 1,604 — this is also a support line which dates back to the start<br />
of the year. The Nikkei and the FTSE have fallen below a similar support line two weeks ago.<br />
Weaker equity markets may push the dollar weaker and precious metals higher. We would<br />
favour platinum to rally more than gold.<br />
Driven by a weakening trend in the dollar yesterday, oil markets ended the day higher. Frontmonth<br />
WTI gained 50c/bbl to close at $95.88/bbl, while the North Sea benchmark ended the<br />
day 53c/bbl lower, for a close of $103.49/bbl.<br />
The TSI Fe 62% China CFR price index rose $1.10/t to $112/t (MTD: $112.74/t). The TSI Fe<br />
58% index however remained flat at $100.70/t.<br />
Commodity price data (12 June 2013)<br />
Base metals LME 3-month<br />
Sources: <strong>Standard</strong> <strong>Bank</strong> Research; LME; BBG<br />
Strategists<br />
Open Close High Low Daily change Change (%) Cash Settle<br />
13 June 2013<br />
Walter de Wet, CFA*<br />
Walter.DeWet@standardbank.com<br />
+27-11-3787236<br />
Change in<br />
cash settle<br />
Cash - 3m<br />
Aluminium 1,892 1,864 1,903 1,864 -28 -1.48% 1,843.00 -6 -42.75<br />
Copper 7,030 7,120 7,162 7,020 90 1.28% 7,086.00 50 -33.00<br />
Lead 2,116 2,118 2,143 2,099 2 0.09% 2,133.00 4 -10.50<br />
Nickel 14,525 14,275 14,525 14,260 -250 -1.72% 14,385.00 -110 -77.50<br />
Tin 20,699 20,400 20,699 20,230 -299 -1.44% 20,445.00 -155 -71.00<br />
Zinc 1,856 1,865 1,874 1,843 9 0.47% 1,833.00 0 -36.75<br />
Energy<br />
Open Close High Low day/day Change (%)<br />
ICE Brent 103.33 103.11 103.51 103.11 -0.38 -0.37%<br />
NYMEX WTI 95.77 95.34 95.86 95.31 -0.54 -0.57%<br />
ICE Gasoil 870.00 867.75 870.00 867.25 -5.25 -0.61%<br />
API2 Q3'13 79.00 78.35 - - -0.65 -0.83%<br />
AM Fix PM Fix High bid Low offer Closing bid Change (d/d) EFP's<br />
Gold 1,377.25 1,382.75 1,394.40 1,374.00 1,392.20 13.70 -0.8/-0.4<br />
Silver - 21.82 22.01 21.56 21.86 0.16 -8.0/-6.0<br />
Platinum 1,483.00 1,481.50 1,488.00 1,471.00 1,481.50 2.50 +1.5/+3.5<br />
Palladium 749.50 754.00 754.00 753.00 754.00 4.00 +0.0/+1.0<br />
Leon Westgate*<br />
Leon.Westgate@standardbank.com<br />
+44-20-31456822<br />
Melinda Moore*<br />
Melinda.Moore@standardbank.com<br />
+44-20-31456887<br />
Marc Ground, CFA*<br />
Marc.Ground@standardbank.co.za<br />
+27-11-3787215<br />
Please refer to the disclaimer at the end of this document *This document is not investment research, as it has not been prepared in accordance with the requirements designed to promote the independence of research. It therefore constitutes<br />
a ―marketing communication‖ as defined by the UK FCA Handbook, and must not be considered a Research Report under US or any other regulatory regime. U.S. Disclosure: <strong>Standard</strong> <strong>Bank</strong> Group Limited does and seeks to do<br />
business with companies covered in its reports. As a result, investors should be aware that the Firm may have a conflict of interest that could affect the objectivity of this report. Investors should consider this report as only a single factor in<br />
making their investment decision.
2<br />
Focus: China data for commodities marginally better<br />
From a commodity demand perspective, we look closely at<br />
real economic indicators in China. These indicators continue<br />
to point to stable, if not better commodity demand growth than<br />
what we have seen YTD from the country.<br />
In terms of the latest data, we look at electricity and cement<br />
production. We believe that for the second month running,<br />
China’s electricity production data paints a picture of real economic<br />
activity that is steady and improving, although not spectacular<br />
yet. The latest data shows electricity production in<br />
China rose a relatively strong 5.3% y/y in May, marginally<br />
lower than the 7.4% y/y in April. China’s electricity production<br />
YTD (i.e. January to May) also looks slightly better — it grew<br />
5.1% YTD y/y, compared to 4.8% YTD y/y in 2012. The current<br />
trend may be similar to Q4:12 where electricity data<br />
showed a continued improvement and economic growth also<br />
picked up.<br />
Other data in the Chinese economy also points perhaps to an<br />
improvement in economic activity which could attract stronger<br />
industrial demand for commodities. China’s cement production<br />
grew 9.3% y/y in May and 9.2% y/y in April. This is up from a<br />
weak 4.3% in March. Compared to last year, the cement production<br />
also looks good. Growth in May 2012 was 4.5% y/y<br />
and 5.9% y/y in April (see Figure 2).<br />
That said, we note that the data out of China is not yet consistent<br />
and strong enough to make a case for commodity prices<br />
to move rapidly, and sustainably higher. For example, China’s<br />
PMI data is still relatively weak, and so is data on rail freight<br />
volumes and even the Chinese leading economic indicator.<br />
But we believe that the latest data is still positive and encouraging<br />
in the light of commodity price action since March this<br />
year. As pointed out in our Commodities Daily dated 15 May<br />
2013, market expectations and commodity prices seem to<br />
have adjusted already to reflect slower growth from China. As<br />
a result, much of the downside may be reflected in prices already.<br />
Perhaps the price surprise for commodities in general<br />
lies marginally to the upside rather than the downside.<br />
Base metals<br />
Commodities<br />
China electricity production<br />
480<br />
400<br />
320<br />
240<br />
160<br />
Sources: <strong>Standard</strong> <strong>Bank</strong> Research; CNBS<br />
China cement production<br />
260<br />
210<br />
160<br />
110<br />
60<br />
Jan<br />
Jan<br />
kWh (bn)<br />
Feb<br />
Sources: <strong>Standard</strong> <strong>Bank</strong> Research; CNBS<br />
Mar<br />
Apr<br />
May<br />
Commodities Daily — 13 June 2013<br />
Jun<br />
2008 2009 2010<br />
2011 2012 2013<br />
mt (million)<br />
By Walter de Wet<br />
Feb<br />
Mar<br />
Apr<br />
May<br />
Jun<br />
2008 2009 2010<br />
2011 2012 2013<br />
The Chinese have made a fairly low key return to the base metal markets with an initial flurry of interest quickly petering out as<br />
the SHFE metals equilibrated with global prices. Sharp falls in Asian equity markets and general concern over commodity demand<br />
has weighed on the base metals heading into Thursday afternoon, though decent dip-buying interest has also emerged<br />
in copper, aluminium and zinc.<br />
The recent weakness in LME copper prices saw the SHFE-LME arbitrage window open overnight, yielding a $36/mt profit<br />
(basis a bonded premium of $145). Overall, SHFE copper prices opened lower then drifted sideways after an initial rally, with<br />
October-13 - currently the most active contract - ending the day just over 2% lower than Friday. SHFE copper open interest<br />
meanwhile climbed by around 5%. LME prices also staged an initial rally higher in response the SHFE activity before falling<br />
back towards $7,050 during the course of Thursday morning.<br />
Freeport finally announced force majeure on concentrate shipments from its Grasberg mine yesterday afternoon. As noted, the<br />
impact will be felt in the concentrates market first of all. It’s also worth noting however that the accident probe has been com-<br />
Jul<br />
Jul<br />
Aug<br />
Aug<br />
Sep<br />
Sep<br />
Oct<br />
Oct<br />
Nov<br />
Nov<br />
Dec<br />
Dec
Commodities Daily — 13 June 2013<br />
pleted, with the investigation team due to report to the Energy and Mineral Resources Minister either over the weekend or<br />
early next week. The report will include the cause of the accident and recommendations on how to avoid similar incidents in<br />
the future. Aside from taking the recommendations on board, union displeasure may also need to be addressed before operations<br />
can ramp back up.<br />
One side effect of nickel’s continued price weakness is that LME prices are nearly at a breakeven level to allow imports into<br />
China, with a temporary floor to LME prices perhaps forming just above $14,000/mt. How aggressive any Chinese buying may<br />
turn out to be is debateable however, providing a respite to nickel’s price collapse rather than a catalyst for a sustained recovery.<br />
Nickel prices in China are trading around the 100,000 CNY level, considered by some to offer key psychological support.<br />
Aluminium has continued to weaken, trading around $1,860 heading into US trade and back around its mid-May levels. The<br />
weakness has seen some consumer-related buying interest emerge around the lows, albeit opportunistic in nature. Although<br />
the buying interest provides some near-term support, it is not enough to help spark a sustained rally higher.<br />
Precious metals<br />
By Leon Westgate<br />
The metals remain range-bound, although technically they look weak. That said, a weaker US dollar is assisting in providing<br />
support to prices.<br />
As pointed out last week, we keep a close eye on the US equity market. Key support for the S&P sits at its 50day MA of 1,604<br />
— this is also a support line which dates back to the start of the year. The Nikkei and the FTSE have fallen below a similar<br />
support line two weeks ago. Weaker equity markets may push the dollar weaker and precious metals higher. We would favour<br />
platinum to rally more than gold.<br />
We maintain that silver remains vulnerable on the back of weak fundamentals. The metal is still trading below $22, which has<br />
provided good support in the past two months. Silver might rally a bit on short-covering, but rallies should fade.<br />
Gold support is at $1,375 and $1,366. Resistance is at $1,388 and $1,400. Silver support is at $21.52 and $21.23, resistance<br />
is at $22.00 and $22.32.<br />
Platinum support is at $1,450 and $1,445. Resistance is at $1,500 and $1,525. Palladium support is at $733 and resistance at<br />
$765.<br />
Energy<br />
By Walter de Wet<br />
Driven by a weakening trend in the dollar yesterday, oil markets ended the day higher. Front-month WTI gained 50c/bbl to<br />
close at $95.88/bbl, while the North Sea benchmark ended the day 53c/bbl lower, for a close of $103.49/bbl.<br />
For Brent, another point of support was the IEA’s forecast of lower North Sea output due to planned oilfield maintenance. The<br />
agency predicts that some 330kbd will be lost over May to September. For the global supply picture, in the same report the<br />
IEA estimated that OPEC output reached a seven-month high in May of 30.89mbd. This exceeds the 30mbd target ceiling<br />
reaffirmed at OPEC’s last meeting, perhaps leading some participants to think that the cartel might reign in some supply over<br />
the coming month. To our mind, within OPEC, the decision to cut back rests largely with Saudi Arabia, and given its stated<br />
comfort with current price levels we don’t feel that there would be much incentive for it to do so.<br />
DOE numbers started the market on a downward trend later in the day. Crude oil inventories grew 2.5m bbls, especially<br />
surprising for a market expecting a 1.5m bbl drawdown (according to Bloomberg consensus, although after the API reported<br />
9.0m bbls the actual market expectation was probably quite different from this). On the bright side for WTI, Cushing inventories<br />
dropped considerably, falling 0.8m bbls. Gasoline inventories climbed 2.7m bbls, and implied gasoline and crude oil demand<br />
both fell to 9.0mbd (from 9.1mbd) and 14.7mbd (from 15.5mbd) respectively.<br />
This underscores the point we made in yesterday’s Focus section of this report (see Commodities Daily dated 12 June 2013).<br />
With the apparent resilience of the US consumer and an easing of retail gasoline prices in the US (which reflect these high<br />
levels of gasoline inventory), we are now more confident that robust gasoline demand over the coming months could see a<br />
working down of both gasoline and ultimately crude oil inventories in the US. However, we do feel that market participants<br />
might still be overestimating this work down if they simply extrapolate recent trends.<br />
By Marc Ground<br />
Commodities<br />
3
4<br />
Bulks<br />
Commodities<br />
Commodities Daily — 13 June 2013<br />
China’s steel markets behaved rather benignly today, despite being the first day back after the holidays, with last weekend’s<br />
May key economic data releases (IP, FAI, CPI, trade) needing to be absorbed. Shanghai Equities were less sanguine, falling<br />
2.74% back below the 2200 level, to 2148, as the market began to realise what the steel industry has known since mid-May:<br />
that China is in the midst of a cyclical slowdown, particularly in urban areas, where housing completions and new starts are<br />
both falling. With GDP growth at 7.7% in Q1, China could be heading for a slower rate for Q2. Some brokers have begun<br />
further downgrading their forecasts. Beijing’s new leadership, under Xi and Li, are therefore already being given their first test:<br />
will they buckle and support the market slightly with further monetary/fiscal policy measures, or will they continue on their<br />
market reforms/market forces industry restructuring path? CPI rates appear to be giving them some wiggle-room for the<br />
former.<br />
Meanwhile, the PBOC didn’t conduct any cash-draining repurchase offers into the market today, with the 7-day Shanghai<br />
interbank rate remaining at the high rate of 6.38%, significantly above our 3.5% squeal factor for ore and steel inventory<br />
holders. A month ago, rates were at just 2.9%.<br />
Shanghai Rebar Futures closed up a paltry RMB1/t at 3422. Although a Yangang weekly spot billet tender closed RMB26/t<br />
lower w/w, spot billet prices fell only RMB10/t, having risen RMB20/t last weekend. However, rebar in Shanghai and Tianjin<br />
enjoyed post-holiday restocking momentum, rising RMB30-50/t.<br />
Among physical cargoes, BHPB sold a MAC fines Fe 60.5% cargo (21-30 laycan) via tender at $111.85/t, while the miner sold<br />
a similar cargo on CBMX for $111.98/t, injecting confidence into the post-holiday market. globalORE has seen a number of<br />
bids for June and July delivery enter its screens across the $105-110/t range, suggesting a level of mill interest is creeping<br />
back into the markets. An off-screen offer of prompt Newman Fe 62.7% fines is being offered at $114/t. Meanwhile tomorrow,<br />
RioT plans to conduct an Fe 61.4% PB fines cape cargo (27 June-6 July laycan) tender.<br />
The TSI Fe 62% China CFR price index rose $1.10/t to $112/t (MTD: $112.74/t). The TSI Fe 58% index however remained flat<br />
at $100.70/t.<br />
Among IO supply news, China is to scrap its import licensing system from 1 July, opening the industry to ―market forces‖, in a<br />
complete turnaround from CISA’s previous belief that controlling imports would somehow give mills greater control over<br />
pricing. In reality, only greater supplies relative to demand can improve pricing for end-users. We are seeing this begin to take<br />
hold now, given the increase in expansion tonnes from key seaborne supplies, particularly in Australia’s Pilbara region.<br />
Guinea no longer expects RioT to begin shipping in 2015 from Simandou, which the government estimates could cost as much<br />
as $20-25bln to develop. The country has decided to apply a 5% royalty rate to ore exports, although some refinements may<br />
be required to the formula adopted thus far. Meanwhile, RioT continues to negotiate the sale of its stake in IOC.<br />
Coking coal remains in the $136-140/t range, with negotiations yet to be completed with the Japanese, for Q3 contract volume<br />
prices. Q2 prices had been set at $172/t Qld fob; although mills have given considerable push back subsequently, with prices<br />
believed to be crossing below $150/t Qld fob already for certain contract volumes.<br />
For Q3:13 thermal coal prices, API 2 is trading at $77.30/t; API 4 is trading at $77.30/t; while Newcastle is trading at $81.30/t.<br />
By Melinda Moore
Commodities Daily — 13 June 2013<br />
Base metals<br />
Daily LME Stock Movement (mt)<br />
Metal Today Yesterday In Out<br />
Energy<br />
Precious metals<br />
Sources: <strong>Standard</strong> <strong>Bank</strong>; LME; Bloomberg<br />
One day<br />
change<br />
YTD change<br />
(mt)<br />
Cancelled<br />
warrants<br />
(mt)<br />
Cancelled<br />
warrants (%)<br />
Contract<br />
turnover<br />
Aluminium 5,214,150 5,198,425 23,550 7,825 15,725 - 2,073,175 39.76 256,373<br />
Copper 609,550 609,250 1,125 825 300 289,500 223,100 36.60 155,717<br />
Lead 200,325 202,550 300 2,525 -2,225 -120,000 144,325 72.05 70,845<br />
Nickel 183,720 182,814 1,050 144 906 43,812 24,384 13.27 61,007<br />
Tin 14,495 14,505 0 10 -10 1,670 3,595 24.80 6,780<br />
Zinc 1,096,250 1,100,450 1,550 5,750 -4,200 -124,500 703,225 64.15 110,214<br />
Shanghai 3-month forward prices COMEX active month future prices<br />
Metal Open Last 1d Change Open Close Change Change (%)<br />
Aluminium 14,625 14,755 -185 Ali Jul'13 - - - -<br />
Copper 51,850 52,050 -1,140 Cu Jul'13 323 322.45 -0.10 -0.03%<br />
Zinc 14,540 14,575 -225<br />
ZAR metal prices<br />
Aluminium Copper Lead Nickel Tin Zinc ZAR/USD fix<br />
Cash 18,458 70,966 21,362 144,066 204,757 18,357 10.0150<br />
3-month 18,920 72,268 21,498 144,891 207,060 18,930 10.1500<br />
Energy futures pricing Price Change Price Change Price Change Price Change Price Change<br />
1 month 2 month 3 month 6 month 1 year<br />
Sing Gasoil ($/bbbl) 118.50 1.26 118.08 2.04 117.45 1.99 117.25 1.73 115.63 -1.25<br />
Gasoil 0.1% Rdam ($/mt) 867.75 -5.25 869.00 -5.75 872.25 -5.25 873.75 -6.00 869.00 9.75<br />
NWE CIF jet ($/mt) 939.60 11.27 944.89 16.84 947.38 15.16 951.58 13.33 939.04 -8.92<br />
Singapore Kero ($/bbl) 116.64 1.19 117.46 2.07 117.50 2.08 117.63 1.76 116.89 1.34<br />
3.5% Rdam barges ($/mt) 581.77 3.48 579.25 5.35 576.90 4.89 571.09 4.22 564.81 2.72<br />
1% Fuel Oil FOB ($/mt) 608.62 1.57 608.44 2.42 608.15 3.33 603.42 3.34<br />
Sing FO180 Cargo ($/mt) 621.53 4.70 614.25 7.35 608.22 6.02 603.09 4.72<br />
Thermal coal Q3-13<br />
Q4-13 Q1-14 Cal 13 Cal 14<br />
API2 (CIF ARA) 78.35 -0.65 81.60 -0.40 84.65 -0.20 87.75 -0.25 93.50 -0.20<br />
API4 (FOB RBCT) 78.05 -0.65 79.75 -0.35 82.40 -0.10 84.95 -0.15 89.40 -0.20<br />
Forwards (%) 1 month 2 months 3 months 6 months 12 months<br />
Gold 0.14667 0.16167 0.17667 0.20833 0.24667<br />
Silver 0.62000 0.61600 0.61800 0.61200 0.56800<br />
USD Libor 0.19250 0.22976 0.27325 0.41376 0.68320<br />
Technical Indicators 30-day RSI 10-day MA 20-day MA 100-day MA 200-day MA Support Resistance<br />
Gold 42.50 1,394.21 1,390.16 1,521.32 1,618.82 1,384.27 1,394.63<br />
Silver 37.53 22.16 22.34 26.53 29.55 21.67 21.98<br />
Platinum 46.57 1,493.10 1,478.36 1,553.54 1,582.25 1,465.56 1,481.08<br />
Palladium 54.32 757.03 750.70 737.21 700.35 753.33 758.48<br />
Active Month Future COMEX GLD COMEX SLV NYMEX PAL NYMEX PLAT DGCX GLD TOCOM GLD CBOT GLD<br />
Aug'13 Jul’13 Jul'13 Jul'13 Aug'13 Apr'14 Aug'13<br />
Settlement 1,389.10 21.7600 756.10 1,482.30 1,388.00 4,238.00 1,392.00<br />
Open Interest 373,844 147,175 37,301 62,964 981 102,943 531<br />
Change in Open Interest -2,799 -301 -11 477 -74 595 0<br />
Commodities<br />
5
6<br />
Bulks<br />
Sources: <strong>Standard</strong> <strong>Bank</strong>; LME; Bloomberg<br />
Commodities<br />
Commodities Daily — 13 June 2013<br />
Percentage change<br />
Latest Price<br />
Steel—Physical 1-day 1-week 1-month 3-month 6-month 1-year<br />
Turkish Scrap 80:20 (Iskinderun CFR) $/t 322.12 - -4.45% -10.86% -18.01% -15.55% -15.05%<br />
China Tangshan Steel Billet $/t 473.00 - -0.63% -6.52% -8.16% -4.83% -17.31%<br />
China HRC export (Shanghai FOB) $/t 505.00 - -0.98% -6.83% -16.94% -8.68% -18.94%<br />
North Europe HRC domestic (ex-works) $/t 437.50 - -1.13% -4.89% -12.94% -3.85% -14.63%<br />
North America HRC domestic (Midwest FOB) $/t 581.60 - 1.99% -1.05% -3.90% -9.61% -7.68%<br />
Steel—Futures<br />
LME Billet Cash $/t 136.50 - -3.70% -9.00% -43.60% -53.49% -64.27%<br />
LME Billet Futures (1-mth) $/t 137.50 - -4.35% -8.33% -43.65% -53.23% -64.12%<br />
LME Steel Billet Stocks—change -130.00 - - - - - -<br />
Shanghai Rebar Futures (Active contract) $/t 526.78 - -0.08% -5.87% -9.59% -8.88% -17.42%<br />
Shanghai Rebar Futures O/W Stocks—change - - - - - - -<br />
SHFE Rebar - Open Interest 300 - - - - - -<br />
SHFE Rebar - Total Volume - - - - - - -<br />
China Steel Inventory (million tonnes) 17.00 - -2.67% -9.75% -17.62% 38.44% 7.20%<br />
Iron ore<br />
China Iron Ore Fines (62% Fe; CFR Tianjin) $/t 110.90 - -2.63% -14.30% -20.22% -12.26% -17.05%<br />
China Iron Ore Fines (58% Fe; CFR Tianjin) $/t 100.70 - -5.45% -14.66% -24.46% -13.19% -17.53%<br />
SGX AsiaClear IO Swaps 62% Fe $/t (1-mth) 112.50 - 1.35% -13.05% -19.68% -9.33% -15.73%<br />
SGX AsiaClear IO Swaps 62% Fe—Open interest 31,397 - - - - - -<br />
China Iron Ore Inventory (million tonnes) 71.59 - 1.23% 4.96% 8.04% -5.27% -24.75%<br />
Coking coal<br />
Premium Hard Coking Coal (Qld FOB) $/t 142.00 - - -5.33% -16.47% -12.35% -36.89%<br />
Capesize freight<br />
Tubarao Brazil-Beilun China (C3) 17.52 - 0.11% -0.79% -0.34% 2.16% 1.10%<br />
Pilbara Australia-Qingdao China (C5) 7.51 - 3.16% 2.04% 0.27% -0.92% 10.93%<br />
Saldanha South Africa-Beilun China 13.00 - - 2.36% 0.39% -1.89% -<br />
Tubarao Brazil to Rotterdam Europe 7.86 - 4.38% 2.88% 4.38% 3.97% 8.12%<br />
Saldanha South Africa-Rotterdam Europe - - - - - - -<br />
Financials pricing<br />
RMB Currency 6.1397 0.10% 0.06% -0.11% -1.20% -1.49% -3.60%<br />
China 7-day repo 6.3000 5.0% 16.7% 117.1% 123.4% 134.2% 133.3%<br />
Shanghai Equities Composite 2,142.8113 -3.08% -4.43% -4.42% -5.35% 3.95% -7.59%
Commodities Daily — 13 June 2013<br />
Disclaimer<br />
THIS COMMUNICATION MAY CONTAIN RESEARCH. SUCH RESEARCH IS A MARKETING COMMUNICATION:<br />
It is not investment research as it is not the result of financial analysis and has not been prepared in accordance with legal requirements designed<br />
to promote investment research independence.<br />
Additional information with respect to any security referred to herein may be made available on request. This material is for the general information<br />
of institutional and market professionals’ clients of <strong>Standard</strong> <strong>Bank</strong> Group (SBG) only. Recipients who are not market professionals or<br />
institutional investor customers of SBG should seek advice of their independent financial advisor prior to taking any investment decision based<br />
on this communication or for any necessary explanation of its content. It does not take into account the particular investment objectives, financial<br />
situation or needs of individual clients. Before acting on any advice or recommendations in this material, clients should consider whether it<br />
is suitable for their particular circumstances and, if necessary, seek professional advice. The information, tools and material presented in this<br />
marketing communication are provided to you for information purposes only and are not to be used or considered as an offer or the solicitation<br />
of an offer to sell or to buy or subscribe for securities or other financial instruments, nor shall it, or the fact of its distribution, form the basis of,<br />
or be relied upon in connection with, any contract relating to such action. This material is based on information that we consider reliable, but<br />
SBG does not warrant or represent (expressly or impliedly) that it is accurate, complete, not misleading or as to its fitness for the purpose intended<br />
and it should not be relied upon as such. The information and opinions contained in this document were produced by SBG as per the<br />
date stated and may be subject to change without prior notification Opinions expressed are our current opinions as of the date appearing on<br />
this material only. We endeavour to update the material in this report on a timely basis, but regulatory compliance or other reasons may prevent<br />
us from doing so.<br />
SBG or its employees may from time to time have long or short positions in securities, warrants, futures, options, derivatives or other financial<br />
instruments referred to in this material. Where SBG designates research material to be a ―marketing communication‖, that term is used in<br />
SBG’s Research Policy. This policy is available from the Research Compliance Office at SBG. SBG does and seeks to do business with companies<br />
covered in its research reports including Research Communications. As a result, investors should be aware that the Firm may have a<br />
conflict of interest that could affect the objectivity of this report. Investors should consider this report as only a single factor in making their<br />
investment decision.<br />
SBG has published a Conflicts of Interest Policy that is available upon request which describes the organisational and administrative arrangements<br />
for the prevention and avoidance of conflicts of interest. Further disclosures required under the FCA Conduct of Business Sourcebook<br />
and other regulatory bodies are available on request from the Research Compliance Department and or Global Conflicts Control Room,<br />
unless otherwise stated, share prices provided within this material are as at the close of business on the day prior to the date of the material.<br />
None of the material, nor its content, nor any copy of it, may be altered in any way, transmitted to, copied or distributed to any other party,<br />
without the prior express written permission of SBG. All trademarks, service marks and logos used in this report are trademarks or service<br />
marks or registered trademarks or service marks of SBG or its affiliates.<br />
SBG believes the information and opinions in the Disclosure Appendix of this report are accurate and complete. Information and opinions presented<br />
in the other sections of this communication were obtained or derived from sources SBG believes are reliable, but SBG makes no representations<br />
as to their accuracy or completeness. Additional information is available upon request. SBG accepts no liability for loss arising from<br />
the use of the material presented in this report, except that this exclusion of liability does not apply to the extent that liability arises under specific<br />
statutes or regulations applicable to SBG.<br />
The services, securities and investments discussed in this material may not be available to nor suitable for all investors. Investors should make<br />
their own investment decisions based upon their own financial objectives and financial resources and it should be noted that investment involves<br />
risk, including the risk of capital loss. Past performance is no guide to future performance. In relation to securities denominated in foreign<br />
currency, movements in exchange rates will have an effect on the value, either favourable or unfavourable. Some investments discussed<br />
in this marketing communication have a high level of volatility. High volatility investments may experience sudden and large falls in their value<br />
causing losses when that investment is realised. Those losses may equal your original investment. Indeed, in the case of some investments<br />
the potential losses may exceed the amount of initial investment, in such circumstances you may be required to pay more money to support<br />
those losses. Income yields from investments may fluctuate and, in consequence, initial capital paid to make them investment may be used as<br />
part of that income yield. Some investments may not be readily realisable and it may be difficult to sell or realize those investments, similarly it<br />
may prove difficult for you to obtain reliable information about the value, or risks, to which such an investment is exposed.<br />
This report is issued and distributed in Europe <strong>Standard</strong> <strong>Bank</strong> PLC. 20 Gresham Street, London EC2V 7JE which is regulated in the United<br />
Kingdom by Prudential Regulation Authority (―PRA‖). This report is being distributed in the United States by <strong>Standard</strong> New York Securities<br />
(USA) LLC; in Kenya by CfC Stanbic Financial Services Ltd; in Nigeria by Stanbic IBTC; in Angola by <strong>Standard</strong> <strong>Bank</strong> de Angola S.A.; in Brazil<br />
by Banco <strong>Standard</strong> de Investimentos S.A.; in China by <strong>Standard</strong> Resources (China) Limited; in Australia by <strong>Standard</strong> <strong>Bank</strong> Plc – Sydney<br />
branch; in Botswana by Stanbic <strong>Bank</strong> Botswana Limited; in Democratic Republic of Congo by Stanbic <strong>Bank</strong> Congo s.a.r.l.; in Ghana by Stanbic<br />
<strong>Bank</strong> Ghana Limited; in Iran by <strong>Standard</strong> <strong>Bank</strong> Plc – representative office; in Isle of Man by <strong>Standard</strong> <strong>Bank</strong> Isle of Man Limited; in Jersey<br />
by <strong>Standard</strong> <strong>Bank</strong> Jersey Limited; in Mexico by <strong>Standard</strong> <strong>Bank</strong> Plc – representative office; in Madagascar by Union Commercial <strong>Bank</strong> S.A.; in<br />
Mozambique by <strong>Standard</strong> <strong>Bank</strong> s.a.r.l.; in Malawi by <strong>Standard</strong> <strong>Bank</strong> Limited; in Namibia by <strong>Standard</strong> <strong>Bank</strong> Namibia Limited; in Mauritius by<br />
<strong>Standard</strong> <strong>Bank</strong> (Mauritius) Limited; in Peru by <strong>Standard</strong> <strong>Bank</strong> Plc – representative Office; in Taiwan by The <strong>Standard</strong> <strong>Bank</strong> of South Africa; in<br />
Tanzania by Stanbic <strong>Bank</strong> Tanzania Limited; in Singapore by <strong>Standard</strong> Merchant <strong>Bank</strong> (Asia) Limited; in Swaziland by <strong>Standard</strong> <strong>Bank</strong> Swazi-<br />
Commodities<br />
7
8<br />
Commodities<br />
Commodities Daily — 13 June 2013<br />
land Limited; in Zambia by Stanbic <strong>Bank</strong> Zambia Limited; in Zimbabwe by Stanbic <strong>Bank</strong> Zimbabwe Limited; in UAE by <strong>Standard</strong> <strong>Bank</strong> Plc –<br />
Dubai branch<br />
In jurisdictions where SBG is not already registered or licensed to trade in securities, transactions will only be effected in accordance with applicable<br />
securities legislation, which will vary from jurisdiction to jurisdiction and may require that the trade be made in accordance with applicable<br />
exemptions from registration or licensing requirements.<br />
<strong>Standard</strong> <strong>Bank</strong> Group Ltd Reg.No.1962/000738/06) is listed on the JSE Limited. It is an Authorised Financial Services Provider and it also<br />
regulated by the South African Reserve <strong>Bank</strong>.<br />
Copyright 2013 SBG. All rights reserved. This report or any portion hereof may not be reprinted, sold or redistributed without the written consent<br />
of <strong>Standard</strong> <strong>Bank</strong> Group Ltd.