Statistical Analysis of the CAPM I. Sharpe–Linter CAPM
Statistical Analysis of the CAPM I. Sharpe–Linter CAPM
Statistical Analysis of the CAPM I. Sharpe–Linter CAPM

You also want an ePaper? Increase the reach of your titles
YUMPU automatically turns print PDFs into web optimized ePapers that Google loves.
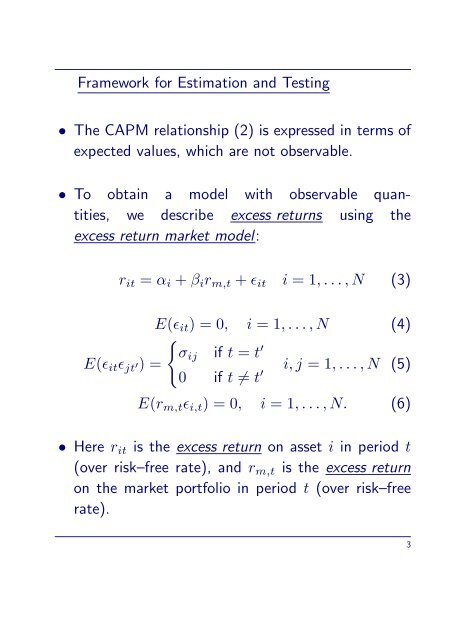
Framework for Estimation and Testing<br />
• The <strong>CAPM</strong> relationship (2) is expressed in terms <strong>of</strong><br />
expected values, which are not observable.<br />
• To obtain a model with observable quantities,<br />
we describe excess returns using <strong>the</strong><br />
excess return market model:<br />
rit = αi + βirm,t + ϵit i = 1, . . . , N (3)<br />
E(ϵit) = 0, i = 1, . . . , N (4)<br />
{<br />
σij if t = t<br />
E(ϵitϵjt ′) =<br />
′<br />
0 if t ̸= t ′<br />
i, j = 1, . . . , N (5)<br />
E(rm,tϵi,t) = 0, i = 1, . . . , N. (6)<br />
• Here rit is <strong>the</strong> excess return on asset i in period t<br />
(over risk–free rate), and rm,t is <strong>the</strong> excess return<br />
on <strong>the</strong> market portfolio in period t (over risk–free<br />
rate).<br />
3